Accepted for publication: F Torretti et al, J. Phys. B, in press (2018) DOI: 10.1088/1361-6455/aaa593
Short-wavelength out-of-band EUV emission from Sn laser-produced plasma
Abstract
We present the results of spectroscopic measurements in the extreme ultraviolet (EUV) regime (7–17 nm) of molten tin microdroplets illuminated by a high-intensity 3-J, 60-ns Nd:YAG laser pulse. The strong 13.5 nm emission from this laser-produced plasma is of relevance for next-generation nanolithography machines. Here, we focus on the shorter wavelength features between 7 and 12 nm which have so far remained poorly investigated despite their diagnostic relevance. Using flexible atomic code calculations and local thermodynamic equilibrium arguments, we show that the line features in this region of the spectrum can be explained by transitions from high-lying configurations within the Sn8+–Sn15+ ions. The dominant transitions for all ions but Sn8+ are found to be electric-dipole transitions towards the =4 ground state from the core-excited configuration in which a 4 electron is promoted to the 5 sub-shell. Our results resolve some long-standing spectroscopic issues and provide reliable charge state identification for Sn laser-produced plasma, which could be employed as a useful tool for diagnostic purposes.
Keywords: EUV spectroscopy, highly charged ions, laser-produced plasma
pacs:
31.15.ae, 32.30.Rj, 52.50.Dg, 52.70.LaI Introduction
Sn and its highly charged ions are of undoubtable technological importance, as these are the emitters of extreme ultraviolet (EUV) radiation around 13.5 nm used in nanolithographic applications Benschop et al. (2008); Banine et al. (2011). In such state-of-the-art lithography machines, EUV light is generated using pulsed, droplet-based, laser-produced plasma (LPP) Fomenkov et al. (2017); Kawasuji et al. (2017). Molten Sn microdroplets are illuminated by high-intensity (109–1012 W cm-2) laser pulses, generating typically high-density (1019–1021 electrons cm-3) plasma. In this plasma, laser light is converted efficiently into photons with wavelengths close to 13.5 nm. Technologically this is advantageous as it corresponds to the peak reflectivity of the mirrors composing the projection optics in nanolithography machines. These molybdenum-silicon multi-layer mirrors (MLMs) Bajt et al. (2002); Huang et al. (2017) are characterised by an “in-band”, 2-% reflectivity bandwidth centred around 13.5 nm, which conveniently overlaps with the strong EUV emission of Sn LPP. The relatively high conversion efficiency of laser into EUV light in this wavelength region is mainly due to the atomic structure of the highly charged Sn ions found in this laser-produced plasma.
The atomic transitions responsible for these EUV photons are 44–444 + 445 + 44, with =6–0 for Sn8+–Sn14+ O’Sullivan et al. (2015). These transitions are clustered in so-called unresolved transition arrays (UTAs) Bauche et al. (1988) as the close-lying large number of possible transitions arising from the complex open-4-subshell electronic structure renders them unresolvable in practical applications. Configuration-interaction between the excited states 444 and 44 causes a significant redistribution of oscillator strength towards the high-energy side of the transition arrays, which is referred to as “spectral narrowing” Bauche et al. (2015). A serendipitous level crossing involving the EUV-contributing excited configurations Windberger et al. (2015) furthermore fixes the average excitation energies of the excited states to the same value across a number of charge states.
The nature of the convoluted structure of these highly charged ions has been addressed in several theoretical and experimental investigations both directly in the EUV regime and in the optical regime where charge-state-resolved spectroscopy enables complementary investigations that challenge the direct EUV measurements Azarov and Joshi (1993); Svendsen and O’Sullivan (1994); Churilov and Ryabtsev (2006a, b, c); Ryabtsev et al. (2008); Tolstikhina et al. (2006); D’Arcy et al. (2009); Ohashi et al. (2010); Windberger et al. (2016); Colgan et al. (2017); Torretti et al. (2017).
In view of the application perspective, most of the work has so far been focused on the configurations responsible for emission around 13.5 nm. However, in dense and hot plasmas, a significant amount of energy can be radiated at shorter wavelengths arising from configurations that remain poorly investigated with, to the best of our knowledge, but a single study Svendsen and O’Sullivan (1994) dedicated to the corresponding transition arrays. This short-wavelength, “out-of-band” radiation could very well negatively affect the optics lifetime Huang et al. (2017); Mertens et al. (2004), whilst obviously hindering the conversion efficiency from laser energy to 13.5 nm photons.
In our experiments EUV spectra are obtained from plasma created by irradiating micrometer-sized molten Sn droplets with a pulsed Nd:YAG laser. We focus on the short-wavelength, high-energy features in the 7–12 nm region and provide a detailed study of their origins using the flexible atomic code (FAC) Gu (2008). Applying a simple local thermodynamic equilibrium (LTE) scaling argument, we show that the line features in the experimental spectrum can be well explained by electric dipole (1) transitions from high-lying configurations within the same tin charge states responsible for 13.5 nm radiation in EUV sources. We find that the dominant contribution in the short wavelength region actually comes from the core-excited configuration 445 where a 4 core electron is promoted to the 5 subshell. Our calculations excellently reproduce the line emission features observed experimentally, furthering the understanding of these emission features, and enabling the identification of individual contributions from various charge states Sn8+–Sn15+ which remain unresolvable in the 13.5 nm UTAs. Furthermore, using the Bauche-Arnoult UTA formalism Bauche et al. (1988, 2015); Bauche-Arnoult et al. (1984) as well as Gaussian fits to our results, we provide simplified outcome of our calculations which can be used to straightforwardly interpret Sn LPP spectra.
II Experiment
The experimental setup to generate droplets has been described in a previous publication Kurilovich et al. (2016), and only the details relevant to this article are presented in the following. Droplets of molten tin of 99.995 % purity are dispensed from a droplet generator operating at a 10.2-kHz repetition rate inside a vacuum vessel filled with a continuous flow of Ar buffer gas ( mbar). The droplets have a diameter of approximately 45 m. An injection-seeded, 10-Hz repetition rate, 3-J, 60-ns pulse length Nd:YAG laser operating at its fundamental wavelength =1064 nm is imaged to a circular flat-top beam spot (200 m at encircled energy) at the droplet position, producing an averaged intensity of W cm-2, close to industrially relevant conditions for obtaining high conversion efficiency George et al. (2007); Tanaka et al. (2005); Basko (2016). Using polarizing optics the laser energy can be set without modifying the beam spot. The linearly-polarised laser pulse is timed to hit the droplet, thus creating an EUV-emitting plasma. This emitted EUV radiation is coupled into a grazing-incidence spectrometer positioned at a 120° angle with respect to the laser light propagation direction (directly facing the laser-droplet interaction zone). Optical light and debris from the laser-produced plasma are blocked by a 200-nm-thick zirconium filter. In the spectrometer the EUV light is diffracted by a gold-coated concave grating (1.5 m radius of curvature, 1200 lines-per-mm) at an angle of incidence of 86° with respect to the grating normal. The 100-m entrance slit and the detector, a Greateyes back-illuminated charge coupled device (GE 2048 512 BI UV1) cooled to 0°C, are positioned on the circle determined by the radius of curvature of the grating, in a standard Rowland circle geometry. Wavelength calibration is performed after the measurements using an aluminium solid target positioned at the same location as the droplets and ablated by the Nd:YAG laser. Well-known Al3+ and Al4+ lines in the 10–16 nm range from the NIST atomic database Kramida et al. (2015) are used, obtaining a calibration function with a systematic one-standard-deviation uncertainty of 0.003 nm. The typical full-width at half-maximum of the features observed is approximately 0.06 nm at 13 nm wavelength.
During acquisition, the camera is exposed to about ten droplets irradiated by the Nd:YAG laser. This exposure is repeated multiple times to improve the statistics of the measurement, resulting in an averaged spectrum. The obtained spectrum is corrected for geometrical aberrations causing the spectra to move across the vertical, non-dispersive axis of the camera, as is known from the Al calibration spectra. Background counts are dominated by readout-noise and are subtracted before averaging over the non-dispersive axis. The contribution of second-order diffraction is obtained from the line emission in the Al calibration spectra, enabling the related correction. Further corrections are subsequently applied for the sensor quantum efficiency, as obtained from the manufacturer datasheets, and the Zr-filter transmission curve Henke et al. (1993). No correction curves could be obtained for the gold-coated grating. However, the behaviour in the 7–12 nm region can reasonably be expected to be rather constant Henke et al. (1993).
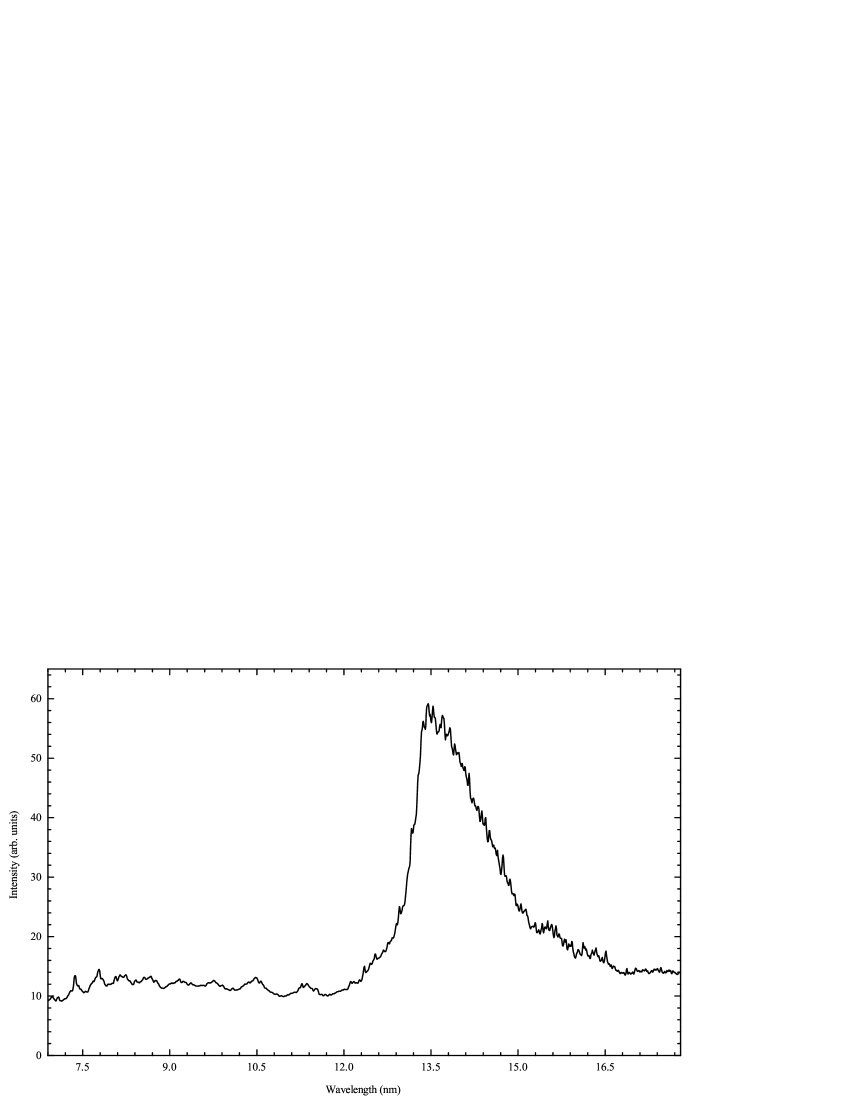
Figure 1 shows a thus obtained spectrum. The strongest feature is found near 13.5 nm wavelength as expected. The left shoulder of this UTA feature, starting its steep rise upward from about 13 nm with well-known contributions from Sn10+–Sn14+ Churilov and Ryabtsev (2006a, c); Ryabtsev et al. (2008) continuing to a peak at exactly 13.5 nm after which the feature decays more slowly as it moves over the contributions of the lower tin charge states Churilov and Ryabtsev (2006a, b) whilst also suffering opacity-related broadening Fujioka et al. (2005). This main feature appears to lie on top of an apparent continuum which extends over the full observed wavelength range. At the typical plasma conditions of this LPP, such continuum radiation is usually attributed to recombination processes O’Sullivan et al. (2009). Continuing our investigations to line features with wavelengths below 12 nm first requires new calculations since, as pointed out in the introduction, pertinent experimental data and calculations are sparsely available.
III Calculations
III.1 Atomic structure
For the interpretation of the short-wavelength side of the obtained experimental spectrum, we employ the flexible atomic code (FAC) Gu (2008). Specifically, we use it to investigate short-wavelength transitions in the 7–12 nm region in Sn8+–Sn15+. FAC performs relativistic atomic structure calculations including configuration-interaction. The atomic wavefunctions are calculated as linear combination of configuration state functions, which are determined from a local central potential obtained by solving self-consistently the Dirac equations. Relativistic effects are taken into account by the Dirac-Coulomb Hamiltonian. Radiative transition rates are calculated from the obtained wavefunctions in the single-multipole approximation. For more details, we refer to reference Gu (2008).
Calculations are performed including the following configurations for the open-4-shell ions Sn8+–Sn13+: the ground state [Kr]4, [Kr]44, [Kr]45, [Kr]46, [Ar]3444, [Ar]34445, [Ar]34446 (=6–1). This somewhat limited set of configurations is used since, in the chosen benchmark case of Sn8+, they give good agreement with both ab initio multi-configuration Dirac-Fock calculations performed by Svendsen and O’Sullivan Svendsen and O’Sullivan (1994) as well as with the current experimental observations. For the open-4-shell ions Sn14+ and Sn15+, the configuration sets used are [Ar]344, [Ar]3444, [Ar]3445, [Ar]34 46 (=4,5), which are found to give good agreement with measured features. Weighted transition rates (statistical weight of upper level times the transition probability from to ) are calculated for transitions from each excited state towards the ground state for all ions involved.
III.2 Emission properties
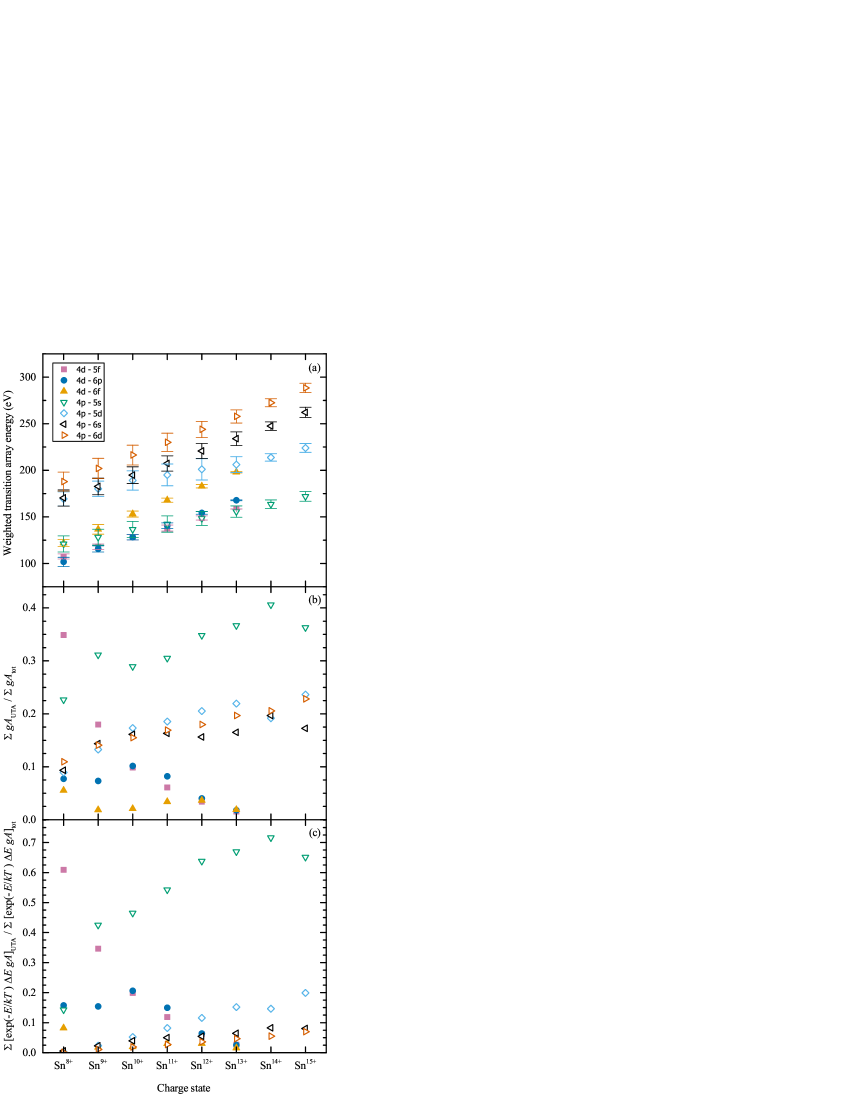
Our FAC calculations indicate that in the 7–12 nm (or approximately 110–180 eV) region the main transitions of interest (i.e. the strongest contributions to the radiative decay) are the following: 4–45 (from here on denoted as 4–5), 4–46 (4–6), 4–46 (4–6), 44–445 (4–5), 44–445 (4–5), 44–446 (4–6), 44–446 (4–6). These are all 1 single-electron excitations. In figure 2 the properties of these transition arrays are presented for the isonuclear sequence Sn8+–Sn15+. The weighted mean energies in figure 2(a) are calculated using as weights the transition rates (this is in accordance with the UTA formalism, see section V for a more thorough description). They are seen to scale quite regularly along the isonuclear sequence, increasing for higher ionic charge. There is no level crossing apparent, making these transition arrays a potential diagnostic tool to identify the contributions of different charge states in the spectra of Sn LPPs.
The weighted mean energies of the transition arrays towards the =4 ground state stemming from configurations with principal quantum number =6 are observed to scale more strongly with charge state compared to configurations having =5. This can be explained similarly to hydrogenic scaling of binding energy for different orbitals. In these systems, the binding energy scales with . The transition energy, i.e. the difference between the ground state and the excited state binding energies, will therefore have a stronger dependence on ionic charge for higher . Naturally, this exact scaling does not perfectly describe the one observed, as hydrogenic approximations are far too limited to be able to interpret complicated ionic systems with multiple valance electrons such as the highly charged Sn ions here considered.
For each ion figure 2(b) shows the relative contributions of the arrays using the sum of their UTA transition rates relative to the total for all the UTAs here investigated of that charge state. The transition array with the highest relative contribution is the 4–5 array with the sole exception of Sn8+, for which the largest contribution comes from the 4–5 array. Relatively large weighted transition rates are seen also for the other core-excited transitions 4–5, 4–6, and 4–6. In previous work Svendsen and O’Sullivan (1994) only the arrays 4–5 and 4–6 were taken into account to explain their experimental result. These configurations, according to our FAC calculations, are of significance primarily for the ions Sn8+–Sn11+ but cannot be expected to sufficiently explain the features even for these charge states. For all the ions investigated, using the weighted transition rates we show that the core-excited, open-4-shell configurations play a significant role in interpreting the high-energy out-of-band EUV emission of these Sn ions. We note that the energies of the associated configurations scale steeply with ionic charge. This means that we have to take into account the fact that the transition energies quickly move over the wavelength band studied in this work, as well as that the relative populations of the excited states need to be considered carefully.
III.3 LTE considerations
To obtain the actual expected emission characteristics in a plasma, weighted transition rates of the relevant UTAs alone are not sufficient, and the relative population of the excited states needs to be considered. A straightforward approach is provided by the local thermodynamic equilibrium (LTE) assumption, the conditions for which are expected to be well met in the extremely high-density plasma created by the Nd:YAG laser pulse Colombant and Tonon (1973) where collisional processes outpace the relevant atomic decay rates by orders of magnitude. In this case, the population of the excited states can be approximated by the related Maxwell-Boltzmann statistics. The intensity of a single transition between atomic states and can subsequently be expressed as Bauche et al. (2015)
| (1) |
where is the population of the excited state, is the transition energy, is the energy of the excited state and is the temperature associated with the emitter. From a preliminary comparison between calculations and the experimental spectrum, it becomes apparent that the wide wavelength range of the line emission is characterised by a very broad charge state distribution: in the spectrum, features belonging to Sn8+ through Sn15+ are tentatively observed. This broad distribution hints to the fact that the spectrum cannot be modelled by a single temperature, and that the different charge states exist in regions of the plasma where the temperature and density allow them to exist in the first place. Thus, in the following, the temperature in equation (1) is assumed to be the temperature at which the average charge state in the plasma is equal to the ion under consideration. The required relation between average charge state and temperature is determined from thermodynamic considerations of the equation of state of Sn in reference Basko et al. (2015), obtaining the following relationship:
| (2) |
As is shown in figure 2(c), once this scaling is applied, the 4–5 re-enforces its position as dominant contribution to the ions’ emitted radiation. The arrays 4–5 and 4–6 are relatively bright for the lower charge states Sn8+–Sn11+, whilst the core-excited transitions become more relevant for the higher charge states.
IV Comparison
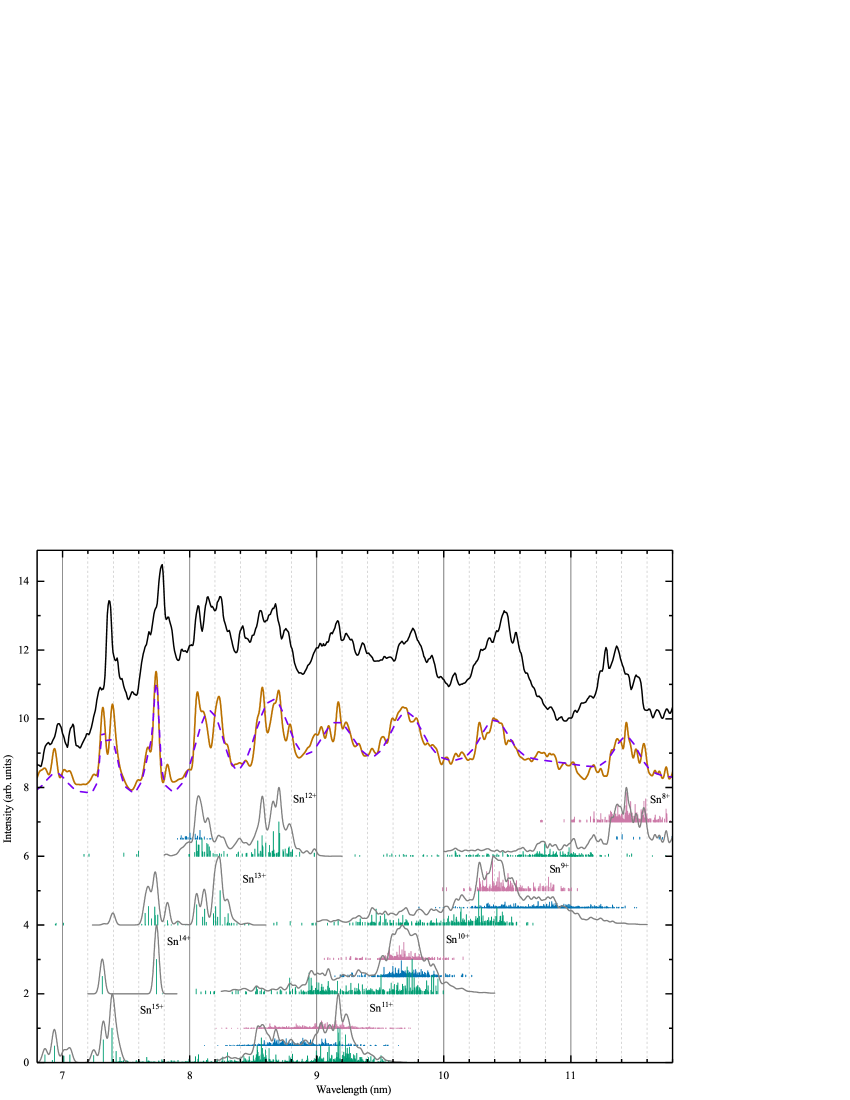
Figure 3 shows the comparison between resulting LTE-weighted FAC calculations and the experimental spectrum. The former contribution is broken down into its individual charge state constituents for which we show drop-line plots of the three largest contributing configurations in each case. Only the top 95% of the transition rates is shown for improved visibility. The envelopes shown, again per charge state, are the results of convolving the quantities for all contributing configurations, with a Gaussian function having width equal to the instrument resolution. The sum of all the normalised envelopes without any further weighting factors is shown as the solid trace (dark-orange) below the experimental spectrum. This trace is only arbitrarily scaled with a common, unity multiplication factor and shifted upwards using a constant offset for improved visibility without the use of any free fit-parameters. Nearly all sub-structures visible within the experimental spectrum can be linked to their theoretical counterparts. We note that this treatment treatment does not include opacity effects. This is justified by previous experimental and theoretical studies of tin plasmas Colgan et al. (2017); Fujioka et al. (2005), where it was shown that opacity does not play a significant role in the 7–12 nm region, quite unlike the case of the 12–15 nm region spanned by the UTAs relevant for the in-band emission. The agreement of our calculations with the experiment supports this statement.
Remarkably, our equivalent summation of the various normalised contributions reproduces the experimental spectrum quite well. This observation hints at a broad and relatively flat charge state distribution, which in part may be due to the time- and space-integrating nature of our measurement, thus averaging over large temperature and density gradients that are characteristic for these laser-produced plasmas Su et al. (2017). The detailed explanation of this observed feature is left for future work, as enabled by the here presented line identification. Minor wavelength shifts between calculated features and measurement are apparent, with an average absolute difference of 0.04 nm. Such a difference on the parts-per-thousand level is excellent considering the limited number of configurations used in our calculations, and surpasses the absolute accuracy obtained with FAC in complex ions where configuration interaction is prominent Kilbane and O’Sullivan (2010). We conclude that the line features in our final synthetic spectrum are in excellent agreement with the experimental spectrum, strongly supporting our identifications of both charge states and electronic configurations.
V UTA formalism
Having obtained an excellent replication of the experiment using our calculations, we will next employ the Bauche-Arnoult UTA formalism Bauche et al. (1988); Bauche-Arnoult et al. (1984); Bauche et al. (2015) to interpret our calculation results. The transition arrays presented in the previous sections are here characterised using the moments of their distribution Bauche et al. (1988, 2015). The th-order moment of the energy distribution of 1 transitions between configurations and is expressed as
| (3) |
where D is the electric dipole operator, H the Hamiltonian matrix, and denotes the atomic states belonging to configurations and , respectively. The moment can also be conveniently expressed in terms of transition energies and weighted transition rates White et al. (2005):
| (4) |
with the energy of the th 1 transition (between atomic states and ), the statistical weight of the transition upper level and the Einstein’s coefficient.
The first moment of the distribution, , is the 1-strength-weighted average energy of the transition array. The width of the transition array is represented by the standard deviation of the distribution, i.e. the square root of the variance:
| (5) |
Finally, the asymmetry of the distribution is described by the skewness Bauche-Arnoult et al. (1984):
| (6) |
These quantities are helpful in the statistical representation of the transition array using a single skewed Gaussian curve Bauche-Arnoult et al. (1984):
| (7) |
An example of the application of this representation is given in figure 4 for the three main transition arrays here studied of Sn10+. It illustrates well the huge simplification that is still able to capture the emission characteristics using but three parameters, which are listed for all studied transition arrays and for all investigated Sn ions in Table 1. The suitability of this approach in replicating the total ion emission, as shown in figure 4 by the solid grey and dotted orange curves, is discussed in the following section.
VI Spectral shape parameters
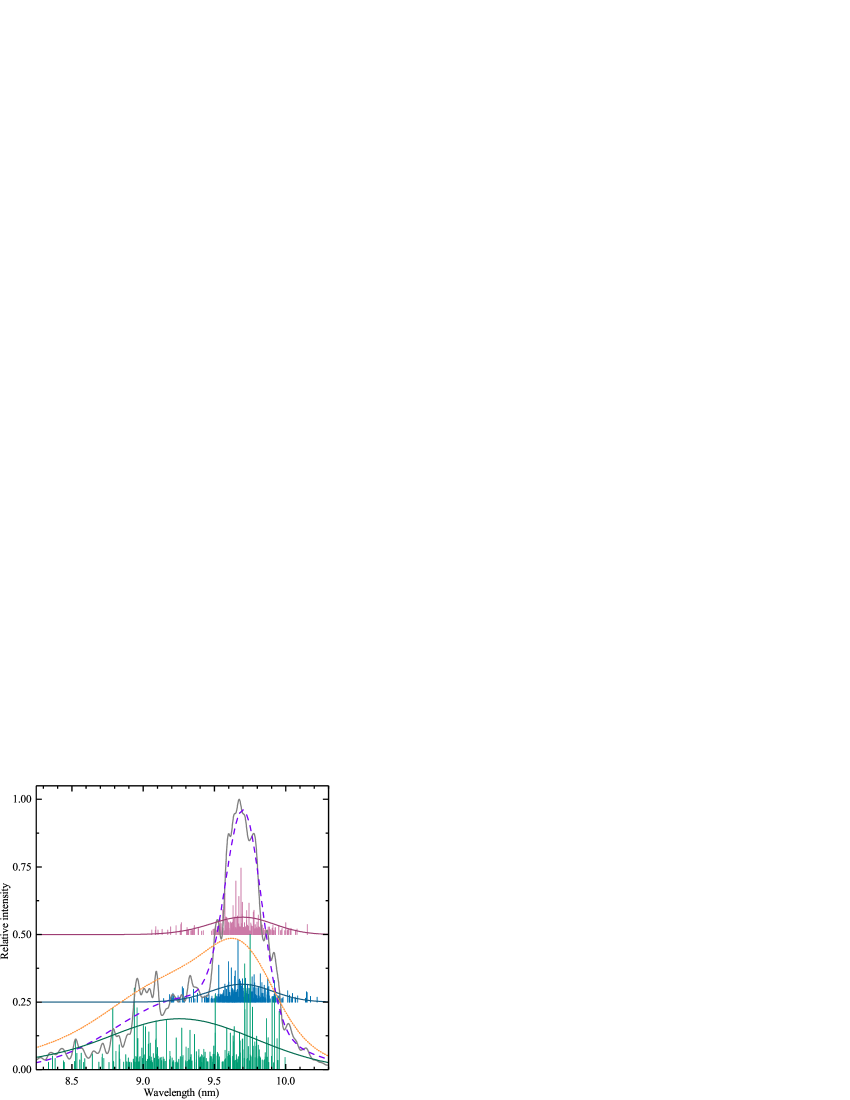
The statistical quantities in the UTA formalism are useful to present in a concise manner the result of our FAC calculations, thus providing information about the atomic physics aspects behind the emission of these Sn ions. Whilst these values could be used to interpret experimental data, it is necessary to take into account the relevant configuration arrays by scaling their relative contributions accordingly to our LTE arguments (see figure 2(c)). Even doing so, the UTA formalism would provide limited detail in the comparison with experimentally measured emission intensities as is illustrated in figure 4. We instead provide a more straightforward and more apt comparison which can be used to identify the individual contributions of the Sn8+–Sn15+ charge states. We use the LTE-weighted emission intensities obtained convolving all the investigated transition arrays, i.e. the Gaussian envelopes shown in figure 3. These envelopes can be conveniently described by fitting two Gaussian curves, obtaining the very good qualitative agreement shown in figure 4. The equation for these Gaussian fits reads
| (8) |
with being the wavelength, and =1,2. The list of coefficients , , is given in table 2. No simple scaling of these parameters with temperature is obtainable. Therefore, to extend this approach to arbitrary values, our calculations need to be re-evaluated starting from equation (1).
Despite their artificial meaning, these parameters can be very useful to easily diagnose the emission of Sn LPPs in this wavelength region. Whilst the substructure of the emission is lost the major features and characteristics are preserved, with much more detail and accuracy than in the skewed Gaussian representation using the UTA formalism. Figure 4 shows this aspect, with the skewed Gaussian curve overestimating the contribution in the short wavelength region, thus shifting the centre of mass of the emission to shorter wavelength. The data as provided is self-consistent, in the sense that the relative amplitudes of the Gaussian fits agree with the relative contribution to the spectrum of the different ions. Potentially, combining this tool with absolutely calibrated spectral measurement could yield valuable information regarding the relative charge state populations in the plasma, and the magnitude and nature of the radiation continuum underlying the atomic line emission. These aspects are topics of future investigations.
VII Conclusions
We present the results of spectroscopic measurements in the extreme ultraviolet regime of the emission of the plasma created from molten Sn droplets when irradiated by a high-energy pulse from a Nd:YAG laser at its fundamental wavelength. Using the flexible atomic code, electric dipole transition from excited configurations towards the ground states in the ions Sn8+–Sn15+ were investigated. Including a simple local thermodynamic equilibrium scaling for the relative populations of these excited states, we have shown that the most intense contribution to the radiation in the 7–12 nm region can be attributed to the radiative decay of the core excited configuration [Ar]34445 towards the ground state in the ions here studied. Moreover, the transition energies and rates from FAC calculations, scaled with LTE population, reproduce very well the unresolved transition arrays measured experimentally. The unresolved-transition-array formalism is subsequently used to present in a concise manner the result of our atomic structure calculations. Furthermore, spectral shape parameters of double Gaussian fits to the LTE-weighted emission spectra of each Sn ion are provided, enabling straightforward interpretation of our results. These parameters also provide simplified spectral information to interpret emission from industrial plasma EUV light sources which may facilitate their optimization. Our findings thus further the understanding of the atomic structure of Sn ions and their emissions in the context of laser-produced plasma and EUV sources.
Acknowledgements.
This work has been carried out at the Advanced Research Center for Nanolithography (ARCNL), a public-private partnership of the University of Amsterdam (UvA), the Vrije Universiteit Amsterdam (VU), the Netherlands Organisation for Scientific Research (NWO) and the semiconductor equipment manufacturer ASML. We would like to thank J.C. Berengut (University of New South Wales, Sydney) for the fruitful conversation during the early stages of the manuscript. We would also like to thank T.A. Cohen Stuart, R. Jaarsma, the AMOLF mechanical and design workshop, the software and electronics departments for technical support.| Sn8+ | Sn9+ | Sn10+ | ||||||||||||
| UTA | (eV) | (eV) | (eV) | (eV) | (eV) | (eV) | ||||||||
| 4–5 | 107.6 | 2.7 | -0.520 | 5034 | 118.0 | 2.9 | -0.214 | 5313 | 128.3 | 3.0 | 0.323 | 3247 | ||
| 4–6 | 101.7 | 4.9 | -0.576 | 3226 | 115.7 | 3.3 | 0.090 | 3366 | 128.2 | 2.9 | 0.209 | 2275 | ||
| 4–6 | 122.0 | 3.7 | 0.310 | 5614 | 136.6 | 5.2 | 0.091 | 5423 | 153.0 | 3.3 | -1.077 | 2672 | ||
| 4–5 | 121.0 | 8.6 | 0.779 | 4752 | 128.2 | 8.6 | 0.869 | 6304 | 136.6 | 8.6 | 0.746 | 3897 | ||
| 4–5 | 169.3 | 7.7 | -0.541 | 20806 | 180.2 | 8.2 | -0.530 | 28983 | 189.1 | 10.4 | -0.487 | 21257 | ||
| 4–6 | 170.3 | 8.7 | 0.741 | 6192 | 182.7 | 8.9 | 0.797 | 8288 | 194.8 | 8.9 | 1.018 | 5664 | ||
| 4–6 | 187.9 | 10.2 | 0.418 | 21424 | 202.0 | 10.9 | 0.449 | 29012 | 216.4 | 10.6 | 0.584 | 21331 | ||
| Sn11+ | Sn12+ | Sn13+ | ||||||||||||
| UTA | (eV) | (eV) | (eV) | (eV) | (eV) | (eV) | ||||||||
| 4–5 | 138.0 | 3.1 | 0.314 | 870 | 148.8 | 2.2 | -1.061 | 96 | 158.4 | 0.1 | 10.042 | 3 | ||
| 4–6 | 140.6 | 2.9 | -0.539 | 644 | 154.3 | 1.5 | -1.369 | 64 | 167.8 | 0.5 | 2.351 | 3 | ||
| 4–6 | 167.9 | 2.2 | -0.606 | 679 | 182.9 | 1.9 | -0.770 | 89 | 198.0 | 0.7 | 0.715 | 5 | ||
| 4–5 | 142.3 | 8.8 | 0.953 | 1620 | 148.4 | 7.5 | 1.371 | 377 | 155.7 | 6.0 | 1.315 | 37 | ||
| 4–5 | 195.0 | 11.7 | -0.025 | 8098 | 201.0 | 11.4 | 0.486 | 1546 | 206.2 | 8.5 | 1.373 | 132 | ||
| 4–6 | 207.3 | 8.3 | 1.170 | 2112 | 220.8 | 8.0 | 1.283 | 403 | 233.9 | 7.3 | 1.471 | 38 | ||
| 4–6 | 230.1 | 9.7 | 0.947 | 8126 | 243.8 | 8.7 | 1.299 | 1564 | 257.8 | 7.1 | 1.628 | 132 | ||
| Sn14+ | Sn15+ | |||||||||||||
| UTA | (eV) | (eV) | (eV) | (eV) | ||||||||||
| 4–5 | 163.6 | 4.5 | 0.541 | 3 | 172.0 | 5.2 | 0.678 | 14 | ||||||
| 4–5 | 213.8 | 4.0 | 1.037 | 7 | 224.0 | 4.7 | 0.790 | 39 | ||||||
| 4–6 | 247.5 | 4.6 | 0.715 | 3 | 262.2 | 5.4 | 0.744 | 14 | ||||||
| 4–6 | 272.5 | 4.3 | 0.932 | 7 | 288.4 | 5.1 | 0.750 | 40 | ||||||
| Ion | (eV) | (nm) | (nm) | (nm) | (nm) | |||
|---|---|---|---|---|---|---|---|---|
| Sn8+ | 17.8 | 0.115 | 11.438 | 0.748 | 0.247 | 11.438 | 0.094 | |
| Sn9+ | 21.7 | 0.346 | 10.400 | 0.105 | 0.244 | 10.400 | 0.560 | |
| Sn10+ | 25.9 | 0.267 | 9.321 | 0.496 | 0.763 | 9.705 | 0.127 | |
| Sn11+ | 30.3 | 1.000 | 9.155 | 0.136 | 0.641 | 8.647 | 0.158 | |
| Sn12+ | 35.1 | 0.700 | 8.100 | 0.086 | 0.775 | 8.650 | 0.127 | |
| Sn13+ | 40.1 | 0.408 | 7.709 | 0.052 | 0.426 | 8.210 | 0.085 | |
| Sn14+ | 45.3 | 0.123 | 7.313 | 0.019 | 0.244 | 7.740 | 0.019 | |
| Sn15+ | 50.9 | 0.234 | 6.950 | 0.078 | 0.628 | 7.380 | 0.055 |
References
References
- Benschop et al. (2008) J. Benschop, V. Banine, S. Lok, and E. Loopstra, J. Vac. Sci. Technol. B 26, 2204 (2008).
- Banine et al. (2011) V. Y. Banine, K. N. Koshelev, and G. H. P. M. Swinkels, J. Phys. D: Appl. Phys. 44, 253001 (2011).
- Fomenkov et al. (2017) I. Fomenkov, D. Brandt, A. Ershov, A. Schafgans, Y. Tao, G. Vaschenko, S. Rokitski, M. Kats, M. Vargas, M. Purvis, et al., Adv. Opt. Techn. 6, 173 (2017).
- Kawasuji et al. (2017) Y. Kawasuji, K. M. Nowak, T. Hori, T. Okamoto, H. Tanaka, Y. Watanabe, T. Abe, T. Kodama, Y. Shiraishi, H. Nakarai, et al., in SPIE Advanced Lithography, Vol. 10143 (International Society for Optics and Photonics, 2017) pp. 101432G–101432G.
- Bajt et al. (2002) S. Bajt, J. B. Alameda, T. W. Barbee, Jr., W. M. Clift, J. A. Folta, B. Kaufmann, and E. A. Spiller, Opt. Eng. 41, 1797 (2002).
- Huang et al. (2017) Q. Huang, V. Medvedev, R. van de Kruijs, A. Yakshin, E. Louis, and F. Bijkerk, Appl. Phys. Rev. 4, 011104 (2017).
- O’Sullivan et al. (2015) G. O’Sullivan, B. Li, R. D’Arcy, P. Dunne, P. Hayden, D. Kilbane, T. McCormack, H. Ohashi, F. O’Reilly, P. Sheridan, E. Sokell, C. Suzuki, and T. Higashiguchi, J. Phys. B: At. Mol. Opt. Phys. 48, 144025 (2015).
- Bauche et al. (1988) J. Bauche, C. Bauche-Arnoult, and M. Klapisch, Adv. Atom. Mol. Phys. 23, 131 (1988).
- Bauche et al. (2015) J. Bauche, C. Bauche-Arnoult, and O. Peyrusse, Atomic Properties in Hot Plasmas (Springer International Publishing, 2015).
- Windberger et al. (2015) A. Windberger, J. R. Crespo López-Urrutia, H. Bekker, N. S. Oreshkina, J. C. Berengut, V. Bock, A. Borschevsky, V. A. Dzuba, E. Eliav, Z. Harman, U. Kaldor, S. Kaul, U. I. Safronova, V. V. Flambaum, C. H. Keitel, P. O. Schmidt, J. Ullrich, and O. O. Versolato, Phys. Rev. Lett. 114, 150801 (2015).
- Azarov and Joshi (1993) V. I. Azarov and Y. N. Joshi, J. Phys. B: At. Mol. Opt. Phys. 26, 3495 (1993).
- Svendsen and O’Sullivan (1994) W. Svendsen and G. O’Sullivan, Phys. Rev. A 50, 3710 (1994).
- Churilov and Ryabtsev (2006a) S. S. Churilov and A. N. Ryabtsev, Phys. Scr. 73, 614 (2006a).
- Churilov and Ryabtsev (2006b) S. S. Churilov and A. N. Ryabtsev, Opt. Spectrosc. 100, 660 (2006b).
- Churilov and Ryabtsev (2006c) S. S. Churilov and A. N. Ryabtsev, Opt. Spectrosc. 101, 169 (2006c).
- Ryabtsev et al. (2008) A. N. Ryabtsev, É. Y. Kononov, and S. S. Churilov, Opt. Spectrosc. 105, 844 (2008).
- Tolstikhina et al. (2006) I. Y. Tolstikhina, S. S. Churilov, A. N. Ryabtsev, and K. N. Koshelev, in EUV sources for lithography, edited by V. Bakshi (SPIE Press, 2006) Chap. 4, pp. 113–148.
- D’Arcy et al. (2009) R. D’Arcy, H. Ohashi, S. Suda, H. Tanuma, S. Fujioka, H. Nishimura, K. Nishihara, C. Suzuki, T. Kato, F. Koike, J. White, and G. O’Sullivan, Phys. Rev. A 79, 042509 (2009).
- Ohashi et al. (2010) H. Ohashi, S. Suda, H. Tanuma, S. Fujioka, H. Nishimura, A. Sasaki, and K. Nishihara, J. Phys. B: At. Mol. Opt. Phys. 43, 065204 (2010).
- Windberger et al. (2016) A. Windberger, F. Torretti, A. Borschevsky, A. Ryabtsev, S. Dobrodey, H. Bekker, E. Eliav, U. Kaldor, W. Ubachs, R. Hoekstra, J. R. Crespo López-Urrutia, and O. O. Versolato, Phys. Rev. A 94, 012506 (2016).
- Colgan et al. (2017) J. Colgan, D. Kilcrease, J. Abdallah, M. Sherrill, C. Fontes, P. Hakel, and G. Armstrong, High Energy Density Phys. 23, 133 (2017).
- Torretti et al. (2017) F. Torretti, A. Windberger, A. Ryabtsev, S. Dobrodey, H. Bekker, W. Ubachs, R. Hoekstra, E. V. Kahl, J. C. Berengut, J. R. C. López-Urrutia, and O. O. Versolato, Phys. Rev. A 95, 042503 (2017).
- Mertens et al. (2004) B. Mertens, M. Weiss, H. Meiling, R. Klein, E. Louis, R. Kurt, M. Wedowski, H. Trenkler, B. Wolschrijn, R. Jansen, A. van de Runstraat, R. Moors, K. Spee, S. Plöger, and R. van de Kruijs, Microelectron. Eng. 73, 16 (2004).
- Gu (2008) M. F. Gu, Can. J. Phys. 86, 675 (2008).
- Bauche-Arnoult et al. (1984) C. Bauche-Arnoult, J. Bauche, and M. Klapisch, Phys. Rev. A 30, 3026 (1984).
- Kurilovich et al. (2016) D. Kurilovich, A. L. Klein, F. Torretti, A. Lassise, R. Hoekstra, W. Ubachs, H. Gelderblom, and O. O. Versolato, Phys. Rev. Appl. 6, 014018 (2016).
- George et al. (2007) S. A. George, W. T. Silfvast, K. Takenoshita, R. T. Bernath, C.-S. Koay, G. Shimkaveg, and M. C. Richardson, Opt. Lett. 32, 997 (2007).
- Tanaka et al. (2005) H. Tanaka, A. Matsumoto, K. Akinaga, A. Takahashi, and T. Okada, Appl. Phys. Lett. 87, 041503 (2005).
- Basko (2016) M. Basko, Phys. Plasmas 23, 083114 (2016).
- Kramida et al. (2015) A. Kramida, Yu. Ralchenko, J. Reader, and and NIST ASD Team, NIST Atomic Spectra Database (ver. 5.3), [Online]. Available: http://physics.nist.gov/asd [2016, February 2]. National Institute of Standards and Technology, Gaithersburg, MD. (2015).
- Henke et al. (1993) B. Henke, E. Gullikson, and J. Davis, At. Data. Nucl. Data Tables 54, 181 (1993).
- Fujioka et al. (2005) S. Fujioka, H. Nishimura, K. Nishihara, A. Sasaki, A. Sunahara, T. Okuno, N. Ueda, T. Ando, Y. Tao, Y. Shimada, K. Hashimoto, M. Yamaura, K. Shigemori, M. Nakai, K. Nagai, T. Norimatsu, T. Nishikawa, N. Miyanaga, Y. Izawa, and K. Mima, Phys. Rev. Lett. 95, 235004 (2005).
- O’Sullivan et al. (2009) G. O’Sullivan, A. Cummings, C. Dong, P. Dunne, P. Hayden, O. Morris, E. Sokell, F. O’Reilly, M. Su, and J. White, in J. Phys. Conf. Ser., Vol. 163 (IOP Publishing, 2009) p. 012003.
- Colombant and Tonon (1973) D. Colombant and G. Tonon, J. Appl. Phys. 44, 3524 (1973).
- Basko et al. (2015) M. M. Basko, V. G. Novikov, and A. S. Grushin, Phys. Plasmas 22, 053111 (2015).
- Su et al. (2017) M. Su, Q. Min, S. Cao, D. Sun, P. Hayden, G. O’Sullivan, and C. Dong, Sci. Rep. 7, 45212 (2017).
- Kilbane and O’Sullivan (2010) D. Kilbane and G. O’Sullivan, Phys. Rev. A 82, 062504 (2010).
- White et al. (2005) J. White, P. Hayden, P. Dunne, A. Cummings, N. Murphy, P. Sheridan, and G. O’Sullivan, J. Appl. Phys. 98, 113301 (2005).