Clustering of Local Group distances: publication bias or correlated measurements? V. Galactic rotation constants
Abstract
As part of on an extensive data mining effort, we have compiled a database of 162 Galactic rotation speed measurements at (the solar Galactocentric distance), . Published between 1927 and 2017 June, this represents the most comprehensive set of values since the 1985 meta analysis that led to the last revision of the International Astronomical Union’s recommended Galactic rotation constants. Although we do not find any compelling evidence of the presence of ‘publication bias’ in recent decades, we find clear differences among the values and the ratios resulting from the use of different tracer populations. Specifically, young tracers (including OB and supergiant stars, masers, Cepheid variables, Hii regions, and young open clusters), as well as kinematic measurements of Sgr A* near the Galactic Center, imply a significantly larger Galactic rotation speed at the solar circle and a higher ratio (i.e., km s-1 and km s-1 kpc-1; statistical uncertainties only) than any of the tracers dominating the Galaxy’s mass budget (i.e., field stars and the Hi/CO distributions). Using the latter as most representative of the bulk of the Galaxy’s matter distribution, we arrive at an updated set of Galactic rotation constants,
1 Galactic rotation constants
Calibration of the Galactic rotation curve is of crucial importance for a range of open questions in Galactic astrophysics. For instance, knowledge of the Galaxy’s speed of rotation at the solar circle, , allows derivation of the total mass of the Milky Way, including its dark matter component, provided that we accurately know the Sun’s Galactocentric distance, as well as the shape of the rotation curve. The latter would help us decompose the Milky Way’s mass contributions into disk, bulge, and dark or visible halo components (e.g., Sofue et al. 2009; Xin & Zheng 2013) and constrain the local dark matter density (e.g., Salucci et al. 2010; Weber & de Boer 2010). In addition, access to an accurate Galactic rotation curve is a fundamental stepping stone for Galactic distance determinations based on tracer populations using radio observations (e.g., Reid et al. 2014; Reid & Dame 2016).
As a result, numerous studies have aimed at deriving the Galaxy’s rotation speed, either at the Sun’s Galactocentric distance or as a function of distance from the Galactic Center. Surprisingly, perhaps, few comprehensive meta analyses have been undertaken to explore intrinsic biases or systematic differences among values resulting from different tracer populations or from a range of underlying assumptions. This is what we set out to do here.
In a series of recent papers (de Grijs et al. 2014; de Grijs & Bono 2014, 2015, 2016; henceforth Papers I–IV), we explored whether a number of key distances in the Local Group may have been subject to publication bias, i.e., the so-called ‘bandwagon effect’ where new results are only published if they are at least somewhat consistent with previously published values. In Paper IV, we added to our previous analyses of the distance to the Magellanic Clouds (Papers I and III) and the M31 group (Paper II) by carefully assessing the distance to the Galactic Center. We concluded that the body of estimates available in the literature was not obviously skewed by publication bias, and we derived a statistically well-justified value of (systematic) kpc. We will hence use kpc throughout the present paper as our reference value.
In Paper IV, we also undertook a preliminary analysis of the behavior of the ratio as a function of publication date based on a limited parameter set drawn from the literature we had perused to compile our database of values. Given the prevailing uncertainties affecting measurements, and in particular those dominating the (more uncertain) values, the ratio is usually much better determined than the individual measurements contributing to it. Our preliminary analysis of the ratio as a function of publication date led us to conclude that between 1990 and 2007 the trend, if any, remained almost flat, with km s-1 kpc-1, while it may since have increased, reaching kms-1 kpc-1 (2013–2015). We consequently concluded that our recommended value thus implied that should be substantially revised upward.
In this paper, we go significantly beyond that initial exploration by compiling the most comprehensive catalog of published values available to date. We will clearly show that our conclusion from Paper IV is only strictly valid for young tracer populations, with a less obvious need for a significantly increased value for implied by the Galaxy’s main mass components. In Section 2 we outline our approach to compiling our database of Galactic rotation constants and discuss the catalog’s overall properties. In Section 3 we consider subsamples selected on the basis of the tracers used to derive and explore their differences. Section 4 provides a holistic overview of the statistical differences uncovered in the paper, concluding with our main recommendation as regards the statistically most appropriate values for the prevailing Galactic rotation constants.
2 Data mining the literature

Despite its importance as a means to determine the mass of the Milky Way as a whole, few meta analyses of the Galactic rotation speed, at the solar circle or otherwise—or of the better-determined ratio of the rotation speed and the associated Galactocentric distance—have been published. Perhaps the first comprehensive review of the literature on this matter was provided by Kerr & Lynden-Bell (1986). This latter manuscript contains a summary of the deliberations that led to the 1985 revision of the International Astronomical Union’s (IAU) recommended values for the Galactocentric distance, kpc, and the Galactic rotation speed at the solar circle, km s-1, values that are still used for reference today. The only more recent reviews of the Galactic rotation speed were published by Sofue (2016) and Bland-Hawthorn & Gerhard (2016).111Clearly, most authors who derived new values of the relevant rotation constants compared their results with previously published determinations, but comprehensive reviews have been largely lacking since Kerr & Lynden-Bell (1986); Bland-Hawthorn & Gerhard (2016) do not consider any trends with publication date.
We thus set out with a blank slate, and with the aim to uncover as many determinations of , the solar circular velocity (which includes a component in the direction of Galactic rotation that must be corrected for to determine ) and the Oort constants (on its own) and/or and . We followed a similar approach as that used in Papers I–IV. First, we searched the NASA/Astrophysics Data System (ADS) database for articles referring to the Milky Way and containing one or more of the abstract keywords ‘rotation curve,’ any variety of the words ‘kinematic’ (kinematic, kinematics, kinematical) or ‘dynamics’ (dynamics, dynamical), or ‘Oort.’ This resulted in an initial collection of 9,690 articles, spanning the period from the original dynamics papers by Oort (1927a,b) until the end of 2017 June.
Next, we perused all articles in detail, looking for newly determined or rederived Galactic rotation constants, while also following the reference trail to previously published papers used as comparison material for the newly (re-)derived rotation constants. Eventually, this led to a compilation of 162 values which were newly obtained at the time of their publication. The NASA/ADS information pages report that the database contains all articles published in the main astrophysics journals since 1975, while the collection’s completeness of historical records is continuously increasing. Since we will base our main conclusions in this paper on post-1985 data, the most important factor affecting the completeness of our own database is the question as to whether we have managed to track down all relevant values in the literature. We are confident that we have found the vast majority, but we call upon the community to submit additional entries we may have missed for possible inclusion in our online database.
As for our previous papers in this series, our database can be accessed from http://astro-expat.info/Data/pubbias.html,222A permanent link to this page can be found at http://web.archive.org/web/20160610121625/http://astro-expat.info/Data/pubbias.html; members of the community are encouraged to send us updates or missing information, which will be included in the database if appropriate. where we provide full bibliographic references and direct links to the original articles. The uncertainties, where available, are the statistical uncertainties only; no explicit references to systematic uncertainties were found. However, one can of course gain insight into the latter by examining the different values provided by a number of authors for different assumptions made (e.g., Lynden-Bell & Lin 1977; Einasto et al. 1979; Jackson 1985; Caldwell & Coulson 1988; Merrifield 1992; Miyamoto & Zhu 1998; Feast et al. 1998; Zhu 2000; Shen & Zhu 2007; Xue et al. 2008; Yuan et al. 2008; Reid et al. 2009a,b; Bovy et al. 2009; Bobylev 2013; Zhu & Shen 2013; Branham 2014; Bobylev & Bajkova 2015).
Note that not every paper actually reports the relevant Galactic rotation speed, or even . However, numerous articles report the best-fitting Oort constants , or both and . The latter are defined as
| (1) | |||||
| (2) |
which allow for the presence of a velocity gradient, , at the solar circle. For a flat rotation curve at , this simplifies to
| (3) | |||||
| (4) |
so that
| (5) |
Therefore, if had not been determined directly but or and was (were) available in a given paper, we used Eq. (5) to obtain an estimate of under the assumption of a flat rotation curve. Where we were required to proceed in this manner, this has been indicated in the notes associated with our final database.
We also included the Galactocentric distances adopted or derived by their respective authors, given that the majority of the Galactic rotation speeds included in our compilation are degenerate with respect to the former. In the remainder of this paper, we will treat these values as fixed, i.e., without considering any uncertainties associated with their use (see Paper IV for a proper treatment of these uncertainties). Only four of the Galactic rotation speeds contained in our database are not directly scalable with (Lynden-Bell & Frenk 1981; McCutcheon et al. 1983; Alvarez et al. 1990; Frinchaboy & Majewski 2005); these values have been omitted in our subsequent analysis, although we note that most of their values (with the exception of the low reported by McCutcheon et al. 1983) are largely consistent, at least within the uncertainties, with the bulk of the determinations in our database, as well as with our final recommendation.
Figure 1a shows our full data set of Galactic rotation speeds as published in their original papers. In Fig. 1b, we have homogenized the values by scaling to a common Galactocentric distance of kpc, our recommendation resulting from the statistical analysis in Paper IV. Next, in Fig. 1c, we show the ratios (for which the actual value of adopted is unimportant given the degeneracy between and ). All panels also include indications of the prevailing IAU recommendations from 1965 ( km s-1; kpc) and 1985 (red and blue horizontal dashed lines, respectively). Finally, Figs 1d and e show, for the post-1985 era, the successive three-year averages for (rescaled to kpc) and , respectively. Panels (c) and (e) also include the theoretically predicted range for from McMillan & Binney (2010), which seems somewhat overestimated, even in view of the multi-year averages shown in Fig. 1e. In this context, one should keep in mind that the vertical error bars shown for the multi-year averages are the Gaussian widths, , of the distribution in a given period range; the uncertainties on the mean values would be smaller by a factor of (where corresponds to the number of values contributing to the mean) if our assumption of Gaussian distributions is reasonable. Figures 1d and e suggest that any trend would have flattened out around the year 2000 already. The Gaussian ’s do not seem to be correlated over this period, however, so that we cannot claim to have uncovered publication bias or a ‘bandwagon effect’ since the turn of the last Century.
3 Differences among tracer populations
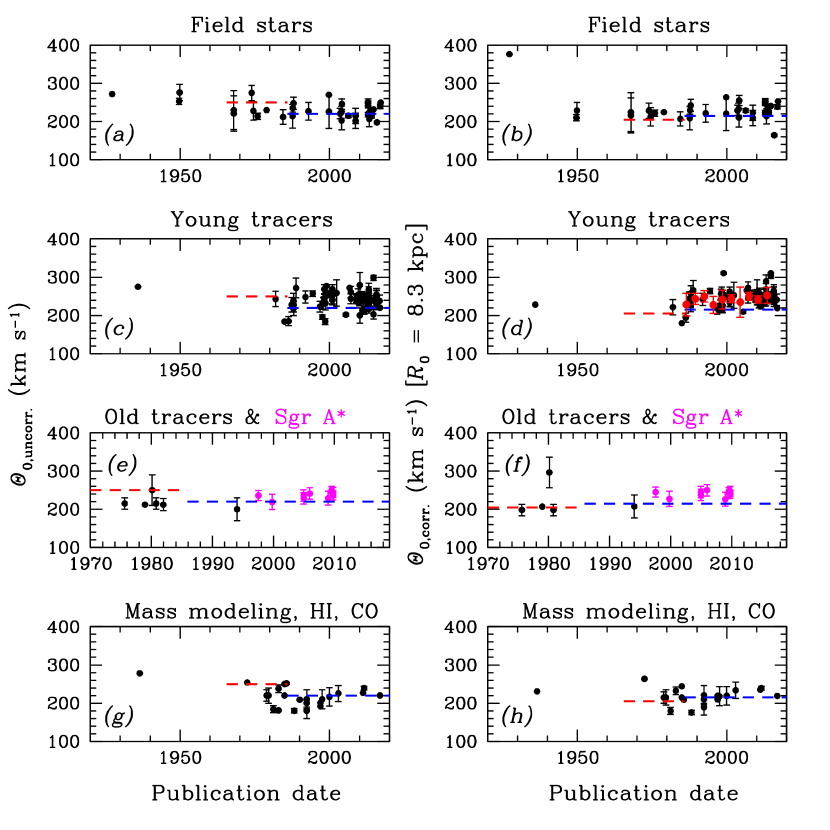
Figure 2 shows (left) the originally published and (right) the corrected Galactic rotation speeds as a function of publication date and separated by stellar population tracer. We grouped the entries in our database into ‘field stars,’ young tracer populations, rotation speeds based on the kinematics (proper motions) of Sgr A* near the Galactic Center, and rotation speeds based on Galactic mass modeling, Hi (neutral hydrogen), and carbon monoxide (CO) radio observations. Note that, strictly speaking, the Sgr A* measurements as well as many of the ‘young tracers’ values are based on maser astrometry, so that we could, in principle, have taken these measurements together. As we will see below, the results for both subgroups of measurements are fully consistent with each other.
We have collected a sufficient number of data points for the young tracers to attempt the construction of a multi-year running average. The resulting trend is overplotted in Fig. 2d, where the red data points show the mean values and standard deviations of the distribution, in successive bins of four years each. The four-year averages from 1985 onward do not suggest any obvious trend within the random fluctuations, which are mostly owing to small-number statistics rather than to systematic uncertainties.
Among the field stars, we have included disk, bulge, bar, and halo stars, as well as large samples of giant, main-sequence, and dwarf stars. As such, the ‘field’ population appears truly representative of the Galaxy’s stellar populations as a whole. Similarly, the results based on Galactic mass modeling and those relying on Hi and CO data trace the Galaxy’s overall mass distribution. A cursory examination of the right-hand panels of Fig. 2 already tells us that while the field stars, and the Galactic mass models, Hi, and CO observations are largely consistent with the prevailing IAU recommendation (see the blue dashed lines), the young tracers (composed of OB and supergiant stars, masers, Cepheid variables, Hii regions, and young open clusters,333Although open clusters in the Galactic disk cover a range in ages, the measurements included in our database are based on samples of young clusters, with ages of up to 50 Myr (Shen & Zhu 2007; Zhu 2009; Zhu & Shen 2013). as well as those values resulting from Sgr A* kinematic measurements) are characterized by higher rotation speeds. We will return to these differences in the next section. (Since the few measurements we have based on old tracers were predominantly published before 1985, with a singke exception, we will not include these values in our analysis.)
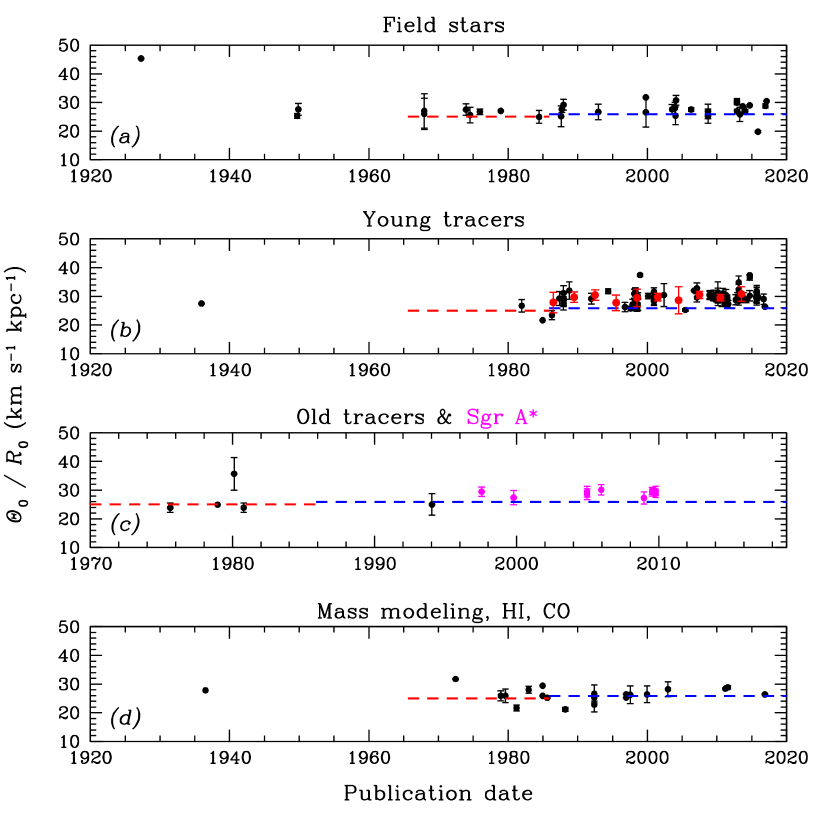
A similar scenario is sketched by Fig. 3, which displays the ratio as a function of publication date for the same tracer populations. Again, the Galactic mass models and the results from the Hi and CO observations and the field stars are largely consistent with the prevailing IAU recommendation. The young populations, as well as the Sgr A* kinematics, imply a significantly larger ratio. The mean levels for each subpopulation, the uncertainties on the means—formally defined by the Gaussian width of the tracer distribution divided by the square root of the number of measurements, —and the overall ’s of the tracer populations are included in Table 1 for easy quantitative comparison. We will return to a statistical discussion of these values in the next section.
| Tracer | Period | (km s-1) | (km s-1 kpc-1) | ||||
|---|---|---|---|---|---|---|---|
| Mean | Mean | ||||||
| Field stars | 1965–1985 | 7.6 | 0.92 | 7 | |||
| 1985–present | 20.2 | 2.46 | 25 | ||||
| Young tracers | 1985–present | 19.8 | 2.42 | 59 | |||
| Old tracers | All | 43.7 | 5.33 | 7 | |||
| Sgr A* | All | 8.2 | 1.00 | 10 | |||
| Mass models | 1985–present | 13.8 | 1.69 | 16 | |||
| All | 1965–1985 | 22.1 | 2.70 | 31 | |||
| 1985–present | 22.0 | 2.68 | 126 | ||||
4 Is there a need for reassessment of the IAU recommendation?
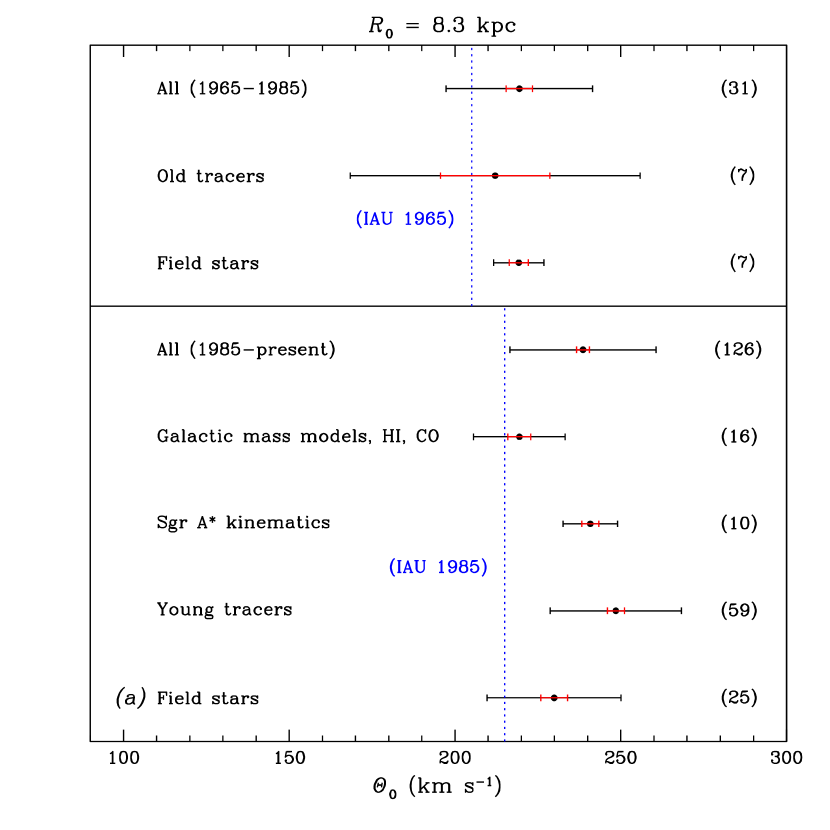
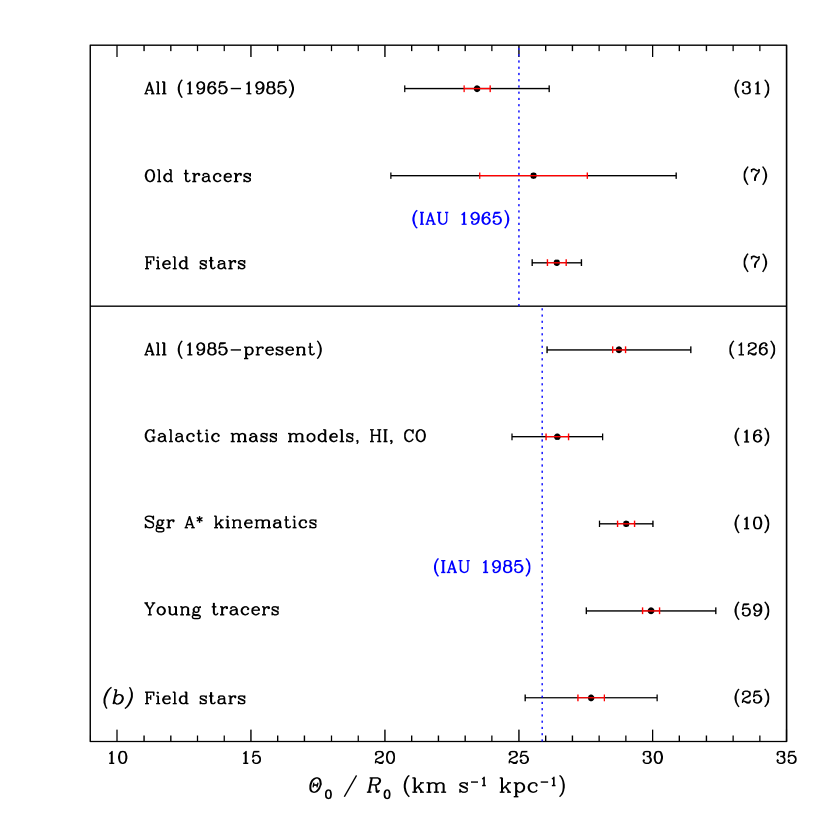
Figure 4 is a graphical representation of the Galactic rotation speed at the solar circle and the ratio implied by the different tracer populations. For ease of comparison, we have also included the IAU-recommended values using vertical blue dotted lines. When considering the post-1985 values, the impression we gained in the previous section is solidified: the young tracers as well as the Sgr A* kinematics imply a much higher rotation speed and a larger ratio than the old tracers (although note that the latter measurements are few in number and mostly published before 1985), the field stellar population, radio observations of Hi and CO gas kinematics, and Galactic mass modeling.
In order to provide further support for the reality of statistical differences among the tracer populations, we performed a statistical Kruskal–Wallis test. This is a non-parametric test which is used to determine whether three or more groups are statistically the same in terms of their mean ranks. The test does not assume that the data points are distributed according to a normal distribution, so it is more robust than the one-way ANOVA test. The underlying null hypothesis is that all groups have similar mean ranks.
We applied the Kruskal–Wallis test to the 25 post-1985 values for the field stars, the 59 post-1985 values for the young tracers, all 10 values based on the proper motion of Sgr A*, and the 16 post-1985 data points resulting from mass modeling. We first sorted all values, irrespective of their provenance, in ascending order. Next, we assigned ranks to the sorted values, assigning the average rank to any tied values. Specifically, the mean ranks for the post-1985 data composed of field stars, young tracers, Sgr A*-based values, and those based on mass modeling are, respectively, 51.1, 70.1, 66.0, and 33.7. We then added up the different ranks for each group and calculated the statistic:
| (6) |
where is the total number of data points, is the number of data points in a group, is the sum of the ranks in the group, and is the size of the group. For our specific data set, .
This value must be compared with the critical value for degrees of freedom and a nominal value of 0.05 (which is ). If the critical value is less than the statistic, we can reject the null hypothesis that the medians of the different groups are equal. This is indeed the case for the four groups considered here. The corresponding value is 0.00086.
Curiously, few authors have commented on the significantly larger values they obtained for either or based on young tracers compared with field stars or radio data. In fact, most authors reporting higher-than-average values selectively compared their results with previously published values for similar populations (e.g., Elias et al. 2006). This could be considered selective publication bias.
Let us, instead, take a holistic view and consider the underlying causes of these higher values resulting from young tracers. While the field stars and the Hi/CO distribution represent a smooth three-dimensional mass distribution, the young tracers are predominantly found in the spiral arms, mostly near the solar circle, where non-circular motions—including vertical oscillations (e.g., Kerr & Lynden-Bell 1986; Bobylev & Bajkova 2015) or radial motions toward the Galactic Center (but see Reid et al. 2009b for an opposing view)—may be significant (e.g., Foster & Cooper 2010). In addition, these young tracer populations tend to be located in a much thinner disk-like structure than, e.g., the K and M giants (Zhu 2000; Huang et al. 2016) or the Southern Proper Motion Program (Méndez et al. 1999), the Tycho-2 (Olling & Dehnen 2003), SDSS (Sirko et al. 2004; Xue et al. 2008; Schönrich 2012), APOGEE (Bovy et al. 2012; Bovy 2014), RAVE (Sharma et al. 2014), or LAMOST stars (Huang et al. 2016) making up the diverse field stellar population in the Galaxy’s disk and halo.
It has also been suggested that the different Galactic rotation speeds determined on the basis of local ( kpc) with respect to more distant Cepheid variables could be caused by an intrinsic kinematic bias affecting the local sample, which may be characterized by its own local kinematics instead of the overall Galactic rotation properties (Glushkova et al. 1999), possibly explaining a local dip in the Galactic rotation curve. However, independent estimates based on both Hipparcos and Southern Proper Motion Catalog (Platais et al. 1998) stars yielding mutually consistent rotation speeds seem to have al but invalidated those suggestions; comprehensive and up-to-date Galactic rotation curves no longer show any dip near the Sun’s Galactocentric distance, at least not those based on the main mass tracers (see, e.g., Bland-Hawthorn & Gerhard 2016). It is still possible that the appearance of such a dip could be limited to the young(est) populations located in the Perseus spiral arm (e.g., Sofue 2013; Genovali et al. 2014). Genovali et al. (2014) also suggested that the clumpy distribution of classical Cepheids across the Galactic thin disk and their possible association with giant molecular clouds may hamper their use for Galactic rotation measurements.
Note that the Hi, CO, and field population tracers also imply larger values for both (at kpc) and the ratio than the canonical IAU recommendation, although the widths of their full distributions encompass the IAU values within their 1 ranges. In view of these distributions, and considering that both the field populations and the Hi or CO gas kinematics reflect the underlying Galactic mass distribution most closely, we contend that the post-1985 combination of these measurements may indeed yield the most appropriate value for the Galactic rotation speed for kpc.
The 40 post-1985 measurements of based on field star samples, Hi or CO observations, and Galactic mass modeling yield . Note that, while dominated by a statistical component, the uncertainty does include a contribution from a systematic component, given that the contributing values include such uncertainties. Similarly, the resulting ratio based on these values is .
At this point, it would be wise to perform a final check of the Galactic rotation speed at the solar circle by considering the Galaxy’s rotation curve with respect to the external reference frame provided by the Milky Way’s satellite galaxies and other Local Group members, as well as the Milky Way’s GD-1 giant stream. Fortunately, a number of studies have attempted to do just this. Lynden-Bell & Lin’s (1977) and Einasto et al.’s (1979) original attempts yielded rotation speeds that bracketed the expected range. Lynden-Bell & Lin (1977) determined km s-1 for kpc (with a reduced uncertainty of 13 km s-1 resulting from the application of more a priori constraints), while Einasto et al. (1979) found km s-1, again for kpc. More recent derivations of in external reference frames, all recalibrated for kpc, have resulted in (30) km s-1 (Kochanek et al. 1996) and () km s-1 (Koposov et al. 2010).
This thus implies that there is no compelling evidence suggesting that the IAU-recommended km s-1 is no longer valid, although it would be more appropriate to increase the recommendation to km s-1, provided that the recommended Galactocentric distance is reduced from kpc to kpc (Paper IV). A comparison of the Galactic rotation speeds implied by the Galactic mass tracers with those resulting from considering an external reference frame implies a systematic uncertainty of order km s-1. Combined with the results from our statistical analysis in Paper IV, we thus conclude that the most appropriate set of Galactic rotation constants is
| (7) | |||||
so that
Acknowledgements
R. d. G. is grateful for research support from the National Natural Science Foundation of China through grants 11373010, 11633005, and U1631102. This work was also partially supported by PRIN-MIUR (2010LY5N2T), ‘Chemical and dynamical evolution of the Milky Way and Local Group galaxies’ (PI F. Matteucci). This research has made extensive use of NASA’s Astrophysics Data System Abstract Service.
References
- Alvarez et al. (1990) Alvarez, H., May, J., & Bronfman, L. 1990, ApJ, 348, 495
- Bland-Hawthorn & Gerhard (2016) Bland-Hawthorn, J., & Gerhard, O. 2016, ARA&A, 54, 529
- Bobylev (2013) Bobylev, V. V. 2013, Astron. Lett., 39, 95
- Bobylev & Bajkova (2015) Bobylev, V. V., & Bajkova, A. T. 2015, Astron. Lett., 41, 473
- Bovy (2014) Bovy, J. 2014, in: Setting the scene for Gaia and LAMOST, eds Feltzing, S., Zhao, G., Walton, N. A., & Whitelock, P., IAU Symp., 298, 185
- Bovy et al. (2009) Bovy, J., Hogg, D. W., & Rix, H.-W. 2009, ApJ, 704, 1704
- Bovy et al. (2012) Bovy, J., Allende Prieto, C., Beers, T. C., et al. 2012, ApJ, 759, 131
- Branham (2014) Branham, R. L. 2014, Ap&SS, 353, 179
- Caldwell & Coulson (1988) Caldwell, J. A. R., & Coulson, I. M. 1988, in: The Outer Galaxy, eds Blitz, L., & Lockman, F. J., Lect. Notes Phys., 306, 68
- de Grijs et al. (2014) de Grijs, R., Wicker, J. E., & Bono, G. 2014, AJ, 147, 122 (Paper I)
- de Grijs & Bono (2014) de Grijs, R., & Bono, G. 2014, AJ, 148, 17 (Paper II)
- de Grijs & Bono (2015) de Grijs, R., & Bono, G. 2015, AJ, 149, 179 (Paper III)
- de Grijs & Bono (2016) de Grijs, R., & Bono, G. 2016, ApJS, 227, 5 (Paper IV)
- Einasto et al. (1979) Einasto, J., Haud, U., & Jõeveer, M. 1979, in: The Large-Scale Characteristics of the Galaxy, ed. Burton, W. B., IAU Symp., 84, 231
- Elias et al. (2006) Elias, F., Alfaro, E. J., & Cabrera-Caño, J. 2006, AJ, 132, 1052
- Feast et al. (1998) Feast, M., Pont, F., & Whitelock, P. 1998, MNRAS, 298, L43
- Foster & Cooper (2010) Foster, T., & Cooper, B. 2010, in: The Dynamic Interstellar Medium: A Celebration of the Canadian Galactic Plane Survey, eds Kothes, R., Landecker, T. L., & Willis, A. G., ASP Conf. Ser., 438, 16
- Frinchaboy & Majewski (2005) Frinchaboy, P. M., & Majewski, S. R. 2005, in: Island Universes: Structure and Evolution of Disk Galaxies, ed. de Jong, R. (Springer: Dordrecht), arXiv:astro-ph/0508666
- Genovali et al. (2014) Genovali, K., Lemasle, B., Bono, G., et al. 2014, A&A, 566, A37
- Glushkova et al. (1999) Glushkova, E. V., Dambis, A. K., & Rastorguev, A. S. 1999, Astron. Astrophys. Trans., 18, 349
- Huang et al. (2016) Huang, Y., Liu, X.-W., Yuan, H.-B., et al. 2016, MNRAS, 463, 2623
- Jackson (1985) Jackson, P. D. 1985, in: The Milky Way Galaxy, eds van Woerden, H., Allen, R. J. & Burton, B. W., IAU Symp., 106, 179
- Kerr & Lynden-Bell (1986) Kerr, F. J., & Lynden-Bell, D. 1986, MNRAS, 221, 1023
- Lynden-Bell & Frenk (1981) Lynden-Bell, D., & Frenk, C. S. 1981, Obs., 101, 200
- Lynden-Bell & Lin (1977) Lynden-Bell, D., & Lin, D. N. C. 1977, MNRAS, 181, 37
- McCutcheon et al. (1983) McCutcheon, W. H., Robinson, B. J., Whiteoak, J. B., & Manchester, R. N. 1983, in: Kinematics, Dynamics and Structure of the Milky Way, ed. Shuter, W. L. H., Astrophys. Space Sci. Libr., 100, 165
- McMillan & Binney (2010) McMillan, P. J., & Binney, J. J. 2010, MNRAS, 402, 934
- Méndez et al. (1999) Méndez, R. A., Platais, I., Girard, T. M., Kozhurina-Platais, V., & van Altena, W. F. 1999, ApJ, 524, L39
- Merrifield (1992) Merrifield, M. R. 1992, AJ, 103, 1552
- Miyamoto & Zhu (1998) Miyamoto, M., & Zhu, Z. 1998, AJ, 115, 1483
- Olling & Dehnen (2003) Olling, R. P., & Dehnen, W. 2003, ApJ, 599, 275
- Oort (1927a) Oort, J. H. 1927a, Bull. Astron. Inst. Netherlands, 3, 275
- Oort (1927b) Oort, J. H. 1927b, Bull. Astron. Inst. Netherlands, 4, 79
- Platais et al. (1998) Platais, I., Girard, T. M., Kozhurina-Platais, V., et al. 1998, AJ, 116, 2556
- Reid & Dame (2016) Reid, M. J., & Dame, T. M. 2016, ApJ, 832, 159
- Reid et al. (2009a) Reid, M. J., Menten, K. M., Brunthaler, A., et al. 2009a, ApJ, 693, 397
- Reid et al. (2009b) Reid, M. J., Menten, K. M., Zheng, X. W., et al. 2009b, ApJ, 700, 137
- Reid et al. (2014) Reid, M. J., Menten, K. M., Brunthaler, A., et al. 2014, ApJ, 783, 130
- Salucci et al. (2010) Salucci, P., Nesti, F., Gentile, G., & Frigerio Martins, C. 2010, A&A, 523, A83
- Schönrich (2012) Schönrich, R. 2012, MNRAS, 427, 274
- Sharma et al. (2014) Sharma, S., Bland-Hawthorn, J., Binney, J., et al. 2014, ApJ, 793, 51
- Shen & Zhu (2007) Shen, M., & Zhu, Z. 2007, Chinese J. Astron. Astrophys., 7, 120
- Sirko et al. (2004) Sirko, E., Goodman, J., Knapp, G. R., et al. 2004, AJ, 127, 914
- Sofue (2013) Sofue, Y. 2013, PASJ, 65, 118
- Sofue (2016) Sofue, Y. 2016, PASJ, 68, 2
- Sofue et al. (2009) Sofue, Y., Honma, M., & Omodaka, T. 2009, PASJ, 61, 227
- Weber & de Boer (2010) Weber, M., & de Boer, W. 2010, A&A, 509, A25
- Xin & Zheng (2013) Xin, X.-S., & Zheng, X.-W. 2013, Res. Astron. Astrophys., 13, 849
- Xue et al. (2008) Xue, X. X., Rix, H. W., Zhao, G., et al. 2008, ApJ, 684, 1143
- Yuan et al. (2008) Yuan, F.-T., Zhu, Z., & Kong, D.-L. 2008, Chinese J. Astron. Astrophys., 8, 714
- Zhu (2000) Zhu, Z. 2000, PASJ, 52, 1133
- Zhu (2009) Zhu, Z. 2009, Res. Astron. Astrophys., 9, 1285
- Zhu & Shen (2013) Zhu, Z., & Shen, M. 2013, in: Advancing the Physics of Cosmic Distances, ed. de Grijs, R., IAU Symp., 289, 444