Augmenting the thermal flux experiment: a mixed reality approach with the HoloLens
Abstract
This article may be downloaded for personal use only. Any other use requires prior permission of the author and AIP Publishing.
The following article appeared in The Physics Teacher 55, 376 (2017) and may be found at
doi: http://dx.doi.org/10.1119/1.4999739
In the field of Virtual Reality (VR) and Augmented Reality (AR) technologies have made huge progress during the last years Schm16 ; Sand15 ; Hock16 and also reached the field of education Sant14 ; Kuhn16 . The virtuality continuum, ranging from pure virtuality on one side to the real world on the other Milg94 has been successfully covered by the use of immersive technologies like head-mounted displays, which allow to embed virtual objects into the real surroundings, leading to a Mixed Reality (MR) experience. In such an environment digital and real objects do not only co-exist, but moreover are also able to interact with each other in real-time. These concepts can be used to merge human perception of reality with digitally visualized sensor data and thereby making the invisible visible. As a first example, in this paper we introduce alongside the basic idea of this column Kuhn12 an MR-experiment in thermodynamics for a laboratory course for freshman students in physics or other science and engineering subjects which uses physical data from mobile devices for analyzing and displaying physical phenomena to students.
I Theoretical background
The paradigm experiment for heat conduction in metals can be realized with a metallic rod, heated on one side while simultaneously cooled on the other Parr75 . Our setup allows to observe the heat flux through the rod, directly on the real physical object, using a false-color representation. Moreover, also additional representations as, e.g., graphs and numerical values, can be included as digital augmentations to the real experiment, allowing for a just-in-time evaluation of physical processes.
If the rod is perfectly isolated, after some equilibration time the system will reach a steady state with a hot end at temperature , a cold end at temperature , and a constant spatial gradient along the rod axis, which allows to calculate the thermal conductivity constant of the material according to
| (1) |
if the constant heating power and the dimensions, i.e. length and cross-section , of the rod are known. Here it is assumed that the full heating power applied to the warm end of the rod will be removed on the cold end by cooling.
If the rod is not isolated, it moreover is possible to calculate the loss of heat to the environment according to , using the decline factor extracted from an exponential fit to the experimental data note1 .
II Experimental design
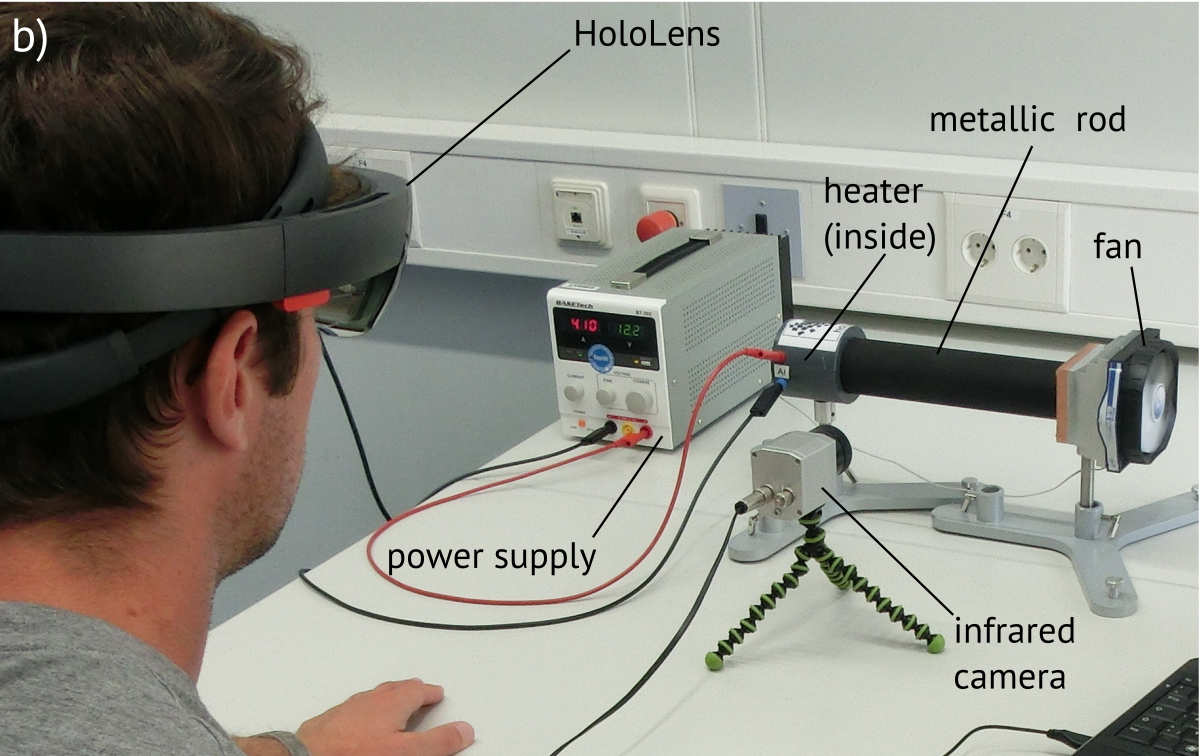
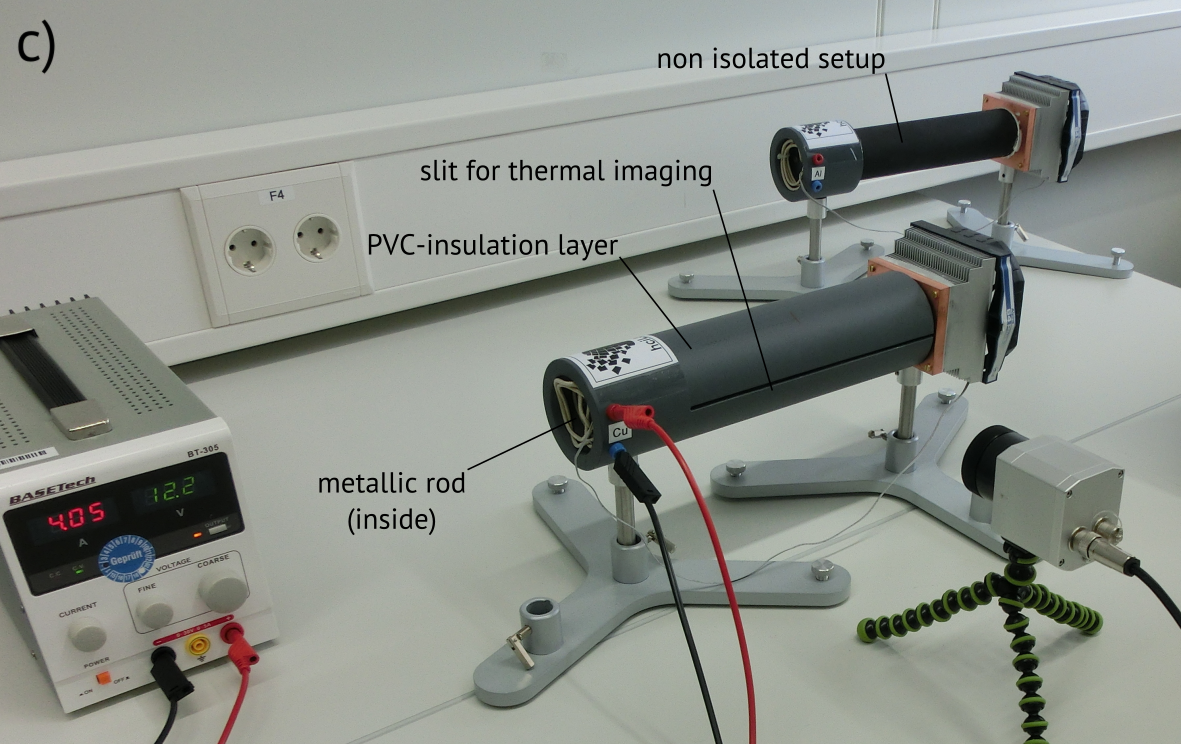
Our heat conduction experiment consists of cylindrical metal sample rods with a length of cm and a diameter of cm made of Aluminum and Copper, respectively (cf. Fig. 1.b). The sample is heated at one end with a cartridge heater and cooled at the other by a standard CPU fan. The isolated version moreover has a PVC insulation layer with a 3 mm slit along the rod, to allow for thermal imaging of the rod inside (cf. Fig. 1.c). The temperature data finally is extracted from thermal images taken with an infrared camera placed in front of the sample. Each pixel of the image along a fixed line in axial direction yields one temperature value, such that the whole spatial distribution can be captured by a single shot. The data is then passed to the Microsoft HoloLens via WiFi, where the visualization is done. In the current state, an App provides three different representations of the data: false-color image of the temperature values projected as “hologram” note2 directly onto the sample cylinder, numerical values at three pre-defined points and a temperature graph as a function of the position along the rod hovering above the setup, cf. Fig. 1.a. The user may switch the numerical and graph representation on and off at will; moreover, it is possible to export the data as csv-file at any time for later analysis. These functions can be executed with the help of virtual buttons (cf. the three white squares in Fig. 1.a) projected at the right end of the rod which can be selected by the gaze and triggered by hand gestures.
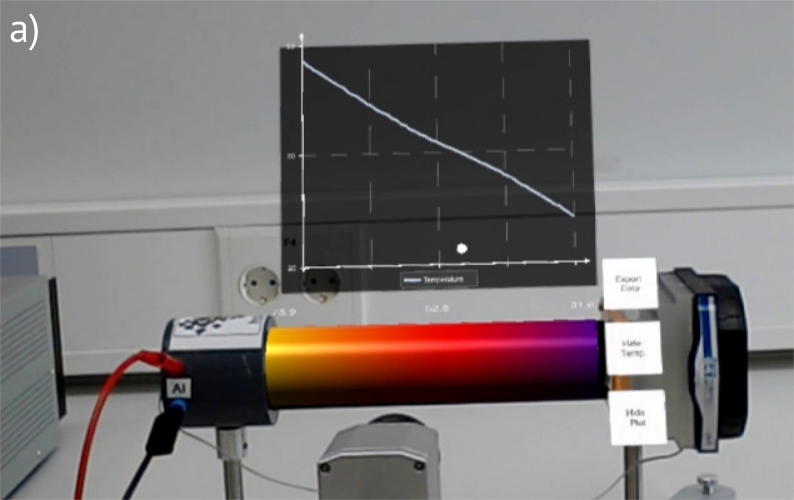
The benefit of the MR-experiment setup is the possibility of keeping track of the real physical devices and representations of the data simultaneously and in real-time as the representations are continuously updated with new data from the camera. The false color representations allows to experience an otherwise invisible quantity, like in this case temperature, with human senses, thus extending perception to new regimes. Furthermore, direct feedback is implemented, such that students get an immediate impression of effects of the experimental parameters.
III Experimental Results
The exported data can be analyzed using standard instruments like spreadsheet programs. In the isolated case, the problem reduces to a linear fit of the temperature graph, yielding the slope and thus, with the help of the constant heating power used in the experiments via (1) the thermal conductivity constant .
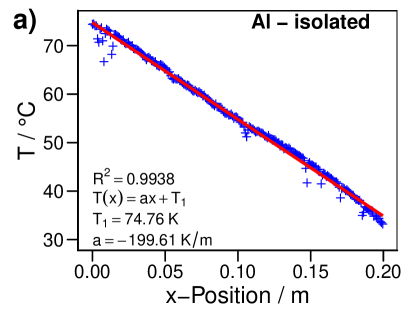
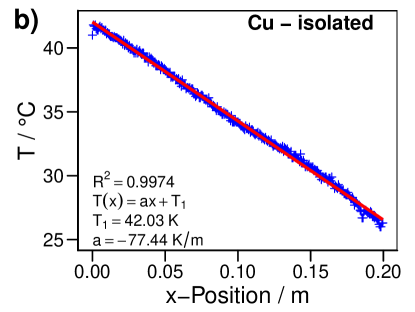
In our tests (see Fig. 2.a,b) the isolated setup yielded a value of for the Aluminum rod and for the Copper rod. As expected, due to the non perfect isolation of the samples, these values are smaller than the reference values found in literature, and , as the effective heat flux along the rod is reduced by loss to the environment.
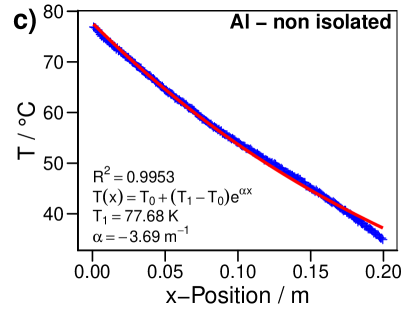
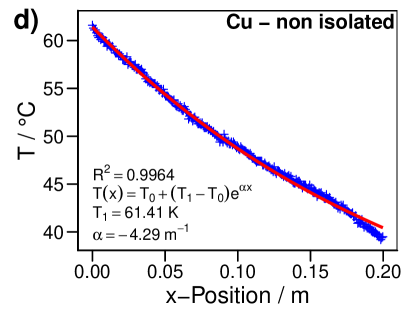
With the help of the non-isolated rod the heat transfer coefficient can be determined using the exponential decline factor (see Fig. 2.c,d) yielding and , respectively. These values are also underestimated for the same reasons, however, compared to and , where the literature values for were used, they are reasonable regarding the very simple insulation of the setup.
IV Conclusion
The MR experimental setup for a thermal flux experiment presented here, sheds new light on an experiment well known in physics laboratory courses. The main focus of this design is to visualize the invisible and thus to extend human perception to new regimes, e.g., temperature and heat, thereby strengthening the connection between theory and experiment. In this realization the MR setting not only has the advantage of intrinsic contextuality, but also spatial and time contiguity which is supposed to support the learning process of the students Craw01 ; Maye10 . Moreover, the just-in-time evaluation of the data yields the possibility for the students to directly examine the process itself and the parameter involved, and immediately compare the outcome to theoretical predictions which we believe to enhance the links between theory and experiment. Under that perspective the effort to achieve possibly more exact numerical values for quantities like the thermal conductivity therefore seem to be less important in this setting. Instead, the technical support during the experimental phase will give students the possibility to thoroughly examine the relationship between cause and effect and thus deepen their physical understanding.
Support from the German Federal Ministry of Education and Research (BMBF) via the project “Be-greifen” begreifen is gratefully acknowledged.
References
- [1] D. Schmalstieg and T. Höllerer. Augmented Reality: Principles and Practice. Addison-Wesley Professional, 2016.
- [2] C. Sandor, M. Fuchs, Á. Cassinelli, H. Li, R. A. Newcombe, G. Yamamoto, and S. K. Feiner. Breaking the barriers to true augmented reality. CoRR, abs/1512.05471, 2015.
- [3] P. Hockett and T. Ingleby. Augmented reality with hololens: Experiential architectures embedded in the real world. CoRR, abs/1610.04281, 2016.
- [4] M. E. C. Santos, A. Chen, T. Taketomi, G. Yamamoto, J. Miyazaki, and H. Kato. Augmented reality learning experiences: Survey of prototype design and evaluation. IEEE Transactions on Learning Technologies, 7(1):38–56, Jan 2014.
- [5] J. Kuhn, P. Lukowicz, M. Hirth, A. Poxrucker, J. Weppner, and J. Younas. gPhysics – Using Smart Glasses for Head-Centered, Context-Aware Learning in Physics Experiments. IEEE Transactions on Learning Technologies, 9 (4):304–317, 2016.
- [6] P. Milgram and F. Kishino. A taxonomy of mixed reality visual displays. IEICE Trans. Information and Systems, 77(12):1321–1329, 1994.
- [7] J. Kuhn and P. Vogt. Diffraction experiments with infrared remote controls. Phys. Teach., 50:118, 2012.
- [8] J. E. Parrot and A. D. Stuckes. Thermal Conductivity of Solids. Pion Limited, London, 1975.
- [9] See additional online material for a derivation and more detailed discussion.
- [10] The HoloLens does not actually use interference-based holograms but rather projections to the transparent head-mounted displays of the device. However, the term hologram is used by the manufacturer to describe these.
- [11] M.L. Crawford. Teaching contextually: Research, rationale, and techniques for improving student motivation and achievement in mathematics and science. CORD Comm, 2001.
- [12] R. E. Mayer, editor. The Cambridge Handbook of Multimedia Learning. Cambridge University Press, 2010.
- [13] https://www.physik.uni-kl.de/kuhn/forschungsprojekte/aktuelle-projekte/be-greifen/