Implications for the missing low-mass galaxies (satellites) problem from cosmic shear
Abstract
The number of observed dwarf galaxies, with dark matter mass M⊙ in the Milky Way or the Andromeda galaxy does not agree with predictions from the successful CDM paradigm. To alleviate this problem a suppression of dark matter clustering power on very small scales has been conjectured. However, the abundance of dark matter halos outside our immediate neighbourhood (the Local Group) seem to agree with the CDM–expected abundance. Here we connect these problems to observations of weak lensing cosmic shear, pointing out that cosmic shear can make significant statements about the missing satellites problem in a statistical way. As an example and pedagogical application we use recent constraints on small-scales power suppression from measurements of the CFHTLenS data. We find that, on average, in a region of Gpc3 there is no significant small-scale power suppression. This implies that suppression of small-scale power is not a viable solution to the ‘missing satellites problem’ or, alternatively, that on average in this volume there is no ‘missing satellites problem’ for dark matter masses M⊙. Further analysis of current and future weak lensing surveys will probe much smaller scales, Mpc-1 corresponding roughly to masses .
keywords:
Cosmology: cosmological parameters. Gravitational lensing: weak1 Introduction
The observed abundance of satellite galaxies around the Milky Way with dark matter masses less than the Large Magellanic Cloud ( M⊙) does not agree with the number of corresponding dark matter halos predicted by detailed N-body simulations of the current CDM paradigm (Klypin et al. (1999); Moore et al. (1999); see also some more recent high-resolution simulations in Diemand et al. (2008); Springel et al. (2008)). This is because in cosmological simulations that incorporate only gravity and collisionless cold dark matter, simulated halos retain large amounts of substructure formed by earlier, smaller-scale, collapse, predicting hundreds of sub-halos in contrast to the observed satellites of the Milky Way. This has been referred to as the ‘missing satellites problem’. Several solutions have been proposed to reconcile this problem with the CDM predictions ranging from the original proposal by Jimenez et al. (1997) of the existence of low-mass dark galaxies, to the suppression of power at small-scales either in the initial conditions e.g., Kamionkowski & Liddle (2000); Zentner & Bullock (2003), or by changing the properties of the dark matter – to be interacting, or not cold – e.g., Colín, Avila-Reese, & Valenzuela (2000); Bode, Ostriker, & Turok (2001); Strigari et al. (2007), to baryonic processes, or processes proposed to render these satellites dark (i.e. have a very low stellar to dark matter mass ratio; see e.g the review by Bullock (2010) and also Verde, Oh, & Jimenez (2002)).
It is important to note that the missing satellite problem is mostly confined to observations of the Local group. Although some indications hint towards dwarf galaxies not being missing in systems beyond the local group (Côté, West, & Marzke, 2002; Read et al., 2017; Menci et al., 2017), and image flux ratios in images of strongly lensed galaxies indicate the presence of substructure (e.g., Dalal & Kochanek (2002); Dobler & Keeton (2006); Vegetti et al. (2012); Hezaveh et al. (2013); Vegetti et al. (2014); Hezaveh et al. (2016a, b); Diaz Rivero et al. (2017)) in broad agreement with CDM predictions, we have little direct information about the amount of substructure (satellites) and their mass distribution in other galaxies. A closely related problem is the fact that the observed faint end of the luminosity function has a shallower slope (Blanton et al., 2001; Panter, Heavens, & Jimenez, 2004) than predicted from high-resolution CDM simulations; however this relies on assuming a constant mass-to-light ratio (e.g., Jenkins et al. (2001)). Stellar feedback is again often used in semi-analytic models to suppress star formation in halos with shallow potential wells e.g., Hopkins et al. (2013). Finally, the determination of halo masses bygalaxy-galaxy lensing (e.g. Mandelbaum et al. (2006) in SDSS), gives satellite fractions consistent with those of the CDM model.
It should be clear that explanations for the missing satellite problem can be broadly divided in two classes: i) those that suppress the (linear) matter power spectrum on small scales as to suppress the number of small halos compared to the predictions of power law power spectrum (CDM) model and ii) those that leave the CDM power spectrum untouched, but simply hide these halos by leaving them dark. Therefore, indirect statistical information could be gathered by measuring the matter power spectrum on small scales over a representative volume of the Universe; this quantity directly determines the abundance (and mass function) of satellites under the assumption that gravity (and not baryonic physics) is the dominant process at play. If the power spectrum is consistent with a power law CDM then the remaining plausible explanation for the missing satellite problem is either that for environmental reasons they are only missing in our galaxy but not elsewhere, or that they are indeed ubiquitous but dark. The Lyman forest has been used to probe the neutral hydrogen density and infer the dark matter power spectrum, thus probing scales that today are highly non-linear, see e.g., Viel et al. (2008); Boyarsky et al. (2009). Until now, no study has been able to recover directly the low redshift matter power on sufficiently small scales (Mpc-1) for a representative volume, thus providing a sufficiently fair sample of the small scale power in the late-time Universe. Here we point out that cosmic shear measurements can provide such a data set.
As an example analysis, that serves as an indicator of what could be done with larger and better data sets, we will use a recent analysis that recovers the power spectrum of matter from a spherical-Bessel analysis of weak lensing data in CFHTLenS. We find that this example analysis provides support for it being consistent with that of CDM and not showing any deficit of small-scale power. This in turn can be used to constrain cosmological models or dark matter properties that suppress small scale power and, if gravity is the dominant force at play, to quantify the predicted abundance of low mass halos.
2 Method and data
Here we describe how cosmic shear measurements can be used to infer information on the low-mass galaxy population. We will use a particular implementation of cosmic shear (Kitching et al., 2016) as an example of the type of analysis that can result in statements on the low-mass galaxy population. We use this because it is a type of analysis that can relatively cleanly identify what scales (i.e., wavenumbers ) contribute to the observed signal in the cosmic shear statistic.
Weak lensing of galaxy images, the effect where the observed shape of galaxies is distorted by the presence of mass perturbations along the line of sight, is a particularly interesting probe of matter distribution in the Universe. This is because the distortion - a change in the third eccentricity, or third flattening (known as ‘ellipticity’), and size of galaxy images - depends on perturbations in the total matter density which, because we live in an apparently dark matter-dominated Universe, is in principle is sensitive to the dark matter power spectrum directly. Accessing the matter power spectrum through weak lensing measurements results in a statistic that contains a wealth of cosmological information. Here we use the recently measured spherical-Bessel power spectrum of the weak lensing effect, a statistic known as ‘3D cosmic shear’, and use this to explore differences between the inferred matter power spectrum and that predicted within a standard, power law cold dark matter-only CDM model.
The small-scale power spectrum is very poorly understood at the current time for two reasons. The first is that highly non-linear dark matter clustering is not well modelled. Analytic approaches based on perturbation theory are only valid on mildly non-linear scales at , numerical simulations and phenomenological fitting formulae must be employed. Current simulations and fitting emulators are precise to a few percent up to scales of Mpc-1 (e.g., Lawrence et al. (2010, 2017)), phenomenological fitting formulae are accurate to 10% down to Mpc-1 e.g., Takahashi et al. (2012). The second is that the CDM paradigm could break down at small scales and new physical processes could be present, for example modified gravity models, neutrino physics, and warm dark matter models interaction in the dark sector all have potentially detectable signatures at scales smaller than Mpc. Thus measuring the matter power spectrum at small scales would yield key information about all these processes. This is in principle accessible by present and forthcoming analyses of weak lensing surveys.
In a previous paper (Kitching et al., 2016), we described the method to infer the power spectrum from current weak lensing data. The data used was CFHTLenS, (Erben et al., 2013; Heymans et al., 2013), which is a square degree optical survey (over four fields W1, W2, W3, W4) in bands, with weak lensing shape measurements (Miller et al., 2013) and photometric redshift posterior probabilities (Hildebrandt et al., 2013). There we presented a measurement of the power spectrum for matter in the range Mpc-1 (Fig. 6). It should be noted that in Kitching et al. (2016) we adopted the best fit marginal values from the Planck Collaboration et al. (2015) cosmology for the cosmological parameters that are not explicitly varied. This is because the CFHTLenS data do not have enough statistical power to leave all cosmological parameters free and constrain them independently of the CMB data. To be more specific, the model parameters that we fit to the data are divided in three parts: the cosmological model, the baryonic feedback model, and the parameters for photometric redshift systematic effects. In Kitching et al. (2016) we explore the feedback and photometric redshift parameters within physical constraints. On the other hand, we adopt the Planck best fitting values for the dimensionless density of baryons, the Hubble constant and the spectral index of of the initial density perturbations . We assumed that the dark energy is a cosmological constant and a flat geometry such that . Finally, we assumed the total sum of neutrino masses to be zero. Although a power law primordial power spectrum is assumed with a given spectral slope, the freedom allowed by the parameterisation of the baryonic feedback model (see Kitching et al. (2016) sec. 2.4.2) leaves abundant freedom to the reconstructed shape of the power spectrum. Effectively this yields a minimally parametric reconstruction of the shape of the matter power spectrum at small scales.


The question we want to address is the following: does the the reconstructed power spectrum allow, within its uncertainty, a small scales power suppression large enough to reduce significantly the predicted number of satellites and thus solve the missing satellites problem?
From the CFHTLenS 3D lensing estimate of the power spectrum we compute the predicted abundance of halos by following the standard spherical collapse approach, calibrated on the latest numerical simulations by Bhattacharya et al. (2011). In brief: the first step is to compute the linear-theory rms fractional mass fluctuation in spheres of radii111This is the initial Largangian radius, , that encloses a mass where denotes the Universe critical density. This should be computed at the redshift of interest which we take it to be . that enclose a mass using a top-hat window function. This requires a linear matter power spectrum, while observations yield the non-linear one. We convert between non-linear (which is what we obtained from the cosmic shear-derived power spectrum) and linear matter power spectrum using the package HaloFit (Smith et al., 2003; Takahashi et al., 2012). This requires an inversion process in HaloFit. It should be noted that the non-linear measured power spectrum is in good agreement with that predicted from a power law CDM model. Any deviations will be small. Therefore we generate multiple (1000) non-linear power spectra for a flat CDM-like cosmologies where we let the cosmological parameters free, including power spectrum spectra index and running of the power spectrum, as to reproduce a possible suppression of power at small scales. The cosmological parameters we allow to vary are: the matter cosmological densities; the Hubble constant and the running of the power spectrum, i.e. a scale dependent index for the power law. The priors we adopt are of the Planck errors for the CDM best fitting model for the cosmological densities; for we adopt a very wide 50 – 100 km prior. Finally, for the running of the power spectrum, we use a prior the range . From this set of non-linear power spectra we find the one best matching the observed one.
For the second step, which follows the same philosophy of the paper by Kamionkowski & Liddle (2000), in order to compute the abundance of objects above a certain mass we use the expression for the mass function provided by Bhattacharya et al. (2011), for standard values of their collapse parameters and for our observed matter power spectrum from CFHTLenS. This cumulative number of halos is computed as
| (1) |
where is the mass in subhalos that at a formation redshift yields a mass , for we adopt a value of .
It is easy to understand why, even by artificially setting the non-linear power to zero above Mpc-1, the estimated mass function (which depends on an integral of the linear power spectrum convolved with a low pass filter) does not deviates much from a CDM one in the reported mass range ( M⊙). In the halo-Fit (Smith et al., 2003) philosophy non-linearities do not change the power, but map the wavenumbers between linear and non linear ones, and respectively, via , where is the dimensionless (non-linear) power. Since at the median sources of the CFHTLens lenses (Kitching et al., 2014), for Mpc-1, is only a factor smaller. This means that we expect our prescription to start underestimating the linear power at scales Mpc -1 and thus for masses somewhere below M⊙. This helps understand why the effect on the cumulative mass function starts being evident at masses below M⊙, which is where we stop reporting the results (see Fig. 3).
3 Results
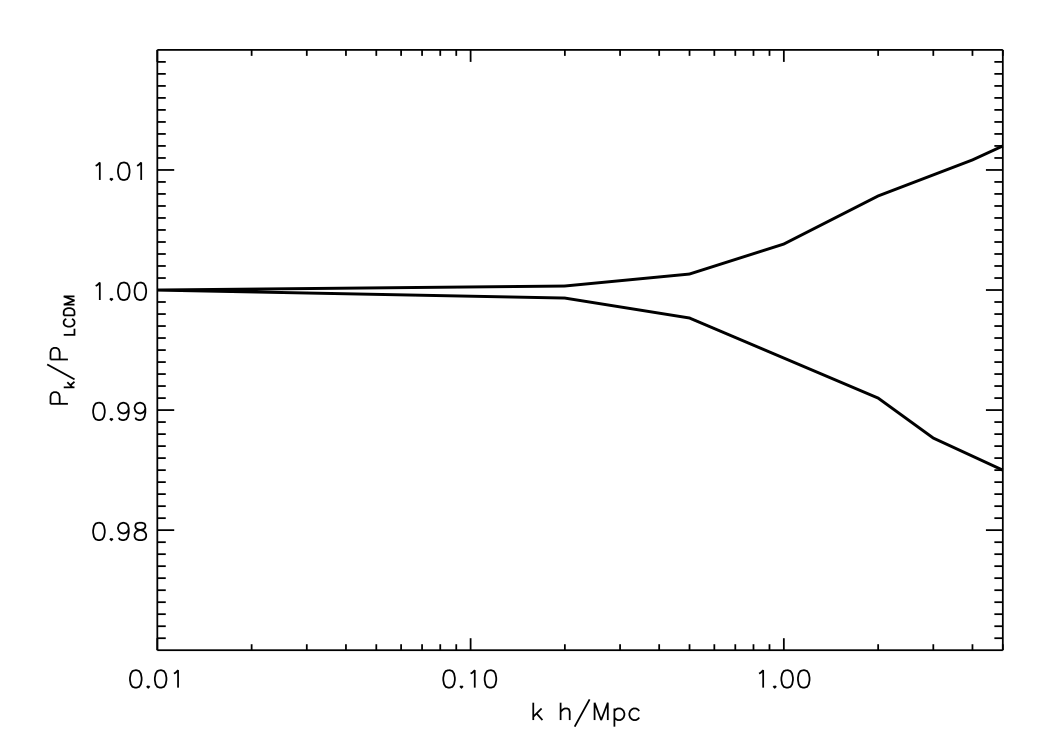
In Fig. 1 we show the allowed range of freedom in the small scale shape of the matter power spectrum obtained by the Kitching et al. (2016) reconstruction. The power spectrum on large (linear) scales is by construction imposed to be that of the Planck marginal best fit. At small scales the freedom allowed by the minimally parametric reconstruction results in an uncertainty band; the two solid lines indicate the 68% uncertainty range on the recovered power spectrum. Since we only recover the CFHTLenS spectrum up to Mpc-1, in what follows we assume that for larger -modes there is a sharp suppression of power; this is to study the best possible case for matching the observed low abundance of small mass halos. Note that the uncertainty in our recovered power spectrum is % even when leaving abundant freedom to the small-scale power. The linear power spectrum is recovered through a repeated forward procedure involving halo fit as explained above. Note that there is no extrapolation to Mpc-1 since in the halo fit procedure the non-linear produced by the recipe is always larger than the linear one. From this linear power spectrum we compute the predicted halo abundance as described in Section 2. Fig. 2 shows as a function of mass for a power law CDM power spectrum at all scales (for the best fit Planck parameters, as used in Fig. 1 and one cut at Mpc/h (as used for the CFHTLenS case here). As expected, we do observe a lack of fluctuations in the presence of the artificial small scales power cutoff imposed, in this case the suppression is drastic for halos masses below M⊙. No visible suppression can be seen above M⊙– where the missing satellite problem still persists. Hence by artificially cutting power above Mpc-1 we are being conservative.
In Fig. 3 we show the inferred cumulative abundance of objects above mass as a solid thick line; this is our main result. For comparison, we also show the observed cumulative number of halos in the Milky Way as a function of their inferred dark matter mass; the latter has been derived from the observed circular speed as , is the Newton constant and the Hubble parameter at collapse of the dark matter halo, which we adopt to be . Our observed cumulative number of halos follows the CDM prediction (dashed line) for halo masses M⊙. This is in contrast with the observed abundance in the Milky Way. Uncertainties due to uncertainties in the recovered shape of the matter power spectrum are not visible on this plot. Therefore, even in this example study on a relatively small data set, nearly up to Sagittarius mass scales there seems to be no lack of observed power in the CFHTLenS volume. In order to explore much smaller masses () we will need to extend our analysis to larger i.e., , however a straightforward extension of our approach to these small scales is computationally prohibitive (computation time scales like ); we will investigate this in future work.
4 Discussion and Conclusions
In this paper we have made the connection between inferences that are obtained from cosmic shear data on the total matter power spectrum on small-scales and the problem of the abundance of low mass galaxies. We point out that over large volumes, cosmic shear data can make a statistical statement on the small scale power and therefore on the issue of abundance of low mass galaxy fraction, and we use a recent result from current data as an example of the type of the analysis that can be used in this context.
Using the reconstructed small scales shape of the matter power spectrum obtained by Kitching et al. (2016) from the CFHTLenS survey, we have investigated if it is consistent with a suppression of small scale power, compared to the standard CDM power spectrum, sufficient to explain the “missing satellite problem”. The reconstructed power spectrum is used to infer the abundance of halos in the mass range . The reconstruction in Kitching et al. (2016) has substantial freedom at small scales, provided by the parameterisation of the baryonic feedback effects. The shape of the recovered power spectrum is allowed to deviate from the CDM one by 3% at the 95% confidence level. This is not sufficient to solve the missing satellites problem.
By using a standard CDM model for the collapse of halos, our measurement of the power spectrum provides estimates for the abundance of low mass galaxies assuming that gravity is the dominant force at play. To investigate the abundance of halos provided by this we used the standard tool of the conditional mass function – using the updated fitting formula by Bhattacharya et al. (2011). We found that, on average, the predicted abundance of low mass halos is in agreement with the CDM predictions down to masses of M⊙ in the CFHTLenS volume. In other words: a small-scale power suppression invoked to explain away the missing low mass sub-halos in the Milky Way and the local group is not supported by current data.
Seventeen years after the paper by Kamionkowski & Liddle (2000), who suggested that a suppression of dark matter power on small scales could ease the CDM dearth of dwarf galaxies problem, we point out how the power on those scales can be measured and a potential power suppression observationally constrained. In our approach, by observing the evolved power spectrum, we can also in principle constrain models of warm dark matter and not only a change in the primordial power spectrum.
In our analysis we allow for, in principle, a massive, although not sharp or discontinuous, small scale suppression. We keep the cosmology fixed to the Planck values; this simply defines the power spectrum at large scales. At small scales, where it matters for the small halo abundance, the reconstruction could have given us a massive suppression, but it did not: the allowed suppression is a maximum of (1%).
Most semi-analytic models of galaxy formation achieve a reconciliation between the observed and predicted abundance of low luminosity galaxies by drastically decreasing the baryon-to-dark matter fraction for faint galaxies. At present, there is no observational evidence from rotation curve modelling that low circular velocity disks are dark matter dominated (which would be the case if the baryon-to-dark matter fraction were very small). The alternative explanation is that our Local Group is a-typical and that its substructure abundance does not correspond to the mean of CDM halos distribution, but as cosmological simulations of the Hubble volume show (Fattahi et al., 2016) it is more a outlier.
Whilst other recent cosmic shear results, e.g. Troxel et al. (2017); Hildebrandt et al. (2017), do not include an explicit -mode dependancy, which makes comparison more involved, they nevertheless find that their results are consistent at the cosmological parameter inference level with the Planck cosmology (DES Collaboration et al., 2017; Efstathiou & Lemos, 2017) without significant suppression of small-scale power. With the caveat that further study of these data is required in order to determine robust conclusions, this implies that these results would support the conclusions drawn from the smaller data set we used here. However some recent galaxy-galaxy lensing measurements suggest a suppression of small-scale power Leauthaud et al. (2017). Given that a decade of observational effort in weak lensing surveys is coming to fruition, with major collaborations releasing the data (e.g., DES DES Collaboration et al. (2017), KiDS de Jong et al. (2015)), it is timely to point out how these data could bear on important open problems in cosmology and astrophysics, which may not have been among the original science drivers of the surveys.
In this short paper we have presented a first study on how to use the recovered matter power spectrum from cosmic shear data to constraint the abundance of small mass halos. Current and forthcoming surveys will provide a better control of systematic errors and cover larger volumes, thus allowing for a more thorough study of the small scale power spectrum of matter halos.
Acknowledgments
Funding for this work (RJ and LV) was partially provided by the Spanish MINECO under MDM-2014-0369 of ICCUB (Unidad de Excelencia “Maria de Maeztu") and by MINECO grant AYA2014-58747-P AEI/FEDER UE. LV acknowledges support of H2020 ERC 725327 BePreSysE project. TDK is supported by a Royal Society University Research Fellowship. We thank Alan Heavens for useful discussions.
References
- Bhattacharya et al. (2011) Bhattacharya S., Heitmann K., White M., Lukić Z., Wagner C., Habib S., 2011, ApJ, 732, 122
- Blanton et al. (2001) Blanton M. R., et al., 2001, AJ, 121, 2358
- Bode, Ostriker, & Turok (2001) Bode P., Ostriker J. P., Turok N., 2001, ApJ, 556, 93
- Boyarsky et al. (2009) Boyarsky A., Lesgourgues J., Ruchayskiy O., Viel M., 2009, JCAP, 5, 012
- Bullock (2010) Bullock J. S., 2010, arXiv, arXiv:1009.4505
- Colín, Avila-Reese, & Valenzuela (2000) Colín P., Avila-Reese V., Valenzuela O., 2000, ApJ, 542, 622
- Côté, West, & Marzke (2002) Côté P., West M. J., Marzke R. O., 2002, ApJ, 567, 853
- Dalal & Kochanek (2002) Dalal N., Kochanek C. S., 2002, ApJ, 572, 25
- DES Collaboration et al. (2017) DES Collaboration, Abbott, T. M. C., Abdalla, F. B., et al. 2017, arXiv:1708.01530
- Diaz Rivero et al. (2017) Diaz Rivero, A., Cyr-Racine, F.-Y., & Dvorkin, C. 2017, arXiv:1707.04590
- Diemand et al. (2008) Diemand J., Kuhlen M., Madau P., Zemp M., Moore B., Potter D., Stadel J., 2008, Natur, 454, 735
- Dobler & Keeton (2006) Dobler G., Keeton C. R., 2006, MNRAS, 365, 1243
- Efstathiou & Lemos (2017) Efstathiou, G., & Lemos, P. 2017, arXiv:1707.00483
- Erben et al. (2013) Erben T., et al., 2013, MNRAS, 433, 2545
- Fattahi et al. (2016) Fattahi A., et al., 2016, MNRAS, 457, 844
- Heymans et al. (2013) Heymans, C., Grocutt, E., Heavens, A., et al. 2013, MNRAS, 432, 2433
- Hezaveh et al. (2013) Hezaveh, Y., Dalal, N., Holder, G., et al. 2013, ApJ, 767, 9
- Hezaveh et al. (2016a) Hezaveh, Y. D., Dalal, N., Marrone, D. P., et al. 2016, ApJ, 823, 37
- Hezaveh et al. (2016b) Hezaveh, Y., Dalal, N., Holder, G., et al. 2016, JCAP, 11, 048
- Hildebrandt et al. (2013) Hildebrandt H., et al., 2013, MNRAS, 429, 3230
- Hildebrandt et al. (2017) Hildebrandt, H., Viola, M., Heymans, C., et al. 2017, MNRAS, 465, 1454
- Hopkins et al. (2013) Hopkins P. F., Cox T. J., Hernquist L., Narayanan D., Hayward C. C., Murray N., 2013, MNRAS, 430, 1901
- Jenkins et al. (2001) Jenkins A., Frenk C. S., White S. D. M., Colberg J. M., Cole S., Evrard A. E., Couchman H. M. P., Yoshida N., 2001, MNRAS, 321, 372
- Jimenez et al. (1997) Jimenez R., Heavens A. F., Hawkins M. R. S., Padoan P., 1997, MNRAS, 292, L5
- de Jong et al. (2015) de Jong, J. T. A., Verdoes Kleijn, G. A., Boxhoorn, D. R., et al. 2015, A&A, 582, A62
- Kamionkowski & Liddle (2000) Kamionkowski M., Liddle A. R., 2000, PhRvL, 84, 4525
- Kitching et al. (2016) Kitching, T. D., Verde, L., Heavens, A. F., & Jimenez, R. 2016, MNRAS, 459, 971
- Kitching et al. (2014) Kitching, T. D., Heavens, A. F., Alsing, J., et al. 2014, MNRAS, 442, 1326
- Klypin et al. (1999) Klypin A., Kravtsov A. V., Valenzuela O., Prada F., 1999, ApJ, 522, 82
- Lawrence et al. (2010) Lawrence E., Heitmann K., White M., Higdon D., Wagner C., Habib S., Williams B., 2010, ApJ, 713, 1322
- Lawrence et al. (2017) Lawrence E., Heitmann K., Kwan, J., Upadhye, A., Bingham,Habib S., D., Higdon D., Pope, A., Finkel, H., Frontiere, N., 2017, arXiv:1705.03388
- Leauthaud et al. (2017) Leauthaud, A., Saito, S., Hilbert, S., et al. 2017, MNRAS, 467, 3024
- Mandelbaum et al. (2006) Mandelbaum R., Seljak U., Kauffmann G., Hirata C. M., Brinkmann J., 2006, MNRAS, 368, 715
- Menci et al. (2017) Menci N., Giallongo E., Grazian A., Paris D., Fontana A., Pentericci L., 2017, arXiv, arXiv:1706.04360
- Miller et al. (2013) Miller L., et al., 2013, MNRAS, 429, 2858
- Moore et al. (1999) Moore B., Ghigna S., Governato F., Lake G., Quinn T., Stadel J., Tozzi P., 1999, ApJ, 524, L19
- Panter, Heavens, & Jimenez (2004) Panter B., Heavens A. F., Jimenez R., 2004, MNRAS, 355, 764
- Planck Collaboration et al. (2015) Planck Collaboration, et al., 2015, arXiv, arXiv:1502.01589
- Read et al. (2017) Read, J. I., Iorio, G., Agertz, O., & Fraternali, F. 2017, MNRAS, 467, 2019
- Smith et al. (2003) Smith R. E., et al., 2003, MNRAS, 341, 1311
- Springel et al. (2008) Springel V., et al., 2008, MNRAS, 391, 1685
- Strigari et al. (2007) Strigari L. E., Bullock J. S., Kaplinghat M., Diemand J., Kuhlen M., Madau P., 2007, ApJ, 669, 676
- Takahashi et al. (2012) Takahashi, R., Sato, M., Nishimichi, T., Taruya, A, Oguri, M., 2012,, ApJ, 761, 152
- Troxel et al. (2017) Troxel, M. A., MacCrann, N., Zuntz, J., et al. 2017, arXiv:1708.01538
- Vegetti et al. (2012) Vegetti S., Lagattuta D. J., McKean J. P., Auger M. W., Fassnacht C. D., Koopmans L. V. E., 2012, Natur, 481, 341
- Vegetti et al. (2014) Vegetti S., Koopmans L. V. E., Auger M. W., Treu T., Bolton A. S., 2014, MNRAS, 442, 2017
- Verde, Oh, & Jimenez (2002) Verde L., Oh S. P., Jimenez R., 2002, MNRAS, 336, 541
- Viel et al. (2008) Viel M., Becker G. D., Bolton J. S., Haehnelt M. G., Rauch M., Sargent W. L. W., 2008, PhRvL, 100, 041304
- Zentner & Bullock (2003) Zentner A. R., Bullock J. S., 2003, ApJ, 598, 49