Amplified Sensitivity of Nitrogen-Vacancy Spins in Nanodiamonds using
All-Optical Charge Readout
Abstract
Nanodiamonds containing nitrogen-vacancy (NV) centers offer a versatile platform for sensing applications spanning from nanomagnetism to in-vivo monitoring of cellular processes. In many cases, however, weak optical signals and poor contrast demand long acquisition times that prevent the measurement of environmental dynamics. Here, we demonstrate the ability to perform fast, high-contrast optical measurements of charge distributions in ensembles of NV centers in nanodiamonds and use the technique to improve the spin readout signal-to-noise ratio through spin-to-charge conversion. A study of 38 nanodiamonds, each hosting 10-15 NV centers with an average diameter of 40 nm, uncovers complex, multiple-timescale dynamics due to radiative and non-radiative ionization and recombination processes. Nonetheless, the nanodiamonds universally exhibit charge-dependent photoluminescence contrasts and the potential for enhanced spin readout using spin-to-charge conversion. We use the technique to speed up a relaxometry measurement by a factor of five.
pacs:
Valid PACS appear hereI Introduction
Nitrogen-vacancy (NV) centers embedded in nanodiamonds combine the advantages of an optically-addressable, room-temperature spin qubit Awschalom et al. (2013) with the nanoscale dimensions and flexible surface chemistry of diamond nanoparticles Mochalin et al. (2012); Schirhagl et al. (2014). Recent proof of concept demonstrations of their quantum sensing capabilities include magnetic Le Sage et al. (2013) and thermal Kucsko et al. (2013) imaging in living cells; detection of electrochemical potentials Grotz et al. (2012); Petrakova et al. (2015); Karaveli et al. (2016), paramagnetic molecules Steinert et al. (2013); Tetienne et al. (2013), and pH levels Rendler et al. (2017) in solution; and investigations of ferromagnetism on the nanoscale Rondin et al. (2013); Pelliccione et al. (2016); Tetienne et al. (2016); Andrich et al. (2017). All of these sensing modalities demand strong interactions between NV qubits and a target environment outside the diamond, for which nanoparticles are ideal. However, high impurity levels and uncontrolled surface states in nanodiamonds Chang et al. (2008); Dantelle et al. (2010) degrade the NV’s spin and charge stability compared to the situation in bulk diamond, leading to signal averaging issues and limited sensitivity for nanodiamonds due to poor optical contrast for charge Karaveli et al. (2016) and spin Bogdanov et al. (2017) readout by photoluminescence (PL) techniques.
In conventional PL-based spin readout, an intense probe produces slightly more PL photons for the NV’s ground-state spin sublevel as compared to for the first of illumination. However, recently established spin-to-charge conversion (SCC) protocols offer a more flexible approach Hopper et al. (2016); Shields et al. (2015). SCC utilizes the intersystem crossing dynamics of the NV- excited state to protect one spin state from an intense ionization pulse, leading to a spin-dependent charge distribution. A subsequent charge-selective optical pulse detects the resulting distribution, with the potential for dynamical tuning of power and duration for optimum efficiency D’Anjou et al. (2016).
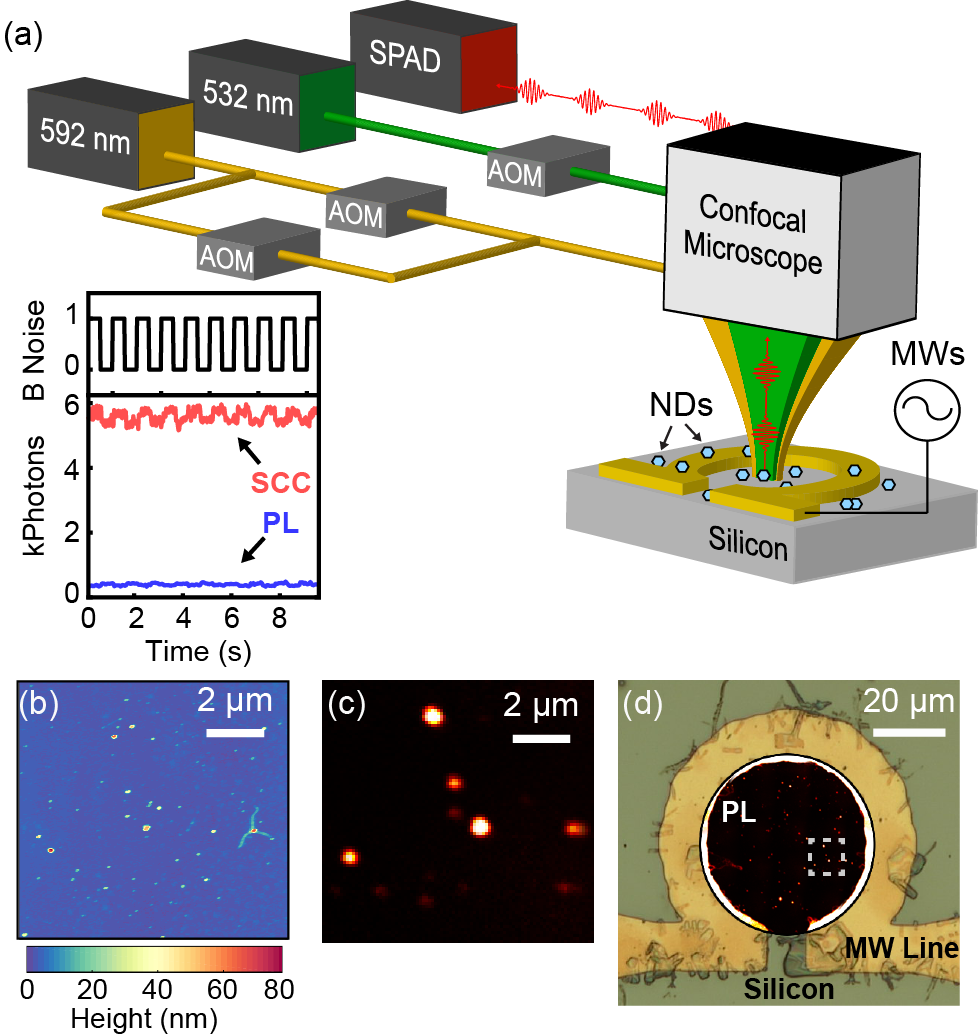
Here, we present all-optical protocols for high-contrast charge readout and SCC of NV ensembles in nanodiamonds as a means for boosting the signal-to-noise ratio (SNR) for charge and spin measurements as compared to conventional PL techniques, as seen in Fig. 1(a). An investigation of the optically induced charge dynamics suggests that NVs in nanodiamonds milled from type Ib high-pressure, high-temperature (HPHT) diamond are prone to multiple non-radiative ionization (negative to neutral) and recombination (neutral to negative) pathways that are not observed in bulk, type IIa diamond. We attribute these dynamics to tunneling transitions involving nearby impurity sites. Despite these complications, we confirm on a sample of 38 individual nanodiamonds and several larger nanodiamond ensembles that high-contrast charge readout and SCC protocols, which to date have only been demonstrated in high-purity bulk diamond Hopper et al. (2016); Shields et al. (2015), are still feasible and advantageous for quantum sensing protocols.
For single NVs in bulk, type IIa diamond, strong charge-dependent optical contrasts facilitate high-fidelity, single-shot measurements of the NV’s charge state Waldherr et al. (2011a); Aslam et al. (2013); Hopper et al. (2016). These measurements rely on the large energy difference in the zero phonon lines of the neutral charge state (NV0, ) and the negative charge state (NV-, ) as well as the fact that the ionization and recombination mechanisms are two-photon processes Waldherr et al. (2011b). Recently, charge readout has been extended to ensembles of NVs in type Ib bulk diamond Dhomkar et al. (2016); Jayakumar et al. (2016), which is typically used to produce nanodiamonds with NV centers Chang et al. (2008); Dantelle et al. (2010). Charge dynamics in bulk type Ib diamond are complicated by impurity-related charge transfer mechanisms Manson and Harrison (2005); Jayakumar et al. (2016), and the situation in nanodiamonds is even less well understood. A few studies have aimed to maximize the NV- population under continuous illumination Rondin et al. (2010); Havlik et al. (2013); Berthel et al. (2015) or to measure charge-dependent stimuli using nanodiamonds Petrakova et al. (2015); Karaveli et al. (2016). Improved charge readout techniques could vastly improve the sensitivity of such measurements.
High-contrast charge readout is a prerequisite of SCC protocols for enhanced spin readout Shields et al. (2015); Hopper et al. (2016). Here we consider all-optical readout, although electrical charge measurements are also possible when the NVs are incorporated in a junction structure Hrubesch et al. (2017); Gulka et al. (2017); Brenneis et al. (2015). For all-optical SCC, the charge readout produces larger SNR for longer readout times. Thus, applications with long measurement cycles, such as sensing schemes, stand the most to gain from spin SNR improvements. NV relaxometry has enabled gadolinium-based biological sensing Pelliccione et al. (2014); Schirhagl et al. (2014); Rendler et al. (2017), direct imaging of nanoscale magnetism Schmid-Lorch et al. (2015); Tetienne et al. (2016); Pelliccione et al. (2016), as well as microwave-free nanoscale electron spin resonance Hall et al. (2016) due to the ground state spin’s sensitivity to fast fluctuating magnetic fields Steinert et al. (2013); Tetienne et al. (2013). Since the times of NVs in nanodiamonds can take values ranging from to Tetienne et al. (2013), measurement acquisition times can vary over three orders of magnitude depending on the NV under study. A striking example of this signal averaging bottleneck is the recent demonstration of scanning relaxometry imaging Tetienne et al. (2016), which demands dwell time per -wide pixel, resulting in wide scans taking 150 minutes to acquire.
II Results
Fluorescent nanodiamonds milled from HPHT Ib diamond (Adámas Nanotechnologies) were drop cast onto silicon substrates patterned with titanium gold wires for microwave control [Fig. 1(a)]. The concentration of the nanodiamond solution was chosen to limit particle aggregation such that isolated nanodiamonds could be resolved in a confocal microscope using () excitation and PL collection. The presence of single and few nanodiamonds was confirmed by comparing atomic force microscope (AFM) scans [Fig. 1(b)] with 2D confocal PL scans [Fig. 1(c)]. The AFM scans in Fig. 1(b) exhibit a height distribution spanning , in agreement with the vendor’s specification. According to the vendor, each nanodiamond contains 10-15 NVs, although the variation in PL brightness across nanodiamonds suggests a broader distribution Sup . In addition to the pump laser, a continuous-wave () laser is split into two arms for independent power and timing control and subsequently recombined with the excitation path [Fig. 1(a)] for use as a pump or probe for charge state control and measurement. Collected PL was spectrally filtered between and to suppress emission originating from the NV0 charge state and directed to a single-photon avalanche diode. The collected PL signal, , defined as the time-dependent photon detection rate as a function of the probe duration, , is proportional to the population of NV centers in the negative charge state. Further details on the sample preparation and measurement setup can be found in the supplemental information Sup .
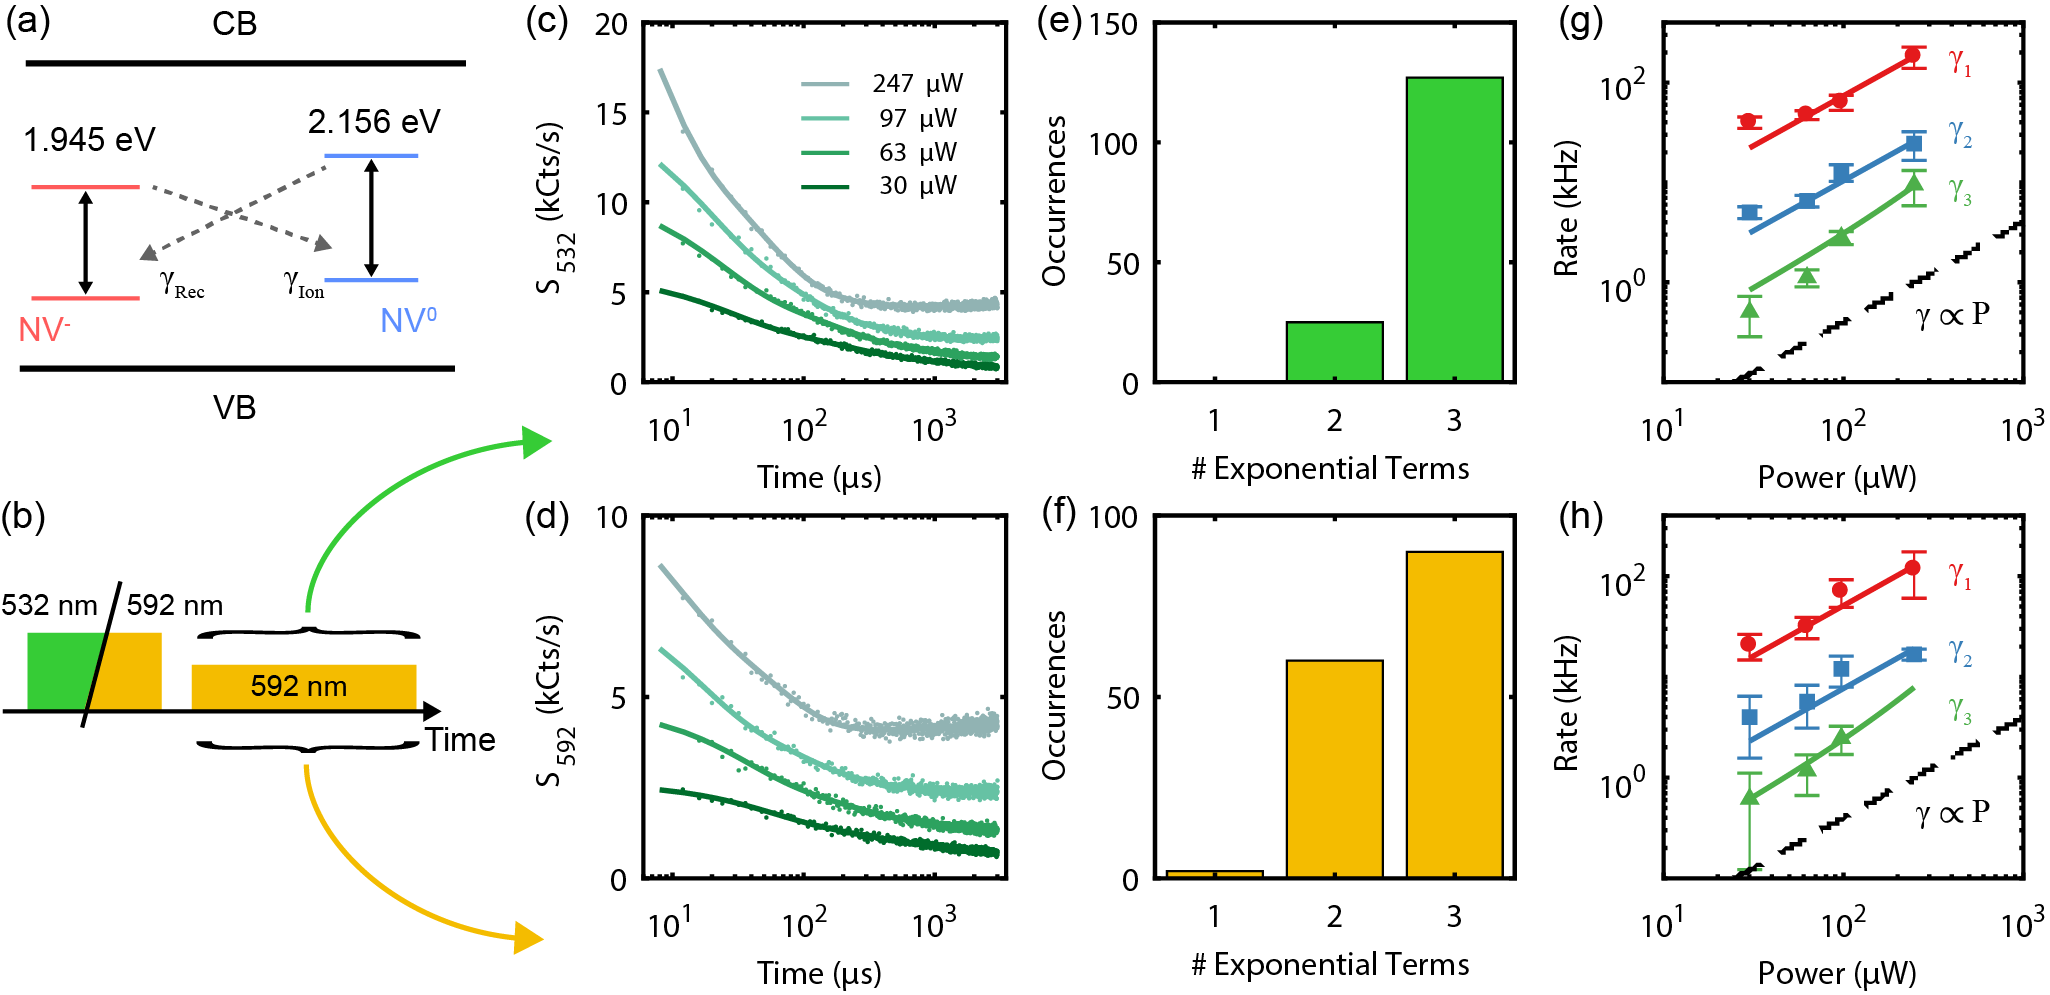
To study the optically induced charge dynamics of the NV ensembles in nanodiamonds, we preferentially populate either the NV- or NV0 charge states using or pump beams, respectively Aslam et al. (2013), and read out the resulting NV- population with a low-power probe beam. Figure 2 summarizes the results of these measurements, in which different initial conditions and probe powers serve to map out the dynamical response due to different ionization and recombination mechanisms [Fig. 2(a)]. The timing sequence is depicted in Fig. 2(b), and the time-correlated PL response due to four different probe intensities following pumping by either and light are shown in Figs. 2(c) and 2(d), respectively. These representative data exhibit multi-timescale and occasional non-monotonic behavior that is observed to varying degrees across all 38 nanodiamonds in this study Sup .
We fit all of the data to an empirical multi-exponential function of the form:
| (1) |
where signifies initialization by green or orange pump beams and is the number of exponential terms. The Akaike Information Criterion is used to determine the value of required to best represent the observed data Spiess and Neumeyer (2010); Sup . We find that all of the measurements for 38 nanodiamonds can be fit as either single (), bi- (), or tri-exponential () functions with the coefficient labels ordered such that . The solid lines in Figs. 2(c, d) are examples of fits using a tri-exponential model. The distribution of optimized exponential number () for a total of 152 time-correlated probe responses for both and pump conditions are shown in Figs. 2(e, f), respectively. In a majority of cases, the tri-exponential model most accurately recreates the data. The relative increase of bi-exponential cases with a pump is presumably due to a larger portion of the NVs already close to the steady state following initialization with the same wavelength, which simplifies the dynamics. Nevertheless, the fact that dynamical behavior is observed at all following initialization is indicative of power-dependent ionization and recombination processes and charge relaxation in the dark, likely due to the lower thermodynamic stability of NV0 compared to NV- Gaebel et al. (2006). The empirical multi-exponential model accounts for these multiple competing processes and for the fact that each nanodiamond contains an ensemble of NVs with different local environments due to the proximity of surfaces and other impurity states Jayakumar et al. (2016).
A closer look at the fit results provides insight into the ionization and recombination mechanisms of the NV ensembles. Figures 2(g) and 2(h) display the best-fit rates as a function of laser power for the data in Figs. 2(c) and 2(d), respectively. Since the probe intensities are maintained below 6% of the saturation power (), we expect the rates to exhibit a polynomial power dependence whose order depends on the number of photons involved in each ionization or recombination process Waldherr et al. (2011b). In contrast to the case for single NVs in bulk, type IIa diamond, where ionization and recombination requires at least two photons with a wavelength of Waldherr et al. (2011b); Aslam et al. (2013); Hopper et al. (2016), we observe a non-negligible linear component in the power scaling for all rates and initial conditions. The linear term points to the existence of a single-photon ionization or recombination mechanism. Similar behavior has been observed for NV ensembles in bulk, type-Ib diamond Manson and Harrison (2005), where it is believed to result from tunneling of an electron or hole from the NV excited state to a nearby substitutional nitrogen trap Zvyagin and Manson (2012). By computing the excitation rate from a saturation curve, we estimate that 3% of all cycling events result in a non-radiative tunneling event.
Despite the complicated dynamics, pumping with or illumination still produces large differences in the charge populations that can be read out optically. Fig. 3(a) depicts how the different charge distributions manifest as a signal contrast within the time-correlated PL of a representative nanodiamond. Along with the photon counting data, we plot the corresponding single-shot charge measurement SNR as a function of readout duration, which is defined by
| (2) |
where is the total number of photons detected after probe duration following initialization with wavelength . Here we assume the noise is dominated by photon shot noise. The SNR initially increases with as more photons are detected but eventually reaches a maximum before decreasing as the contrast vanishes and shot noise takes over.
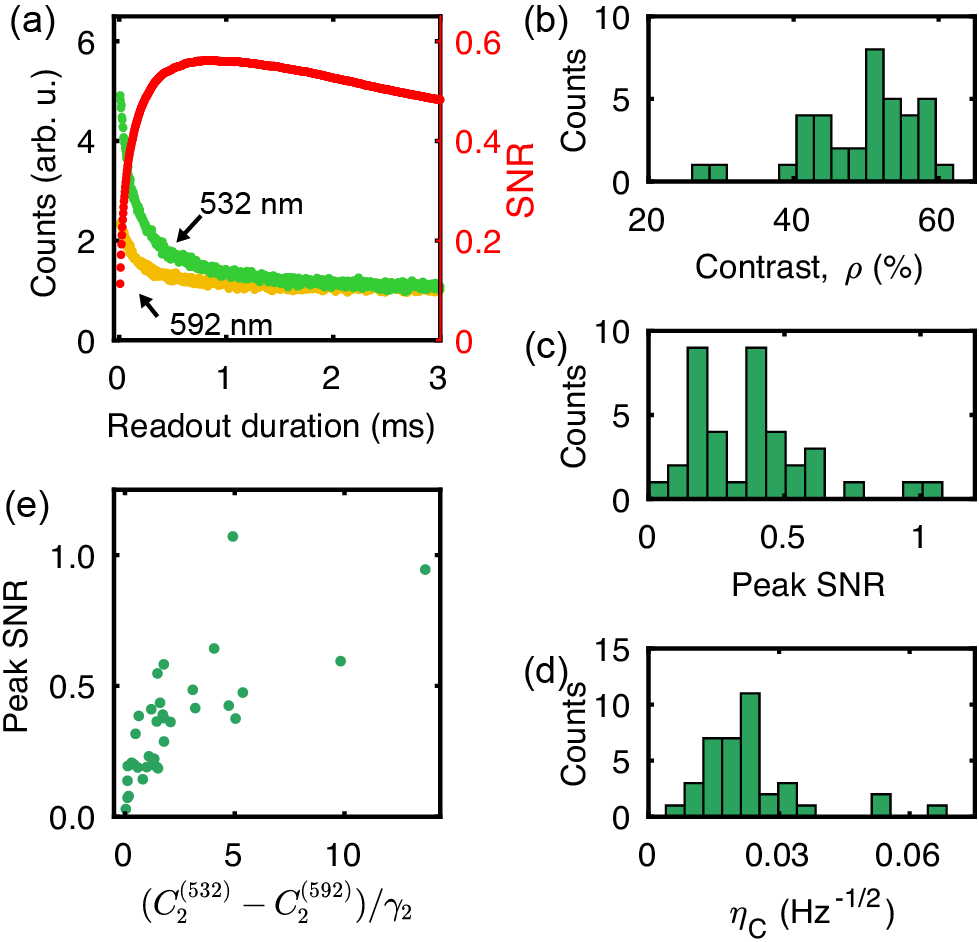
To investigate the universality of this charge readout mechanism, in Figs. 3(b-d) we plot the statistical distributions of various performance metrics calculated from the set of measurements on 38 nanodiamonds summarized in Fig. 2. For each nanodiamond, we calculate the initial optical contrast at the lowest probe power,
| (3) |
which reflects the difference in initial charge population. The distribution of , seen in Fig. 3(b), exhibits a narrow peak around the mean contrast of . Notably, all of the observed values are lower than the ideal contrast of expected for NVs in bulk, type-IIa diamond Aslam et al. (2013). We attribute this difference to the finite duration of our measurements and the more complicated local environment of NVs in nanodiamonds. Nonetheless, every nanodiamond we studied exhibits a strong optical charge contrast. Figure 3(c) shows the distribution of peak single-shot SNR values, optimized for readout power and duration. Here we find a much wider distribution with a mean SNR . This large spread of values is not surprising given the widely varying nanodiamond brightness due to different NV ensemble sizes, together with variations in the charge dynamics during readout due to different local environments. Finally, for each nanodiamond we also calculate the time-averaged charge readout sensitivity,
| (4) |
Here we assume that the readout time, , and the probe power are optimized to provide the maximum single-shot SNR. The charge sensitivity has units of , and, assuming shot noise dominates the measurement uncertainty, dividing by the square root of the total integration time, , yields the minimum resolvable signal variation, . The distribution of charge sensitivities is displayed in Fig. 3(d). Twenty of the nanodiamonds surveyed exhibit , meaning that we can resolve 2% signal variations after one second of integration. Remarkably, despite the wide qualitative variation of optically induced charge dynamics, all nanodiamonds observed in this study showed contrasts between and and charge sensitivity better than 0.07 .
The qualitative variations of charge dynamics and distribution of charge readout performance metrics are not independent of each other. For example, a better charge measurement intuitively requires both a larger contrast to increase the signal amplitude and slower decay rates to allow for more detected photons. To test this hypothesis, we searched for correlations between metrics such as peak SNR, contrast, and sensitivity and particular parameters of our empirical models Sup . Interestingly, the parameters most predictive of performance are the amplitude difference, , and rate, , of the second exponential term in Eqn. 1. Figure 3(e) displays the strong correlation between the peak SNR and a combined figure of merit, . This analysis confirms our physical intuition and also offers an effective means of screening nanodiamonds for optimal performance as charge sensors.
The availability of a high-contrast charge measurement for nanodiamonds is crucial to achieve performance advantages using SCC readout protocols. Figures 4(a) and 4(b) compare the mechanisms for spin readout using traditional PL and SCC, respectively. PL readout results from optically cycling the triplet manifold of NV-, typically using a pump, which causes the spin projection to produce more photons (bright state) as compared to the projection which is shelved via the intersystem crossing into the metastable singlet (dark state). The essence of SCC is a timed optical pulse sequence that transfers the initial spin populations into either the triplet manifold (for ) or the singlet manifold (for ) and then quickly ionizes the population selectively from one manifold or the other Shields et al. (2015); Hopper et al. (2016). Following this SCC procedure, a low-intensity, charge-selective probe pulse ( in this work) detects the NV- population. Thus, the optical charge readout signal is correlated to the NV’s initial spin state.
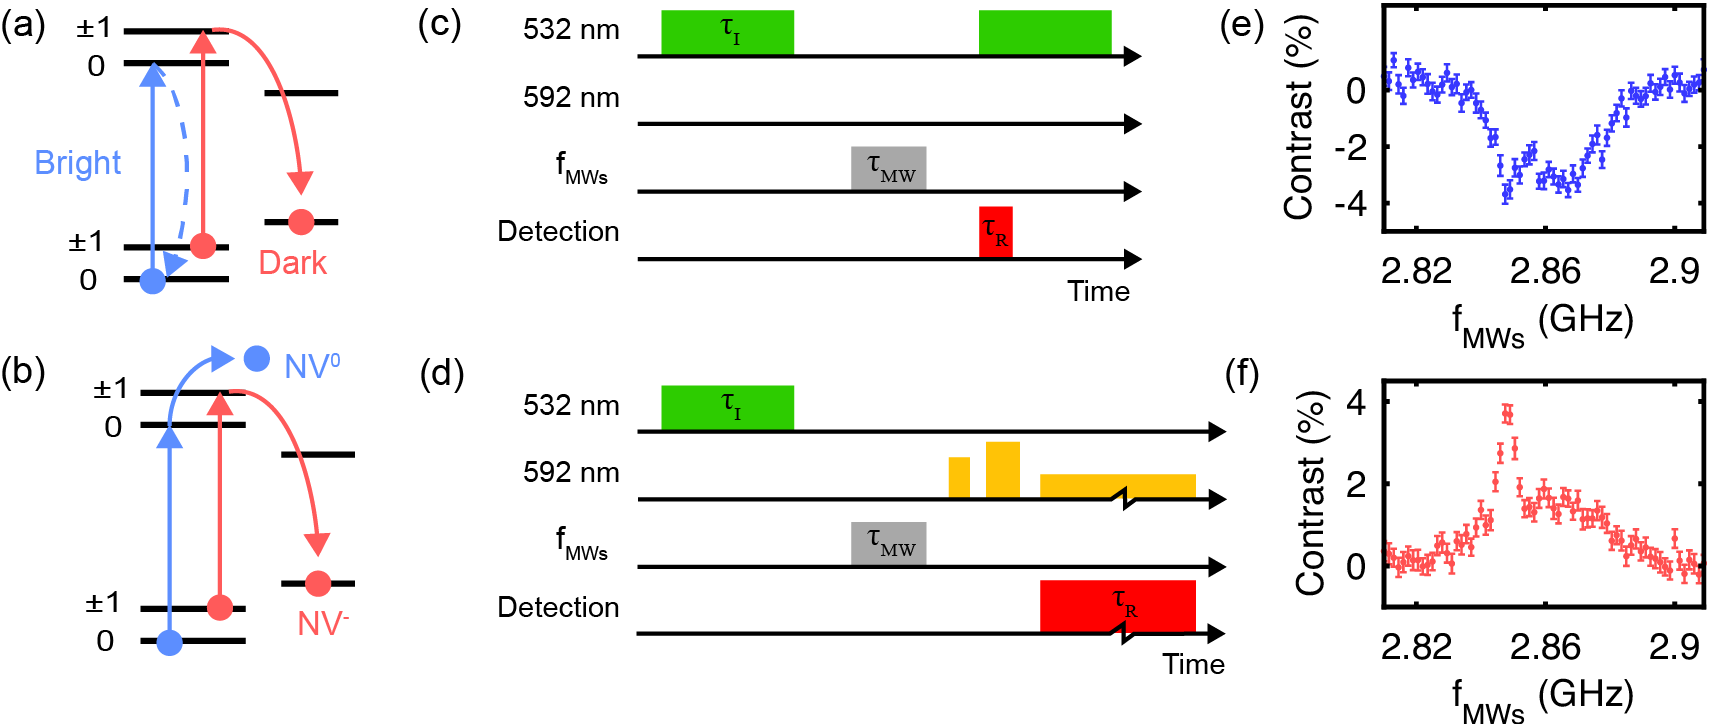
To verify the SCC mechanism in nanodiamonds, we performed pulsed electron spin resonance (ESR) measurements on a nanodiamond at zero magnetic field. The measurement timing diagrams for PL and SCC readout techniques are sketched in Figs. 4(c) and 4(d), respectively. Both measurement sequences begin with a , pump pulse to initialize the ensemble primarily into NV- and . A weak, variable-frequency microwave pulse with a duration exceeding the inhomogeneous dephasing time () is then applied to probe the ground state spin transition. In the case of PL readout, a second pulse is applied and photons are detected for the first . For SCC, two pulses of light (a shelving pulse followed later by a ionization pulse) Sup are applied to perform the conversion process outlined in Fig. 4(b). Due to the finite rise time of the AOM used to generate these pulses, the power of the shelving pulse is lower than that of the ionization pulse. The same SCC pulse parameters were used for all nanodiamonds in this work. Finally, a , probe pulse is applied with photon detection during the entire duration. Both SCC pulses are derived from one arm of the laser path shown in Fig. 1(a) whereas the lower-power probe pulse is generated in the second arm. The results are presented in Figs. 4(e) and 4(f) for PL and SCC readout, respectively. Both spin measurement techniques show the typical response characterizing an NV ensemble with strong inhomogeneous broadening, confirming that SCC does indeed measure the spin state. The qualitative difference in curve shapes suggests that different NVs within the nanodiamond exhibit variations in their charge readout and SCC responses.
In order to quantify the potential improvement offered by SCC, we studied its spin readout performance in comparison to traditional PL. We calibrated the optimal measurement parameters for PL readout, and found that, in contrast to the situation in bulk diamond where optical excitation close to saturation is preferred, the optimal readout pulse was tuned to a factor of 4 below the saturation power for a duration of Sup . This observation agrees with other recent measurements of reduced spin SNR for NVs in nanodiamonds on sapphire substrates Bogdanov et al. (2017). The non-NV PL contributes background levels of the signal at the optimum spin readout power, so this cannot explain the anomalous SNR decrease. We believe the more complicated ionization and recombination mechanisms are the primary cause of this SNR decrease, since the probabilities of non-radiative charge transitions from the NV- excited state are comparable to those for the intersystem crossing Goldman et al. (2015).
Figure 5(a) shows the resulting single-shot spin SNR for a single nanodiamond as a function of the probe pulse intensity () and duration (). This particular nanodiamond has favorable charge and spin properties, with a peak charge-detection SNR and spin Sup . We observe that SCC out-performs PL readout whenever , with a factor of 3.8 improvement in SNR for . As in the case of charge readout, for time-averaged measurements this presents an optimization tradeoff between the single-shot SNR and measurement duration. Therefore, in analogy to eqn. (4), we calculate the time-averaged spin-readout sensitivity,
| (5) |
where is the single-shot spin SNR at a given readout duration, , and power, . Here we must include the total duration of the measurement sequence, composed of the constant initialization time, , and the variable waiting time (or, more generally, the spin-operation time), , in addition to . Fig. 5(b) depicts how the quantity varies over the two dimensional measurement parameter space consisting of and , once has already been optimized. The red line tracing the ridge of the surface provides a visual indicator of the measured optimized experimental settings.
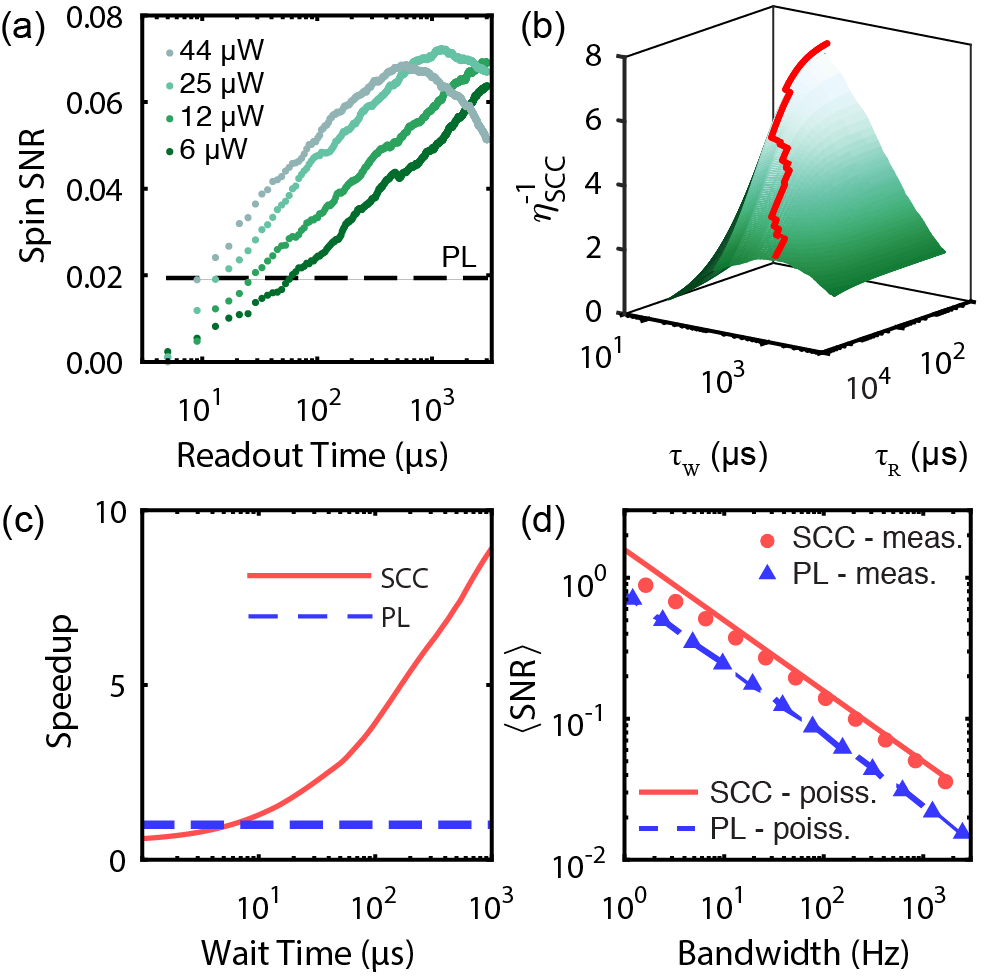
Using this analysis, we can make a direct comparison between the performance of SCC and traditional PL protocols. The PL readout sensitivity, , is calculated in a similar manner to eqn. (5), except we assume the readout power and duration remain fixed at their single-shot optimal values. Then we calculate the speedup factor, i.e., the ratio of acquisition times required to achieve a common time-averaged SNR,
| (6) |
The results of this analysis for the nanodiamond investigated are plotted in Fig. 5(c). The break-even wait time, when , occurs when , and by the speedup has reached a factor of 5. Physically, this increase stems from the dynamics governing charge readout, which allows for long acquisition times and thus a large number of detected photons in each shot. In principle, will increase with to a saturated value determined by the squared ratio of the single-shot SNRs ( in this case). In practice, however, the range of useful values for is limited by the sensing protocol of interest and ultimately by the spin lifetime.
To demonstrate performance improvements in a practical setting, we performed spin relaxometry measurements in which a fixed wait time of was used to sense magnetic disturbances in the local environment Tetienne et al. (2013). The target signal consisted of low-power microwaves driven through the lithographic wire at to simulate the presence of fast fluctuating magnetic fields around the nanodiamond. The presence of the microwaves reduces by more than an order of magnitude Sup . Using the optimized SCC settings of and , we performed differential relaxometry measurements, comparing the signal with the microwaves on and off, for a range of total measurement bandwidths, , where is the total measurement time. At each bandwidth, the time-averaged signal-to-noise ratio, , was calculated from the mean differential photon-counting signal, , and the corresponding standard deviation, , for each technique. This procedure was repeated 11 times to obtain statistics on the measured . The results are plotted in Fig. 5(d) along with the predicted variation of assuming only Poissonian noise contributions. We observe an improvement from the SCC protocol by a factor corresponding to a speedup of , nearly independent of bandwidth. Interestingly, while the measurements agree closely with the shot-noise prediction for the PL protocol, the model including only Poissonian noise overestimates for the SCC protocol by 8. We attribute this slight difference to additional noise introduced by the binomial nature of the SCC process Shields et al. (2015); Hopper et al. (2016), although the effect is less prominent here compared to the case of single NVs due to inherent averaging over the ensemble of probed NVs. The slight decrease of SNR for bandwidths is due to additional set up noise associated with the laser.
Similar measurements to those previously described on large nanodiamond agglomerates containing several hundred NVs attest to the universality of the SCC protocol. The supplementary information Sup includes SCC calibration curves like Fig. 5 for such agglomerates, and Fig. 1(a) depicts the amplification effect corresponding to a factor of 2.2 SNR improvement (factor of 5 speedup) for an agglomerate containing 100 NVs and for .
III Discussion
The techniques described in this paper can be used to improve various schemes for nanoscale sensing using NVs in nanodiamonds. The optical charge readout technique can readily be applied to measuring variations in the electrochemical potential surrounding nanodiamonds, produced for example by using an electro-chemical cell Karaveli et al. (2016) or functional groups on the nanodiamond surface Petrakova et al. (2015). One potential future application of electrochemical sensing is the detection of neuron action potentials, which have amplitudes and millisecond durations. Comparing the time-averaged SNR measured by Karaveli et al. Karaveli et al. (2016) using PL to our high-contrast charge measurements, we predict a factor of 5 improvement in charge sensitivity, corresponding to a factor of 25 speedup and the ability to detect milliVolt-scale variations in electrochemical potential on millisecond timescales. This can offer a microwave-free alternative to emerging techniques for action-potential sensing using NV ensembles in bulk diamond Barry et al. (2016) and the potential to extend these imaging modalities to in-vivo studies. Future investigations of nanodiamond charge dynamics could employ more sophisticated optical pulse sequences, in which either the dark charge dynamics or the changes in steady state populations are measured quickly with large contrast to gain additional readout enhancements.
The improvements in spin readout using SCC offer a means to further improve nanodiamond magnetic sensing protocols, particularly for relaxometers where the spin-evolution time is long. For example, the factor of 5 speedup for sensing exhibited in Fig. 5(d) would reduce the total acquisition time of the 2D relaxometry images demonstrated by Tetienne et al. Tetienne et al. (2016) from 150 minutes to 30 minutes. These throughput improvements allow for the ability to measure more samples and also reduce the experimental complexity required to keep the imaging optics and sample stationary for such long periods of time. These results also motivate the investigation of other diamond NV platforms, such as bulk ensembles, shallow implanted NVs, and NVs coupled to waveguides or other photonic structures, which could achieve spin readout enhancements through the use of the time-averaged SCC protocol presented here. Recent results involving the coupling of NVs to nearby nuclear spins in nanodiamonds Knowles et al. (2016a, b) also suggest that longer spin operation times will be required, which will further motivate the adoption of SCC to other NV-nanodiamond measurements. The promising improvement of times for shallow NVs Fávaro de Oliveira et al. (2017) suggests that these platforms will invariably encounter signal averaging issues as well, at which point SCC can offer major improvements.
IV Conclusion
We have developed all-optical protocols to amplify the charge and spin readout signals of NV ensembles in nanodiamonds for quantum sensing applications. A preliminary study of the optically induced charge dynamics suggests that the local environment of each NV within a given nanodiamond modulates the dynamics. Additional ionization and recombination mechanism that are not present for single NVs in high-purity diamond are consistent with the idea of tunneling between the NV excited state and nearby charge traps, although the intriguing dark dynamics warrants further investigation. A sampling of 38 nanodiamonds demonstrated the universality of high-contrast charge readout for these particles. We further demonstrated a simplified two-color SCC protocol for nanodiamonds that provides spin readout enhancements in the context of a relaxometry measurement, resulting in a factor of 5 reduction in measurement acquisition time. These results provide a straightforward method for improving state-of-the-art quantum sensors beyond the limits already achieved using conventional PL spin readout. Furthermore, the improved sensing of electrochemical potentials motivates the development of nanodiamond charge sensors for measuring action potentials and local chemical potentials in-vivo.
References
- Awschalom et al. (2013) D. D. Awschalom, L. C. Bassett, A. S. Dzurak, E. L. Hu, and J. R. Petta, Science 339, 1174 (2013).
- Mochalin et al. (2012) V. N. Mochalin, O. Shenderova, D. Ho, and Y. Gogotsi, Nat. Nanotechnol. 7, 11 (2012).
- Schirhagl et al. (2014) R. Schirhagl, K. Chang, M. Loretz, and C. L. Degen, Annu. Rev. Phys. Chem. 65, 83 (2014).
- Le Sage et al. (2013) D. Le Sage, K. Arai, D. R. Glenn, S. J. DeVience, L. M. Pham, L. Rahn-Lee, M. D. Lukin, A. Yacoby, A. Komeili, and R. L. Walsworth, Nature 496, 486 (2013).
- Kucsko et al. (2013) G. Kucsko, P. C. Maurer, N. Y. Yao, M. Kubo, H. J. Noh, P. K. Lo, H. Park, and M. D. Lukin, Nature 500, 54 (2013).
- Grotz et al. (2012) B. Grotz, M. V. Hauf, M. Dankerl, B. Naydenov, S. Pezzagna, J. Meijer, F. Jelezko, J. Wrachtrup, M. Stutzmann, F. Reinhard, and J. a. Garrido, Nat. Commun. 3, 729 (2012).
- Petrakova et al. (2015) V. Petrakova, I. Rehor, J. Stursa, M. Ledvina, M. Nesladek, and P. Cigler, Nanoscale 7, 12307 (2015).
- Karaveli et al. (2016) S. Karaveli, O. Gaathon, A. Wolcott, R. Sakakibara, O. A. Shemesh, D. S. Peterka, E. S. Boyden, J. S. Owen, R. Yuste, and D. Englund, Proc. Natl. Acad. Sci. U.S.A. 113, 3938 (2016).
- Steinert et al. (2013) S. Steinert, F. Ziem, L. T. Hall, A. Zappe, M. Schweikert, N. Götz, A. Aird, G. Balasubramanian, L. Hollenberg, and J. Wrachtrup, Nat. Commun. 4, 1607 (2013).
- Tetienne et al. (2013) J.-P. Tetienne, T. Hingant, L. Rondin, A. Cavaillès, L. Mayer, G. Dantelle, T. Gacoin, J. Wrachtrup, J.-F. Roch, and V. Jacques, Phys. Rev. B 87, 235436 (2013).
- Rendler et al. (2017) T. Rendler, J. Neburkova, O. Zemek, J. Kotek, A. Zappe, Z. Chu, P. Cigler, and J. Wrachtrup, Nat. Commun. 8, 14701 (2017).
- Rondin et al. (2013) L. Rondin, J. P. Tetienne, S. Rohart, A. Thiaville, T. Hingant, P. Spinicelli, J. F. Roch, and V. Jacques, Nat. Commun. 4, 2279 (2013).
- Pelliccione et al. (2016) M. Pelliccione, A. Jenkins, P. Ovartchaiyapong, C. Reetz, E. Emmanouilidou, N. Ni, and A. C. Bleszynski Jayich, Nat. Nanotechnol. 11, 700 (2016).
- Tetienne et al. (2016) J. P. Tetienne, A. Lombard, D. A. Simpson, C. Ritchie, J. Lu, P. Mulvaney, and L. C. L. Hollenberg, Nano Lett. 16, 326 (2016).
- Andrich et al. (2017) P. Andrich, C. F. de las Casas, X. Liu, H. L. Bretscher, J. R. Berman, F. J. Heremans, P. F. Nealey, and D. D. Awschalom, npj Quantum Information 3, 28 (2017).
- Chang et al. (2008) Y.-R. Chang, H.-Y. Lee, K. Chen, C.-C. Chang, D.-S. Tsai, C.-C. Fu, T.-S. Lim, Y.-K. Tzeng, C.-Y. Fang, C.-C. Han, H.-C. Chang, and W. Fann, Nat. Nanotechnol. 3, 284 (2008).
- Dantelle et al. (2010) G. Dantelle, A. Slablab, L. Rondin, F. Lainé, F. Carrel, P. Bergonzo, S. Perruchas, T. Gacoin, F. Treussart, and J.-F. Roch, JOL 130, 1655 (2010).
- Bogdanov et al. (2017) S. Bogdanov, M. Y. Shalaginov, A. Akimov, A. S. Lagutchev, P. Kapitanova, J. Liu, D. Woods, M. Ferrera, P. Belov, J. Irudayaraj, A. Boltasseva, and V. M. Shalaev, Phys. Rev. B 96, 035146 (2017).
- Hopper et al. (2016) D. A. Hopper, R. R. Grote, A. L. Exarhos, and L. C. Bassett, Phys. Rev. B 94, 241201 (2016).
- Shields et al. (2015) B. J. Shields, Q. P. Unterreithmeier, N. P. de Leon, H. Park, and M. D. Lukin, Phys. Rev. Lett. 114, 136402 (2015).
- D’Anjou et al. (2016) B. D’Anjou, L. Kuret, L. Childress, and W. A. Coish, Phys. Rev. X 6, 011017 (2016).
- Waldherr et al. (2011a) G. Waldherr, P. Neumann, S. F. Huelga, F. Jelezko, and J. Wrachtrup, Phys. Rev. Lett. 107, 090401 (2011a).
- Aslam et al. (2013) N. Aslam, G. Waldherr, P. Neumann, F. Jelezko, and J. Wrachtrup, New J. Phys. 15, 013064 (2013).
- Waldherr et al. (2011b) G. Waldherr, J. Beck, M. Steiner, P. Neumann, A. Gali, T. Frauenheim, F. Jelezko, and J. Wrachtrup, Phys. Rev. Lett. 106, 157601 (2011b).
- Dhomkar et al. (2016) S. Dhomkar, J. Henshaw, H. Jayakumar, and C. Meriles, Sci. Adv. 2, e1600911 (2016).
- Jayakumar et al. (2016) H. Jayakumar, J. Henshaw, S. Dhomkar, D. Pagliero, A. Laraoui, N. B. Manson, R. Albu, M. W. Doherty, and C. A. Meriles, Nat. Commun. 7 (2016), 10.1038/ncomms12660.
- Manson and Harrison (2005) N. Manson and J. Harrison, Diamond Relat. Mater. 14, 1705 (2005).
- Rondin et al. (2010) L. Rondin, G. Dantelle, A. Slablab, F. Grosshans, F. Treussart, P. Bergonzo, S. Perruchas, T. Gacoin, M. Chaigneau, H. C. Chang, V. Jacques, and J. F. Roch, Phys. Rev. B 82, 115449 (2010).
- Havlik et al. (2013) J. Havlik, V. Petrakova, I. Rehor, V. Petrak, M. Gulka, J. Stursa, J. Kucka, J. Ralis, T. Rendler, S.-Y. Lee, R. Reuter, J. Wrachtrup, M. Ledvina, M. Nesladek, and P. Cigler, Nanoscale 5, 3208 (2013).
- Berthel et al. (2015) M. Berthel, O. Mollet, G. Dantelle, T. Gacoin, S. Huant, and A. Drezet, Phys. Rev. B 91, 035308 (2015).
- Hrubesch et al. (2017) F. M. Hrubesch, G. Braunbeck, M. Stutzmann, F. Reinhard, and M. S. Brandt, Phys. Rev. Lett. 118, 037601 (2017).
- Gulka et al. (2017) M. Gulka, E. Bourgeois, J. Hruby, P. Siyushev, G. Wachter, F. Aumayr, P. R. Hemmer, A. Gali, F. Jelezko, M. Trupke, and M. Nesladek, Phys. Rev. Applied 7, 044032 (2017).
- Brenneis et al. (2015) A. Brenneis, L. Gaudreau, M. Seifert, H. Karl, M. S. Brandt, H. Huebl, J. A. Garrido, K. H. L., and A. W. Holleitner, Nat. Nanotechnol. 10, 135 (2015).
- Pelliccione et al. (2014) M. Pelliccione, B. A. Myers, L. M. A. Pascal, A. Das, and A. C. Bleszynski Jayich, Phys. Rev. Applied 2, 054014 (2014).
- Schmid-Lorch et al. (2015) D. Schmid-Lorch, T. Häberle, F. Reinhard, A. Zappe, M. Slota, L. Bogani, A. Finkler, and J. Wrachtrup, Nano Lett. 15, 4942 (2015).
- Hall et al. (2016) L. T. Hall, P. Kehayias, D. A. Simpson, A. Jarmola, A. Stacey, D. Budker, and L. C. L. Hollenberg, Nat. Commun. 7, 10211 (2016).
- (37) See the supplemental information online for further details.
- Spiess and Neumeyer (2010) A.-N. Spiess and N. Neumeyer, BMC Pharmacol. 10, 6 (2010).
- Gaebel et al. (2006) T. Gaebel, M. Domhan, C. Wittmann, I. Popa, F. Jelezko, J. Rabeau, A. Greentree, S. Prawer, E. Trajkov, P. R. Hemmer, and J. Wrachtrup, Appl. Phys. B 82, 243 (2006).
- Zvyagin and Manson (2012) A. V. Zvyagin and N. B. Manson, in Ultrananocrystalline Diamond, edited by O. A. Shenderova and D. Gruen (William Andrew Publishing, Oxford, 2012) pp. 327–354.
- Goldman et al. (2015) M. L. Goldman, M. W. Doherty, A. Sipahigil, N. Y. Yao, S. D. Bennett, N. B. Manson, A. Kubanek, and M. D. Lukin, Phys. Rev. B 91, 165201 (2015).
- Barry et al. (2016) J. F. Barry, M. J. Turner, J. M. Schloss, D. R. Glenn, Y. Song, M. D. Lukin, H. Park, and R. L. Walsworth, Proc. Natl. Acad. Sci. U.S.A. 113, 14133 (2016).
- Knowles et al. (2016a) H. S. Knowles, D. M. Kara, and M. Atatüre, Phys. Rev. Lett. 117, 100802 (2016a).
- Knowles et al. (2016b) H. S. Knowles, D. M. Kara, and M. Atatüre, pre-print (2016b), arXiv:1611.06898 .
- Fávaro de Oliveira et al. (2017) F. Fávaro de Oliveira, D. Antonov, Y. Wang, P. Neumann, S. A. Momenzadeh, T. Häußermann, A. Pasquarelli, A. Denisenko, and J. Wrachtrup, Nat. Commun. 8, 15409 (2017).