Transmission clusters in the HIV-1 epidemic among men who have sex with men in Montreal, Quebec, Canada
Abstract
Background. Several studies have used phylogenetics to investigate Human Immunodeficiency Virus (HIV) transmission among Men who have Sex with Men (MSMs) in Montreal, Quebec, Canada, revealing many transmission clusters. The Quebec HIV genotyping program sequence database now includes viral sequences from close to HIV-positive individuals classified as MSMs. In this paper, we investigate clustering in those data by comparing results from several methods: the conventional Bayesian and maximum likelihood-bootstrap methods, and two more recent algorithms, DM-PhyClus, a Bayesian algorithm that produces a measure of uncertainty for proposed partitions, and the Gap Procedure, a fast distance-based approach. We estimate cluster growth by focusing on recent cases in the Primary HIV Infection (PHI) stage. Results. The analyses reveal considerable overlap between cluster estimates obtained from conventional methods. The Gap Procedure and DM-PhyClus rely on different cluster definitions and as a result, suggest moderately different partitions. All estimates lead to similar conclusions about cluster expansion: several large clusters have experienced sizeable growth, and a few new transmission clusters are likely emerging. Conclusions. The lack of a gold standard measure for clustering quality makes picking a best estimate among those proposed difficult. Work aiming to refine clustering criteria would be required to improve estimates. Nevertheless, the results unanimously stress the role that clusters play in promoting HIV incidence among MSMs.
Keywords: HIV, transmission clusters, phylogenetics, Bayesian methods, Primary HIV Infections.
1 Introduction
The genotyping of pathogens provide novel opportunities to improve understanding of epidemic dynamics, and as a result, phylogenetic models have become a common tool in the study of infectious disease transmission [1, 2, 3, 4]. Those models have been used extensively to study HIV epidemics [5, 6], mainly due to the availability of large sequence databases, collected mainly in the context of antiretroviral drug resistance testing [7, 8, 9]. The Quebec HIV genotyping program database [10] for example, as of 2017, contains sequences from HIV-positive individuals, living mostly in Montreal, Quebec, Canada.
Men who have Sex with Men (MSMs) remain especially at risk of contracting HIV: in Montreal, prevalence in that risk group could be as high as % [11]. Phylogenetic analyses of sequences obtained from MSMs in the Quebec HIV genotyping program database have revealed the existence of many large transmission clusters, and highlighted their association with incidence: % of MSMs infected between 2012 and 2015 belonged to a transmission cluster of size or more, compared to % [12] between 2004 and 2007. Highly Active Antiretroviral Therapy (HAART) has been successful in substantially suppressing viremia within the diagnosed population, making late transmission of the virus a lot less common, and consequently, early transmission has been increasingly driving the epidemic [13]. Recently-infected individuals are much more likely to transmit because of high viral load, viral homogeneity, and immature immune response, potentially leading to transmission cascades, consecutive transmission events happening in a short time span [6]. Those cascades result specifically in the formation of transmission clusters, and increased clustering may therefore point to a higher proportion of early transmissions.
Montreal has become a UNAIDS Fast Track City in May 2017, and the only way to reach the 90-90-90 targets [14] is to break the cycle of large cluster transmissions. Also, quantifying the role of early transmission in the epidemic is important from a public health standpoint, as it can help assess the extent to which programs are able to reach infected individuals early enough. This is the motivation behind the current study, in which we analyse a large sample of sequences collected via the Quebec HIV genotyping program with a variety of clustering methods, comparing their estimates to shed light on the ongoing evolution of clustering in the epidemic.
1.1 Background
Phylogenetic studies of clustering in HIV-1 epidemics tend to rely on a number of ad hoc rules applied a posteriori to phylogenetic estimates. Availability of software like MEGA and PAUP* [15, 16] has led to widespread adoption of maximum likelihood phylogenetic reconstruction, coupled with the bootstrap to evaluate confidence in the inferred clades. In that context, cluster estimation relies on an arbitrary cutoff applied to bootstrap support estimates, usually between % and % [17, 18, 10]. Alternatively, software like BEAST and MrBayes [19, 20] have popularised Bayesian phylogenetic estimation. Both are based on versions of the Markov Chain Monte Carlo (MCMC) algorithm, that numerically approximate posterior distributions for a variety of evolutionary and phylogenetic parameters. They also provide posterior probability support for clades, a crucial measure for the identification of clusters, which in phylogenetic terms correspond to non-nested clades forming a partition of the sample. For example, many studies require posterior probability support of to conclude in clustering [21].
In addition to clade confidence requirements, many studies also impose a within-cluster genetic distance requirement, usually between nt/bp and nt/bp [22]. Distance requirements may be applicable to mean [9], median [23], or maximum patristic distances [10], that is, distances calculated by summing branch lengths along the shortest path between any two tips in the phylogeny. The ClusterPicker algorithm [22] instead formulates that requirement in terms of maximum within-cluster -distances, e.g. the Hamming distance.
Cutoffs are however hard to justify rigorously [24] and so, methods grounded in more explicit definitions of clusters have been published. [25] proposed the so-called Gap Procedure, a fast pure distance-based approach that requires minimal tuning. In a similar vein, [26] formulated DM-PhyClus, a Bayesian algorithm that aims to minimise reliance on thresholds while still offering rigorous inference for cluster membership.
The heavy computational burden of conventional phylogenetic inference is problematic in light of the fast increase in the size of sequence databases, and can therefore limit its applicability [27]. Thankfully, software designed to handle larger datasets is now available. RAxML [28] and FastTree [29], for example, make use of heuristics in phylogenetic optimisation to improve scalability of the maximum likelihood phylogenetic methods. Clustering of large datasets in a purely Bayesian paradigm is a computational challenge that has not yet been fully overcome, although vast progress has been made thanks in part to GPU computing [19, 20].
1.2 Objectives
This paper aims to provide up-to-date estimates of transmission clusters in the HIV epidemic among MSMs in Montreal and assess their temporal expansion. In doing so, we seek to improve previous assessments of the contribution of early transmission and transmission cascades to the epidemic. We therefore perform an exhaustive clustering analysis of HIV-1 subtype B sequences in the most recent version of the Quebec HIV genotyping database originating from MSM subjects. There is a lack of consensus as to how clustering of HIV-1 sequence data should be done, and different methods may produce equally valid, but conflicting results [5]. To assess sensitivity of cluster estimates to phylogenetic assumptions and cluster definitions, we compare results from a number of methods,
-
1.
Maximum likelihood phylogenetic reconstruction, coupled with a bootstrap support requirement for clades, which we refer to as the ML-bootstrap approach,
-
2.
Bayesian phylogenetic inference, coupled with a posterior probability support requirement for clades,
-
3.
DM-PhyClus [26],
-
4.
Gap Procedure [25].
2 Materials and methods
2.1 Data
Among the entries in the Quebec HIV genotyping program database [10], we retain subtype B sequences, each obtained from a different individual classified as MSM. All sequences were collected between May 3, 1996 and February 1, 2016. We focus on a particular viral DNA genomic region, and study loci, covering sites - of the protease region (PR), and - of the reverse transcriptase (RT) region, of the pol gene. Each sequence comes with a time stamp, indicating when the blood sample was collected, and an indicator of infection status, either chronic treated, chronic untreated, or Primary HIV Infection (PHI). A case is considered a PHI if the sequence was obtained less than months after seroconversion [10].
Since the analyses focus on transmission clusters among MSMs only, we exclude sequences obtained from women, leaving us with sequences. To avoid potential artefacts resulting from selective pressure induced by antiretroviral therapy, we remove sequences for chronic treated patients and patients with missing infection status information as well, leaving us with sequences. Finally, for rooting purposes, we add to those sequences three subtype A outgroup sequences from Zambia [8] (NCBI accession numbers AB254141, AB254142, AB254143), and it follows that the data to analyse include sequences.
2.2 Methods
2.3 Conventional maximum likelihood
We obtain the maximum likelihood (ML) phylogenetic estimate [30] with RAxML 8.2.10 [28], under the assumption that nucleotide evolution follows the GTR + I + model. We produce bootstrap trees, and use them to evaluate confidence in clades present in the “best scoring” phylogeny, RAxML’s estimate of the ML phylogeny. To conclude in clustering, we require, in turns, bootstrap support greater than %, %, or % and consider genetic distance requirements of %, %, %, %, and %. More specifically, we apply, in turns, the maximum within-cluster Hamming distance requirement of ClusterPicker [22], the maximum median within-cluster patristic distance requirement of PhyloPart [23], and the maximum within-cluster patristic distance requirement of [10]. For the PhyloPart analysis, [23] recommend setting cutpoints based on percentiles of the total tree patristic distance distribution. In their real data analysis, they use the th and th percentiles as cutpoints, which we also try.
2.4 Conventional Bayes
We perform phylogenetic inference with MrBayes 3.2.6 [20] using default parameters, under the assumption that nucleotide evolution follows the GTR + I + model. MrBayes uses the MCMC algorithm [31], more specifically the so-called Metropolis-coupled MCMC, or (MC)3 [32], algorithm, to generate estimates for the posterior distribution of phylogenetic parameters. The MCMC algorithm lets us recursively obtain samples from the posterior distributions of interest. It starts off by setting all parameters at an arbitrary value. Then, in each iteration, updates to parameter values are proposed, conditional on their current values. Each proposal is randomly accepted with probability equal to the Metropolis-Hastings (MH) ratio, producing a move in the parameter space; else, no move is recorded. After a large number of iterations, parameter values generated throughout the chain are used to empirically estimate the posteriors. We run three million iterations, burning in the first % and sampling one iteration out of . We derive the majority rule consensus tree from the remaining trees, and produce cluster estimates by identifying clades with posterior probability support of . Once again, we use the ClusterPicker algorithm to obtain cluster estimates, under the requirement that within-cluster distance be, in turns, bounded above by %, %, and %, %, and %.
2.5 Cutpoint selection
All conventional clustering approaches require selection of genetic distance and confidence cutpoints. Prior to the analyses, researchers involved directly in the Quebec HIV genotyping program performed a preliminary clustering of the dataset. The proposed partition results from successive updates, performed at different points in time, of an initial cluster estimate, obtained under the restriction that once a sequence is attributed to a cluster, it cannot be re-attributed to another cluster in a following analysis. They identified from the results seven noteworthy sets of sequences, comprising sequences in total, that they expect correspond with genuine transmission clusters. One of those sets, for instance, comprises sequences and is characterised by more than half of its members harbouring the Non-Nucleoside Reverse Transcriptase Inhibitors (NNRTI) mutation K103N. As in [23], we use that subsample as a reference set. We compare partitions obtained across a range of cutpoints with that set using the Adjusted Rand Index (ARI), a measure of similarity between two partitions, with the aim of maximising overlap. Greater ARI values are better, and the measure is bounded above by , indicating perfect correspondence. We describe the comparison scheme in more details in Supplementary Material S1.
2.6 DM-PhyClus
DM-PhyClus is a Bayesian phylogenetic algorithm that aims to estimate transmission clusters directly, by identifying sets of sequences supported by distinctive subtrees, thus avoiding the need to specify thresholds arbitrarily [26]. Unlike conventional methods, as a way to directly find sets of sequences resulting from transmission cascades, it defines a cluster as a clade supported by a phylogeny with a distinctive branch length distribution, usually with a relatively small mean. Conditional on an input phylogeny – the maximum likelihood estimate in this study – it uses the MCMC approach to produce an estimate of the posterior distribution of cluster membership indices. As a result, it has the added benefit of providing a straightforward measure of uncertainty for cluster and cluster membership estimates, in the form of co-clustering frequencies across the chain. It requires specification of a number of other priors and evolutionary parameters, which we list in Supplementary Material S3. We perform iterations, discarding the first as a burn-in and applying a thinning ratio of over , leaving us with a sample of size . We identify the partition that maximises the joint posterior probability score, which we refer to as the Maximum Posterior probability (MAP) estimate.
2.7 Gap Procedure
The Gap Procedure is a pure distance-based clustering algorithm that requires minimal tuning, and avoids reliance on ad hoc cutpoints by partitioning sets of sequences into distinctive components without requiring phylogenetic estimation [25]. When the true clusters are compact and separable enough, the Gap Procedure can propose partitions that largely agree with conventional phylogenetic estimates, but in a fraction of the time normally required for such analyses, thus making the method ideal for handling large datasets. For example, in an analysis presented in [25], partitioning a dataset comprising sequences of length took hours with MrBayes and less than a second with the Gap Procedure. The method takes as input a matrix of pairwise distances, which we obtain under the Kimura 1980 (K80) model. We leave tuning parameters at their default values.
2.8 Cluster growth evaluation
To evaluate cluster growth properly, we would need to know seroconversion dates for all cases whose sequences were sampled. The dataset however contains instead an infection stage indicator, equivalent to a censored estimate of infection time, i.e. smaller (greater or equal) than six months prior to the sampling date for PHIs (chronic cases). Most HIV-positive individuals are diagnosed while already in the chronic stage, at which point seroconversion date estimates are very imprecise [33]. As a result, we use PHIs only to obtain a lower bound estimate for the growth of inferred clusters, since PHIs can be reliably associated with a short time window prior to sampling. We focus on a period ranging from January 1, 2012 to February 1, 2016. For example, one of the methods may propose a cluster of size , with eight of its sequences having been obtained from cases diagnosed while in the PHI stage at some point in 2014. We can therefore be certain that those cases were infected after January 1, 2012 and so, we conclude that the cluster has accrued at least eight new cases in the selected period.
2.9 Software
Under the conventional methods, we get cluster estimates by importing phylogenetic estimates from RAxML or MrBayes into R v3.2.3 and analysing them with functions in the phangorn and ape libraries [34]. We use functions in the GapProcedure and DMphyClus R libraries to obtain the other estimates.
3 Results
3.1 Cutpoint selection
In all maximum likelihood analyses, the bootstrap support requirement of % resulted in greater overlap with the reference set. Under the maximum patristic distance scheme of [10], we found that a distance requirement of % maximised the correspondence (ARI = ). With ClusterPicker, requirements of either % or % were preferable (ARI = ). In PhyloPart, a median within-cluster patristic distance requirement of resulted in the largest overlap with the reference (ARI = ). Finally, in the Bayesian analysis, in addition to a posterior probability requirement of , we determined that a % or % requirement for maximum within-cluster Hamming distances were equivalent (ARI = ). Except for [23], published clustering analyses tend to rely on more restrictive distance requirements and so, in cases where several distance requirements were equivalent, we picked the smallest one.
It is no surprise that the proposed schemes resulted in similar choices of cutpoints. Cluster estimation based on the consensus tree computed from the Bayesian tree search relies on ClusterPicker, just like one of the ML-bootstrap approaches. Normally, clusters found through a Bayesian analysis agree substantially with those obtained through a ML-bootstrap approach. Also, ClusterPicker uses maximum within-cluster pairwise distances, which provide a rough approximation of patristic distances. It follows that tuning ClusterPicker to produce estimates in line with those from the method of [10] should be feasible.
3.2 Estimates comparison
| ML + CP | ML + PhyloPart | ML + Max. pat. dist. | MrBayes + CP | Gap Procedure | DM-PhyClus | |
|---|---|---|---|---|---|---|
| ML + CP | 1.00 | 0.92 | 0.93 | 0.94 | 0.83 | 0.65 |
| ML + PhyloPart | 0.92 | 1.00 | 0.91 | 0.86 | 0.88 | 0.68 |
| ML + Max. pat. dist. | 0.93 | 0.91 | 1.00 | 0.88 | 0.83 | 0.66 |
| MrBayes + CP | 0.94 | 0.86 | 0.88 | 1.00 | 0.84 | 0.64 |
| Gap Procedure | 0.83 | 0.88 | 0.83 | 0.84 | 1.00 | 0.72 |
| DM-PhyClus | 0.65 | 0.68 | 0.66 | 0.64 | 0.72 | 1.00 |
We first compare optimal estimates from all methods with the ARI, cf. Table 1. We observed the largest overlap between the partitions resulting from the ML + maximum patristic distance and ML+ClusterPicker methods (ARI = ). On the other hand, we obtained the smallest overlap between estimates suggested by the MrBayes+CP and DM-PhyClus methods (ARI = ). DM-PhyClus produced the most distinctive set of clusters, with overlap with clusters from the other methods ranging from and . The larger correspondence with the Gap Procedure estimate is not surprising, since both methods define clusters in terms of their separation from other clusters.
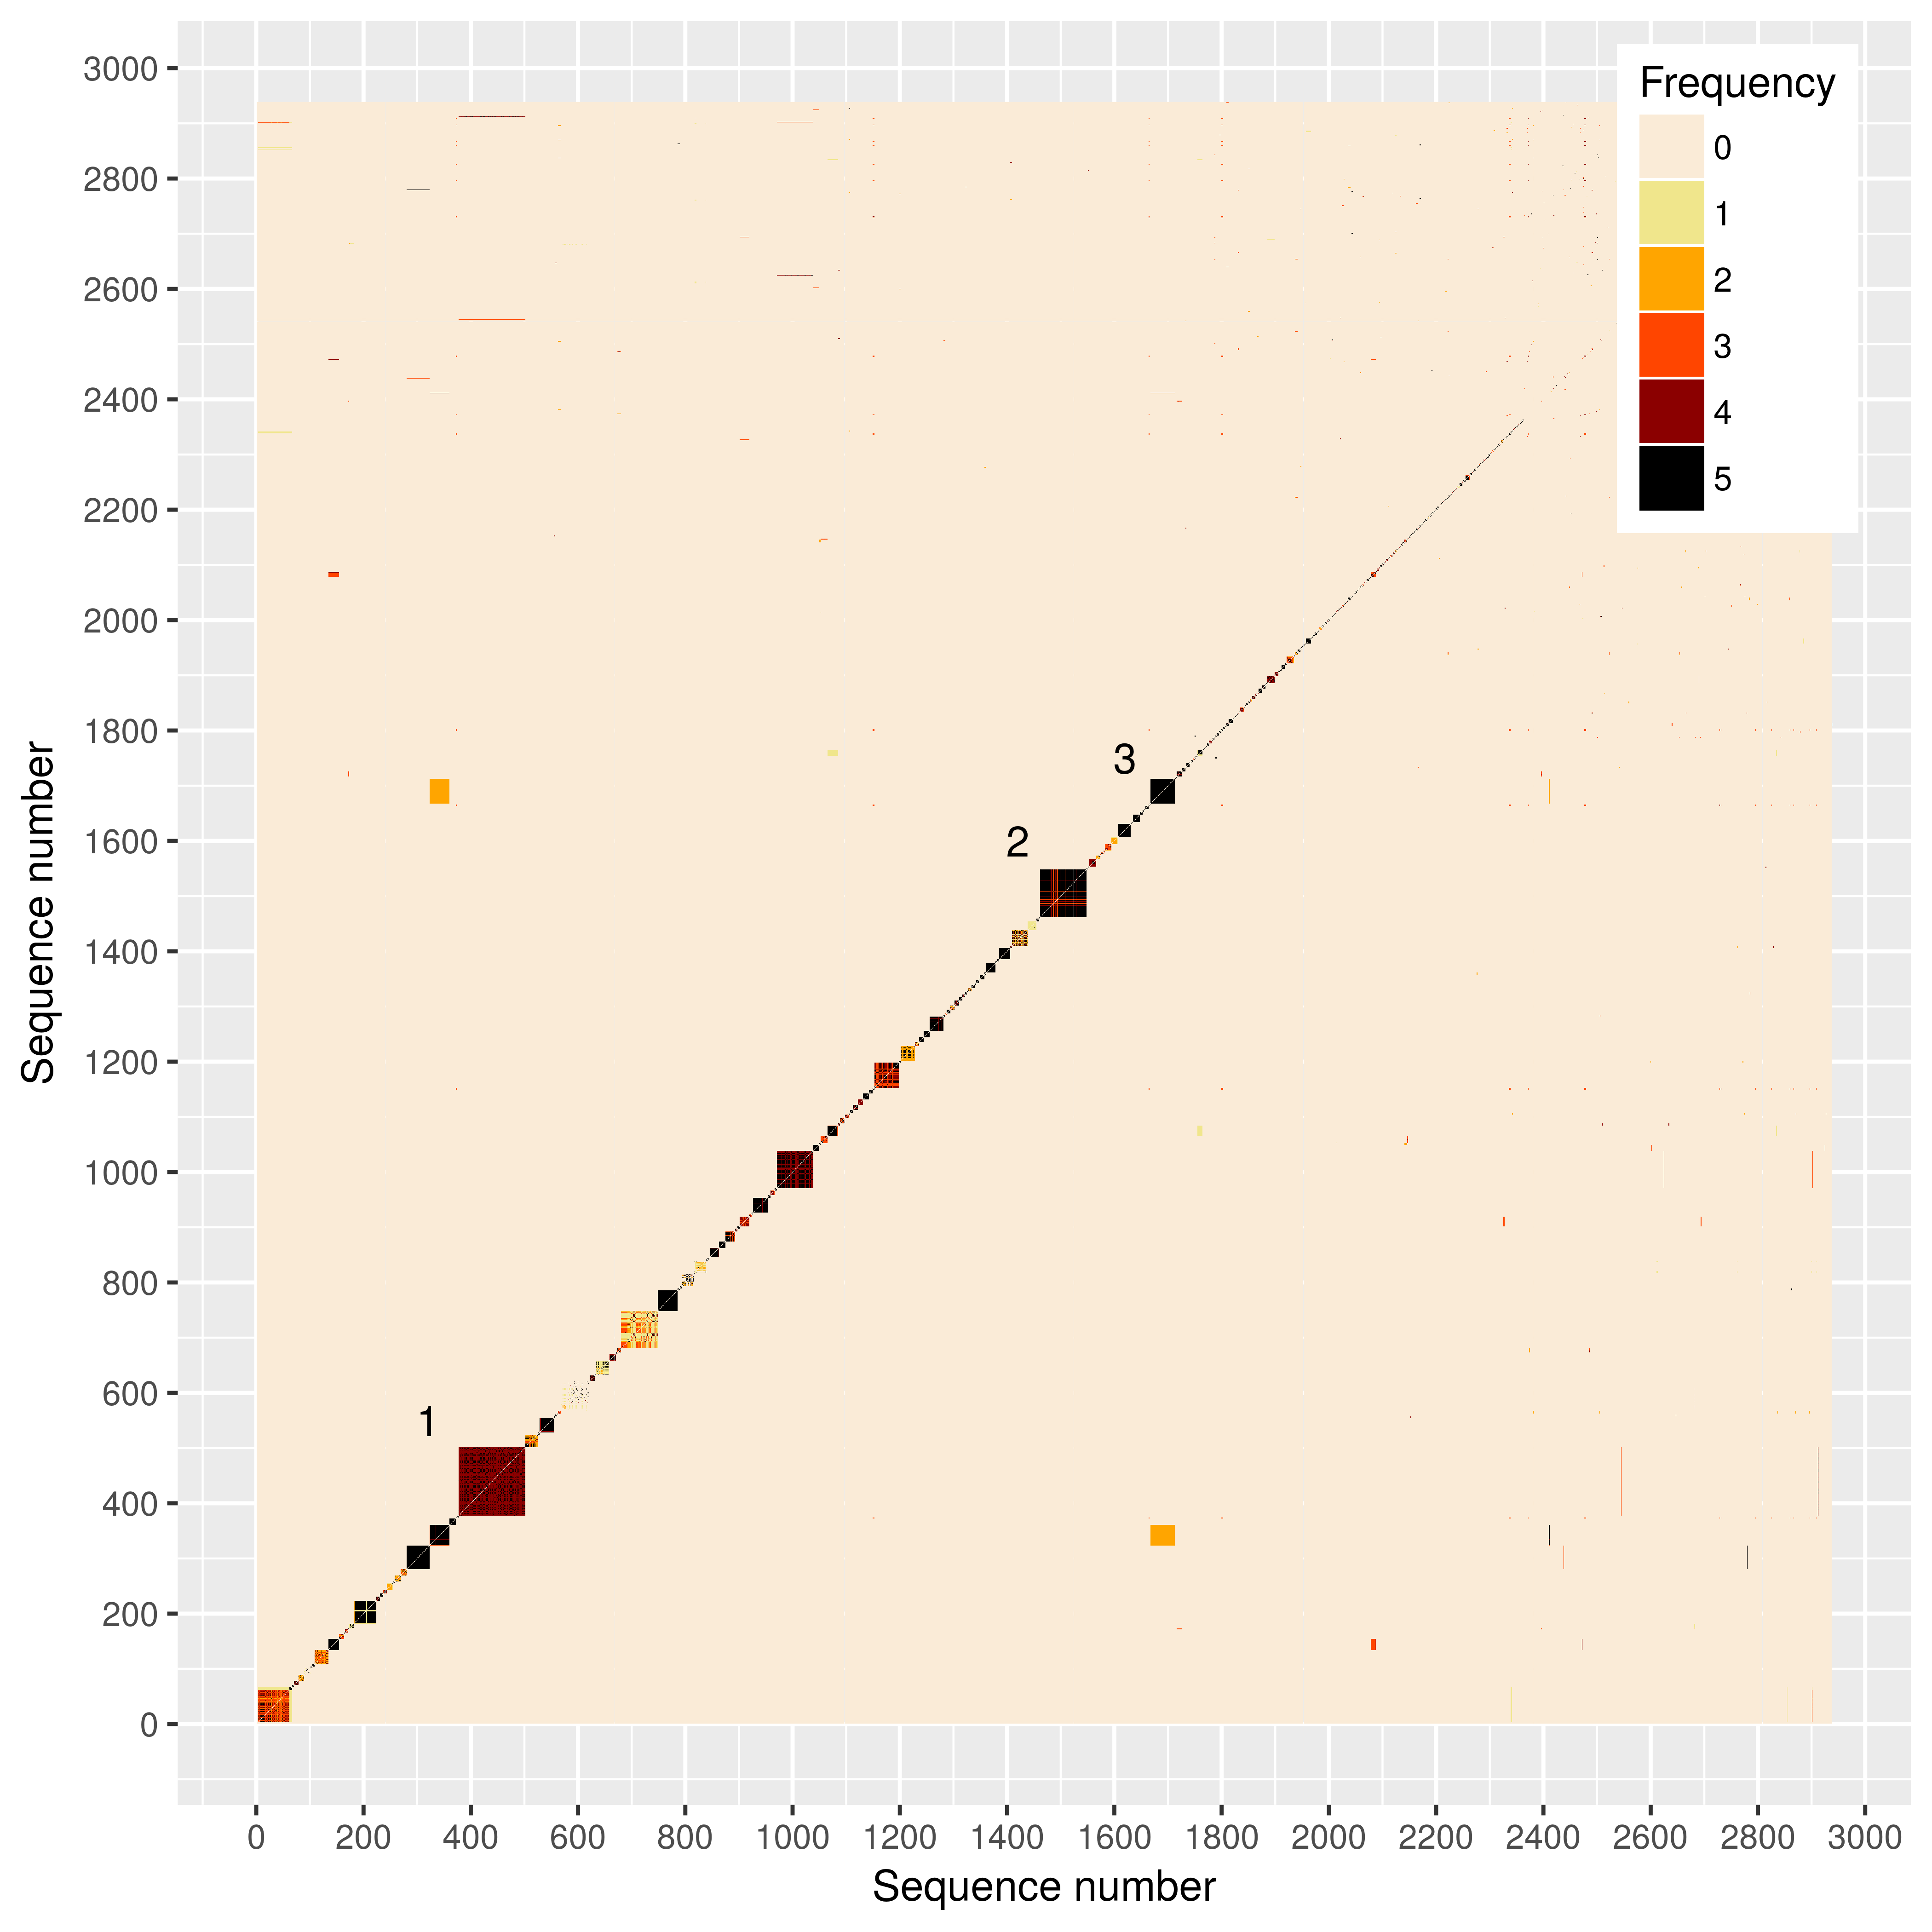
We represent graphically the correspondence between the different estimates in Figure 1. The heat map, showing the sequences found to co-cluster with at least one other sequence by at least one of the methods, reveals moderately-sized clusters. The largest rectangle, marked “1” in the figure, matches roughly one of the reference clusters, and is of size . The earliest sequence in the cluster was collected on August 13, 2002 and was a PHI, and the latest sequence, also corresponding to a PHI, was obtained on December 23, 2015. The MAP estimate of DM-PhyClus, on the other hand, split this cluster into components, including three clusters of size , , and , respectively, and singletons. Instead of the MAP estimate, we could have derived the so-called linkage estimate from the chain results [26]. Broadly speaking, the linkage estimate proposes clusters by partitioning the sample into subsets of sequences that co-cluster often across iterations in the chain. We present a more detailed description in Supplementary Material S4. The linkage estimate ends up more in line with the other estimates: it contains components, with large clusters of sizes , , and , and singletons.
The second largest cluster, represented by the mostly black block on the right, marked “2” in the figure, comprises sequences, and is also part of the reference set. All methods agree more or less that it indeed represents a transmission cluster. It comprises sequences sampled from May 11, 2004 (chronic untreated) to December 14, 2015 (PHI), which highlights its durability. The moderately-sized black block to its immediate right, marked “3”, also stands out. Its sequences, also found in the reference set, co-cluster according to all the methods. Its first sequence was collected on January 11, 2012 and its last, on April 8, 2015. Two methods, MrBayes + ClusterPicker and ML + ClusterPicker added to that cluster an extra sequences, as evidenced by the light orange rectangle underneath it.
| ML + ClusterPicker | ML + PhyloPart | ML + Max. pat. dist. | MrBayes + ClusterPicker | Gap Procedure | DM-PhyClus | |
| Mean clus. size | 2.29 | 2.08 | 2.19 | 2.48 | 2.33 | 2.11 |
| Mean (no singletons) | 6.01 | 5.53 | 5.62 | 5.96 | 4.80 | 5.62 |
| Median (no singletons) | 3.00 | 3.00 | 3.00 | 3.00 | 2.00 | 3.00 |
| Max. clus. size | 126 | 126 | 126 | 126 | 125 | 77 |
| Num. singletons | 1205 | 1353 | 1261 | 1051 | 1035 | 1330 |
| Num. clus. size 2 | 1621 | 1779 | 1696 | 1497 | 1592 | 1753 |
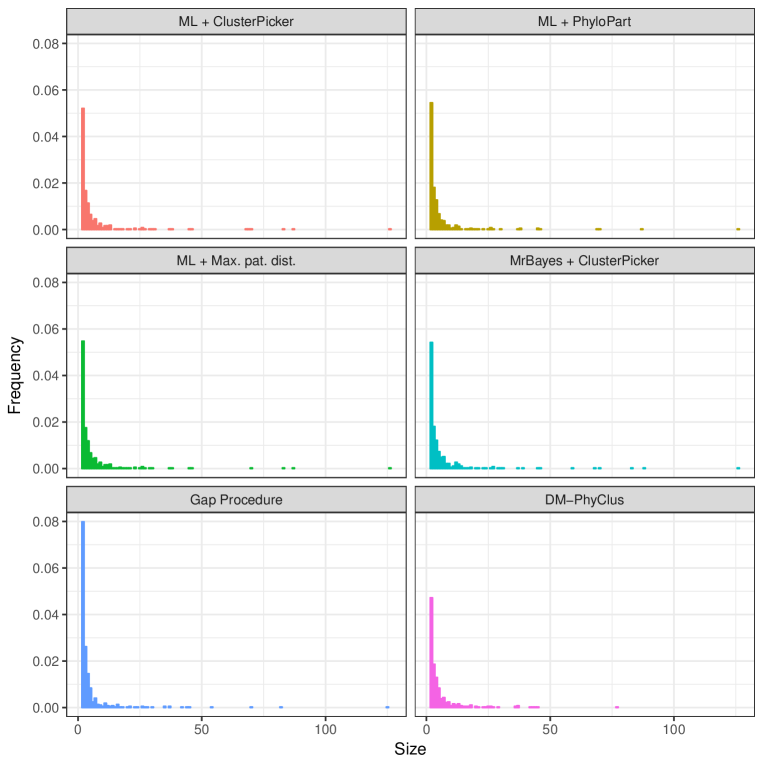
Figure 2 presents truncated cluster size distributions derived from the preferred estimate from each method and Table 2 gives related summary statistics. Unsurprisingly, distributions obtained from the four conventional methods are very similar. Among those, the one for the conventional Bayesian estimate, labelled “MrBayes + ClusterPicker”, stands out because of its thicker right tail. The distribution derived from the DM-PhyClus estimate is also distinctive, because of its much thinner right tail. Frequencies for singletons are not shown in the graphs for readability purposes. We found that ML + PhyloPart and DM-PhyClus had the highest proportions of singletons, each having approximately % of size clusters. On the other hand, the Gap Procedure and the conventional Bayesian estimate had the fewest singletons, with % of clusters having a single member. The Gap Procedure estimate, however, had much more transmission pairs than the other methods.
3.3 Cluster growth assessment
Among the cases in the MSM risk group added to the database in the period ranging from January 1, 2012 to February 1, 2016, were PHIs. Of those PHIs, were sampled after June , guaranteeing that the corresponding transmission events took place in 2012. According to the ML + PhyloPart estimate, (%) of those PHIs are singletons, (%) are found in transmission pairs, and (%) belong to clusters of size five or more. In comparison, in the period ranging from July 1st 2008 to January 1st 2012, MSM cases diagnosed in the PHI stage were added to the database. After excluding all sequences sampled after January 1st 2012, we find that of those PHIs, (%) form singletons, (%) belong to transmission pairs, and (%) are part of clusters of size five or more. If we do not exclude the more recent sequences, we find that of the cases (%) are still singletons, which tends to indicate that the more recent PHIs tend to cluster more.
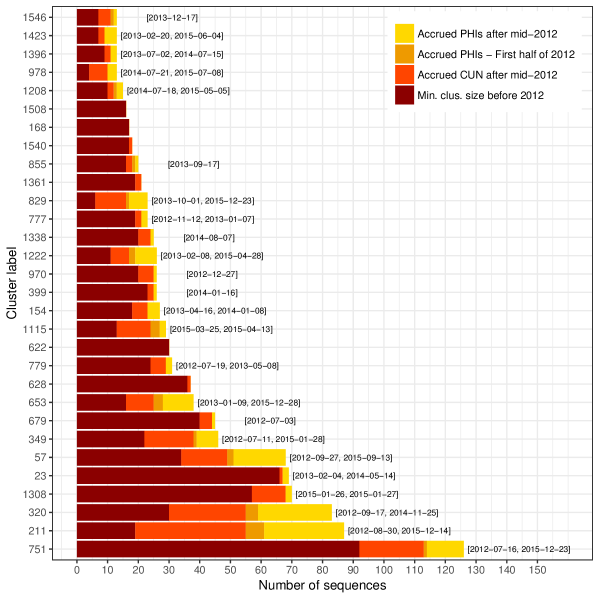
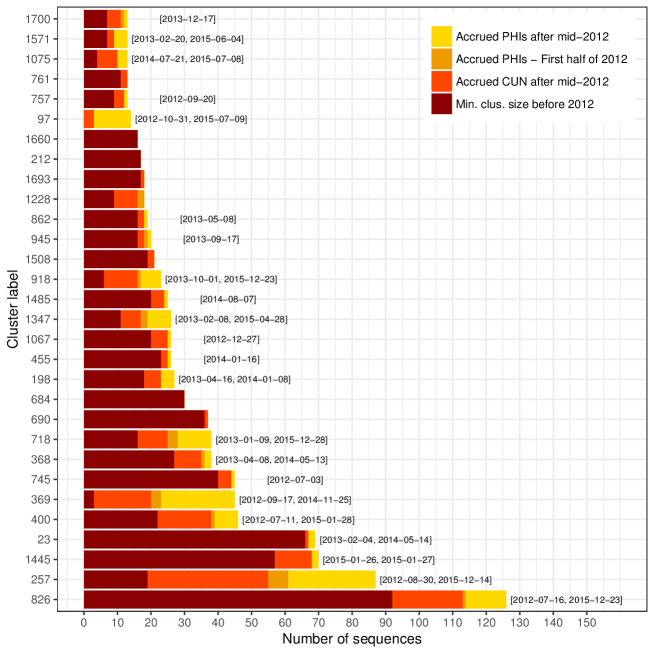
We represent the largest clusters, according to the ML + PhyloPart estimate, in Figure 3. Those clusters include recent PHIs, split between clusters. Among the largest ten clusters, nine include at least one recent PHI. The largest cluster includes recent PHIs, while the second and third include and two, respectively. Cluster is noteworthy: despite its small size prior to 2012, it has grown quickly, with the addition of recent PHIs. Cluster , on the other hand, is still small, but has not been recorded before. Each of those two clusters has a PHI recorded as late as the second half of 2015, indicating that they may still be expanding. Other conventional estimates and the Gap Procedure lead to similar conclusions, as can be seen in Supplementary Material S5.
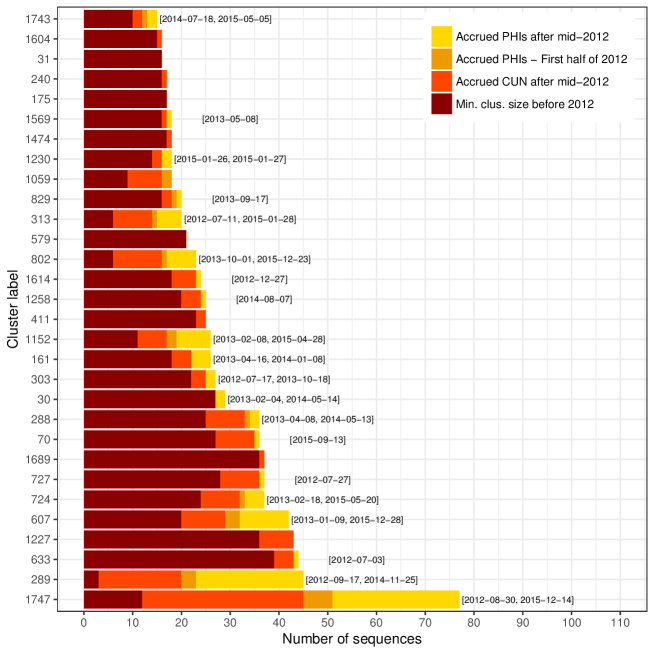
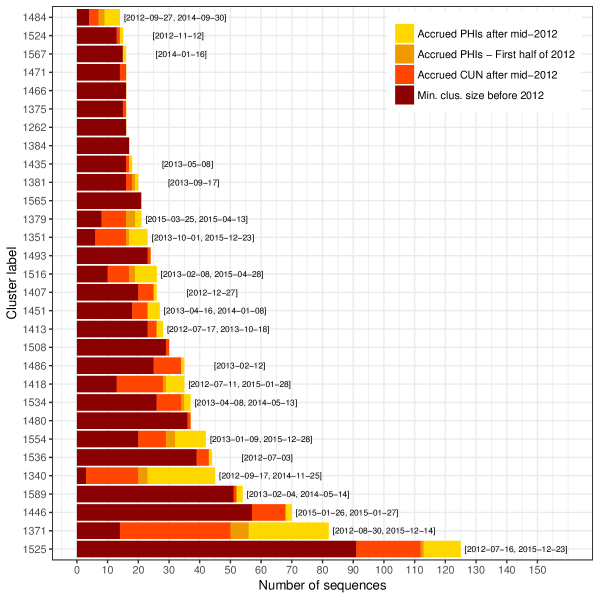
The partition produced by DM-PhyClus is different, but leads to similar conclusions, as shown in Figure 4. Of the largest clusters, include at least one recent PHI. The largest cluster overlaps largely with cluster in Figure 3 and includes recent cases, while the second and third largest include and , respectively. The fifth largest cluster includes recent PHIs, out of members, also hinting at considerable growth.
4 Discussion
4.1 Summary
In this paper, we investigated clustering in a sample of HIV-1 cases belonging to the men who have sex with men risk category. We compared estimates from six methods, four conventional approaches relying on a variety of cutpoints applied to phylogenetic estimates, and two additional recent approaches seeking to avoid cutpoints entirely, the Gap Procedure and DM-PhyClus. We found that estimates obtained from conventional methods were overall fairly similar. The estimate from DM-PhyClus involved a noticeably different, albeit not unreasonable, cluster size distribution. Unlike other methods however, DM-PhyClus provides a straightforward measure of co-clustering frequencies and so, we found that requiring a certain degree of co-clustering, through the linkage-xx estimate, could change estimates for certain clusters. All estimates however produced a similar assessment of cluster growth in the period ranging from January 1st, 2012 to February 1st, 2016: nine of the ten largest clusters had grown in the selected period, three of those having accrued at least ten new cases. Further, we observed several emerging clusters.
4.2 Limitations
The study has several limitations. Cutpoint selection remains inherently subjective. Indeed, choosing cutpoints as to maximise overlap with a reference set does not guarantee that other clusters will be estimated well. Moreover, identifying a suitable reference set can be difficult. In our study, researchers involved in the Quebec HIV genotyping program proposed the set based on a curated clustering analysis they conducted. A different reference set might have led to different cutpoints. Several of the approaches we used did manage to recover the reference set very closely though, which suggests that it is not unrealistic.
DM-PhyClus, being a Bayesian method, rests on a number of prior assumptions, which are all more or less informative, and it follows that prior calibration is key. [26] suggest that estimates are reasonably robust to some prior assumptions, but it remains possible that a combination of very poorly chosen priors may result in misleading cluster estimates.
Reliable infection date estimates for cases diagnosed while in the chronic stage are unavailable and so, we could only obtain a lower bound for cluster growth between January 1st, 2012 and February 1st, 2016. The average time between seroconversion and diagnostic is between and years [35], and it follows that several chronic cases diagnosed after June th might have been infected during the selected period. Estimating infection time from the fraction of ambiguous nucleotides in each sequence would have been possible[33], but the high standard deviation for such predictions would have limited their usefulness.
Because of the non-random sampling of cases, we cannot readily deduce from our estimates the population-level cluster size distribution. In the absence of covariate information, we cannot model the sampling process. If, for example, the probability for a case to be sampled correlates positively with cluster size, we might end up underestimating the size of smaller clusters and the number of singletons, and consequently, overestimating the contribution of clustering to the epidemic. Nevertheless, the results we presented provide good evidence of cluster growth, and that phenomenon alone warrants attention.
4.3 Selecting a best transmission cluster estimate
Determining which partition among the six proposed provides the most accurate representation of transmission clusters in the sample is difficult. The choice depends ultimately on our confidence in the assumptions of each approach, and on substantive knowledge. The agreement between estimates from the conventional approaches, although explained in great part by shared assumptions, is still a good sign. The moderately different partitions proposed by the Gap Procedure and DM-PhyClus are not erroneous: they result from the way the two methods define clusters. The two approaches also have additional aims and benefits. [25] designed the Gap Procedure with scalability in mind, and [26] formulated DM-PhyClus in such a way that it could offer a straightforward measure of uncertainty around the returned clusters.
4.4 Conclusion
The existence of large transmission clusters is not only a feature of transmission of HIV-1 among MSMs in Montreal: it has been observed across Europe and other regions of North America as well [36, 37, 38, 39]. The increasing size of sequence databases represents a considerable computational challenge, especially in the Bayesian framework, and so, scalability should be an essential feature of future clustering algorithms. We contend that methods that avoid cutpoint selection altogether are convenient and promising, and would benefit from further improvements. In addition to lightening their computational burden, adapting them to use time-stamp and covariate data, for example, would be a welcome extension. Further, methods designed to provide a clear measure of uncertainty for estimated partitions, like DM-PhyClus, would warrant more attention. Indeed, the strength of co-clustering between sequences within an inferred cluster may vary sizeably, and the separation between neighbouring clusters may not be very clear-cut. Such variability may be hard to measure rigorously under conventional phylogenetic clustering approaches.
Phylogenetic surveillance of HIV transmission among MSMs provides helpful clues for explaining the persistence of the epidemic. The portrait of clustering presented in this study suggests an ongoing contribution of transmission cascades to incidence, a finding that should inform public health strategies to reduce transmission rates.
Ethics approval and consent to participate
The study has received ethics approval from the McGill Faculty of Medicine Institutional Review Board. Ethics approval for the Quebec HIV genotyping program was obtained from individual study sites, the Laboratoire de santé publique du Québec, and the Quebec Ministry of Health committee on confidentiality and access of information.
Competing interests
The authors declare that they have no competing interests.
Funding
This work was supported by a training award from the Fonds de recherche du Québec-Santé (FRQS), funding from the Centre de Recherches Mathématiques (CRM), a Natural Sciences and Engineering Research Council of Canada (NSERC) Discovery Grant, and a Canadian Institutes of Health Research (CIHR) grant (CIHR HHP-126781). Additional funding was obtained from the FRQS-Flandres collaboration (dossier 202685).
Author’s contributions
LV wrote the article, performed the analyses. LV, AL, and DAS jointly formulated the study plan. AL and DAS suggested and reviewed analyses. BB and MR provided the HIV-1 sequences. RI helped with the preliminary analyses of the sequences and suggested a reference set for tuning the clustering procedure.
Data availability
The Quebec HIV genotyping program sequences are protected by strict confidentiality agreements and so, cannot be made publicly available. A small subset of sequences can be provided for verification purposes upon request.
Acknowledgements
The Quebec HIV genotyping program is sponsored by the Ministère de la Santé et des Services sociaux (MSSS) du Québec and by the Fonds de recherche du Québec (FRQ-S) Réseau SIDA/MI.
References
- [1] Dudas G, Rambaut A. Phylogenetic analysis of Guinea 2014 EBOV Ebolavirus outbreak. PLoS Currents. 2014;6.
- [2] Kenah E, Britton T, Halloran ME, Longini IM Jr. Molecular Infectious Disease Epidemiology: Survival Analysis and Algorithms Linking Phylogenies to Transmission Trees. PLOS Comput Biol. 2016 04;12(4):1–29. Available from: https://doi.org/10.1371/journal.pcbi.1004869.
- [3] Foley BT, Leitner TK, Apetrei C, Hahn B, Mizrachi I, Mullins J, et al. HIV Sequence Compendium 2015. Los Alamos National Lab (LANL), Los Alamos, NM (United States); 2015.
- [4] Huerta-Cepas J, Capella-Gutiérrez S, Pryszcz LP, Marcet-Houben M, Gabaldón T. PhylomeDB v4: zooming into the plurality of evolutionary histories of a genome. Nucleic Acids Res. 2014 Jan;42(Database issue):D897–D902. Available from: http://dx.doi.org/10.1093/nar/gkt1177.
- [5] Brenner BG, Wainberg MA. Future of Phylogeny in HIV Prevention. J Acquir Immune Defic Syndr. 2013 Jul;63 Suppl 2:S248–S254. Available from: http://dx.doi.org/10.1097/QAI.0b013e3182986f96.
- [6] Brenner B, Wainberg MA, Roger M. Phylogenetic inferences on HIV-1 transmission: implications for the design of prevention and treatment interventions. AIDS. 2013 Apr;27(7):1045–1057. Available from: http://dx.doi.org/10.1097/QAD.0b013e32835cffd9.
- [7] Swiss HIV Cohort Study. Cohort profile: the Swiss HIV Cohort study. Int J Epidemiol. 2010 Oct;39(5):1179–1189. Available from: http://dx.doi.org/10.1093/ije/dyp321.
- [8] Los Alamos HIV sequence database;. http://www.hiv.lanl.gov/content/sequence/HIV/MAP/landmark.html.
- [9] Hué S, Clewley JP, Cane PA, Pillay D. HIV-1 pol gene variation is sufficient for reconstruction of transmissions in the era of antiretroviral therapy. AIDS. 2004 Mar;18(5):719–728.
- [10] Brenner BG, Roger M, Routy JP, Moisi D, Ntemgwa M, Matte C, et al. High rates of forward transmission events after acute/early HIV-1 infection. J Infect Dis. 2007 Apr;195(7):951–959.
- [11] Public Health Agency of Canada. Information Exchange CAT, editor. Population-specific HIV/AIDS Status Report: Gay, Bisexual, Two-Spirit And Other Men Who Have Sex With Men; 2013. Available from: http://www.phac-aspc.gc.ca/aids-sida/publication/ps-pd/men-hommes/chapter-chapitre-3-eng.php.
- [12] Brenner BG, Ibanescu RI, Hardy I, Stephens D, Otis J, Moodie E, et al. Large cluster outbreaks sustain the HIV epidemic among MSM in Quebec. AIDS. 2017;31(5):707–717.
- [13] Charest H, Doualla-Bell F, Cantin R, Murphy DG, Lemieux L, Brenner B, et al. A Significant Reduction in the Frequency of HIV-1 Drug Resistance in Québec from 2001 to 2011 Is Associated with a Decrease in the Monitored Viral Load. PLOS ONE. 2014 10;9(10):1–10. Available from: https://doi.org/10.1371/journal.pone.0109420.
- [14] Joint United Nations Programme on HIV/AIDS and Joint United Nations Programme on HIV/AIDS and others. 90-90-90: An ambitious treatment target to help end the AIDS epidemic. UNAIDS, editor. UNAIDS; 2014.
- [15] Tamura K, Stecher G, Peterson D, Filipski A, Kumar S. MEGA6: Molecular Evolutionary Genetics Analysis version 6.0. Mol Biol Evol. 2013 Dec;30(12):2725–2729. Available from: http://dx.doi.org/10.1093/molbev/mst197.
- [16] Swofford DL. PAUP*: Phylogenetic analysis using parsimony (and other methods).; 2003. Available from: http://paup.sc.fsu.edu/about.html.
- [17] Hillis DM, Bull JJ. An Empirical Test of Bootstrapping as a Method for Assessing Confidence in Phylogenetic Analysis. Syst Biol. 1993;42(2):182–192.
- [18] Holder M, Lewis PO. Phylogeny estimation: traditional and Bayesian approaches. Nat Rev Genet. 2003 Apr;4(4):275–284.
- [19] Drummond AJ, Suchard MA, Xie D, Rambaut A. Bayesian phylogenetics with BEAUti and the BEAST 1.7. Mol Biol Evol. 2012 Aug;29(8):1969–1973. Available from: http://dx.doi.org/10.1093/molbev/mss075.
- [20] Ronquist F, Teslenko M, van der Mark P, Ayres DL, Darling A, Höhna S, et al. MrBayes 3.2: Efficient Bayesian Phylogenetic Inference and Model Choice Across a Large Model Space. Syst Biol. 2012;61(3):539–542. Available from: http://sysbio.oxfordjournals.org/content/61/3/539.abstract.
- [21] Yang Z. Computational Molecular Evolution. Oxford Series in Ecology and Evolution. Oxford: Oxford University Press; 2006.
- [22] Ragonnet-Cronin M, Hodcroft E, Hué S, Fearnhill E, Delpech V, Brown AJL, et al. Automated analysis of phylogenetic clusters. BMC Bioinformatics. 2013;14:317.
- [23] Prosperi MCF, Ciccozzi M, Fanti I, Saladini F, Pecorari M, Borghi V, et al. A novel methodology for large-scale phylogeny partition. Nat Commun. 2011 May;2:321.
- [24] Chalmet K, Staelens D, Blot S, Dinakis S, Pelgrom J, Plum J, et al. Epidemiological study of phylogenetic transmission clusters in a local HIV-1 epidemic reveals distinct differences between subtype B and non-B infections. BMC Infect Dis. 2010;10:262.
- [25] Vrbik I, Stephens DA, Roger M, Brenner BG. The Gap Procedure: for the identification of phylogenetic clusters in HIV-1 sequence data. BMC Bioinformatics. 2015;16:355. Available from: http://dx.doi.org/10.1186/s12859-015-0791-x.
- [26] Villandre L, Labbe A, Brenner B, Roger M, Stephens DA. DM-PhyClus: A Bayesian phylogenetic algorithm for transmission cluster inference. ArXiV. 2017;.
- [27] Wang Y, Yang Z. Priors in Bayesian phylogenetics. Bayesian phylogenetics: methods, algorithms, and applications Chapman and Hall/CRC. 2014;p. 5–23.
- [28] Stamatakis A. RAxML Version 8: A tool for Phylogenetic Analysis and Post-Analysis of Large Phylogenies. Bioinformatics. 2014;.
- [29] Price MN, Dehal PS, Arkin AP. FastTree 2 – Approximately Maximum-Likelihood Trees for Large Alignments. PLOS One. 2010 03;5(3):1–10. Available from: https://doi.org/10.1371/journal.pone.0009490.
- [30] Felsenstein J. Evolutionary trees from DNA sequences: A maximum likelihood approach. J Mol Evol. 1981;17(6):368–376. Available from: http://dx.doi.org/10.1007/BF01734359.
- [31] Hastings WK. Monte Carlo Sampling Methods Using Markov Chains and Their Applications. Biometrika. 1970;57(1):97–109. Available from: http://www.jstor.org/stable/2334940.
- [32] Geyer CJ. Markov chain Monte Carlo maximum likelihood. In: Karamigas E, Kaufman S, editors. Proceedings of 23rd Symposium on the Interface. Fairfax, Virginia: Interface Foundation of North America; 1992. p. 156–163.
- [33] Kouyos RD, von Wyl V, Yerly S, Böni J, Rieder P, Joos B, et al. Ambiguous nucleotide calls from population-based sequencing of HIV-1 are a marker for viral diversity and the age of infection. Clin Infect Dis. 2011 Feb;52(4):532–539.
- [34] Schliep KP. phangorn: phylogenetic analysis in R. Bioinformatics. 2011;27(4):592–593.
- [35] van Sighem A, Nakagawa F, De Angelis D, Quinten C, Bezemer D, de Coul EO, et al. Estimating HIV incidence, time to diagnosis, and the undiagnosed HIV epidemic using routine surveillance data. Epidemiology. 2015;26(5):653.
- [36] Leigh Brown AJ, Lycett SJ, Weinert L, Hughes GJ, Fearnhill E, Dunn DT, et al. Transmission network parameters estimated from HIV sequences for a nationwide epidemic. J Infect Dis. 2011 Nov;204(9):1463–1469.
- [37] Lewis F, Hughes GJ, Rambaut A, Pozniak A, Brown AJL. Episodic sexual transmission of HIV revealed by molecular phylodynamics. PLoS Med. 2008 Mar;5(3):e50.
- [38] Bezemer D, van Sighem A, Lukashov VV, van der Hoek L, Back N, Schuurman R, et al. Transmission networks of HIV-1 among men having sex with men in the Netherlands. AIDS. 2010 Jan;24(2):271–282.
- [39] Avila D, Keiser O, Egger M, Kouyos R, Böni J, Yerly S, et al. Social meets molecular: Combining phylogenetic and latent class analyses to understand HIV-1 transmission in Switzerland. Am J Epidemiol. 2014 Jun;179(12):1514–1525. Available from: http://dx.doi.org/10.1093/aje/kwu076.
- [40] Pons P, Latapy M. Computing communities in large networks using random walks. ArXiv Physics e-prints. 2005 Dec;.
Supplementary Material S1: Cutpoint selection with a partial gold standard
The reference set includes only a small fraction of sequences in the dataset, and acts therefore as a partial gold standard. We select cutpoints for each method as to maximise overlap with that reference set. The lack of a reference solution for other sequences in the sample makes comparison with this standard non-straightforward. Let us assume we have a sample of size , and that sequences - and - form two confirmed clusters, labelled and , respectively. A representation for cluster membership in the full gold standard would be [1, 1, 1, 2, 2, 2, Not 1 or 2, Not 1 or 2, Not 1 or 2, Not 1 or 2]. To best quantify overlap with the full gold standard, in all partitions we test, all sequences that do not co-cluster with any element in the reference set are given a membership index equal to (Number of clusters found among sequences in the reference set + 1). The full gold standard is reformulated in such a way that all sequences outside the reference set are given index (Number of true clusters in the reference set + 1). In the example, the gold standard would be reformulated [1, 1, 1, 2, 2, 2, 3, 3, 3, 3]. Let’s say a clustering algorithm returns configuration [1, 1, 2, 3, 3, 3, 3, 4, 4, 5]. To obtain the correct ARI, we would need to transform it into [1, 1, 2, 3, 3, 3, 3, 4, 4, 4].
Supplementary Material S2: MrBayes script
begin mrbayes; set autoclose=yes nowarn=yes; execute brennerCompleteData.nex; lset nst=6 rates=invgamma; outgroup AB254141; set beaglescaling=dynamic beaglesse=yes; mcmc nruns=2 nchains=4 ngen=3000000 samplefreq=500 diagnfreq=10000 printfreq=500 append=yes; sump relburnin=yes burninfrac=0.25; end;
Supplementary Material S3: Tuning parameters used in the DM-PhyClus and Gap Procedure analyses
DM-PhyClus
-
•
Number of discrete states for the within-cluster and between-cluster transition probability matrices: ,
-
•
Number of samples used to obtain transition probability matrices: ,
-
•
Radius around mean within-cluster and between-cluster branch length estimates: %,
-
•
Discrete gamma distribution parameter: ,
-
•
Bootstrap and distance requirements for initial cluster estimate: %, ,
-
•
Limiting probabilities: ,
-
•
Rate matrix :
-
•
Shape parameter for concentration parameter prior: ,
-
•
Scale parameter for concentration parameter prior: ,
-
•
Poisson rate for weight applied to the cluster membership vector prior: ,
-
•
Number of iterations: .
Gap Procedure
-
•
Threshold for largest gap search: %.
Supplementary Material S4: The linkage estimate
We obtain the linkage estimate by first projecting each cluster membership vector produced by DM-PhyClus as an unweighted undirected network graph, where each sequence is represented by a vertex, and an edge between any two vertex implying co-clustering between the corresponding sequences. For example, cluster membership vector [, , , , , ] would translate as a graph with six vertices, split between two disjoint components, each of those being a fully-connected graph. In other words, all vertices within each component are inter-connected. We can express an unweighted undirected network graph with an adjacency matrix, a symmetric matrix with as many rows and columns as vertices, with a () at position indicating a connection (no connection) between vertices and . Elements on the diagonal are set to .
Once we have adjacency matrices for all cluster membership states visited by the chain, we average all the matrices element-wise, resulting in an adjacency matrix for a weighted undirected network. Values in that matrix, all between and , indicate the strength of the association between any two sequences. We then run the walktrap algorithm on the corresponding graph to identify communities [40]. Communities are sets of vertices that are a lot more interconnected than would be expected from chance alone. The walktrap algorithm works by performing a large number of short random walks on the graph. It starts at a random vertex, and jumps to neighbouring vertices a fixed number of times. It is based on the principle that a short random walk starting in a community is more likely to end up in the same community, because of the high degree of interconnectedness between its vertices. The algorithm then outputs an estimate of community structure in the form of a vector of arbitrary community labels, which corresponds to the desired linkage estimate.
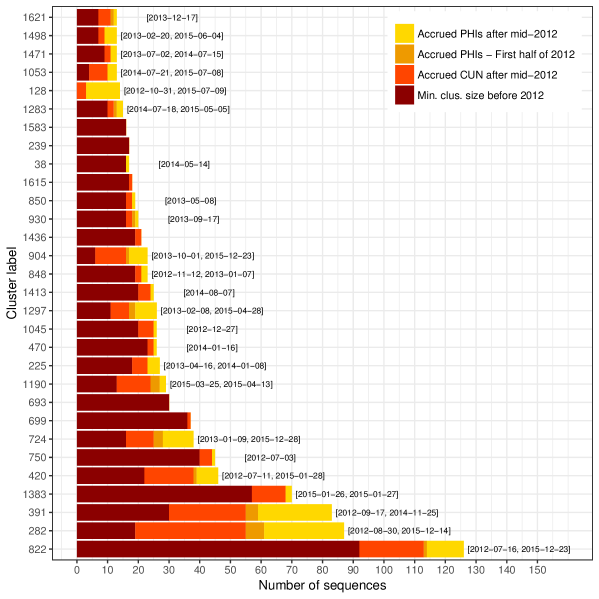
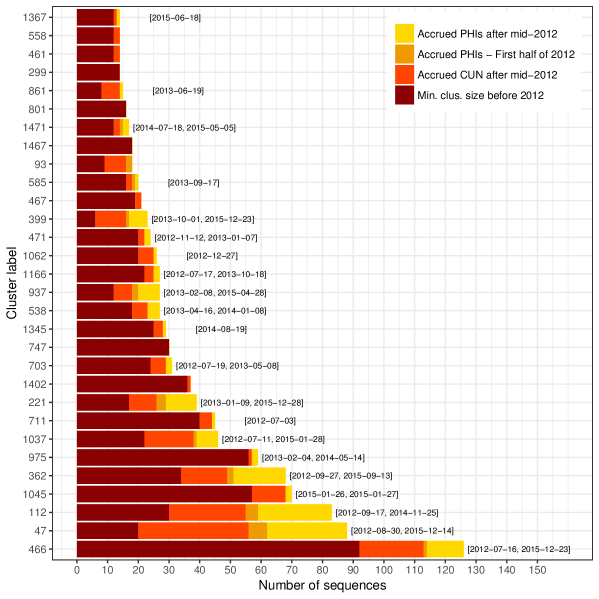
Supplementary Material S5: Additional bar plots depicting cluster growth between January 1st, 2012 and February 1st, 2016
The bar plots in this section can be read like Figures 3 and 4. The labels at the end of each bar indicate the sequence collection dates for the first and last “recent” PHIs in the cluster, that is, recorded on or after July 1st, 2012. When there is only one such PHI, we display the corresponding collection date instead. We assume that all chronic cases recorded before July 1st, 2012 were infected prior to 2012. The dark red bar represents the “minimum cluster size before 2012” because several chronic cases diagnosed after July 1st 2012 were probably infected prior to 2012. Also, it is likely that several PHIs sampled in the first half of 2012 match with transmission events that occurred late in 2011.