Probing the cold dust emission in the AB Aur disk: a dust trap in a decaying vortex? 111Based on observations carried out with the IRAM Northern Extended Millimeter Array (NOEMA). IRAM is supported by INSU/CNRS (France), MPG (Germany), and IGN (Spain).
Abstract
One serious challenge for planet formation is the rapid inward drift of pebble-sized dust particles in protoplanetary disks. Dust trapping at local maxima in the disk gas pressure has received much theoretical attention but still lacks observational support. The cold dust emission in the AB Aur disk forms an asymmetric ring at a radius of about 120 au, which is suggestive of dust trapping in a gas vortex. We present high spatial resolution (0”.580”.78 80110 au) NOEMA observations of the 1.12 mm and 2.22 mm dust continuum emission from the AB Aur disk. Significant azimuthal variations of the flux ratio at both wavelengths indicate a size segregation of the large dust particles along the ring. Our continuum images also show that the intensity variations along the ring are smaller at 2.22 mm than at 1.12 mm, contrary to what dust trapping models with a gas vortex have predicted. Our two-fluid (gas+dust) hydrodynamical simulations demonstrate that this feature is well explained if the gas vortex has started to decay due to turbulent diffusion, and dust particles are thus losing the azimuthal trapping on different timescales depending on their size. The comparison between our observations and simulations allows us to constrain the size distribution and the total mass of solid particles in the ring, which we find to be of the order of 30 Earth masses, enough to form future rocky planets.
1 Introduction
The physical mechanism behind the formation of planetesimals remains elusive. One of the main challenges is to avoid the rapid radial drift of solid particles toward the star as they progressively decouple from the gas. Planetesimal formation should therefore occur on timescales shorter than the radial drift of solid particles, which can be very fast for cm-sized pebbles (Johansen et al., 2014). One way to halt the radial drift is to trap solid particles at a local maximum in the disk gas pressure, which may occur for example at the outer edge of the gap opened by a massive planet (e.g., Lyra et al. 2009) or at the edge between regions with different levels of magnetohydrodynamic turbulence (Regály et al., 2012; Flock et al., 2015). These so-called dust traps are promising locations for forming planetesimals and planetary cores, and are therefore receiving a lot of theoretical attention.
Disk observations can bring valuable constraints on the dust trap scenario for planetesimal formation. This is the case of transition disks, which are protoplanetary disks that feature an inner region with a large deficit in mid-IR and (sub-)mm emission, best understood as a dust cavity, and which is surrounded by a bright emission ring in the (sub-)mm (Espaillat et al., 2014). The emission ring of transition disks is sometimes lopsided and multi-wavelength radio observations suggest that these lopsided rings are caused by a large-scale gas vortex that trap the large (typically mm-sized) solid particles. This is the case for instance of the disks around Oph IRS 48 (van der Marel et al., 2015) and HD 142527 (Casassus et al., 2015).
A large theoretical effort has been made in recent years to investigate the formation and evolution of gas vortices in protoplanetary disks, and to determine the dust’s concentration, growth and emission properties at such locations. This effort has been made possible by the development of two-fluid hydrodynamical codes that model the evolution of both the gas and dust of protoplanetary disks. In particular, hydrodynamical simulations show that (i) the gaseous gap carved by a giant planet could explain the large dust cavities seen in the radio emission of some transition disks (Zhu et al., 2012), (ii) the outer edge of this gap might become unstable against the Rossby-wave instability (a linear instability setting at a minimum in the gas potential vorticity or, in practice, at a pressure maximum) and form a large crescent-shaped vortex (Zhu & Baruteau, 2016), and (iii) such large-scale gas vortices impart different trapping locations for small and large solid particles due to the gas self-gravity, with small dust grains trapped at the vortex’s center but the larger ( a few mm) particles trapped largely ahead of the vortex in the azimuthal direction (Baruteau & Zhu, 2016). This size segregation of particles trapped in vortices leaves imprints to the dust’s continuum emission in the (sub-)mm (Baruteau & Zhu, 2016) and may have important implications for planetesimal formation.
The comparison between theoretical models and observations is, of course, not straightforward. Part of the reason is that, even in the era of large (sub-)mm telescopes (NOEMA, ALMA), spatially resolving disks at sufficient sensitivity is challenging. But also, interpreting the emission is uncertain due to assumptions for the dust temperature and opacity. Because of its large cavity and large (sub)mm flux, AB Aur is one of the few nearby transition disks that allows a fair comparison with models.
AB Aur is a nearby Herbig Ae star (A0-A1, d=145 pc, Hernández et al., 2004; Gaia Collaboration et al., 2016) that hosts a well-known lopsided transition disk. Plateau de Bure Interferometer (PdBI) images of the CO 21 and 13CO 21 lines and of the continuum emission at 1.3 mm indicate that the dust cavity radius in the AB Aur disk extends up to 70100 au (0”.50”.7; Piétu et al., 2005; Pacheco-Vázquez et al., 2016). The higher angular resolution observations by Tang et al. (2012) showed the existence of a compact inner disk inside the dust cavity with a small (few degrees) inclination relative to the dust ring. The 1.3 mm continuum emission from the ring outside the cavity is highly non-axisymmetric suggestive of a dust trap. Spirals detected in both the CO gas emission (Tang et al., 2012, 2017) and in near infrared scattered light emission (Hashimoto et al., 2011) are suggestive of the presence of at least one massive companion in the disk (Dong et al., 2016).
We present in Sect. 2 high spatial resolution (0”.58 0”.78) NOEMA observations of the 1.12 and 2.22 mm dust continuum emission in the AB Aur disk. Synthetic maps of the dust continuum emission computed from two-fluid (gas+dust) hydrodynamical simulations are then presented in Sect. 3. Concluding remarks follow in Sect. 4.
2 Data reduction and observational results
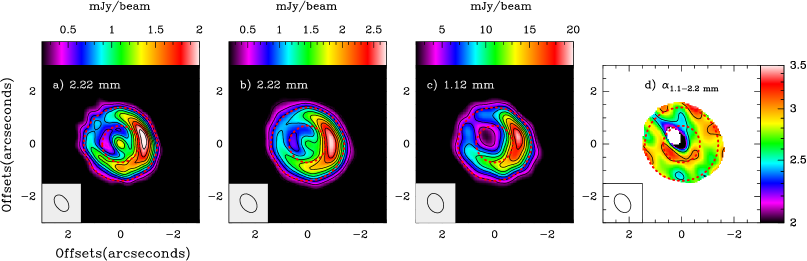
Our AB Aur observations were carried out in the C-config (baselines=72-240 m) at 266 GHz (1.12 mm) in 2016 December 4-6, and in the A-config (baselines=72-760 m) at 135 GHz (2.22 mm) in 2017 January 1-3. Data calibration and imaging were done using the package GILDAS222See http://www.iram.fr/IRAMFR/GILDAS for more information about the GILDAS softwares (Piétu et al., 2005)./CLASS software. We tried to self-calibrate the images to improve the S/N ratio. However, the improvement was not significant and after some preliminary tests, we decided to keep the non-self calibrated images at both wavelengths, in order to avoid any bias in the cleaning process because of the assumed source model. In order to optimize the spatial resolution we applied uniform weighting to both images. The achieved synthesized beams and rms noise levels are 0”.710”.46 PA 36∘ and 45 Jy/beam at 2.22 mm, and 0”.780”.58 PA 33∘ and 340 Jy/beam at 1.12 mm. The final images are shown in Fig. 1a and 1c. Flux calibration uncertainty is 10% in both images.
Our 2.22 mm image (Fig. 1a) shows a compact emission peak at RA: 04h55m45s.853, Dec: 30∘33′03′′.82, which agrees with the optical position of the star and the 7 mm continuum source detected by Rodríguez et al. (2014). This point source is not clear in the 1.12 mm image (Fig. 1c) because of the lower spatial resolution at this frequency. To investigate the nature of the emission of this compact source, we derived the cm-mm spectral index. The best fit is obtained with a spectral index of 0.730.08, which is consistent with the spectral indices expected for a radial thermal (free-free) jet (e.g., Reynolds, 1986). Yet, some fraction of the flux could come from a small dusty disk inside the cavity.
A lopsided ring is observed in the 1.12 and 2.22 mm continuum emission maps. To make a reliable comparison between both emission maps, we produced a 2.22 mm image with the tapering required in the uv-plane to get the same spatial resolution as in the 1.12 mm image.The resulting image is shown in Fig. 1b. A particularly interesting result is that the azimuthal contrast ratio along the ring is smaller at 2.22 mm than at 1.12 mm (this ratio is 2.50.2 and 3.60.3 at 2.22 mm and 1.12 mm, respectively, at the same angular resolution of 0”.780”.58). This is the opposite to what is usually expected from models of dust trapping in a gas vortex, which predict that the larger the particles, the stronger their concentration in the vortex and therefore the larger their emission if optically thin (e.g. Pinilla et al., 2015). We used these images to derive the spectral index () map defined as (see Fig. 1d). Only 10 fluxes were taken into account to compute the flux ratio map, hence we expect that the uncertainty in our ratio is by , which translates in an error of in the 1.12 mm/2.22 mm spectral index. We detect a slight asymmetry in such map, which is related to the different azimuthal contrast ratios in the 1.12 mm and 2.22 mm images.
The asymmetry in the spectral index can be related with a change in the dust properties if the emission is optically thin. At 1mm, the beam-averaged peak brightness temperature is 0.9 K. Assuming that the width of the dusty ring is 0”.1, the real brightness temperature would be of 7.2 K, well below the dust temperature, Td=30 K (Pacheco-Vázquez et al., 2015), and consistent with the assumption of optically thin emission. Of course we might have some inhomogeneities within the ring where the optical depth could be larger. In our model (see Sect. 3.2) we predict a maximum optical depth of 0.9 in the dust trap, that is barely optically thick.
3 Hydrodynamical simulations and synthetic maps of dust emission
3.1 Methodology
We carried out a two-fluid (gas+dust) hydrodynamical simulation of the AB Aur disk using the code Dusty FARGO-ADSG, an extended version of the public code FARGO-ADSG (Masset, 2000; Baruteau & Masset, 2008) which includes dust (Baruteau & Zhu, 2016). We assume that the dust cavity is carved by a 2-Jupiter mass planet on a fixed circular orbit at 96 au from the star (its mass is set to based on the spectral type of AB Aur, DeWarf et al., 2003). The gas continuity and momentum equations are solved on a polar grid with cylindrical coordinates . We use 400 grid cells logarithmically spaced in radius between 28 and 268 au, and 600 cells evenly spaced in azimuth between 0 and 2. A locally isothermal equation of state is used with the gas temperature fixed in time, given by . It corresponds to a disk’s aspect ratio () of 0.1 at 96 au. Gas self-gravity is included and the effects of turbulence are modeled by a constant alpha turbulent viscosity with . The initial gas surface density is which corresponds to a total gas mass of (Tang et al., 2012). To avoid reflections of the planet wakes near the grid’s radial edges, so-called wave-killing zones are used where gas fields are damped toward their initial radial profile.
Dust is modeled as Lagrangian test particles that feel the gravity of the star, planet and gas (since gas self-gravity is accounted for) and gas drag. Turbulence is modeled by applying stochastic kicks to the particles radius and azimuth at each timestep of the simulation, following the approach of Charnoz et al. (2011) and prescribing the dust’s turbulent diffusion coefficient as in Youdin & Lithwick (2007). For computational reasons, in the simulation we use particles with a size distribution for particle sizes between 10 m and 10 cm. Note that the assumed grain size distribution does not affect the particles dynamics for a given size. Dust self-gravity, growth, fragmentation and drag onto the gas are not taken into account. The particles internal density is 2 g cm-3, and their temperature is that of the gas at their location.
From the spatial distribution of the solid particles in our simulation we compute synthetic maps of the dust’s continuum emission at 1.12 and 2.22 mm. This requires specifying the dust’s size distribution in the modeled disk as well as the total mass of dust. We take , a minimum particle size of 10 m (as in the simulation) but the maximum particle size is set as a free parameter (with an upper limit at 10 cm since it is the maximum particle size in the simulation). The total dust mass is also taken as a free parameter. Opacities are computed with Mie theory assuming 60% astrosilicates and 40% water ices. Optical constants for water ices are obtained from the Jena database333www.astro.uni-jena.de/Laboratory/Database/databases.html, those of astrosilicates are from Draine & Lee (1984). The disk is taken to be 145 pc away, with an inclination of 26∘ and a position angle of -30∘ (Tang et al., 2012).
3.2 Results
The planet forms a large-scale vortex in the gas due to the Rossby-wave instability (Lovelace et al., 1999) developing at the pressure maximum located at the outer edge of the planet’s gap in the gas (at about 150 au). Dust particles are initially introduced between 144 and 182 au so that the large majority of them drift toward the pressure maximum. This is meant to maximize the particles resolution at that location, where we aim at predicting the dust’s continuum emission. Contours of the gas surface density with the particles location overplotted by colored dots are displayed in Figs. 2a and 2b after 200 planet orbits (that is, at 0.12 Myr). They show that the larger the particles, the further they are trapped ahead of the vortex’s center in the azimuthal direction. This size segregation arises from the vortex’s self-gravity (Baruteau & Zhu, 2016). Figs. 2c and 2d show the synthetic maps at 1.12 and 2.22 mm at the same time. They are obtained for a maximum particle size of 1 cm, and a total dust mass of about . Comparison with Fig. 2a shows that the synthetic emission maps peak near the vortex’s center and are much less extended azimuthally than in the observations (compare with Figs. 1a to 1c).
The gas vortex however has a finite lifetime and ultimately decays due to gas turbulent diffusion. It implies that dust particles progressively lose the azimuthal trapping effect of the vortex. As illustrated at 370 orbits (0.22 Myr) in Figs. 2e and 2f, particles progressively acquire a near uniform spatial distribution in azimuth along the pressure maximum. Particles lose memory of their azimuthal trapping within different timescales depending on their size, due to the combined action of (size-dependent) gas drag and dust’s turbulent diffusion (a more detailed description of this result will be presented by Baruteau et al., 2018). The synthetic maps in Figs. 2g and 2h show that, during the vortex decay, the continuum emission forms a lopsided ring with intensity variations along the ring that are consistent with our NOEMA observations. The optical depth at the flux peak prior to convolution is and 0.4 at 1.12 and 2.22 mm, respectively, so the dust’s continuum emission is marginally optically thick at these positions. Comparison with Figs. 2c and 2d highlights that the ring’s observed properties can only be reproduced when the vortex has started to decay. Note that this result is an evolutionary trend that does not depend on the exact values of the dust mass and grain size distribution and suggests the presence of a decaying vortex in AB Auriga.
We point out that particles are also trapped in the Lagrangian point located 60∘ beyond the planet’s location. Their continuum emission is a small fraction (a few percent) of the averaged flux in the ring, and an angular resolution would be required to unambiguously disentangle the emission in the Lagrangian point from that in the ring, which our model predicts to have a radial width of about 15 au (0”.1).
We computed series of synthetic maps of the dust’s continuum emission at 1.12 and 2.22 mm in a decaying vortex (370 orbits) by varying the maximum particle size and the dust mass in the ring. For each set of parameters we calculated the total flux in the ring and the azimuthal contrast ratio of the flux along the ring. Results are displayed in Fig. 3. In each plot, the white contours show the approximate NOEMA values with 10% uncertainty, while the red cross marks our best-fit model, which corresponds to the maximum particle size (1 cm) and dust mass in the ring () and was used to compute the synthetic maps in Fig. 2 to illustrate the vortex evolution.
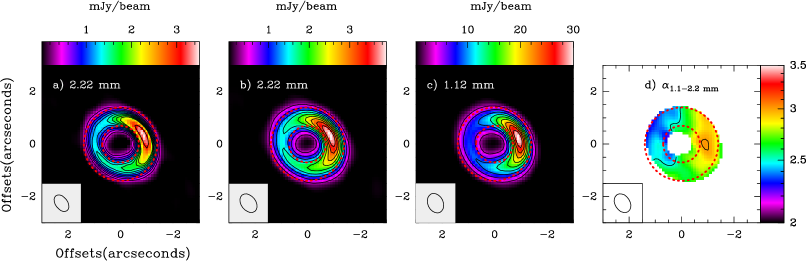
Finally, we made a detailed comparison of our best-fit model with the observed images. Since interferometric measurements might miss flux at the largest spatial scales, convolution of the synthetic raw flux maps with a Gaussian beam may not properly compare with observations. We thus processed the raw flux maps with the task uvfmodel of the GILDAS software to produce synthetic images with the same uv-coverage and weights as our observations. The raw flux maps were rotated in azimuth such that the location of the flux peak predicted at 1.12 mm matches approximately that in the observations. Results are shown in Fig. 4. Our modeled flux maps are in reasonably agreement with the NOEMA flux maps and reproduce well the intensity variations along the emission ring, the total flux along the ring as well as the flux value at the emission peak at the two wavelengths. The modeled and observed spectral index maps (Figs. 1d and 4d) also show overall good agreement.
4 Concluding remarks
Our NOEMA observations of the dust’s continuum emission at 1.12 and 2.22 mm in the AB Aur disk show that the intensity variations along the emission ring at au are smaller at 2.22 mm than at 1.12 mm. Two-fluid (gas+dust) simulations can explain this feature by dust trapping in a gas vortex due to a putative 2-Jupiter-mass planet companion at 96 au, provided that the vortex has started to decay, and that solid particles are therefore losing the azimuthal trapping effect of the vortex. Synthetic maps of the dust’s continuum emission computed from our simulations can reproduce the total flux in, and the intensity variations along the ring, if the trapped particles have a size distribution in , a maximum size of 1 cm, and that the mass of solid particles in the ring is . This value is consistent with that found by Tang et al. (2012, ) when assuming a global dust opacity = 0.02 cm2 g-1. Future multi-wavelength, higher angular resolution observations would be needed to confirm our findings and would allow to accurately dissect the dust ring.
References
- Baruteau & Masset (2008) Baruteau, C., & Masset, F. 2008, ApJ, 678, 483
- Baruteau & Zhu (2016) Baruteau, C., & Zhu, Z. 2016, MNRAS, 458, 3927
- Baruteau et al. (2018) Baruteau, C., Zhu, Z., Pérez, S., Carmona, A., in preparation
- Casassus et al. (2015) Casassus, S., Wright, C. M., Marino, S., et al. 2015, ApJ, 812, 126
- Charnoz et al. (2011) Charnoz, S., Fouchet, L., Aleon, J., & Moreira, M. 2011, ApJ, 737, 33
- DeWarf et al. (2003) DeWarf, L. E., Sepinsky, J. F., Guinan, E. F., Ribas, I., & Nadalin, I. 2003, ApJ, 590, 357
- Dong et al. (2016) Dong, R., Fung, J., & Chiang, E. 2016, ApJ, 826, 75
- Draine & Lee (1984) Draine, B. T., & Lee, H. M. 1984, ApJ, 285, 89
- Espaillat et al. (2014) Espaillat, C., Muzerolle, J., Najita, J., et al. 2014, Protostars and Planets VI, 497
- Flock et al. (2015) Flock, M., Ruge, J. P., Dzyurkevich, N., et al. 2015, A&A, 574, A68
- Gaia Collaboration et al. (2016) Gaia Collaboration, Brown, A. G. A., Vallenari, A., et al. 2016, A&A, 595, A2
- Hashimoto et al. (2011) Hashimoto, J., Tamura, M., Muto, T., et al. 2011, ApJ, 729, L17
- Hernández et al. (2004) Hernández, J., Calvet, N., Briceño, C., Hartmann, L., & Berlind, P. 2004, AJ, 127, 1682
- Johansen et al. (2014) Johansen, A., Blum, J., Tanaka, H., et al. 2014, Protostars and Planets VI, 547
- Lovelace et al. (1999) Lovelace, R. V. E., Li, H., Colgate, S. A., & Nelson, A. F. 1999, ApJ, 513, 805
- Lyra et al. (2009) Lyra, W., Johansen, A., Zsom, A., Klahr, H., & Piskunov, N. 2009, A&A, 497, 869
- Masset (2000) Masset, F. 2000, A&AS, 141, 165
- Pacheco-Vázquez et al. (2015) Pacheco-Vázquez, S., Fuente, A., Agúndez, M., et al. 2015, A&A, 578, A81
- Pacheco-Vázquez et al. (2016) Pacheco-Vázquez, S., Fuente, A., Baruteau, C., et al. 2016, A&A, 589, A60
- Piétu et al. (2005) Piétu, V., Guilloteau, S., & Dutrey, A. 2005, A&A, 443, 945
- Pinilla et al. (2015) Pinilla, P., van der Marel, N., Pérez, L. M., et al. 2015, A&A, 584, A16
- Regály et al. (2012) Regály, Z., Juhász, A., Sándor, Z., & Dullemond, C. P. 2012, MNRAS, 419, 1701
- Reynolds (1986) Reynolds, S. P. 1986, ApJ, 304, 713
- Rodríguez et al. (2014) Rodríguez, L. F., Zapata, L. A., Dzib, S. A., et al. 2014, ApJ, 793, L21
- Tang et al. (2012) Tang, Y.-W., Guilloteau, S., Piétu, V., et al. 2012, A&A, 547, A84
- Tang et al. (2017) Tang, Y.-W., Guilloteau, S., Dutrey, A., et al. 2017, ApJ, 840, 32
- van der Marel et al. (2015) van der Marel, N., Pinilla, P., Tobin, J., et al. 2015, ApJ, 810, L7
- Youdin & Lithwick (2007) Youdin, A. N., & Lithwick, Y. 2007, Icarus, 192, 588
- Zhu & Baruteau (2016) Zhu, Z., & Baruteau, C. 2016, MNRAS, 458, 3918
- Zhu et al. (2012) Zhu, Z., Nelson, R. P., Dong, R., Espaillat, C., & Hartmann, L. 2012, ApJ, 755, 6