Present address: ]Department of Physics, University of Warwick, Gibbet Hill Road, Coventry, CV4 7AL, United Kingdom
Quasi-two-dimensional Fermi surfaces with localized electrons in the layered heavy-fermion compound CePt2In7
Abstract
We report measurements of the de Haas-van Alphen effect in the layered heavy-fermion compound CePt2In7 in high magnetic fields up to 35 T. Above an angle-dependent threshold field, we observed several de Haas-van Alphen frequencies originating from almost ideally two-dimensional Fermi surfaces. The frequencies are similar to those previously observed to develop only above a much higher field of 45 T, where a clear anomaly was detected and proposed to originate from a change in the electronic structure [M. M. Altarawneh et al., Phys. Rev. B 83, 081103 (2011)]. Our experimental results are compared with band structure calculations performed for both CePt2In7 and LaPt2In7, and the comparison suggests localized electrons in CePt2In7. This conclusion is further supported by comparing experimentally observed Fermi surfaces in CePt2In7 and PrPt2In7, which are found to be almost identical. The measured effective masses in CePt2In7 are only moderately enhanced above the bare electron mass , from 2 to 6.
I Introduction
Quantum critical points (QCPs) are a subject of considerable interest within the condensed-matter community. Heavy-fermion (HF) materials are particularly important in this context, as they can be conveniently tuned to QCPs by hydrostatic pressure, chemical doping, or magnetic field. Structural and magnetic dimensionality play a significant role in the physics of these materials, with reduced dimensionality understood to increase the strength of electronic correlations Shishido et al. (2010); Mizukami et al. (2011). Recently, a zero-temperature global phase diagram of heavy-fermion compounds with two types of quantum critical points was proposed, where the magnetic dimensionality is an important parameter Si (2006, 2010); Custers et al. (2012); Si et al. (2014). Within this theoretical model, two-dimensionality favors the so-called local or Kondo-breakdown-type QCP Coleman et al. (2001); Si et al. (2001, 2003), while a more conventional spin-density-wave-type QCP Moriya and Takimoto (1995); Hertz (1976); Millis (1993) is expected in three dimensions . One way to distinguish between these two types of QCPs is to determine whether the electrons are itinerant or localized, i.e., whether or not they contribute to the Fermi surface (FS), on both sides of the QCP. This can be achieved by comparing experimentally established FS topology with the results of band structure calculations performed for both itinerant and localized electrons. Magnetic quantum oscillations, such as the de Haas-van Alphen (dHvA) effect, are the most direct way to establish the FS topology of a metal. The reduced dimensionality of the FS is also expected to enhance unconventional superconductivity Monthoux (2003), which is often observed in HF systems in the vicinity of a QCP. It has been demonstrated experimentally that the FS dimensionality is indeed one of the key parameters determining the superconducting critical temperature in HF materials Götze et al. (2015), so precise knowledge of the topology, particularly the dimensionality, of the FS of HF materials close to a QCP is of primary importance.
Antiferromagnetic CeRhIn5 with a tetragonal crystal structure and a Néel temperature 3.8 K Hegger et al. (2000) is one of the best-studied HF compounds. In this material, a QCP associated with the suppression of antiferromagnetism can be induced by either pressure Knebel et al. (2006); Park et al. (2006) or high magnetic field Jiao et al. (2015). In the former case, dHvA frequencies change abruptly, and effective masses diverge exactly at the critical pressure 2.35 GPa required to suppress antiferromagnetic order Shishido et al. (2005). While the dHvA frequencies measured at ambient and low pressure correspond to localized electrons, those observed above suggest that the electrons contribute to the FS. Therefore, the pressure-induced QCP is of the Kondo-breakdown type. In high magnetic fields, on the other hand, new dHvA frequencies are reported to appear at 30 T, well below the critical field 50 T to suppress antiferromagnetism Jiao et al. (2015). These new frequencies persist unchanged to fields above 50 T. Thus, the field-induced QCP in CeRhIn5 appears to be of the spin-density-wave type.
CePt2In7 crystalizes into a body-centered tetragonal crystal structure Kurenbaeva et al. (2008); Tobash et al. (2012); Klimczuk et al. (2014). Remarkably, some details of the crystal structure of this compound, such as the exact position of the atoms and occupancy of the atomic sites, were initially wrongly assumed Kurenbaeva et al. (2008); Tobash et al. (2012) and corrected only recently Klimczuk et al. (2014). Although the crystal structures of CePt2In7 and CeRhIn5 are different, both compounds belong to the family of CeIn3n+2m ( is transition metal, 1, 2, 0, 1, 2), containing a sequence of CeIn3 layers intercalated by In2 layers along the axis. In these systems, the FS dimensionality is expected to decrease with increasing distance between CeIn3 layers. The building block of the series, CeIn3 (, ), crystallizes into a simple cubic structure and has an isotropic FS. The layered structures, with 0, are characterized by strongly anisotropic properties and quasi-two-dimensional (quasi-2D) FS. Indeed, quasi-2D FS sheets were observed in the monolayer (, ) system CeRhIn5 Shishido et al. (2002); Hall et al. (2002). In CePt2In7 (, ), where CeIn3 layers are separated by two PtIn2 layers, the FS is expected to be more 2D.
The physical properties of CePt2In7 and CeRhIn5 also have a lot of similarities. CePt2In7 orders antiferromagnetically at a Néel temperature 5.5 K Bauer et al. (2010), slightly higher than that of CeRhIn5. Similar to that of CeRhIn5, the antiferromagnetic order in CePt2In7 is suppressed by pressure, and a pressure-induced QCP was reported to occur at a critical pressure 3.2–3.5 GPa Bauer et al. (2010); Sidorov et al. (2013); Kurahashi et al. (2015). Superconductivity with a critical temperature 2.1 K at Sidorov et al. (2013) was observed in both polycrystalline samples Bauer et al. (2010) and single crystals Sidorov et al. (2013); Kurahashi et al. (2015). The critical temperature is similar to that observed in CeRhIn5 and is one of the highest among Ce-based HF materials. It was recently reported that in CePt2In7 is also suppressed by a magnetic field applied along either the or axis, possibly giving rise to a QCP slightly below 60 T Krupko et al. (2016), again in close similarity to CeRhIn5 Jiao et al. (2015).
Previously reported magnetic quantum oscillation measurements in CePt2In7 performed in pulsed magnetic fields by the tunnel-diode-oscillator technique Altarawneh et al. (2011) suggest that the compound comes closer to realizing a 2D analog of CeIn3 than CeRhIn5. In these measurements, only small and almost isotropic FS pockets, with dHvA frequencies below 2 kT, exhibiting field-dependent effective masses were observed below a distinct anomaly that occurs at 45 T. Above , however, much higher dHvA frequencies corresponding to three almost ideally 2D FS sheets were detected. A feature similar to was previously observed in CeIn3 at about the same field Purcell et al. (2009), where the dHvA frequencies also change. More recently, however, the same high dHvA frequencies were observed below in CePt2In7 Miyake et al. (2015). This questions a change in the dHvA frequencies at in CePt2In7, and, therefore, the degree of similarity between this compound and CeIn3. These conflicting results demand further investigation. Furthermore, it is still not clear whether a Fermi surface reconstruction occurs in CePt2In7 deep inside the antiferromagnetic phase, as in CeRhIn5 Jiao et al. (2015), or the observation of the high dHvA frequencies below is due to magnetic breakdown.
Another open question is whether the electrons are itinerant or localized in CePt2In7, especially at zero and low magnetic fields. The angle dependence of the dHvA frequencies previously observed above were found to be in good agreement with the results of band structure calculations in which the electrons are confined mostly to their atomic cores Altarawneh et al. (2011). The observation of the same frequencies below Miyake et al. (2015) suggests that the electrons are also localized at low magnetic fields. However, these band structure calculations were performed assuming the wrong crystal structure of CePt2In7. More recently, it was demonstrated that the band structure calculations assuming the correct crystal structure result in different topology of the FS Klimczuk et al. (2014). Finally, angle-resolved photoemission spectroscopy measurements on CePt2In7 were very recently reported Shen et al. (2017), and the results were compared with band structure calculations assuming itinerant electrons. Most of the observed electronic features could be accounted for by the calculations, although some discrepancies were also found.
In this paper, we report dHvA measurements in CePt2In7 and PrPt2In7, which is known to have localized electrons, in magnetic fields up to 35 T. The dominant observed FSs in both compounds are almost ideally two-dimensional, as is expected from their crystal structure. The FSs of the two compounds are almost identical and are well described by the band structure calculations performed for LaPt2In7, implying localized electrons in CePt2In7. The effective masses we observe in CePt2In7, in fields up to 35 T, are only moderately enhanced above a bare electron mass but are, nevertheless, somewhat larger than those observed at much higher magnetic fields above in Ref. Altarawneh et al., 2011.
II Experimental details
High quality single crystals of CePt2In7 and PrPt2In7 used for the dHvA measurements reported here were grown by an In self-flux method, and the details are given elsewhere Kurahashi et al. (2015). The resulting single crystals are small thin platelets with the crystallographic axis perpendicular to their large surfaces. The CePt2In7 and PrPt2In7 samples were prepared using the same procedure. Measurements of the dHvA effect were performed using a conventional torque magnetometry technique. The measurements on CePt2In7 were carried out using either a metallic cantilever in a top-loading dilution refrigerator in fields up to 35 T or a piezoresistive microcantilever in a 3He cryostat up to 33 T. The CePt2In7 sample mounted on the metallic cantilever is the same single crystal used for previous specific-heat measurements Krupko et al. (2016), which confirmed the absence of any impurity phases. A smaller sample from the same batch was chosen for microcantilever measurements. The dHvA measurements on a PrPt2In7 sample mounted on a metallic cantilever were performed either in a top-loading dilution refrigerator in fields up to 35 T or in a variable-temperature insert in a superconducting magnet up to 16 T.
III Results and discussion
III.1 dHvA oscillations
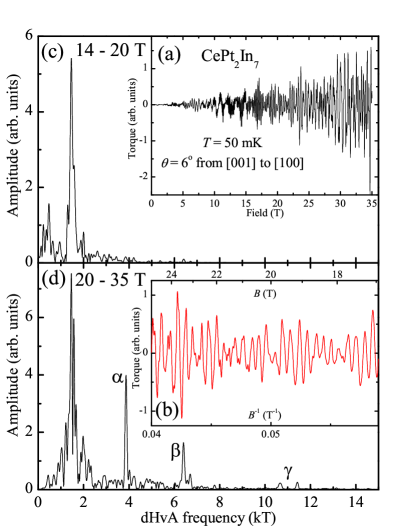
Figure 1(a) shows the oscillatory torque after subtracting a nonoscillating background in CePt2In7 over the whole field range up to 35 T. The oscillations appear at fields as low as 2 T, confirming the high quality of our sample. However, only relatively low dHvA frequencies, up to 2 kT, are observed in magnetic fields up to about 20 T. Above this field, additional higher dHvA frequencies start to develop, as can be seen in Fig. 1(b), which shows a high-field zoom of the oscillations. This is further confirmed by the fast Fourier transform (FFT) spectra of the oscillations below and above 20 T shown in Figs. 1(c) and 1(d), respectively. Three high fundamental frequencies, denoted , , and , are observed when is applied at 6∘ from the to the axis above 20 T. The values of the high dHvA frequencies we observe here are in good agreement with those reported by Altarawneh et al Altarawneh et al. (2011). In their work, the high frequencies were observed only above 45 T, where a distinct anomaly in the tunnel-diode-oscillator signal occurs Altarawneh et al. (2011). In our measurements the high dHvA frequencies emerge at a much lower field.
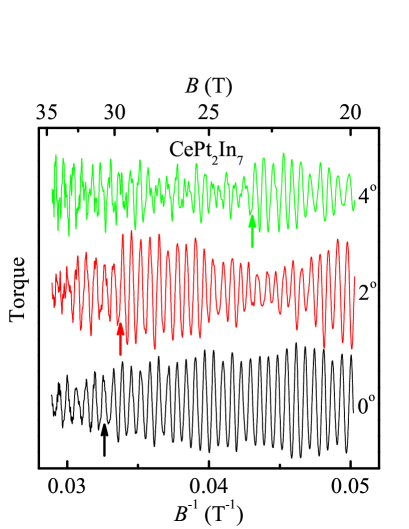
It would be tempting to ascribe the appearance of the high dHvA frequencies to a FS modification associated with a change in the electron character from localized to itinerant, similar to the case for CeRhIn5 Jiao et al. (2015). However, in CeRhIn5 the higher frequencies appear suddenly above T, which does not depend on the orientation of the magnetic field. In CePt2In7, on the contrary, the high-frequency oscillations develop above a certain value of the magnetic field, which is strongly field orientation dependent, decreasing as the field is tilted away from the axis, as shown in Fig. 2. Furthermore, as will be shown in the following, the angle dependence of the observed high dHvA frequencies unambiguously suggests that they originate from the FSs with localized electrons.
The most likely scenario is that the high frequencies appear at a relatively high field due to the development of magnetic breakdown orbits that span multiple FSs. Indeed, the antiferromagnetic ordering modifies the original crystallographic Brillouin zone. The magnetic structure of CePt2In7 Raba et al. (2017); Gauthier et al. (2017) implies that its antiferromagnetic Brillouin zone is 8 times smaller than the paramagnetic Brillouin zone. This results in fragmentation of the large FSs that exceed the size of the antiferromagnetic Brillouin zone, T. Most of the low dHvA frequencies observed at low magnetic fields are likely to originate from such fragmented FSs. The larger orbits can, however, be recovered through a magnetic breakdown. For such an anisotropic system as CePt2In7 the magnetic breakdown field is also expected to be strongly anisotropic, which is in keeping with our results. This scenario is further supported by recent specific-heat measurements suggesting that an anisotropic spin-density wave opens a gap on almost the entire FS below the Néel temperature at zero magnetic field Krupko et al. (2016). Indeed, gapped FSs can be observed in quantum oscillation measurements only at magnetic fields high enough to ensure the tunneling of quasiparticles through the gap, i.e., the magnetic breakdown.
III.2 Band structure calculations
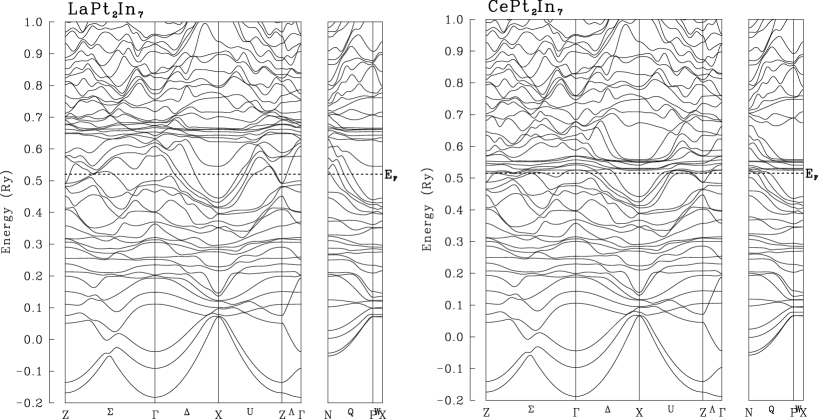
To ascertain whether the electrons are itinerant or localized in CePt2In7, we performed band structure calculations for both CePt2In7 and LaPt2In7, with the latter corresponding to localized electrons. The electronic band structure of both compounds was calculated within the local-density approximation (LDA) by using a full-potential linearized augmented plane-wave method. For the LDA, the formula proposed by Gunnarsson and Lundqvist Gunnarsson and Lundqvist (1976) was used. The calculations were performed using the program codes TSPACE and KANSAI-13. Scalar relativistic effects are taken into account for all electrons, and spin-orbit interactions are included self-consistently for all valence electrons, as in a second variational procedure.
The space group of CePt2In7 is (number 139 D) Klimczuk et al. (2014). The lattice parameters used for the calculation are Å and Å, for 4 positions of Pt atoms, and for 8 positions of In atoms Haga . These parameters are similar to those reported by Klimczuk et al. Klimczuk et al. (2014). There are no position parameters for Ce atoms in the 2 position, or for In atoms in 2 and 4 positions. As single crystals of LaPt2In7 are presently unavailable, the same lattice parameters were used for LaPt2In7 calculations. Muffin-tin (MT) radii are set as 0.3542 for Ce(La), and 0.2806 for both Pt and In. Core electrons [Xe core minus 55 for Ce(La), Xe core minus 5 plus 4 for Pt, and Kr core plus 4 for In] are calculated inside the MT spheres in each self-consistent step. The 55 electrons of Ce(La), 5 electrons of Pt, and 4 electrons of In are calculated as valence electrons by using the second energy window.
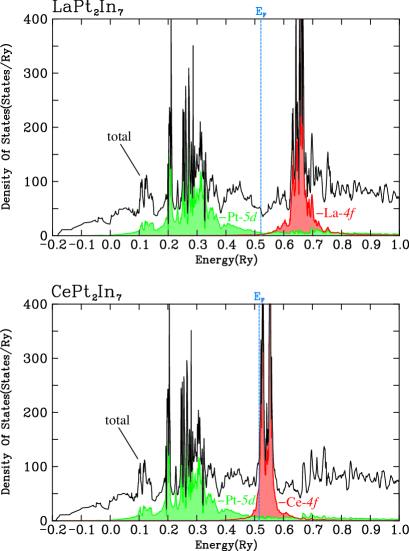
The linearized augmented plane-wave (LAPW) basis functions were truncated at , corresponding to 1115 LAPW functions at the point. The 308 sampling -points, which are uniformly distributed in the irreducible 16th of the Brillouin zone (divided by 20, 20, and 4), are used both for the potential convergence and for the final band structure. The calculated band structure and the density of states are shown in Figs. 3 and 4, respectively. The calculated FSs are shown in Fig. 5.
III.3 Comparison with band structure calculations
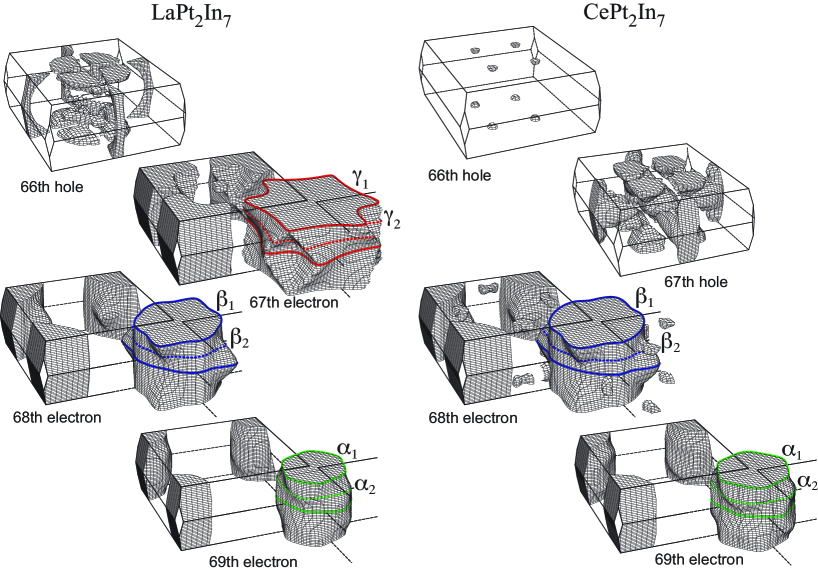
As LaPt2In7 and CePt2In7 have the same layered crystal structure, it is expected that some of the calculated FS sheets are quasi-2D in both cases. Indeed, the quasi-2D FSs originating from bands 68 and 69, giving rise to orbits and , respectively, are very similar in both compounds, the main difference being that they are slightly smaller in the La compound. The details of the other FS sheets are, however, different. While band 66 contains only one tiny pocket for CePt2In7, there are several large pockets in the case of LaPt2In7. The most essential difference, however, is the topology of the FSs originating from the hole band 67. For CePt2In7, this band contains two types of moderate-size pockets that give rise to relatively small orbits. On the contrary, for LaPt2In7, the quasi-2D FS of band 67 gives rise to very large orbits and . This difference alone allows us to decide which of the calculated FSs yields a better agreement with the experimental results.
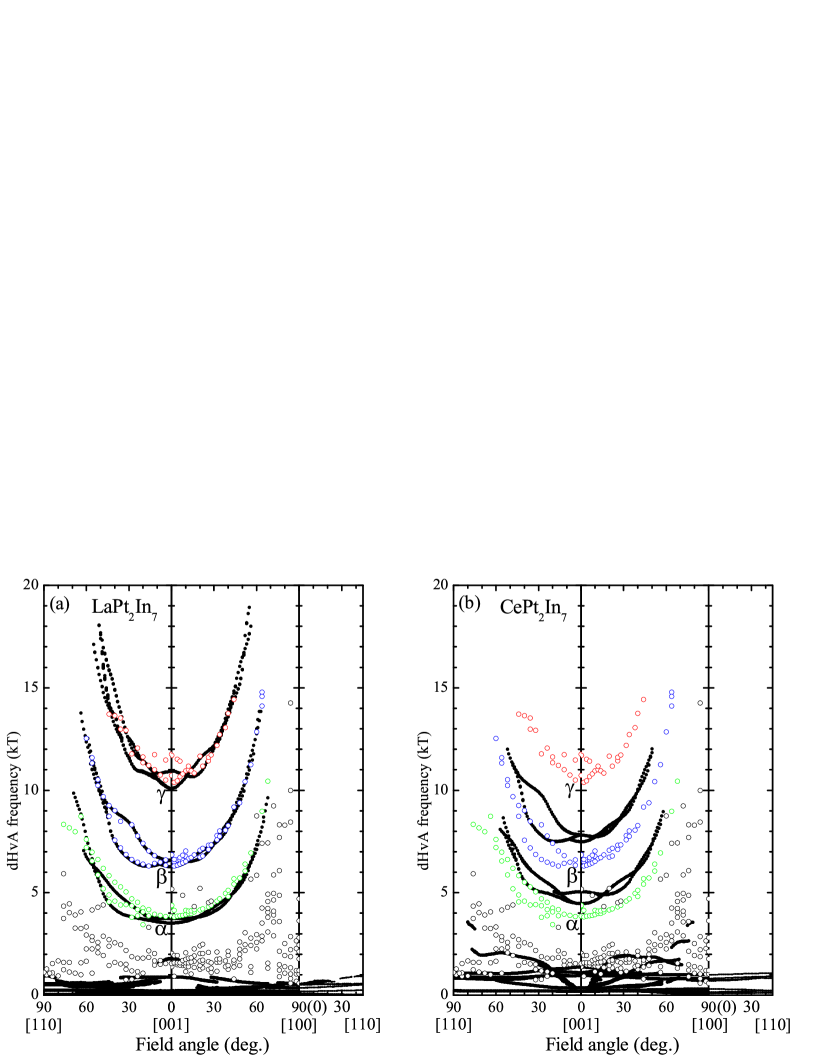
Figure 6(a) shows the angle dependence of the dHvA frequencies observed in CePt2In7 together with the results of the band structure calculations for LaPt2In7, which correspond to CePt2In7 with localized electrons. Experimental and calculated frequencies and effective masses are also shown in Table 1. The agreement between the experimentally observed , , and branches and those of the calculations is excellent. Not only is the shape of the curves the same, but the absolute values are almost identical. This implies that both the topology and the size of the calculated FS sheets reproduce well the experimental results. There are a number of lower dHvA frequencies observed in the experiment which are not predicted by the band structure calculations. These low frequencies are probably due to the modification of the Brillouin zone in the antiferromagnetic state, as all the calculations were performed for a paramagnetic ground state. A similar situation with unpredicted low frequencies was also observed in CeRhIn5 Shishido et al. (2002).
Contrary to the 4-localized case, the agreement between the calculations for CePt2In7 with itinerant electrons and the experimental results is not nearly as good, as can be seen in Fig. 6(b). The experimentally observed and branches are shifted downwards compared to the calculated ones (see also Table 1). Most important, however, is the absence of the branch in the band structure calculations with itinerant electrons.
The comparison of the experimentally observed angle dependence of the dHvA frequencies with the results of the band structure calculations strongly suggests that the electrons are localized in CePt2In7.

| Experiment | Calculations | |||||||
|---|---|---|---|---|---|---|---|---|
| CePt2In7 | PrPt2In7 | LaPt2In7 | CePt2In7 | |||||
| Branch | (kT) | (kT) | (kT) | (kT) | ||||
| 3.87 | 2.270.04 | 3.85 | 0.690.02 | 3.55 | 0.49 | 4.52 | 1.29 | |
| 4.03 | 4.06 | 3.75 | 0.55 | 5.01 | 1.58 | |||
| 6.40 | 5.350.06 | 6.41 | 1.10.1 | 6.35 | 0.62 | 7.58 | 1.47 | |
| 6.60 | 6.66 | 6.55 | 0.65 | 7.76 | 1.46 | |||
| 10.67 | 5.10.2 | 10.64 | 1.40.1 | 10.32 | 1.14 | |||
| 11.43 | 6.20.3 | 11.12 | 1.50.2 | 10.84 | 1.06 | |||
III.4 Comparison with PrPt2In7
The most direct way to confirm that the electrons are localized in CePt2In7 would be to compare the dHvA frequencies and their angle dependence in both CePt2In7 and LaPt2In7. This is, however, not possible since LaPt2In7 single crystals are currently unavailable, as was already mentioned above. We therefore performed dHvA measurements in PrPt2In7. As the electrons of Pr are known to be well localized, the FS of PrPt2In7 is expected to be nearly the same as that of LaPt2In7.
Figure 7 shows the oscillatory torque, after subtracting a nonoscillating background, and the corresponding Fourier transform in PrPt2In7 for magnetic field applied at 6∘ from to the axis, the same orientation as for the data in Fig. 1. The same fundamental frequencies, , , and , are observed at the same values as in CePt2In7. The main difference in the FFT spectra of the two compounds is the number of low frequencies, which is much lower in PrPt2In7. This implies that the main large FSs of the two compounds are almost identical, but there are many more small pockets in CePt2In7 compared to PrPt2In7.
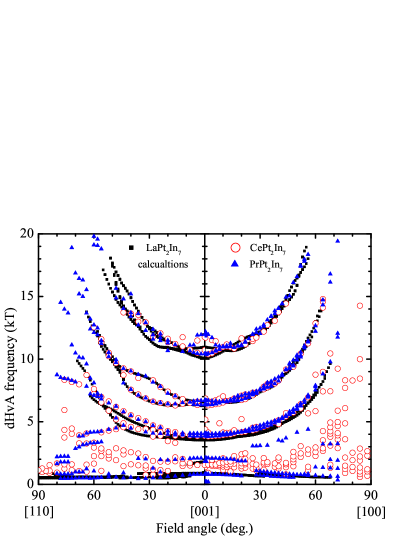
In Fig. 8, we compare the angle dependence of the experimentally observed dHvA frequencies in both CePt2In7 and PrPt2In7 with the calculated angle dependence for LaPt2In7, which corresponds to the case with localized electrons. The excellent agreement of the experimentally measured angle dependence of the main dHvA frequencies , , and observed in CePt2In7 and PrPt2In7 gives further confirmation that the electrons are localized in CePt2In7. Moreover, the comparison suggests that most of the low dHvA frequencies observed in CePt2In7 correspond to small FS pockets originating from the fragmentation of the FS upon the formation of the antiferromagnetic Brillouin zone.
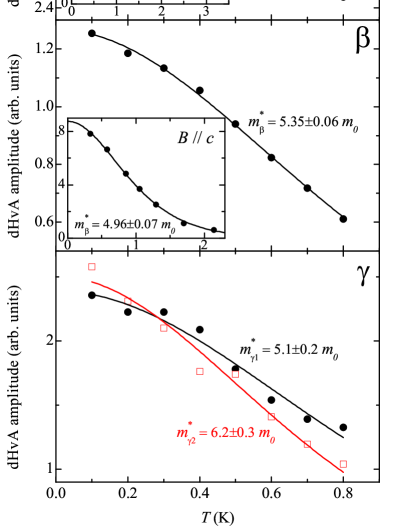
III.5 Effective mass
The effective masses of the main FS branches , , and of CePt2In7 were determined by fitting the temperature dependence of the oscillatory amplitude by the standard Lifshitz-Kosevich formula Shoenberg (1984), as shown in Fig. 9. This was done for the magnetic field applied at 6∘ from to the axis, in a dilution refrigerator, in the temperature range from 50 to 800 mK and over the field range from 24 to 34.5 T. The results are given in Table 1. The effective mass of the branch is rather small, just slightly over 2 ( is the bare electron mass). The masses of the and branches are somewhat higher, ranging from 5 to 6. As the obtained effective masses are only moderately enhanced, the temperature dependences of the oscillation amplitudes were also measured on a smaller sample in a 3He cryostat in the temperature range from 0.33 to about 3 K. These measurements were performed for magnetic field applied parallel to the axis over the field range from 29 to 33 T and for field applied at 9∘ from towards the axis over the field range from 24 to 33 T. In this case, only a few of the high frequencies had large enough amplitudes to allow the determination of the effective mass. However, the effective masses, which were possible to extract from these higher-temperature measurements, agree very well with the values obtained at a lower temperature and a slightly different angle. The calculated band masses of the thermodynamically important quasi-2D FS sheets of both CePt2In7 and LaPt2In7 for the magnetic field applied at 6∘ off the axis are also shown in Table 1. The LDA calculations do not take strong electronic correlations into account and provide only the band masses. That is why the calculated masses for CePt2In7 are of the order of a bare electron mass. The effective masses measured in PrPt2In7 are much smaller than the effective masses measured in CePt2In7 but are comparable to the band masses calculated for LaPt2In7. This confirms the expected absence of strong electronic correlations in PrPt2In7.
The effective masses measured in CePt2In7 account reasonably well for this material’s moderate specific-heat coefficient Krupko et al. (2016). This value of is considerably smaller than the value of reported for CeRhIn5 Cornelius et al. (2000, 2001), despite the similarities in the effective masses of the two compounds (masses of 3.5–6 were reported for quasi-2D FSs of CeRhIn5 Hall et al. (2001); Shishido et al. (2002)). However, some of the theoretically predicted FS orbits were not observed experimentally in CeRhIn5, whereas we have observed all the large, dominant FSs in CePt2In7 and PrPt2In7.
Finally, the effective masses we detected in magnetic fields below 35 T in CePt2In7 are somewhat higher than the values reported at much higher magnetic fields, above 45 T Altarawneh et al. (2011). This difference is, however, too small to explain why the high dHvA frequencies were not observed below in the previous measurements. It is not clear at present whether the effective masses decrease continuously with magnetic field or change abruptly at , whose origin is as yet unknown. Careful low-temperature measurements in pulsed magnetic fields are required to clarify this issue.
III.6 CePt2In7 Fermi surface dimensionality
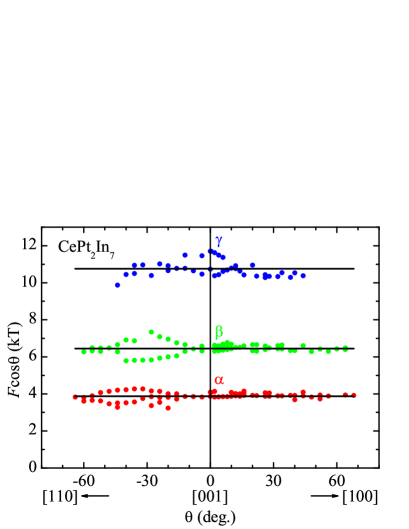
As shown in Fig. 5, the major FS sheets calculated for LaPt2In7 are quasi-2D slightly corrugated cylinders extending along the axis. Given the excellent agreement between the angle dependence of dHvA frequencies measured in CePt2In7 and the results of calculations for LaPt2In7, we can say that the FSs calculated for the latter compound represent the real FSs of CePt2In7. As many of the physical properties of HF materials strongly depend on the FS dimensionality, it is important to estimate to what extent the FSs of CePt2In7 can be approximated by cylinders typical for an ideal 2D system. For an ideal cylindrical FS, the angle dependence of its cross section and, therefore, of the dHvA frequency is given by , where is the dHvA frequency for field applied along the axis and is the angle between the axis and the magnetic field. Therefore, should be independent of angle. Figure 10 shows the measured values of plotted as a function of for the three main FSs of CePt2In7. For all three FSs, is almost independent of angle for the magnetic field applied in the [001]-[100] plane, in agreement with previously reported results Altarawneh et al. (2011). For the field applied in the [001]-[110] plane, the dispersion is slightly larger, in agreement with calculated FSs shown in Fig. 5. However, the deviation from the average values remains relatively small, below 10%, thus indicating that the main FS sheets of CePt2In7 are close to being ideal cylinders.
IV Conclusions
In summary, we performed dHvA effect measurements in CePt2In7 and PrPt2In7 in high magnetic fields. The observed dHvA frequencies and their angle dependence were found to be almost identical in the two compounds. This implies that the main FSs are nearly the same in these two materials. These main FSs are close to cylindrical, i.e., almost ideally 2D, as is expected from the characteristic layered crystal structure. However, in CePt2In7 the dHvA frequencies corresponding to the large quasi-2D FSs are detected only above a certain angle-dependent threshold magnetic field, which is, however, much lower than 45 T previously reported Altarawneh et al. (2011). This calls into question the degree of similarity between CePt2In7 and CeIn3 suggested in the previous work Altarawneh et al. (2011). The existence of a threshold field is likely due to the modification of the paramagnetic Brillouin zone by antiferromagnetic ordering. In this scenario, the original paramagnetic FSs can be observed as a result of magnetic breakdown that begins to occur at high magnetic fields.
The comparison of the experimental results with band structure calculations suggests unambiguously that the electrons are localized and do not contribute to the Fermi volume in CePt2In7. The same conclusion was drawn for both CeIn3 Ebihara et al. (1993); Endo et al. (2005) and CeRhIn5 Shishido et al. (2002) deep inside the antiferromagnetic state. In these compounds, however, a FS reconstruction occurs when antiferromagnetism is suppressed by either pressure Settai et al. (2005); Shishido et al. (2005) or magnetic field Harrison et al. (2007); Jiao et al. (2015). From this point of view, it would be interesting to investigate if and how the FS of CePt2In7 changes across the quantum critical points induced by pressure or magnetic field.
Acknowledgements.
We are grateful to Y. Haga for the determination and sharing with us the details of the crystal structure of PrPt2In7. We acknowledge the support of the HFML-RU/FOM, the LNCMI-CNRS, and the HLD-HZDR, members of the European Magnetic Field Laboratory (EMFL), ANR-DFG grant “Fermi-NESt,” and JSPS KAKENHI Grants No. JP15H05882, No. JP15H05884, No. JP15H05886, No. JP15K21732 (J-Physics). K.G. acknowledges support from the DFG within GRK 1621. R.D.H.H. acknowledges financial support from the Radboud Honours Academy of the Faculty of Science.References
- Shishido et al. (2010) H. Shishido, T. Shibauchi, K. Yasu, T. Kato, H. Kontani, T. Terashima, and Y. Matsuda, Science 327, 980 (2010).
- Mizukami et al. (2011) Y. Mizukami, H. Shishido, T. Shibauchi, M. Shimozawa, S. Yasumoto, D. Watanabe, M. Yamashita, H. Ikeda, T. Terashima, H. Kontani, and Y. Matsuda, Nat. Phys. 7, 849 (2011).
- Si (2006) Q. Si, Physica B 378-380, 23 (2006).
- Si (2010) Q. Si, Phys. Status Solidi B 247, 476 (2010).
- Custers et al. (2012) J. Custers, K.-A. Lorenzer, M. Müller, A. Prokofiev, A. Sidorenko, H. Winkler, A. M. Strydom, Y. Shimura, T. Sakakibara, R. Yu, Q. Si, and S. Paschen, Nat. Mater. 11, 189 (2012).
- Si et al. (2014) Q. Si, J. H. Pixley, E. Nica, S. J. Yamamoto, P. Goswami, R. Yu, and S. Kirchner, J. Phys. Soc. Jpn. 83, 061005 (2014).
- Coleman et al. (2001) P. Coleman, C. Pépin, Q. Si, and R. Ramazashvili, J. Phys.: Condens. Matter 13, R723 (2001).
- Si et al. (2001) Q. Si, S. Rabello, K. Ingersent, and J. L. Smith, Nature 413, 804 (2001).
- Si et al. (2003) Q. Si, S. Rabello, K. Ingersent, and J. L. Smith, Phys. Rev. B 68, 115103 (2003).
- Moriya and Takimoto (1995) T. Moriya and T. Takimoto, J. Phys. Soc. Jpn. 64, 960 (1995).
- Hertz (1976) J. A. Hertz, Phys. Rev. B 14, 1165 (1976).
- Millis (1993) A. J. Millis, Phys. Rev. B 48, 7183 (1993).
- Monthoux (2003) P. Monthoux, J. Phys.: Condens. Matter 15, S1973 (2003).
- Götze et al. (2015) K. Götze, J. Klotz, D. Gnida, H. Harima, D. Aoki, A. Demuer, S. Elgazzar, J. Wosnitza, D. Kaczorowski, and I. Sheikin, Phys. Rev. B 92, 115141 (2015).
- Hegger et al. (2000) H. Hegger, C. Petrovic, E. G. Moshopoulou, M. F. Hundley, J. L. Sarrao, Z. Fisk, and J. D. Thompson, Phys. Rev. Lett. 84, 4986 (2000).
- Knebel et al. (2006) G. Knebel, D. Aoki, D. Braithwaite, B. Salce, and J. Flouquet, Phys. Rev. B 74, 020501 (2006).
- Park et al. (2006) T. Park, F. Ronning, H. Q. Yuan, M. B. Salamon, R. Movshovich, J. L. Sarrao, and J. D. Thompson, Nature 440, 65 (2006).
- Jiao et al. (2015) L. Jiao, Y. Chen, Y. Kohama, D. Graf, E. D. Bauer, J. Singleton, J.-X. Zhu, Z. Weng, G. Pang, T. Shang, J. Zhang, H.-O. Lee, T. Park, M. Jaime, J. D. Thompson, F. Steglich, Q. Si, and H. Q. Yuan, Proc. Natl. Acad. Sci. USA 112, 673 (2015).
- Shishido et al. (2005) H. Shishido, R. Settai, H. Harima, and Y. Ōnuki, J. Phys. Soc. Jpn. 74, 1103 (2005).
- Kurenbaeva et al. (2008) Z. Kurenbaeva, E. Murashova, Y. Seropegin, H. No l, and A. Tursina, Intermetallics 16, 979 (2008).
- Tobash et al. (2012) P. H. Tobash, F. Ronning, J. D. Thompson, B. L. Scott, P. J. W. Moll, B. Batlogg, and E. D. Bauer, J. Phys.: Condens. Matter 24, 015601 (2012).
- Klimczuk et al. (2014) T. Klimczuk, O. Walter, L. Müchler, J. W. Krizan, F. Kinnart, and R. J. Cava, J. Phys.: Condens. Matter 26, 402201 (2014).
- Shishido et al. (2002) H. Shishido, R. Settai, D. Aoki, S. Ikeda, H. Nakawaki, N. Nakamura, T. Iizuka, Y. Inada, K. Sugiyama, T. Takeuchi, K. Kindo, T. Kobayashi, Y. Haga, H. Harima, Y. Aoki, T. Namiki, H. Sato, and Y. Ōnuki, J. Phys. Soc. Jpn. 71, 162 (2002).
- Hall et al. (2002) D. Hall, T. P. Murphy, E. C. Palm, S. W. Tozer, Z. Fisk, N. Harrison, R. G. Goodrich, U. Alver, and J. L. Sarrao, Int. J. Mod. Phys. B 16, 3004 (2002).
- Bauer et al. (2010) E. D. Bauer, H. O. Lee, V. A. Sidorov, N. Kurita, K. Gofryk, J.-X. Zhu, F. Ronning, R. Movshovich, J. D. Thompson, and T. Park, Phys. Rev. B 81, 180507 (2010).
- Sidorov et al. (2013) V. A. Sidorov, X. Lu, T. Park, H. Lee, P. H. Tobash, R. E. Baumbach, F. Ronning, E. D. Bauer, and J. D. Thompson, Phys. Rev. B 88, 020503 (2013).
- Kurahashi et al. (2015) S. Kurahashi, S. Ota, S. Tomaru, Y. Hirose, and R. Settai, J. Phys.: Conf. Ser. 592, 012006 (2015).
- Krupko et al. (2016) Y. Krupko, A. Demuer, S. Ota, Y. Hirose, R. Settai, and I. Sheikin, Phys. Rev. B 93, 085121 (2016).
- Altarawneh et al. (2011) M. M. Altarawneh, N. Harrison, R. D. McDonald, F. F. Balakirev, C. H. Mielke, P. H. Tobash, J.-X. Zhu, J. D. Thompson, F. Ronning, and E. D. Bauer, Phys. Rev. B 83, 081103 (2011).
- Purcell et al. (2009) K. M. Purcell, D. Graf, M. Kano, J. Bourg, E. C. Palm, T. Murphy, R. McDonald, C. H. Mielke, M. M. Altarawneh, C. Petrovic, R. Hu, T. Ebihara, J. Cooley, P. Schlottmann, and S. W. Tozer, Phys. Rev. B 79, 214428 (2009).
- Miyake et al. (2015) A. Miyake, Y. Kohama, S. Ohta, Y. Hirose, R. Settai, K. Matsubayashi, Y. Uwatoko, A. Matsuo, K. Kindo, and M. Tokunaga, J. Phys.: Conf. Ser. 592, 012149 (2015).
- Shen et al. (2017) B. Shen, L. Yu, K. Liu, S.-P. Lyu, X.-W. Jia, E. D. Bauer, J. D. Thompson, Y. Zhang, C.-L. Wang, C. Hu, Y. Ding, X. Sun, Y. Hu, J. Liu, Q. Gao, L. Zhao, G.-D. Liu, Z.-Y. Xu, C.-T. Chen, Z.-Y. Lu, and X. J. Zhou, Chin. Phys. B 26, 077401 (2017).
- Raba et al. (2017) M. Raba, E. Ressouche, N. Qureshi, C. V. Colin, V. Nassif, S. Ota, Y. Hirose, R. Settai, P. Rodière, and I. Sheikin, Phys. Rev. B 95, 161102 (2017).
- Gauthier et al. (2017) N. Gauthier, D. Wermeille, N. Casati, H. Sakai, R. E. Baumbach, E. D. Bauer, and J. S. White, Phys. Rev. B 96, 064414 (2017).
- Gunnarsson and Lundqvist (1976) O. Gunnarsson and B. I. Lundqvist, Phys. Rev. B 13, 4274 (1976).
- (36) Y. Haga, private communication.
- Shoenberg (1984) D. Shoenberg, Magnetic oscillations in metals (Cambridge University Press, 1984).
- Cornelius et al. (2000) A. L. Cornelius, A. J. Arko, J. L. Sarrao, M. F. Hundley, and Z. Fisk, Phys. Rev. B 62, 14181 (2000).
- Cornelius et al. (2001) A. L. Cornelius, P. G. Pagliuso, M. F. Hundley, and J. L. Sarrao, Phys. Rev. B 64, 144411 (2001).
- Hall et al. (2001) D. Hall, E. C. Palm, T. P. Murphy, S. W. Tozer, C. Petrovic, E. Miller-Ricci, L. Peabody, C. Q. H. Li, U. Alver, R. G. Goodrich, J. L. Sarrao, P. G. Pagliuso, J. M. Wills, and Z. Fisk, Phys. Rev. B 64, 064506 (2001).
- Ebihara et al. (1993) T. Ebihara, I. Umehara, A. Albessard, K. Satoh, and Y. Ōnuki, Physica B 186-188, 123 (1993).
- Endo et al. (2005) M. Endo, N. Kimura, and H. Aoki, J. Phys. Soc. Jpn. 74, 3295 (2005).
- Settai et al. (2005) R. Settai, T. Kubo, T. Shiromoto, D. Honda, H. Shishido, K. Sugiyama, Y. Haga, T. D. Matsuda, K. Betsuyaku, H. Harima, T. C. Kobayashi, and Y. Ōnuki, J. Phys. Soc. Jpn. 74, 3016 (2005).
- Harrison et al. (2007) N. Harrison, S. E. Sebastian, C. H. Mielke, A. Paris, M. J. Gordon, C. A. Swenson, D. G. Rickel, M. D. Pacheco, P. F. Ruminer, J. B. Schillig, J. R. Sims, A. H. Lacerda, M.-T. Suzuki, H. Harima, and T. Ebihara, Phys. Rev. Lett. 99, 056401 (2007).