Are High Redshift Galaxies hot? - Temperature of Galaxies and Implications on their Dust Properties
Abstract
Recent studies have found a significant evolution and scatter in the IRX relation at , suggesting different dust properties of these galaxies. The total far-infrared (FIR) luminosity is key for this analysis but poorly constrained in normal (main-sequence) star-forming galaxies where often only one single FIR point is available. To better inform estimates of the FIR luminosity, we construct a sample of local galaxies and three low-redshift analogs of systems. The trends in this sample suggest that normal high-redshift galaxies have a warmer infrared (IR) SED compared to average galaxies that are used as prior in these studies. The blue-shifted peak and mid-IR excess emission could be explained by a combination of a larger fraction of the metal-poor inter-stellar medium (ISM) being optically thin to ultra-violet (UV) light and a stronger UV radiation field due to high star formation densities. Assuming a maximally warm IR SED suggests increased total FIR luminosities, which removes some tension between dust attenuation models and observations of the IRX relation at . Despite this, some galaxies still fall below the minimum IRX relation derived with standard dust cloud models. We propose that radiation pressure in these highly star-forming galaxies causes a spatial offset between dust clouds and young star-forming regions within the lifetime of O/B stars. These offsets change the radiation balance and create viewing-angle effects that can change UV colors at fixed IRX. We provide a modified model that can explain the location of these galaxies on the IRX diagram.
=10
1 Introduction
Modern galaxy surveys have provided large and robust samples of galaxies that span a wide range of properties. These rich datasets are beginning to give us insights into the physical properties of early galaxies only one billion year after the Big Bang. In particular, the specific star formation rate (sSFR; the rate of mass build-up) is found to increase rapidly by more than a factor of 50 with increasing redshift at (e.g., Elbaz et al., 2007; Daddi et al., 2007; Noeske et al., 2007; Karim et al., 2011; Ilbert et al., 2015) and is expected to keep rising continuously out to (Schaerer et al., 2013; Stark et al., 2013; de Barros et al., 2014; González et al., 2014; Tasca et al., 2015; Jiang et al., 2016; Faisst et al., 2016a; Mármol-Queraltó et al., 2016). While the average low-redshift star-forming galaxy is represented by a smooth bulge/disk profile, galaxies in the early Universe are irregular with turbulent clumps in the ultra-violet (UV) light representing regions of on-going vigorous star formation (e.g., Elmegreen et al., 2009; Förster Schreiber et al., 2011; Hemmati et al., 2014; Tacchella et al., 2015; Mason et al., 2016). Furthermore, the amount of dust-obscured star formation increases significantly between where it can be measured directly and appears to begin declining at based on UV colors, indicating a change in the inter-stellar medium (ISM) properties of galaxies in the early Universe (e.g., Bouwens et al., 2009, 2012; Feldmann, 2015). However, the far-infrared (FIR) properties of normal111As opposed to sub-millimeter galaxies (SMGs) and dusty star-forming galaxies (DSFGs) for which rich data sets in the FIR are available out to high redshifts. main-sequence galaxies have been difficult to study even with the Atacama Large Millimeter Array (ALMA), mostly providing only one single data point at these wavelengths.
The IRX diagram (Meurer et al., 1995, 1999) is one of the few probes available to-date to study the ISM properties for large samples of normal galaxies within reasonable observation times on the facilities that are currently available. This diagram connects the ratio of total FIR to UV luminosity ()222The UV luminosity () is defined as the monochromatic luminosity measured at rest-frame . The total FIR luminosity (, sometimes also called “TIR”) is integrated at . with the UV continuum spectral slope ()333The UV continuum slope (defined as ) is derived for (e.g., Meurer et al., 1999).. While the former is a proxy of the total dust mass, the latter depends on the column density of dust along the line-of-sight to the observer that is attenuating the UV light of stars and hence creating a red UV color. The relation is therefore sensitive to a range of ISM properties including dust geometries, dust-to-gas ratios, dust grain properties, and the spatial distribution of dust. Furthermore, the scatter and trends in this diagram are strongly related to evolutionary trends in the ISM. It is further to note here, that the UV slope also depends on other galaxy properties such as star-formation history (SFH), age of the stellar population, and metallicity. However, in comparison to dust, these effects are shown to contribute little to in the case of young galaxies in the early Universe (Bouwens et al., 2012; Scoville et al., 2015).
Studies of low-redshift galaxies have shown that galaxies of different types populate different regions on the IRX diagram. Specifically, young metal-poor galaxies similar to the Small Magellanic cloud (SMC) show a flatter relation between IRX and compared to local starburst galaxies, which occupy regions of higher IRX at similar (e.g., Buat et al., 2005; Siana et al., 2009; Buat et al., 2010; Howell et al., 2010; Reddy et al., 2010; Takeuchi et al., 2010; Overzier et al., 2011; Boquien et al., 2012; Reddy et al., 2012; Battisti et al., 2017). The differences between these populations of galaxies on the IRX diagram can be attributed to differences in the shape of the internal dust attenuation curves (e.g., Gordon et al., 2000; Burgarella et al., 2005; Buat et al., 2012; Battisti et al., 2017), different star-formation histories (e.g., Kong et al., 2004; Boquien et al., 2009; Muñoz-Mateos et al., 2009), and/or different dust geometries (Seibert et al., 2005; Cortese et al., 2006; Boquien et al., 2009; Muñoz-Mateos et al., 2009). Studies at suggest IRX relations similar to local starbursts with no significant evolution (e.g., Reddy et al., 2006, 2012; Heinis et al., 2013; To et al., 2014; Bourne et al., 2017; Fudamoto et al., 2017), however, stacking analyses at suggest significant deviations from this relation for luminous and young Lyman Break galaxies (Lee et al., 2012; Coppin et al., 2015; Fudamoto et al., 2017). While the Hubble Space Telescope (HST) and ground based facilities provide us with accurate measurements on the rest-frame UV properties of high-redshift galaxies, the high sensitivity of millimeter-wave interferometers such as ALMA, the Plateau de Bure Interferometer (PdBI), and its successor the Northern Extended Millimeter Array (NOEMA) enable us to push the measurement of the FIR properties of individual galaxies to higher and higher redshifts (Walter et al., 2012; Kanekar et al., 2013; Ouchi et al., 2013; González-López et al., 2014; Ota et al., 2014; Riechers et al., 2014; Schaerer et al., 2015; Capak et al., 2015; Maiolino et al., 2015; Watson et al., 2015; Willott et al., 2015; Aravena et al., 2016; Bouwens et al., 2016; Carilli et al., 2016; Dunlop, 2016; Knudsen et al., 2016; Miller et al., 2016; Pavesi et al., 2016; Knudsen et al., 2017).
Capak et al. (2015) (hereafter C15) provided the first study of the IRX diagram at with a diverse sample of galaxies observed in ALMA band 7 at rest-frame . Together with deep HST near-IR imaging providing accurate UV colors for this sample (Barišić et al., 2017), these studies suggest a significant evolution of the IRX relation and its scatter at (see also Fudamoto et al., 2017). Although some galaxies are found to be consistent with the relation of local starbursts, more than half of the galaxies show a substantial deficit in IRX at a range of UV colors compared to the samples at . Such galaxies are curious because their location on the IRX diagram is difficult to be explained with current models for dust attenuation (Charlot & Fall, 2000) even for very low dust opacities and steep internal dust attenuation curves such as observed in the metal-poor SMC.
Because of the poor constraints in the FIR, a common (partial) solution to this discrepancy is to assume increasing dust temperatures towards high redshifts (Capak et al., 2015; Bouwens et al., 2016; Fudamoto et al., 2017; Narayanan et al., 2017). However, also a significantly altered geometric distribution of stars and dust in these galaxies could explain their low IRX values.
In this paper we try to understand the causes of such low IRX values in this high-redshift sample by exploring the infrared (IR) spectral energy distribution (SED) and the distribution of dust and stars.
We begin by investigating the FIR luminosities of these galaxies which are derived from only one continuum data point at and are therefore very poorly constrained. Importantly, the shape of the IR SED is assumed from models that are fit at . In particular, the luminosity weighted temperature (referred to as “temperature” in this paper and not to be confused with the single blackbody temperature , see Casey, 2012) that is accounting for mid-IR excess emission is crucial for defining the shape of the IR SED and therefore the FIR luminosity. Hence, it has a significant impact on the IRX relation. Several studies suggest and expect a higher temperature in highly star-forming high-redshift galaxies due to a stronger UV radiation field in low-metallicity environments (Sklias et al., 2014; Béthermin et al., 2015; Strandet et al., 2016; Schreiber et al., 2017) and as a function of various galaxy properties (Chapman et al., 2003; Magdis et al., 2012; Magnelli et al., 2014). Such an evolving temperature could bring these galaxies in agreement with local IRX relations (Capak et al., 2015; Bouwens et al., 2016; Fudamoto et al., 2017; Narayanan et al., 2017). A direct measurement of this temperature is, however, very difficult to obtain for main-sequence star-forming galaxies at (see Appendix A). Hence, our best chance to make progress is to investigate statistically correlations between temperature and other physical properties in large samples of low-redshift galaxies together with the study low-redshift analogs of such galaxies. We stress that this is by no means a bulletproof approach, but it allows us to gain a picture of galaxies in the early Universe and will lead and define follow-up explorations of these galaxies with future facilities that can refine the conclusions of this work.
Furthermore, the geometry of the dust distribution in high-redshift galaxies could be substantially different due to their turbulent nature – something that is mostly not considered in recent studies. As we will show in this paper, this can lead naturally to a low IRX value and a large range of UV colors an thus can explain extreme cases in the galaxy population at high redshifts.
This work is organized as follows: In Section 2, we present FIR measurements and their correlation with other physical properties for local galaxies from the literature along with three Ly emitting galaxies which appear to be good analogs of high-redshift () galaxies. We then investigate the impact of different galaxy properties on the IRX relations from a model and observational point-of-view, which will allow us to explain empirically a possible evolution of the IRX relation to high redshifts (Section 3). In Section 4, we revisit the C15 galaxies, derive FIR luminosities using the priors on IR SED shape from the low-redshift samples, and present an updated IRX diagram at . Finally, we propose a simple analytical model for the dust distribution in high-redshift galaxies that can describe the observed deficit in IRX by taking into account a non-uniform distribution of dust and stars (Section 4.5).
2 FIR properties of local and low-redshift galaxies
One way of understanding the high-redshift universe is to assemble a sample of low-redshift objects which are “analogs” to the high-redshift population. These analogs typically can provide much more detailed data, and can be used to construct priors on the physical properties of high-redshift galaxies. However, a key shortcoming of this technique is that the low-redshift sample is often an analog in only a few parameters, and so extrapolations must be made. As such it is essential to carefully study the low-redshift sample and determine how well it matches the higher redshift one.
Here we start with several samples of local galaxies that have a wealth of FIR data from the Herschel observatory and other sources. We explore correlations between their FIR properties and other physical parameters which are measurable in our sample and distinguish them the most from galaxies at lower redshifts. We then study three Ly emitters that are analogs to the sample in rest-frame UV properties and explore their FIR properties in comparison to the Herschel sample. To ensure consistency we re-analyze the low-redshift samples using the same techniques we apply at higher redshift.
2.1 The sample of Herschel observed local galaxies
In the following, we consider local galaxies from the KINGFISH sample (Kennicutt et al., 2011), the GOALS sample (Sanders et al., 2003; Armus et al., 2009), and the Dwarf Galaxy Survey (DGS, Madden et al., 2013). Combining these samples allows us to cover a wide range in galaxy properties. Here, we briefly summarize the main properties of these samples. We note that we have removed all galaxies with a known Active Galactic Nucleus (AGN) from these three samples, however, we cannot rule out the presence of heavily obscured AGNs (see discussion in Section 2.4).
-
•
The KINGFISH sample consists of nearby galaxies within with but also contains a handful of less massive dwarf galaxies at (Skibba et al., 2011). Their sSFRs are predominantly and the metallicities in the range of (Kennicutt et al., 2011). All KINGFISH galaxies are observed with Spitzer/IRAC (, , , and ) and Spitzer/MIPS ( and ) as well as Herschel/PACS (, , and ) and Herschel/SPIRE (, , and ) (Temi et al., 2009; Dale et al., 2012; Bendo et al., 2012).
-
•
The GOALS sample consists of of the most luminous infrared-selected galaxies including merging systems in the nearby Universe (LIRGs) out to (Kennicutt et al., 2011). In particular, about of these are ultra-luminous Infrared Galaxies (ULIRGs). The GOALS galaxies have stellar masses mostly between and are therefore the most massive galaxies of these three samples (U et al., 2012). Furthermore, the galaxies span a wide range in sSFR from up to for the lowest masses (). There are only a handful of metallicity measurements for these galaxies and they are in general around (Rupke et al., 2008; Rich et al., 2012). Most of the GOALS galaxies are observed by Spitzer/IRAC and Spitzer/MIPS as well as Herschel/PACS and Herschel/SPIRE (Sanders et al., 2003; U et al., 2012; Díaz-Santos et al., 2014; Chu et al., 2017).
-
•
The DGS sample consists of low-mass () dwarf galaxies in the nearby Universe out to (Madden et al., 2013). The galaxies populate mostly low metallicities (, Rémy-Ruyer et al., 2013) and are therefore similar to high-z galaxies and our low-redshift analogs, with the exception that the DGS galaxies have a lower sSFR () similar to the KINGFISH sample (Madden et al., 2013; Cormier et al., 2015). All of the DGS galaxies are observed with Spitzer/IRAC and Spitzer/MIPS as well as Herschel/PACS and Herschel/SPIRE (Bendo et al., 2012; Rémy-Ruyer et al., 2013).
2.1.1 Parameterization of the IR SED and fitting of temperature
We measure the FIR properties of the local galaxies using the parameterization introduced by Casey (2012) and their public IR photometry from to . We will use this parameterization throughout this work to ensure consistent measurements for all the galaxy samples discussed in the following.
The Casey (2012) parameterization combines a single graybody (accounting for the reprocessed, cold to warm emission) with a mid-IR power-law (approximating the warm to hot dust components from AGN heating, hot star-forming regions, and optically thin dust). As shown in their study, this method results in a better fit to the rest-frame mid-IR part of the spectrum by marginalizing over multiple warm to hot dust components of a galaxy (see their figure 1 for an illustration) compared to a single graybody. Mathematically, the parametrization depends on the luminosity weighted temperature (), the slope of the mid-IR power-law component (), the emissivity (), and a normalization.
Note that represents the average temperature marginalized over all warm temperature components combined in the IR SED and is therefore a luminosity weighted temperature (in the following referred to as just “temperature” for convenience). This temperature should not be confused with the peak temperature 444E.g., computed using Wien’s displacement law with . that is quoted in some other studies and is only equivalent to only in the case of a single blackbody shaped IR SED (in general it is always , see detailed discussion in Casey, 2012). In this work we study the luminosity weighted temperature , however, for convenience, we quote equivalent temperatures whenever possible using the relation shown in Casey (2012). Importantly, defines the shape of the IR SED by taking into account the mid-IR emission. It is not only affected by the temperature of the optically thick dust, but also by the opacity of the dust in the ISM of a galaxy as well as dust grain properties, which can significantly change the mid-IR slope as shown by Scoville & Kwan (1976) and further discussed in Section 2.4. Therefore changes in temperature are not only limited to changes in the dust temperature, but also include changes in the opacity of the dust or its geometry. Hence, we refer with to all these effects describing the shape of the IR SED rather than solely the dust temperature.
For the fitting of the IR SED using the above parameters, we fix the wavelength at which the optical depth is unity to (Draine, 2006; Conley et al., 2011; Casey, 2012; Riechers et al., 2013). This is somewhat arbitrary as is a priori unknown and is likely to change for different samples of galaxies, although Riechers et al. (2013) find a consistent value close to for SMGs. Using would result in cooler temperatures, but does not change our results for the total FIR luminosity, so the choice is irrelevant as long as it is treated consistently. For all fits, we assume a freely varying . However, because and can be degenerate, we also fit the photometry with a fixed of and but we do not find any significant differences in the following results and conclusions.
2.2 Low redshift analogs of high-z galaxies
In addition to the Herschel samples we consider three galaxies at low redshift () that were selected as UV analogs to systems with archival FIR and ALMA observations. Such galaxies are extremes amongst low-redshift galaxies but show very similar properties as high-redshift galaxies in terms of sSFRs, optical emission lines, metallicity, and morphology. Low-redshift analogs, such as “Green Peas” (Cardamone et al., 2009) or ultra strong emission line galaxies (Hu et al., 2009), are therefore used by many studies to understand in detail the population of high-redshift galaxies, for which much less observational data exist (Stanway et al., 2014; Bian et al., 2016; Faisst et al., 2016a; Faisst, 2016; Greis et al., 2016; Masters et al., 2016; Erb et al., 2016). A very common property of these galaxies are their high H equivalent-width (equivalent to sSFR). In fact, as demonstrated by Faisst (2016), the H equivalent-width allows a very clean selection of low-redshift analogs with very similar properties of high-redshift galaxies.
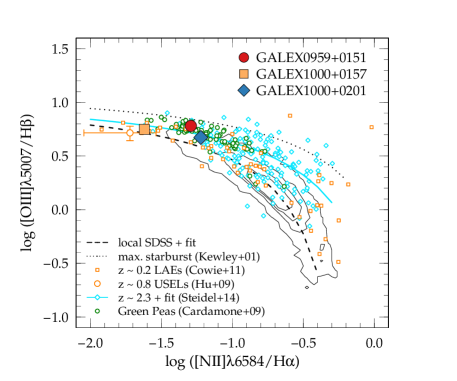
The three analogs of high-redshift galaxies (hereafter named as GALEX0959+0151, GALEX1000+0157, and GALEX1000+0201) were originally selected from the Galaxy Evolution Explorer (GALEX, Martin et al., 2005) Ly emitter sample described in Cowie et al. (2011) (see also Cowie et al., 2010).
This Ly emitter sample contains galaxies that are spectroscopically preselected to have rest-frame in the GALEX far-UV or near-UV grism. Galaxies with a clear AGN signature were removed based on a cut in Ly FWHM and another cut in the high-ionization optical emission lines (see also Figure 1). All three galaxies are in the main Cosmic Evolution Survey (COSMOS, Scoville et al., 2007)555http://cosmos.astro.caltech.edu area and thus are imaged by ground and space based facilities in more than photometric bands ranging from UV to radio (Laigle et al., 2016). These are the only galaxies in COSMOS that are analogs of systems with a wealth of ancillary data in the UV, optical, and FIR. Rest-frame optical spectroscopy is available from the zCOSMOS-bright spectroscopic survey (Lilly et al., 2007)666http://archive.eso.org/cms/eso-data/data-packages/zcosmos-data-release-dr1.html and two of the analogs (GALEX0959+0151 and GALEX1000+0157) are observed in the UV with the Cosmic Origin Spectrograph (COS, Green et al., 2012) on HST (Scarlata et al., in prep).
The three galaxies appear to be good analogs of high redshift systems. Specifically, they show optical emission line properties and Ly properties similar to galaxies at . The H equivalent-widths () are comparable to those measured in systems using Spitzer colors (Shim et al., 2011; Faisst et al., 2016a; Rasappu et al., 2016) and their specific SFRs based on combined UV and FIR luminosities are between and . This is times higher than average galaxies on the star-forming main-sequence at at stellar masses (e.g., Speagle et al., 2014; Schreiber et al., 2015; Lee et al., 2015), but similar to those of galaxies (e.g., Steinhardt et al., 2014; Capak et al., 2015; Faisst et al., 2016a). Furthermore, the [O III]/H ratios are high ( to ) and [N II]/H ratios are low ( to ) compared to galaxies at similar stellar masses, but again comparable to systems (see Figure 1 and Kewley et al., 2013; Faisst et al., 2016a; Faisst, 2016; Masters et al., 2016). Finally, these line ratios suggest gas-phase metallicities of in any calibration, which is below the average metallicity of galaxies at similar stellar mass but comparable to galaxies at (see Ando et al., 2007; Maiolino et al., 2008; Kewley & Ellison, 2008; Faisst et al., 2016b).
The detailed spectroscopic properties of the three analogs are listed in Table 1.
2.2.1 HST morphology
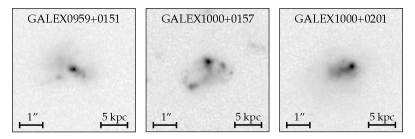
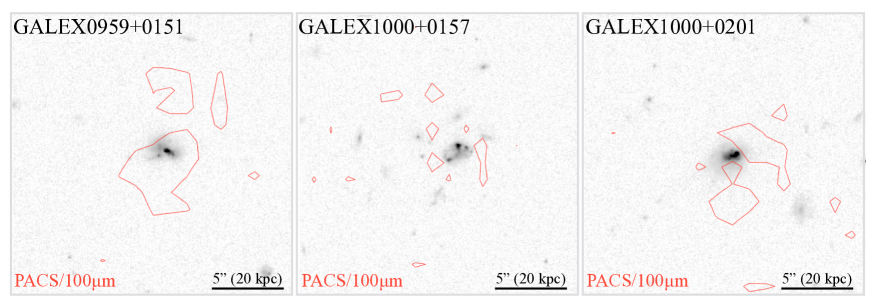
Figure 2 shows the optical images by HST’s Advanced Camera for Survey (ACS) in F814W (-band) at resolution. The bulk of the optical light is emitted from a compact nucleus of less than in diameter but diffuse components extend out to in all of the galaxies. Several clumps of UV light in the diffuse component with same or smaller size than the nucleus suggest regions of vigorous star formation.
2.2.2 UV to mid-IR data
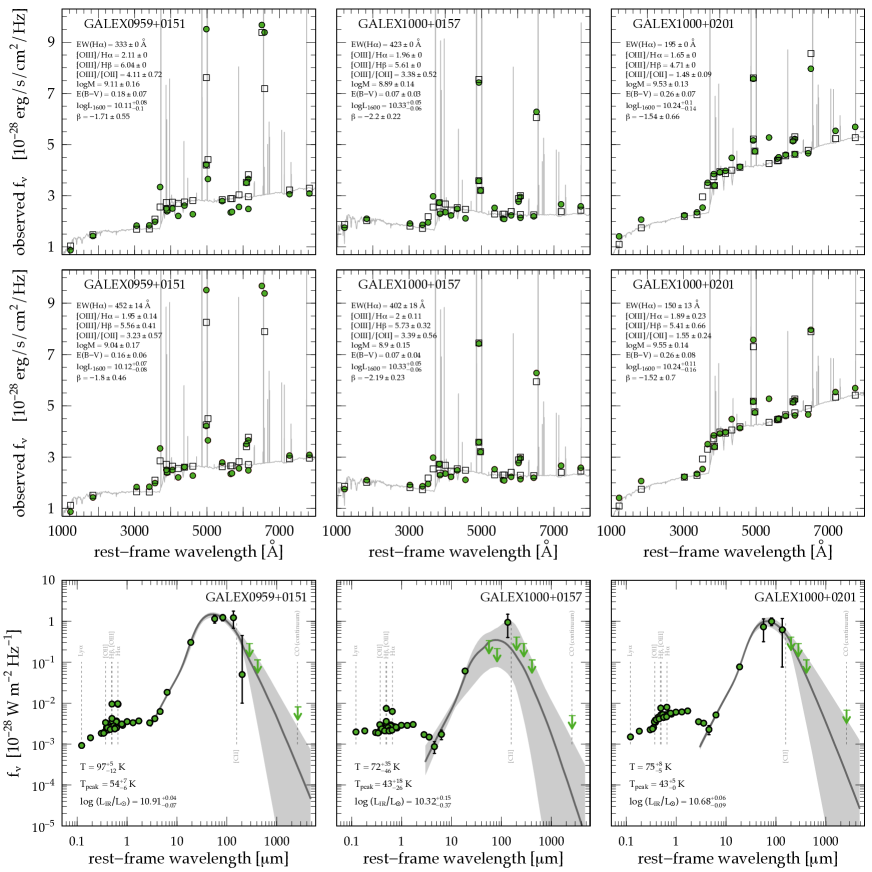
The UV to mid-IR photometry of the galaxies is extracted from the COSMOS2015 catalog (Laigle et al., 2016)777ftp://ftp.iap.fr/pub/from_users/hjmcc/COSMOS2015/. Next to deep imaging in the UV and optical, the catalog includes deep Spitzer/IRAC mid-IR data at and from the Spitzer Large Area Survey with Hyper-Suprime-Cam (SPLASH, Steinhardt et al., 2014)888http://splash.caltech.edu as well as Spitzer/MIPS (all three galaxies are detected). The photometry has been extracted using the positional priors from the optical bands and reliable de-blending algorithms (Laigle et al., 2016). The UV to optical SEDs are shown in the top and middle panels of Figure 3. Each of the galaxies has been observed with Spitzer/MIPS at as well as Herschel/PACS ( and ) and Herschel/SPIRE (, , and ). Due to the large point spread functions (PSF) and confusion, we choose to measure the IR photometry on a galaxy-by-galaxy basis. In brief, we perform aperture photometry with an appropriate correction to total magnitudes. The uncertainties are based on random parts of background. For galaxies with close neighbors, we apply either Spitzer/IRAC or Spitzer/MIPS positions as priors and use GALFIT (version 3.0.5, Peng et al., 2011) to carefully subtract the flux of the neighboring galaxies before performing aperture photometry on the main object.
The detailed IR photometry of the three analogs is listed in Table 2.
2.2.3 Physical properties from optical SED fitting
We fit the optical SED of our low-redshift analogs to obtain their stellar masses and rest-frame monochromatic luminosities (). We use templates based on Bruzual & Charlot (2003) and include constant, exponentially declining and increasing star formation histories (SFH) with variable metallicities from 1/20 of solar to solar. The stellar population ages range from to a few Gyrs and dust is parametrized by extinction laws based on local starbursts (Calzetti et al., 2000) and the SMC (Prevot et al., 1984; Pettini et al., 1998). However, we found the different extinction laws do not significantly change the measured physical parameters. The redshift is fixed to the spectroscopic redshift during the fitting. We add strong optical emission lines coupled to H with variable ratios [O III]/H, H/H 999We compute H via case B recombination and the fitted E(B-V) value assuming a stellar-to-gas dust ratio of unity as suggested by recent studies (Reddy et al., 2015; Shivaei et al., 2015; De Barros et al., 2016)., and [O III]/[O II]. Weak emission lines (such as N, S, or He) are added with a constant ratio with respect to H for a sub-solar metallicity (Anders & Fritze-v. Alvensleben, 2003). The GALEX far-UV photometry is corrected for Ly line emission derived from the spectra prior to fitting as we do not include the Ly line in our SED models. The fit is performed using a Levenberg-Marquardt algorithm, as part of the R/minpack.lm package101010https://cran.r-project.org/web/packages/minpack.lm/index.html and errors are obtained from a Monte Carlo sampling taking into account the error in the photometry and models. The UV luminosity () is measured at rest-frame and the UV continuum slope is fitted in the window between and . We perform two fits for accessing the uncertainties in the fitted parameters. First, we fix , [O III]/H and [O III]/H to the spectroscopic value and in a second run we leave these as free parameters. The fits are shown in Figure 3 on the top and middle panels, respectively, and we find an agreement on the order of or better between the photometrically and spectroscopically measured H EW and line ratios. We find stellar masses of , moderate to low dust attenuation (), and UV luminosities on the order of . The photometrically derived [O III]/[O II] ratios (ranging from to ) are factors higher compared to galaxies on the main-sequence but fit well the expected [O III]/[O II] ratios for galaxies (e.g., Faisst, 2016), which is an additional verification of their validity as analogs of high-redshift galaxies. We compare the UV slope measured from SED fitting with the direct measurement from the observed GALEX and CFHT/u∗ fluxes and find a good agreement within the uncertainties. Since we want to study the location of these galaxies on the IRX diagram, we want the measurement of to be independent from any assumed dust attenuation law. This is not the case for measurements from SED fitting. We therefore prefer to use the measurement obtained from the observed fluxes.
The physical properties obtained from the optical SED fits are listed in Table 3.
2.2.4 ALMA measurements
The three analogs of high-redshift galaxies have been observed with ALMA in Band 3 (ID: 2012.1.00919.S, PI: Y. Kakazu) centered at an observed frequency of , which corresponds to the rest-frame wavelength of CO emission (). The integration times vary between and and the number of antennae between 24 and 36 (see Table 2). The line observations are performed in “frequency division mode” at a bandwidth of in one spectral window and the continuum observations use the “time division mode” with a bandwidth of in each of the three line-free spectral windows. The synthesized beam sizes are on average . The data are reduced using the standard CASA ALMA calibration pipeline. All three galaxies are undetected in the continuum around rest-frame at at but we note a tentative CO detection at the redshift of GALEX0959+0151 at a level with a peak emission spatially offset by or .
2.2.5 IR SEDs and temperature of the low-z analogs
We estimate the FIR properties of the analogs in the same way as for the Herschel sample (see Section 2.1.1). The bottom panels of Figure 3 show the best-fit IR SEDs to the three analogs (best fit parameters are listed in Table 4). We find temperatures ranging from to with uncertainties of (corresponding to to with uncertainties of in ). The temperature for GALEX1000+0157 is only poorly constrained because only upper limits for the FIR photometry are available.
2.3 Correlations of FIR properties with metallicity and sSFR in low-redshift galaxies
Metallicity and sSFR are the two most prominent ways high-redshift galaxies differ from lower redshift ones. We therefore begin by investigating the dependency of the shape of the IR SED (parameterized by ) on these physical quantities.
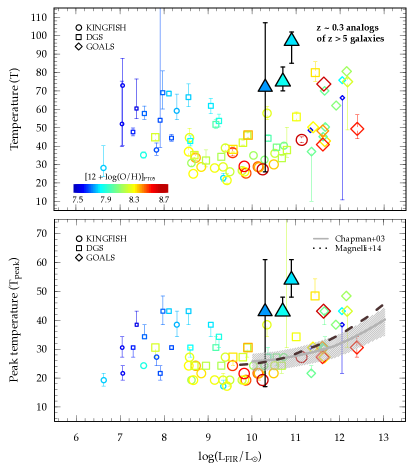
Figure 4 shows the vs. and vs. relation for our local samples with open symbols color-coded by the metallicities of the galaxies. The different symbols indicate the KINGFISH (circles), DGS (squares), and GOALS (diamonds) samples. The metallicities are quoted in the Pilyugin & Thuan (2005) calibration for a consistent comparison of the different samples. At intermediate to high total FIR luminosities () we recover the positive correlation between and (and ) similar to what was found in studies of luminous FIR galaxies (e.g., Dunne et al., 2000; Chapman et al., 2003; Magnelli et al., 2014). However, contrarily to expected low temperatures at very low FIR luminosities, the FIR faint and metal-poor dwarf galaxies from the DGS sample suggest increasing temperatures at . This has not be seen in previous studies as these do not go this low in total FIR luminosity. It indicates that galaxies at low and low metallicity as well as galaxies at high and high metallicity are characterized by a warm IR SED based on our local samples.
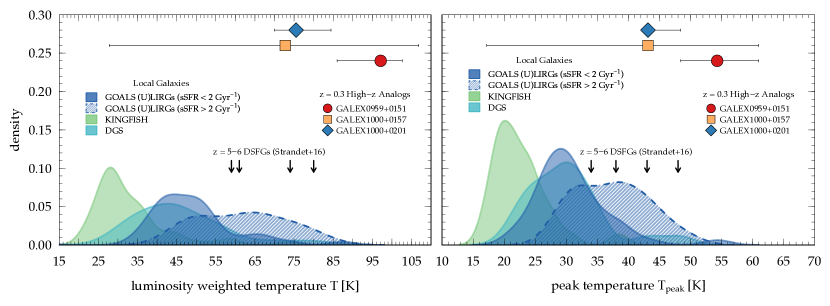
Figure 5 shows the (peak) temperature probability densities for our local samples. The KINGFISH sample, containing the most mature and metal-rich galaxies, shows the lowest distribution in and of all the samples (see also figure 8 in Rémy-Ruyer et al., 2013). The dwarf galaxies in DGS, having significantly lower metallicities, show a distribution similar to the (U)LIRGs in the GOALS sample with . Notably, galaxies with the highest sSFR ( in the GOALS sample) show an overall warmer IR SED, i.e., higher . Taken at face value, this suggests that, in addition to a trend in metallicity, galaxies with higher sSFR have warmer IR SEDs. This is not entirely unexpected since sSFR is correlated with the total FIR luminosity via the SFR, which can introduce a positive correlation with as shown above. However, strictly speaking, sSFR is more similar to a FIR luminosity density and is therefore the preferred tool over the absolute to compare galaxies at different redshifts.
The three low-metallicity analogs at show ( in ) higher temperatures compared to the average of galaxies at similar metallicity, such as the dwarf galaxies (Figure 4). Hence, they seem to be outliers in the nearby galaxy samples. However, note that the analogs have relatively high sSFR (between and ) compared to these local samples which is expected to boost their temperature further. Indeed, they show similar temperatures as the GOALS (U)LIRGs at similar sSFRs (Figure 5). We also note that the total FIR luminosities of the analogs do not match up with the local samples. Specifically, for their given metallicity, the analogs show orders of magnitude higher compared to the DGS galaxies. The same trends have been seen in other samples of analog galaxies and are also indicated in our sample ( at metallicities of in the Pilyugin & Thuan (2005) calibration similar to the analogs – by definition). This simply means that galaxies with the same but at different redshifts are not comparable, which is reasonable given their vastly different structure and stellar mass. Instead, the sSFR (a proxy for the FIR luminosity density) or equivalently H surface density are better parameters to compare low and high redshift galaxies as well as to provide better analog galaxies (Faisst, 2016; Masters et al., 2016).
Summarizing, the local samples provide evidence that galaxies at low metallicity and high sSFRs are characterized by a warmer IR SED. The UV analog galaxies (extreme cases of low-redshift galaxies but with similar properties as high-redshift galaxies) strengthen these conclusions and suggest that high-redshift galaxies (characterized by low metallicity and high sSFRs) have a warmer IR SED compared to average galaxies at lower redshifts.
2.4 Possible reasons for a “warm” IR SED
In the previous section, we have outlined evidence that galaxies with low metallicity and high sSFR show a “warmer” IR SED (i.e., higher and ) compared to the average population. Ultimately, this may suggests that the average population of high-redshift galaxies (characterized by low metallicity and high sSFRs) have increased temperatures compared to typical galaxies at lower redshifts, which will be important to characterize their FIR properties as it is shown later. In the following, we list possible reasons that can cause a warm IR SED.
First of all, the presence of an AGN is one possible cause of a mid-IR excess, but known AGN have been removed from the samples discussed above and the location of our three analogs on the BPT diagram suggest no AGN component. A detailed analysis of X-ray emission from a dusty star forming galaxy at (SPT0346-52; , ) using Chandra also suggests that its FIR emission originates from vigorous star formation activity instead of an AGN (Ma et al., 2016). This is strengthened by a recent analysis of a sample of four “Green Peas” (low-redshift analogs of galaxies) that arrives with the same conclusion (Lofthouse et al., 2017). However, the presence of an obscured AGN cannot be ruled out and in fact it can be easily missed by traditional selections as shown in the case of GN20 at (Riechers et al., 2014), or other examples at lower redshifts (Pope et al., 2008; Coppin et al., 2010). This obscured AGN can even dominate the mid-IR continuum but it is shown by these studies that it has a minor impact on the FIR part of the SED and therefore only a modest effect on the temperature.
We have found evidence that galaxies with low metallicity as well as high sSFR have increased . This suggests that there might be at least two mechanisms that cause such a warm IR SED. These might be working at the same time, especially in low-metallicity and high sSFR analogs and likely also high-redshift galaxies. On one hand, a high sSFR is indicative of a high density of intense UV radiation fields originating from young star-forming regions that are heating up the surrounding ISM. In the local Universe, this might be the case for compact FIR luminous galaxies such as the ULIRGS in GOALS (Figure 5). At high redshifts, however, this could generally be the case as these galaxies are very compact and reveal a higher population averaged sSFR. This picture is generally supported by the detection of extended [C II] emission from the warm ISM around local LIRGs (Díaz-Santos et al., 2014) and in samples of high-redshift galaxies (Section 4.3). On the other hand, a likely explanation for the warm IR SEDs could be a lower optical depth in the ISM due to lower dust column densities at lower metallicities. As shown by Scoville & Kwan (1976), the mid-IR shape of the SED is not only affected by the temperature but also by the mean optical depth of the ISM and the dust mass (see also Scoville, 2013). In detail, for optically thin dust, the exponential mid-IR black-body tail is modified to a power-law and the peak wavelength is shifted blue-wards, both causing an increase in as well as . The same trend but weaker is expected for a decreasing dust mass. At the same time, harder UV radiation might be prevalent in low-metallicity environments with massive stars caused by less efficient ISM cooling. Interestingly, Prestwich et al. (2013) suggest also a higher number of X-ray sources at lower metallicity that could be responsible for heating the ISM. In the local Universe, these effects are expected in metal-poor and FIR faint dwarf galaxies (Figure 4). At high redshifts, this could be commonly the case as these galaxies have metallicities significantly below solar.
3 The IRX diagnostic tool
The general idea behind the IRX correlation is that dust in the ISM and circum-galactic medium around galaxies absorbs the blue light from young O and B stars and re-emits it in the FIR. Therefore, the ratio of FIR to UV luminosity () is sensitive to the total dust mass and the geometry of dust grains. On the other hand, the UV color (measured by the UV continuum spectral slope ) is sensitive to the line-of sight opacity (e.g., Bouwens et al., 2012)111111Note that also depends on the age of the stellar population, the star-formation history, and metallicity. However, for young stellar populations as it is the case in young star-forming galaxies especially at high redshifts, the intrinsic UV slope is expected to be invariant (Scoville et al., 2015) and hence we can assume to be a good proxy for line-of-sight opacity.. The IRX diagram combines these two measures and can therefore be used for studying the dust and gas properties and distribution in galaxies with a minimal amount of input.
3.1 Analytical models to explain IRX in typical local to intermediate redshift galaxies
Charlot & Fall (2000) (see also Kong et al., 2004) describe a simple analytical model for the absorption of starlight in the ISM of galaxies, which can explain the location of typical galaxies on the IRX diagram up to where detailed data exist. The model assumes dust in thermal equilibrium that is distributed in the ambient ISM in one of the following three geometrical configurations: (i) a uniform foreground screen characterized by a single optical depth , (ii) a “mixed slab” characterized by a uniform mixture of dust and stars and optical depth , and (iii) a Poisson distribution of discrete clouds characterized by an optical depth per cloud () and the average number of clouds mixed with stars along the line-of-sight to the observer (). Moreover, the models assume that the young stars are enshrouded in birth-clouds that dissolve after a finite lifetime of (see also Vallini et al., 2017). The total transmission for UV light is therefore time-varying, namely the product of the transmission function through the birth clouds and the ambient ISM for and the transmission function alone through the ISM otherwise.
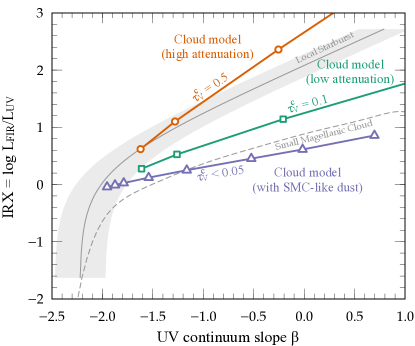
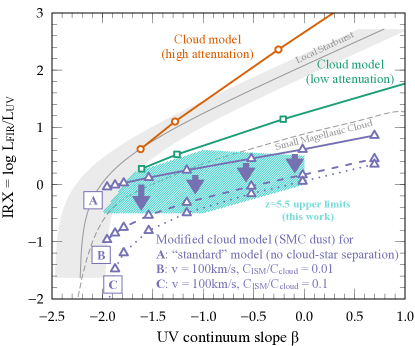
These different models successfully explain the typical galaxy population on the IRX diagram. Specifically, Charlot & Fall (2000) find that the model featuring discrete clouds in the ISM represents best the IRX and UV color distribution of typical local starburst galaxies by assuming a simple power-law relation for the wavelength dependence of the optical depth of the ambient ISM. Such simple forms for with a logarithmic slope of are expected from various detailed measurements of the dust extinction curves in the Milky Way galaxy (Seaton, 1979), the Large Magellanic Cloud (Fitzpatrick, 1986), local starburst galaxies (Calzetti et al., 2000), and even normal star-forming galaxies at (Scoville et al., 2015). For the birth-clouds, a similar optical depth is assumed with , but we note that the exact relation does not impact the following conclusions. We show such a model in Figure 6 for a stellar population of and running from to with (orange circles) and (green squares)121212We assume a simple stellar population published with GALAXEV (Bruzual & Charlot, 2003) for half-solar metallicity, a constant star-formation history, and a Chabrier (2003) IMF..
This simple model does successfully explain galaxies with similar dust properties as the local starbursts but it fails to reproduce galaxies with lower IRX values at a fixed UV color even for the lowest cloud optical depths (i.e., ). This part of the parameter space can be covered within this model by steepening the dust extinction curve, i.e., change the form of the wavelength dependent optical depth . The blue triangles in Figure 6 show the cloud model with the more complex of the metal-poor SMC parameterized by a 3-fold broken power-law (e.g., Prevot et al., 1984) and assuming and up to . With this modification, the model can reproduce galaxies with lower IRX values at a given UV color for SMC-like dust. At the same time, this shows how we can study the dust properties of galaxies with this very simple model of dust absorption and a minimal amount of data; the location of galaxies on the IRX diagram tells us about their total amount of dust, the optical depth of their clouds in the ISM, and the wavelength dependence of their dust attenuation curve. These properties ultimately depend on other physical properties of the galaxies, for example their metallicity as shown in the case of SMC-like dust.
3.2 Correlation between location on the IRX diagram and physical properties
The IRX diagram has also been studied thoroughly from an observational point of view and it is found that the galaxy properties change significantly as a function of position on this diagram (e.g., Howell et al., 2010; Reddy et al., 2010; Boquien et al., 2012; Casey et al., 2014; Álvarez-Márquez et al., 2016).
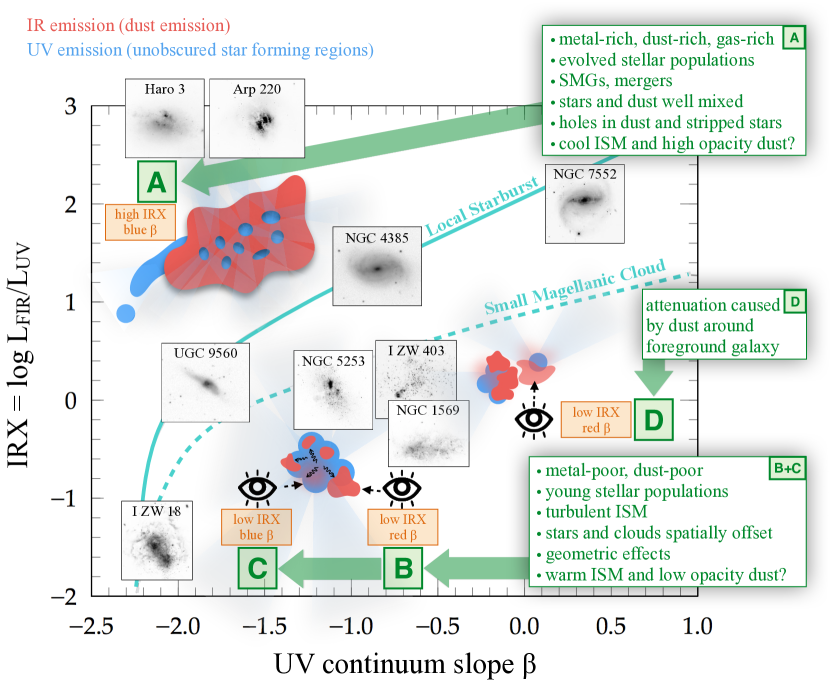
For example, more mature, metal-rich, and dust-rich galaxies are expected to show high values of IRX, thus are found in the upper part of the IRX diagram. Such galaxies are pictured as compact, dust-enshrouded, IR luminous star-forming systems that have likely experienced a recent starburst after a merger event (e.g., Larson et al., 2016). The blue colors of some of these galaxies can be explained by a patchy dust screen (Casey et al., 2014) or tidally stripped unobscured young stars or a small spatially unresolved and unobscured star-forming satellite as suggested by some IR luminous () local galaxies (e.g., Howell et al., 2010). An alternative scenario that does not involve starbursts or mergers is predicted by hydrodynamical simulations. These suggest that isolated normal main-sequence galaxies with can populate the upper left part of the IRX diagram naturally due to their high gas fractions and high metal enrichment (e.g., Hopkins et al., 2010; Safarzadeh et al., 2016). The observed increase in gas fraction towards higher redshifts (Tacconi et al., 2010; Genzel et al., 2015) would make such a configuration likely for the most metal rich galaxies in the early Universe.
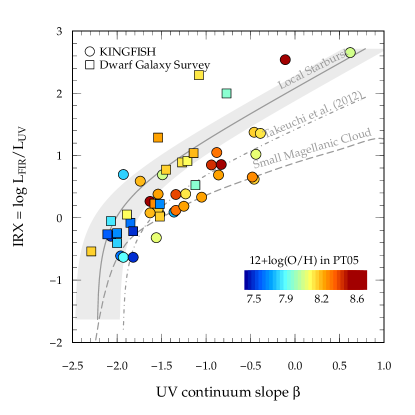
On the other hand, younger, metal-poor, and dust-poor galaxies are expected to show low values of IRX and blue UV colors and thus populate the lower parts on the IRX diagram (see Figure 7). They could be characterized by a steeper dust attenuation curve as it is seen in the metal-poor SMC, which causes a flatter IRX relation for these galaxies (see Section 3.1 and discussion in Reddy et al., 2010). Galaxies in the early Universe are expected to be young, dust-poor, and less metal enriched on average (Maiolino et al., 2008; Mannucci et al., 2010; Feldmann, 2015; Faisst et al., 2016b; Bian et al., 2016; Popping et al., 2016), thus are expected to reside on the lower parts of the IRX diagram as predicted by the Charlot & Fall (2000) model with a SMC-like dust attenuation curve. This has been directly observed in some FIR detected galaxies (e.g., Baker et al., 2001; Siana et al., 2009; Reddy et al., 2010) and there are also hints of this in our small sample of analogs; the analogs GALEX0959+0151 and GALEX1000+0201 (both sitting on the IRX relation of local starbursts) have higher metallicities than GALEX1000+0157, which is located on the relation of the SMC. From the correlation with metallicity, we would also expect a correlation between position on the IRX diagram and IR SED shape (Section 2.3). As detailed in Section 2.4, a warm IR SED can be due to heating of the ISM by a high amount of star-formation or due to a low dust optical depth in the ISM as shown by Scoville & Kwan (1976). The latter is supported by the simple dust model discussed in Section 3.1, which predicts a very low optical depth () for the clouds in galaxies close to the SMC relation.
Extrapolating our knowledge gained from our low-redshift samples, we expect galaxies in the early Universe to show warm SEDs as well as high rates of star formation, which will make them appear close to the SMC relation.
4 The IRX diagram at
The advent of ALMA has allowed us to begin populating the IRX diagram at (e.g., Ota et al., 2014; Capak et al., 2015; Maiolino et al., 2015; Aravena et al., 2016; Bouwens et al., 2016). C15 presents today’s largest and most representative sample of normal main-sequence galaxies with detected [C II] emission and continuum detections or limits at along with robust UV measurements (Barišić et al., 2017). From the reasoning in Sections 3.1 and 3.2 we expect that most of the high-redshift galaxies reside in the lower part of the IRX diagram, close to the relation of the SMC. However, we also expect a large variation in the metallicity and star-forming properties of high-z galaxies (e.g., Steinhardt et al., 2014; Faisst et al., 2016b; Barišić et al., 2017). We therefore also expect a significant scatter in IRX.
The C15 sample consists of 9 star-forming Lyman Break galaxies at (the characteristic knee of the galaxy luminosity function) and one low luminosity quasar (HZ5) at redshifts . All galaxies are located in the 2 square-degree COSMOS field and therefore benefit from a multitude of ground and space-based photometric and spectroscopic data.
The galaxies are spectroscopically selected via their rest-frame UV absorption features from spectra obtained with the Deep Extragalactic Imaging Multi-Object Spectrograph (DEIMOS, Faber et al., 2003) and represent a large range in stellar masses, SFRs, and UV luminosities at . A detailed analysis of their DEIMOS optical spectra and Spitzer photometry properties suggests gas-phase metallicities around , which is representative of the average metallicity of star-forming galaxies at (Ando et al., 2007; Faisst et al., 2016b).
All galaxies have been observed with ALMA at rest-frame and are detected in [C II] emission at (Riechers et al., 2014; Capak et al., 2015). Four of them (HZ4, HZ6, HZ9, and HZ10) are detected in continuum. Furthermore, HZ6 and HZ10 have been detected in [N II] line emission and continuum at (Pavesi et al., 2016). Both the low luminosity quasar (HZ5) as well as HZ8 have a [C II] detected companion (HZ5a and HZ8W) at their corresponding redshifts without significant detection in ground-based near-IR imaging data. HZ6 is a system of three galaxies (HZ6a, HZ6b, HZ6c)131313These are called LBG-1a through LBG-1c in Riechers et al. (2014) and Pavesi et al. (2016). with detected [C II] emission and continuum between HZ6a and HZ6b. HZ10 has a low luminosity companion (HZ10W) that is, however, not spectroscopically confirmed in either optical or FIR lines.
All UV properties (morphology, luminosity, UV color) have been derived accurately from deep near-IR imaging that has been recently obtained by HST and is explained in detail in Barišić et al. (2017). Table 5 provides a summary of the UV and IR properties of the C15 sample.
4.1 FIR luminosity of high-z galaxies
The IR part of the SED is essential for studying the dust properties of galaxies. Although ALMA provides us with the necessary tools to observe the FIR part of the electro-magnetic spectrum in high-redshift galaxies, it is very poorly constrained in normal (i.e., typical main-sequence) high-redshift galaxies due to their faintness, which makes such observations time consuming (see Appendix A). While good wavelength coverage in the FIR exists for a handful of bright sub-mm galaxies or FIR luminous lensed systems at (Riechers et al., 2013, 2014; Strandet et al., 2016), only one continuum data point at rest-frame (close to the [C II] line) is commonly measured for typical main-sequence galaxies at these redshifts.
Particularly, the total FIR luminosity (), one of the most important parameters to constrain the location of galaxies on the IRX diagram, is uncertain by a factor because of the poorly constrained IR SED (e.g., Schaerer et al., 2015). The current lack of accurate studies of the IR SEDs at high redshifts makes it necessary to assume an SED shape for these galaxies. The temperature is a primary parameter for characterizing the IR SED shape in our parameterization (see Section 2.1.1).
The total FIR luminosity at is usually obtained by integrating over an IR SED assuming priors on temperature and other parameters from the universe, which is then normalized to the continuum measurement of the galaxies. These parameters are typically () and a range of and corresponding to the average temperature of local (U)LIRGs (see C15). However, as shown in Section 2.3 by correlations in our local galaxy samples and analogs, there is evidence that this assumption might be incorrect for the average population of star forming galaxies at which have lower metallicities and higher sSFRs141414Note that the constant background temperature emitted by the Cosmic Microwave Background (CMB) is increased by a factor of seven to at . However, we expect this effect to increase the temperatures by less than on average at these redshifts (da Cunha et al., 2013), which is small given the uncertainties of our measurements..
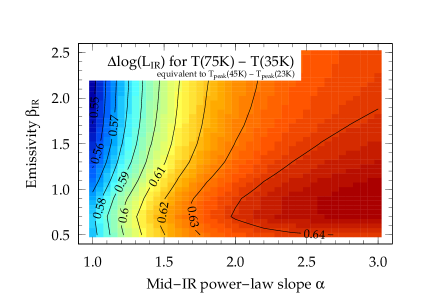
Figure 8 illustrates the change in total FIR luminosity () if the temperature or is underestimated by the typical difference between average (U)LIRGs and the low-metallicity and high sSFR analogs in our local samples. This difference can be up to ( instead of )151515This corresponds to a difference between and , i.e., ., which would lead to a significant underestimation of of as shown by the color gradient and black contours. The figure also shows that is the main parameter of uncertainty as only changes by over a large and conservatively estimated range of mid-IR slopes and emissivities .
The assumption of a warmer IR SED of high-redshift galaxies is supported by our study of local galaxies and low-redshift analogs, but also by several direct measurements in the literature.
-
•
Álvarez-Márquez et al. (2016) stack FIR SED of galaxies and find peak temperatures (), which are at the warm end of the distribution of temperatures of local galaxies.
-
•
Sklias et al. (2014) measure the temperatures of Herschel detected star-forming galaxies at and find peak temperatures of () in good agreement with our analogs. Also, Schreiber et al. (2017) (see also Schreiber et al., 2015) and Knudsen et al. (2017) (see also Watson et al., 2015) find temperatures of () for average and one galaxy at , respectively.
-
•
Strandet et al. (2016) (see also Greve et al., 2012) present several strongly lensed galaxies at that are detected and selected in the sub-mm by the South Pole Telescope (SPT) survey (Weiß et al., 2013) and observed between and by SPT, ALMA, APEX, Herschel, and Spitzer. We re-fit the FIR SEDs of these galaxies using the same method as our local samples and analogs and find temperatures of (), which is in good agreement with our local analogs (see Table 4 and black arrows in Figure 5).
-
•
The analysis of the starburst AzTEC-3 at Riechers et al. (2014) also results in a temperature of () and an SED similar to the low-redshift analogs.
-
•
Finally, Pavesi et al. (2016) extended the FIR wavelength coverage of HZ6 and HZ10 from the C15 sample by measuring fluxes in the two sidebands at and independently with ALMA. Assuming a uniform prior for temperature (, i.e., in ) and , they derive temperatures of () and () for HZ6 and HZ10, respectively. As the authors discuss, these temperature measurements are very uncertain as the current data does not cover wavelengths near the IR peak that are sensitive to warm dust. An additional measurement at bluer wavelengths (e.g., rest-frame , see Appendix A) would increase the confidence in the estimated temperature.
Following the above reasoning, we re-compute the total FIR luminosities of the 12 systems from C15 assuming a temperature prior of () for the IR SED. As in C15, we create IR SEDs using the Casey (2012) parameterization that we normalize to the observed continuum emission of the galaxies, which is the only data-point available in the IR. The result is marginalized over a grid of mid-IR slopes and emissivities (, ). The total FIR luminosity is derived by integration between and and the errors are derived from the uncertainty in the photometric measurement at and the marginalization over the assumed range in and . We list the updated values in Table 4, which, as expected, are increased by compared to the previous results assuming a temperature prior with () as in C15.
4.2 Constraints on metallicity and sSFR as derived from Spitzer colors
The strong emission lines in high redshift galaxies can alter their observed photometry that in turn allows us to study them. In particular, Spitzer observations allow us to constrain the fluxes of strong optical lines such as [O III] and H of galaxies at and thus can put strong constraints on their (specific) SFR, metal content, hence evolutionary stage of these galaxies (e.g., Shim et al., 2011; Faisst et al., 2016a; Rasappu et al., 2016).
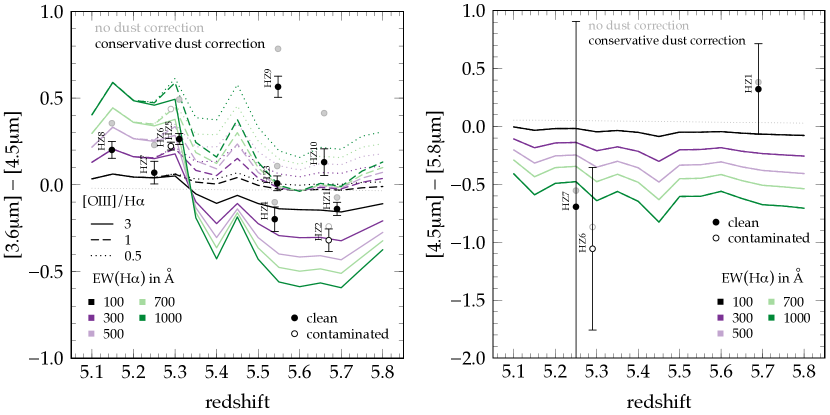
Figure 9 shows the expected and color in the redshift range for different H EWs and [O III]/H ( [O III]/) emission line ratios161616We assume templates from the Bruzual & Charlot (2003) library with half-solar (stellar) metallicity and a old constant SFH. As shown in Faisst et al. (2016a), the choice of these parameters, as long as reasonable, has little impact on the intrinsic model color ( for ).. The black symbols show the dust corrected171717For dust correction we apply the maximum of the calculated directly from using the relation between IRX and (Meurer et al., 1999) and from using the relation between and (Calzetti et al., 2000). colors of the galaxies in the C15 sample with their names indicated. Note that while all galaxies have reliable measurements at and , only three galaxies have measured fluxes due to the only shallow coverage at . Furthermore, the latter measurements have large uncertainties and are therefore are only meaningful for HZ1 and HZ6. For galaxies at , the color is a good estimator of the H equivalent-width (e.g., Faisst et al., 2016a; Rasappu et al., 2016), , while at higher redshifts it becomes degenerated with the [O III]/H ratio. Both Spitzer and colors suggest integrated over the three sub-components of HZ6, which could indicate a recent starburst event maybe induced by the tidal interaction between these three galaxies. In comparison, these colors suggest for HZ1, HZ7, and HZ8. In addition, we estimate [O III]/H (or [O III]/H ) for HZ9 and HZ10 and [O III]/H (or [O III]/H ) for HZ1, HZ2, and HZ4 from their colors. Assuming all these galaxies sit on the BPT ”main-sequence“ locus of high-redshift galaxies (e.g., Kewley et al., 2013; Steidel et al., 2014; Masters et al., 2016; Sanders et al., 2016; Strom et al., 2016), we can relate the [O III]/H line ratio to [N II]/H that is a proxy for the gas-phase metallicity. Hence, we would expect [N II]/H for HZ9 and HZ10, which translates into a gas-phase metallicity of according to Curti et al. (2016). The same reasoning leads to for HZ1, HZ2, and HZ4. Note that these metallicity estimates are in good agreement with the strong UV absorption features seen in these galaxies (Barišić et al., 2017).
Overall this suggests that low-metallicity, high sSFR low-redshift galaxies are indeed good analogs for high-redshift systems and that we should be adopting higher temperatures for the FIR SEDs. Interestingly, the exception is HZ10, which red Spitzer colors and rest-UV spectrum (Section 4.2) indicate a more mature system with higher metallicity and lower sSFR in line with the cooler temperature estimated by Pavesi et al. (2016) and being the strongest FIR continuum emitter in the C15 sample.
4.3 Comparison of UV, FIR, and [C II] morphology
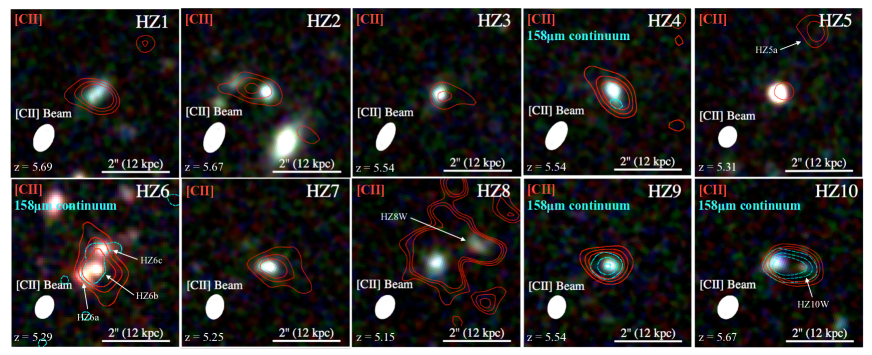
The galaxies in C15 are all resolved in the ALMA FIR line and continuum observations at a resolution of , which allows, together with their high-resolution near-IR HST images, a spatial study of rest-frame UV (a proxy for unobscured star formation) and FIR continuum (a proxy for the dust distribution and obscured star formation) in typical galaxies for the first time (Figure 10).
The FIR continuum detected galaxy HZ9 shows no offset between UV and FIR emission, indicative of a dust-obscured compact central star-formation region. In contrast, the FIR emission of HZ4 and HZ10 is offset by up to by up to from the location of the unobscured star formation, which could indicate a substantial re-distribution of dust clouds due to UV radiation pressure, tidal interactions by a recent or on-going merger event or the production and growth of dust caused by a recent starburst (c.f., Schneider et al., 2016). Such an offset of FIR continuum and unobscured star formation is also seen in the two local analogs (GALEX1000+0157, GALEX1000+0201) with the lowest metallicities and lowest dust content (i.e., IRX) as shown in the upper panels of Figure 10.
Emission from singly ionized carbon is commonly originating from the photo-dissociation regions (PDRs) on the surfaces of molecular clouds. The [C II] luminosity () is therefore used as a proxy for the star formation in galaxies, therefore it should coincide well the locations of star formation (e.g., Carilli & Walter, 2013; De Looze et al., 2014). The sample of C15, however, shows offsets between [C II] and UV emission of up to as well as a very extended [C II] emission over , a factor of larger than the typical UV size the galaxies (Figure 10). The extended [C II] emission could indicate that a non-negligible fraction of [C II] is originating from the warm neutral gas in the diffuse ISM that is heated by the strong UV radiation of young massive stars in high-redshift galaxies (e.g., Pineda et al., 2013; Díaz-Santos et al., 2014; Herrera-Camus et al., 2015; Vallini et al., 2015). Furthermore, recent hydrodynamical simulations suggest that offsets of up to between [C II] emission and regions of on-going star formation are expected in young primeval galaxies at high redshift due to their strong stellar radiation pressure (Vallini et al., 2013; Maiolino et al., 2015).
Overall, the FIR, [C II], and UV morphologies would support a picture of a turbulent, low dust-column density ISM with a greater optically thin fraction which would cause a higher observed temperature. This is consistent with our analysis of the low metallicities and high sSFRs local galaxies (Section 2.3) and could suggest a change in the relation between SFR and found in galaxies at lower redshifts (e.g., Aravena et al., 2016).
Alternatively, the offsets described above could be due to differential dust obscuration as it is commonly observed in SMGs and DSFGs (Riechers et al., 2014; Hodge et al., 2015, 2016). For example, [C II] is much less affected by dust obscuration and can therefore be detected at places where the UV light is completely absorbed, i.e., places of obscured star formation. On the other hand, the [C II] must then be destroyed or expelled at locations of unobscured star formation.
4.4 Updated IRX diagram of galaxies
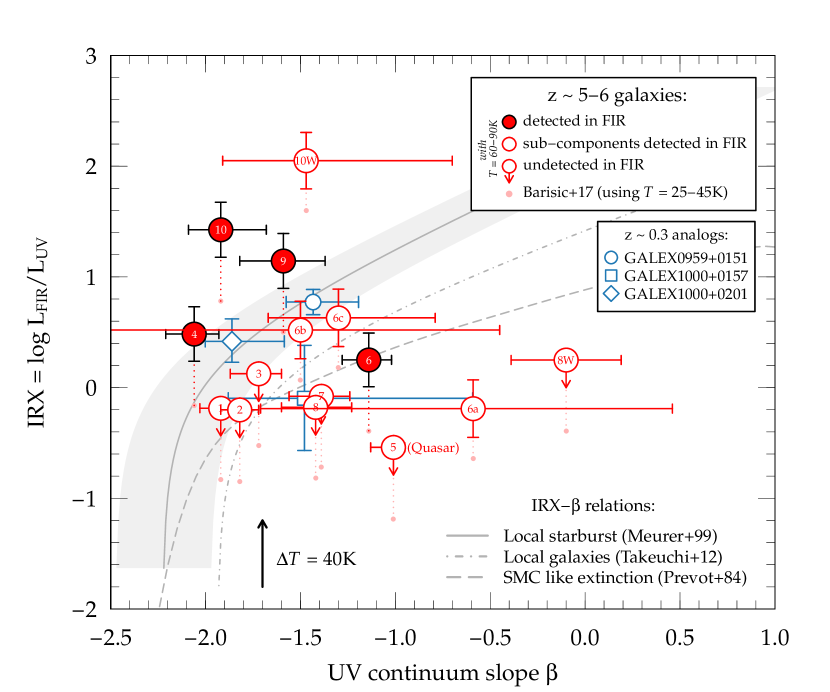
Figure 11 shows the IRX diagram at using the HST-based measurements (Barišić et al., 2017) and derived for a maximally warm IR SED prior (, ) for the galaxies in C15. The FIR continuum detected high-redshift galaxies are shown as solid red symbols, while the non-detections are shown as empty red symbols with arrows. FIR detected companion galaxies are shown as empty red symbols. Previous measurements (if available) that assume a cooler IR SED prior of () are shown as light red points.
If the warmer IR SED priors are correct, this would push the galaxies up by in IRX. This brings the galaxies at low IRX in better agreement with known dust properties measured in local starbursts (Meurer et al., 1999) (and its re-examination by Takeuchi et al., 2012) and models adopted for the metal-poor SMC (Pettini et al., 1998; Reddy et al., 2006). We note that the applied warm IR SED prior is motivated by the extrapolation of trends found in local galaxy samples as well as three low-redshift analogs which we think are reasonable representatives of a large fraction of high-redshift galaxies. However, the true temperature distribution of typical high-redshift galaxies is still unknown and we therefore argue that our temperature prior is a very reasonable upper limit and so are the updated IRX values. Taking the early measurements by Pavesi et al. (2016) as well as the trends in the local sample at face value, a temperature gradient across the IRX diagram is not unexpected. For example, lower temperatures for HZ9 and HZ10, which would reduce their IRX and bring them in better agreement with the local starburst and the Takeuchi et al. (2012) relation, are entirely possible. More direct measurements of the IR SED at high redshifts and larger samples of low redshift analogs are necessary to study such effects.
We find that galaxies at occupy a large fraction of the IRX diagram with significant scatter, which indicates a large variety in their physical properties already 1 billion years after the Big Bang. This scatter has to be understood in order to use the IRX relation to predict the dust properties of high-redshift galaxies from UV colors only as it is commonly done. The current sample of galaxies is too small to make such statistical predictions as well as point out the precise trends on the IRX diagram as a function of galaxy properties. In the following, we can therefore only derive a patchy understanding of how galaxies behave in relation to and IRX.
We find galaxies with blue UV colors () and large IRX values on or above the curve for local starbursts (HZ9, HZ10). As discussed in Section 4.2, these are likely amongst the most metal-rich and mature main-sequence galaxies at these redshifts. The blue UV color of these galaxies could be explained by a recent perturbation of the dust clouds by tidal interactions or a patchy optically thick dust screen (Section 3.2). The former could be the case for HZ10 showing a large offset between UV and FIR emission, while the latter might be the case for HZ9 for which UV and FIR emission coincide (Section 4.3). We note that HZ4, which is also elevated somewhat above the location of local galaxies but not as much as the others, is expected to be less metal enriched. Also, its morphology (Figure 10) shows that its FIR emission is offset in a tail pointing to north-east. The large fraction of unobscured UV emission along the line-of-sight causes its blue UV color () but its substantial dust mass causes a high IRX value.
Next to galaxies showing increased IRX values, we find galaxies with low in IRX values (even upper limits) and red UV colors (e.g., HZ6a, HZ7, HZ8, or HZ8W). This is even the case for a maximally warm IR SED prior that is assumed here and would be even more significant if no temperature evolution is assumed. Such galaxies are expected to have a significant line-of-sight dust attenuation but only little dust FIR emission, i.e., a low total dust mass. The recent HST observations provide very accurate measurements of these galaxies as shown by the simulations in Barišić et al. (2017). Therefore we conclude that these galaxies have a deficit in IRX and are not biased in . Also, the UV spectra and Spitzer colors strongly suggest that these galaxies are young and not dominated by old stellar populations that could cause a red UV color (e.g., Howell et al., 2010; Narayanan et al., 2017). These galaxies are curious because such a configuration of IRX and is difficult to explain with current models of dust attenuation in galaxies. As shown in Section 3.1, the simple analytical model of Charlot & Fall (2000) cannot cover that part of the parameter space even assuming low dust opacities and a steep SMC-like dust attenuation curve. From the Spitzer colors (Section 4.2) as well as UV spectra (Barišić et al., 2017), we would expect these galaxies to be primeval and metal-poor. The large offsets between [C II] emission and star forming regions and the extent of [C II] emission could be indicative of vigorous star formation, strong stellar radiation pressure, and substantial heating of the diffuse ISM. We suggest that the enhanced turbulence in these galaxies paired with merger events significantly alters their spatial dust distribution. In the next section, we propose an updated model for dust absorption in the ISM of these galaxies that can explain the location of these peculiar galaxies on the IRX diagram by taking into account geometrical effects of the dust and star distribution.
4.5 Dust model for FIR faint high-z galaxies: Separating clouds from stars
As discussed in Section 3.1, a simple analytical model for dust absorption in galaxies with well mixed dust and stars in thermal equilibrium (Charlot & Fall, 2000) is able to explain the majority of galaxies on the IRX diagram. However, it is not able to explain the FIR faint galaxies at very low IRX at a given UV color found at even for low dust opacities and a steep SMC-like dust attenuation curve. In order to explain the location of these galaxies, the dust clouds have to be in a configuration that allows them to attenuate the UV light enough to cause the red but at the same time the FIR emission has to be decreased by with respect to SMC-like galaxies.
We propose that this can be achieved by a spatial separation of the clouds and the star-forming regions that naturally occurs as the birth clouds are disrupted by the radiation pressure of the stars and turbulences in the ISM. Instead of letting the birth-clouds disappear after (the typical life time of O and B stars), we modify the Charlot & Fall (2000) prescription such that the birth-clouds are separated from the star-forming regions by with . The total FIR luminosity is decreased roughly by a factor of (where is the distance between star-forming region and cloud) due to the smaller angle along the line-of-sight covered by the cloud, while the UV color from the obscured regions is not significantly changed.
We assume that initially, the star clusters have the same velocity as the birth-cloud. After that, the cloud is subject to hydrodynamic forces and pressures, e.g., caused by the radiation of young stars or merging events, which causes the clouds to run into the nearby low-density warm ISM. The velocity change of the clouds can be estimated by a momentum conservation argument and depends on the column density ratio of the clouds and the surrounding ISM as well as the relative velocity of the external medium
| (1) |
The turbulent velocity dispersion of the ISM () provides a reasonable estimate for . From the [C II] emission line widths of the galaxies measured by C15 we find and we take this value to approximate in the following. Note that a significant part of the [C II] line width may be due to rotation as it is suggested for HZ9 and HZ10 (Jones et al., 2017). Therefore, this approximation might lead to an upper limit for . Our simple modified model is shown in Figure 12 by the dashed and dotted blue lines for of and , respectively, assuming an SMC-like wavelength dependence of the optical depth of the ambient ISM.
Our model can quantitatively explain the low IRX values of the galaxies and also can naturally lead to the large observed range in at a fixed IRX value. Depending on the geometry and the viewing angle of the observer, the dust clouds might be spatially offset from the line-of-sight and the UV light can escape the galaxy without being attenuated, which would cause blue UV colors but very similar IRX values.
Qualitatively, this model is also consistent with other observed characteristics of high-redshift galaxies such as the increased turbulent motion, increased radiation pressure, merger events, and strong gas inflows. In all cases, this leads to dust that is not well mixed with the stars, with isolated ISM clouds spatially offset from the regions of star formation. At the same time, low opacity dust screens due to tidal disruption or from the diffuse ISM can be created in front of the stars, producing the observed red UV colors. This setup could create lines-of-sight with attenuated UV light of the star-forming regions as well as ones that are clear, at a fixed IRX. In fact we see hints of such behavior in local galaxies. NGC 5253, NGC 1568, and Zwicky 403 are examples of local galaxies that have similar morphological properties, although the population is likely more extreme (c.f., Gil de Paz et al., 2007). All three galaxies show confined isolated clouds of gas and dust along with clear lines of sight to the star forming regions with a complex morphology.
4.6 Other possible geometric configurations
There are other geometric configurations that can cause the observed low IRX values and red UV spectral slopes. Radiation pressure and tidal forces can stir up the ISM in these young primeval galaxies and could result in a large fraction of dust and gas that is expelled into their circum-galactic regions. The low luminosity quasar HZ5 suggests evidence for an extended halo of dust and gas out to several kilo-parsecs around its [C II] confirmed (foreground) companion HZ5a. The spectrum of the quasar shows absorption features at the [C II] redshift of HZ5a as well as a narrow Ly emission line possibly caused by absorption in the foreground galaxy (Capak et al., 2011). Such circum-galactic dust can attenuate the UV light of a companion galaxy in the background and cause a red . At the same time, its IRX value is determined by the foreground galaxy’s dust. The galaxy HZ8W (a [C II] confirmed companion of HZ8) could be an example of such a geometrical configuration. It is characterized by a red spectral slope of and an upper limit in IRX of only . The UV light of this galaxy could be substantially attenuated by a foreground screen of dust and gas originating from the larger and more massive galaxy HZ8 in several kpc projected distance. This is also indicated by its very extended [C II] emission. The HZ6 system could show a similar configuration.
4.7 Correlation with stellar mass
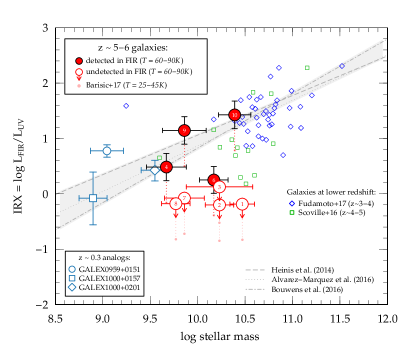
Several studies indicate a relation between IRX and stellar mass for galaxies at (e.g., Pannella et al., 2009; Heinis et al., 2014; Pannella et al., 2015; Álvarez-Márquez et al., 2016). The growing samples at show that this relation might break down at higher redshifts (e.g., Fudamoto et al., 2017). Specifically, it is found that these galaxies show a lower IRX at a fixed stellar mass than expected from the relations at lower redshifts. Part of the reason for this discrepancy is the unknown IR SED of the galaxies (Bouwens et al., 2016; Fudamoto et al., 2017). Figure 13 shows the IRX vs. stellar mass diagram for the galaxies assuming a warmer IR SED prior of () together with data and relations at lower redshift taken from the literature. Even with a warmer IR SED, the FIR undetected galaxies still fall below the expected IRX vs. stellar mass relation found at . Assuming the stellar masses are robust, this suggests that the stellar mass becomes uncorrelated with IRX (i.e., total dust) at similar to the relation between IRX and . This could be due to mergers, which would increase the stellar mass without necessarily changing the IRX, or a modified geometric distribution of dust as discussed here. Alternatively it could be that at these redshifts the production of dust is lagging behind the mass growth of the galaxies which happens on very short timescales.
As mentioned in Section 4.4, such defined relations between IRX and as well as stellar mass are important to predict the dust properties of large samples of high-redshift galaxies from quantities measured in the rest-frame UV and optical. Unfortunately, we currently lack large enough galaxy samples to define such relations accurately. Large ALMA programs targeting the FIR of high-redshift galaxies will be crucial in the future to progress.
5 Summary and Conclusion
Observations of the IRX relation across cosmic time is important for understanding the evolution of ISM and dust properties of galaxies in the early Universe. Recent studies of the IRX relation of main-sequence galaxies at have reported a significant evolution of this relation. Because the UV colors are accurately measured by HST, this evolution is attributed to a deficit in IRX at fixed compared to galaxy samples at lower redshifts with similar stellar masses. These low IRX values and large ranges in UV color are curious, since they cannot be explained by standard models of dust attenuation in galaxies. The total FIR luminosity of these high-redshift samples is very poorly constrained often with only one data point at these wavelengths. A common solution to this discrepancy is therefore an evolving temperature, which is the most important parameter to define the IR SED. On the other hand, a different geometric distribution of dust and stars can be responsible for the evolution of the IRX relation to high redshifts. In this work, we have investigated both ideas and find that also with a “maximally” warm IR SED the distribution of dust and stars likely needs to be altered to explain the location of some of the galaxies on the IRX plane.
We first infer the IR SED shape of high-redshift galaxies by using correlations of the luminosity weighted temperature (in this work referred as “temperature”) with metallicity and sSFR in samples of nearby galaxies, which we extend with the extreme cases of three analogs of galaxies. This provides us with good evidence that the IR SEDs of high-redshift galaxies show a warm emission component as suggested by temperatures of up to (), which is significantly warmer than typical galaxies (, ). We believe the warmer IR SEDs are due to a combination of lower ISM optical depth and denser and stronger UV radiation fields associated with more intense star formation and low metallicity environment. A comparison of the UV, [C II], and FIR morphologies along with metallicities in high and low redshift systems may support this picture.
Assuming such maximally warm IR SEDs would increase the FIR luminosity (and therefore IRX) by up to (factor of 4) with respect to previous measurements that assume the on average cooler IR SEDs of local galaxies. This reduces the deficit in IRX and brings most of the galaxies at in agreement with the relation measured at lower and local redshifts, however, with significant scatter. Even with the assumption of such warm IR SEDs is correct, a population of galaxies with red UV colors and low IRX remains. We suggest that the geometric distribution of dust and stars is altered in high-redshift galaxies.
Common dust attenuation models assuming a well mixed ISM (Charlot & Fall, 2000) are not able to explain the galaxies with low IRX values and large range in UV colors. The large spatial offsets between star-forming regions and [C II] emission as well as the Spitzer colors suggest that these galaxies are young, metal-poor, and likely have enhanced cloud motions due to stellar radiation pressure. Based on this, we propose an updated dust attenuation model in which the dust clouds are separated from the young stars by their radiation pressure. We show that such a separation can be easily achieved within the lifetime of massive O and B stars in young star-forming galaxies at high redshifts. Such a model can successfully reproduce the location of the FIR faint galaxies with low IRX. Furthermore, it can naturally reproduce the large scatter in UV colors due to viewing-angle effects.
We note that the evidence of a warmer IR SED in high-redshift galaxies is indirectly derived from correlations in local galaxies and three exemplary analogs of galaxies and the fact that high-redshift galaxies are metal-poor and have high sSFRs. However, we stress that a direct measurement of, e.g., the temperature is absolutely crucial to verify these trends. Unfortunately, such measurements turn out to be time consuming and only possible for some of the brightest high-redshift galaxies we know to-date (see Appendix A). The first estimates of the temperature of two normal galaxies suggest large variations, highlighting the importance of such direct measurements (Pavesi et al., 2016). The two galaxies occupy two different regions on the IRX diagram and likely are different in terms of metallicity and sSFR despite having comparable UV emission. This hints towards a large diversity in the galaxy population at , only 1 billion years after the Big Bang that is waiting to be explored with further observations.
| Name | R.A. | Decl. | z | [O III]/H | [O III]/H | [N II]/H | a | SFRHα | ||
|---|---|---|---|---|---|---|---|---|---|---|
| (J2000.0) | (J2000.0) | (optical) | (Å) | (Å) | (yr-1) | |||||
| GALEX0959+0151 | 09:59:40.34 | 01:51:21.30 | ||||||||
| GALEX1000+0157 | 10:00:27.85 | 01:57:03.60 | ||||||||
| GALEX1000+0201 | 10:00:35.76 | 02:01:13.50 |
| Name | Spitzer/MIPS | Herschel/PACS | Herschel/SPIRE | ALMAa | ||||
|---|---|---|---|---|---|---|---|---|
| ———————— | ———————————— | ———————————– | ||||||
| (#Antenna) | ||||||||
| (mJy) | (mJy) | (mJy) | (mJy) | (mJy) | (mJy) | (mJy) | (seconds) | |
| GALEX0959+0151 | 1255.87 () | |||||||
| GALEX1000+0157 | 9216.43 () | |||||||
| GALEX1000+0201 | 9852.10 () | |||||||
| Name | [O III]/H | [O III]/H | [O III]/[O II] | E(B-V) | / | a | SFRUV+FIRb | ||
|---|---|---|---|---|---|---|---|---|---|
| (Å) | (mag) | (UV cont. slope) | (yr-1) | ||||||
| GALEX0959+0151 | 8.8 | ||||||||
| (333)† | (2.11)† | (6.04)† | |||||||
| from GALEX: | |||||||||
| GALEX1000+0157 | |||||||||
| (423)† | (1.96)† | (5.61)† | |||||||
| from GALEX: | |||||||||
| GALEX1000+0201 | |||||||||
| (195)† | (1.65)† | (4.71)† | |||||||
| from GALEX: | |||||||||
| Name | z | b | c | |||
|---|---|---|---|---|---|---|
| (MIR power-law slope) | (emissivity) | (K) | (K) | |||
| Low-redshift analogs (This work) | ||||||
| GALEX0959+0151 | ||||||
| GALEX1000+0157† | ||||||
| GALEX1000+0201 | ||||||
| Stack | ||||||
| High-z galaxies from C15 (This work, using warm IR SED prior) | ||||||
| (parameters derived for , , []) | ||||||
| HZ1 | ||||||
| HZ2 | ||||||
| HZ3 | ||||||
| HZ4 | ||||||
| HZ5∗ | ||||||
| HZ5a | ||||||
| HZ6 (all)∙ | ||||||
| HZ6a | ||||||
| HZ6b | ||||||
| HZ6c | ||||||
| HZ7 | ||||||
| HZ8 | ||||||
| HZ8W | ||||||
| HZ9 | ||||||
| HZ10 | ||||||
| HZ10W≀ | () | |||||
| Temperature constraints on high-z galaxies from Pavesi et al. (2016) | ||||||
| (parameters derived for , [], is unconstraint) | ||||||
| HZ6 (all) | ||||||
| HZ10 | ||||||
| Lensed high-z Herschel detected galaxies (Sklias et al., 2014) | ||||||
| (modified blackbody with fixed , corrected for magnification) | ||||||
| A68/C0 | ||||||
| A68/h7 | ||||||
| A68/HLS115 | ||||||
| A68/nn4 | ||||||
| MACS0451 north | ||||||
| MACS0451 full arc | ||||||
| Lensed high-z DSFGs (Strandet et al., 2016) | ||||||
| (refitted by our method with photometry from Strandet et al. (2016) | ||||||
| SPT2319-55♢ | ‡ | |||||
| SPT2353-50♢ | ‡ | |||||
| SPT0346-52♢ | ⋆ | |||||
| SPT2351-57♢ | ‡ | |||||
| Intense high-z starburst AzTEC-3 Riechers et al. (2014) | ||||||
| AzTEC-3 | ||||||
| High-z galaxies from Willott et al. (2015) | ||||||
| (parameters derived for , , []) | ||||||
| CLM1 | ||||||
| WMH5 | ||||||
| Candidate [C II]-detected high-z galaxies from Aravena et al. (2016) (blind search) | ||||||
| (parameters derived for , , []) | ||||||
| IDX25 | ||||||
| IDX34 | ||||||
| ID02 | ||||||
| ID04 | ||||||
| ID09 | ||||||
| ID14 | ||||||
| ID27 | ||||||
| ID30 | ||||||
| ID31 | ||||||
| ID38 | ||||||
| ID41 | ||||||
| ID44 | ||||||
| ID49 | ||||||
| ID52 | ||||||
| Name | z | continuum flux | |||
|---|---|---|---|---|---|
| (UV spectral slope) | (Jy) | ||||
| HZ1 | 5.690 | 11.21 0.01 | |||
| HZ2 | 5.670 | 11.15 0.01 | |||
| HZ3 | 5.546 | 11.08 0.01 | |||
| HZ4 | 5.540 | 11.28 0.01 | |||
| HZ5 | 5.310 | 11.45 0.004 | |||
| HZ5a | |||||
| HZ6 (all) | 5.290 | 11.47 0.01 | |||
| HZ6a | 11.11 0.07 | ||||
| HZ6b | 11.00 0.07 | ||||
| HZ6c | 10.81 0.07 | ||||
| HZ7 | 5.250 | 11.05 0.02 | |||
| HZ8 | 5.148 | 11.04 0.02 | |||
| HZ8W | 10.57 0.04 | ||||
| HZ9 | 5.548 | 10.95 0.02 | |||
| HZ10 | 5.659 | 11.14 0.02 | |||
| HZ10W† | 10.23 0.05 | () | () |
Appendix A Quantifying the difficulty of measuring IR SEDs at
In Section 4.1 we show that the knowledge of the shape of the IR SED is crucial to measure basic IR properties like the total luminosity . Furthermore, it enables us to study in detail the ISM properties of galaxies such as their temperature and optical depth, which tell us about the current star-formation conditions in these galaxies. As pointed out earlier, IR SEDs of galaxies are very poorly constrained, most of the time by just one data-point at if at all. Measurement of DSFGs at reveal increased and thus warm SED shapes compared to galaxies a (Riechers et al., 2013, 2014; Strandet et al., 2016; Ma et al., 2016). The first estimates of for two normal galaxies reveal two very different temperatures, indicative of large variations in the SED shape of high-redshift galaxies (Pavesi et al., 2016). However, these measurements are uncertain as they only use wavelength data red-ward of [C II]. One way to investigate the diversity of IR SEDs of high-redshift galaxies statistically is to use larger samples of low-redshift analogs of these galaxies. This, however, might be dangerous as we do not know the degree at which analogs are actually representing the high-redshift galaxy population as a whole. Direct measurements of galaxies at high redshifts therefore seems to be the preferred strategy. Due to the faintness of these galaxies, this is a difficult endeavor and hence an optimal and effective observing strategy is needed.
In the following, we outline a possible observing strategy in order to better constrain the IR SEDs (specifically constrained by the luminosity weighted temperature ) of galaxies. Since observations in the IR are expensive, we focus in particular on minimizing the total observing time and maximizing the science output.
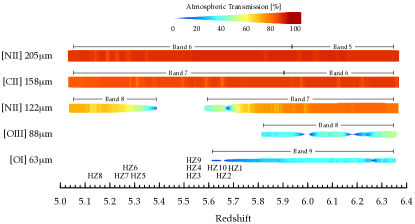
A.1 Theoretical calculations
To measure the temperature of high-redshift galaxies via continuum measurements, we choose wavelengths close to bright FIR emission lines ([O I] at , [O III] at , [N II] at and , and [C II] at ). With this strategy, any ALMA observations will produce line diagnostics in addition to FIR continuum measurements to further investigate the ISM of these galaxies (e.g., Pavesi et al., 2016). Figure 15 shows the observability of these FIR emission lines with ALMA as a function of redshift. The color and width of the bands for each FIR emission line corresponds to the atmospheric transmission in per-cent assuming a precipitable water vapor of . An efficient strategy is to look for the lowest redshift (to have a reasonable sample of spectroscopically confirmed galaxies) at which most of the FIR lines are observable with ALMA. It turns out that the redshift range fulfills this criteria with Band 5 being operational in ALMA cycle 5. Note that and are other possible windows at which all five emission lines are observable. If only interested in the highest transmission wavelengths (, , and ), all redshifts above are a good choice.
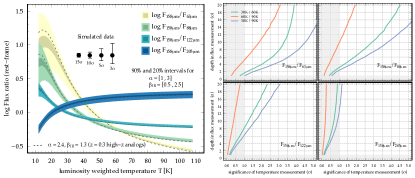
The left-side panel in Figure 16 shows FIR continuum flux ratios around these FIR emission lines as a function of the luminosity weighted temperature derived from a graybody mid-IR power-law parametrization by Casey (2012). We choose to use the ratios with respect to rest-frame , which has a high atmospheric transmission ( at ) and is well constrained by existing data sets in terms of detections and limits. In the following, we refer to as the “primary wavelength” and to the other wavelengths (, , , and ) as the “secondary wavelengths”. The width of the bands visualizes the model uncertainty ( confidence interval) of the continuum flux ratio for a large range in emissivities () and mid-IR power-law slopes (). We note that the relation between continuum flux ratio and temperature does not significantly depend on and and is primarily dependent on the assumed temperature (see also Section 4.1). The black points with error bars show simulated data points with fluxes observed at different depths for comparison. The continuum flux ratio would be the ideal choice to quantify the temperature because of its steep dependence on temperature. However, the atmospheric transparency for at the observed wavelength of is lowest with compared to , , and for , , and , respectively. The right-side panel in Figure 16 shows this more qualitatively. Each sub-panel corresponds to a continuum flux ratio and shows the needed depth of the flux measurement (in ) to reach a certain of significance to distinguish three different pairs of temperature. The calculation of the latter combines the model uncertainty at a given temperature with the measurement uncertainty (corresponding to the axis). The ratio gives the best turn-out for a given depth of flux measurement. All considered temperatures can be distinguished at () significance for a () detection at . For temperatures of and can be distinguished at significance for a detection at , while for a detection in is necessary to reach the same significance. Finally, the vs. temperature relation is too shallow to separate temperatures at with a significance of more than for any observational depth. The latter is the reason why the temperature estimates by Pavesi et al. (2016) have such a large quoted uncertainty.
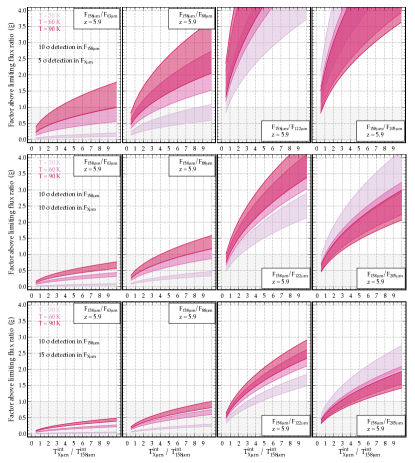
A.2 A fiducial survey at
The final success to measure a temperature depends on (i) the ability to reach the flux ratio for a given temperature (the limiting flux ratio ) and (ii) the ability to split different temperatures (as discussed above). Figure 17 demonstrates these points by combining the previous results with relative integration time calculations for a fiducial redshift of . The panels show the reached flux ratio above the limiting flux ratio as a function of integration in the secondary wavelengths with respect to the integration time necessary for a detection in . Note that only result in an upper limit in temperature for all flux ratios except for where it results in a lower temperature limit (see left panel of Figure 16). The horizontal panels show the four different flux ratios while the sets of panels (arranged vertically) show different depths for the observations at the secondary wavelengths (, , and ). The width of the curves (showing temperatures of , , and )181818Corresponding to , , and in . include the model and measurement uncertainties. In summary, we note the following.
-
•
Temperatures cannot be distinguished above with more than significance using the and ratios at flux measurement depths corresponding to less than signifiance.
-
•
Temperatures can be confined at or at for a detection in or within times the integration time in (with ).
-
•
The measurement of temperatures with the and ratios is not feasible within a reasonable amount of time (less than times the integration time in ).
-
•
Therefore, the optimal observing strategy to study the temperature of galaxies is to target rest-frame and (or if is affected by low transmission, but with a significantly decreased success rate), thereby requiring a depth of at least .
After setting up the frame-work, we now proceed to establish integration times and flux limits for which temperatures can be measured efficiently. Figure 18 shows the estimated flux root mean square (RMS) limits at a given significance as a function of integration time for different wavelengths and redshifts. We assume a dual polarization set-up with a bandwidth of , precipitable water vapor column density of , antennae, and a resolution of in the following. The calculations are done for objects at 02:00:00 observed with ALMA and the integration times do not include overheads. The large panel shows a more detailed graph for at . An integration time of would result in a continuum flux sensitivity of per beam, which is similar the flux observed in HZ4 (see Table 6). To distinguish temperatures of and with for such a source at with a significance of (for which a detection at is necessary), we have to double the integration time at , thus at (see Figure 17). Alternatively, a integration (corresponding to at ) will result in a significance to distinguish and of . The significance increases by roughly for temperatures of and .
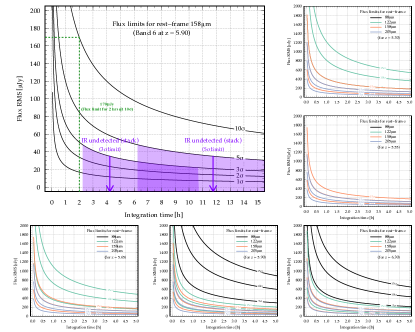
A.3 Temperature measurement of existing sources detected in [C II]
C15 provides four of the IR brightest galaxies at that can be followed up with our method to verify our inferred average temperature of such galaxies. Table 6 shows their expected (and measured in case of ) fluxes. We also include the other galaxies that are not detected in the FIR continuum. For the prediction of the fluxes we assumed a MIR power-law slope of , an emissivity of and a temperature (). For (), as assumed in C15, fluxes at wavelengths blue-ward of [C II] would be lower while fluxes red-ward of [C II] would be larger because of the shift of the SED to lower temperatures. In the following, we assume the same ALMA configuration as in Section A.2.
HZ10. The temperature of HZ10 at has already been estimated to be () (Pavesi et al., 2016). However, the uncertainty of this estimate is large since only data at are available. A better temperature estimate can be achieved by a measurement in . This would uniquely differentiate a temperature of and () with () significance (Figure 16). With an estimated flux of at , a measurement can be achieved in of observing time in Band 7 (see Figures 18 and 15). Assuming a temperature prior of instead, we would expect a flux sensitivity of and a required integration time of .
HZ9. For the second brightest galaxy in FIR at , rest-frame cannot be observed as it is falling between Bands 7 and 8. Similarly, and are out of range. Instead, a continuum measurement at can uniquely differentiate a temperature of and with significance. With an estimated flux of at , a measurement can be achieved in of observation in Band 6. Assuming a temperature prior of instead, we would expect a flux of , which would decrease the integration time to .
HZ4. HZ4 is at the same redshift as HZ9 and can therefore not be observed at . Also, and are out of the wavelength range. The measurement at that is needed to uniquely differentiate a temperature of and with significance, can only be achieved at integration times of more than for the estimated continuum flux of . The same is true for the source WMH5 detected by Willott et al. (2015).
HZ6. HZ6 at has been observed at by Pavesi et al. (2016) and a temperature of () has been derived with large uncertainty. Note that these measurements are integrated over all the three components. HZ6 can be re-observed at (expected flux is ) reaching a continuum detection in . This results in a splitting of and at level. The measurement at that is needed to uniquely differentiate a temperature of and with significance, can only be achieved at integration times of more than for the estimated continuum flux of (c.f. as measured by Pavesi et al., 2016).
FIR undetected galaxies. The continuum flux is not known for these galaxies and therefore only a lower limit in integration time can be inferred. Taking at face value the continuum flux limit of the stacked observations (), an integration time of at least is needed for a continuum detection of at as shown in the large panel in Figure 18. Note that this figure was made for , but due to the flat transmission function around rest-frame (Figure 15), the integration time estimates also hold for . For a detection at (instead of ) in Figure 17, the resulting integration times would increase by a factor . Thus, for a detection at , Figure 17 suggests times the integration time in , so more than . Thus, estimating the temperature for these FIR undetected sources is not feasible with today’s capabilities. This is also true for the continuum detected candidates found in ALMA blind searches (Aravena et al., 2016) as well as for CLM1 from Willott et al. (2015).
| Name | z | a | Referenceb | ||||||||
|---|---|---|---|---|---|---|---|---|---|---|---|
| () | () | () | () | () | () | () | () | ||||
| HZ10 | 5.6566 | () | 1 | ||||||||
| HZ9 | 5.5410 | () | 1 | ||||||||
| HZ6 (all) | 5.2928 | () | 2 | ||||||||
| WMH5 | 6.0695 | () | 3 | ||||||||
| HZ4 | 5.5440 | () | 1 | ||||||||
| HZ6b | 5.2928 | () | 2 | ||||||||
| HZ6c | 5.2928 | () | 2 | ||||||||
| IDX34 | 7.4910 | () | 4 | ||||||||
| ID04 | 6.8670 | () | 4 | ||||||||
| ID52 | 6.0180 | () | 4 | ||||||||
| ID30 | 6.8540 | () | 4 | ||||||||
| ID02 | 7.9140 | () | 4 | ||||||||
| HZ3 | 5.5416 | () | 1 | ||||||||
| CLM1 | 6.1657 | () | 3 | ||||||||
| ID41 | 6.3460 | () | 4 | ||||||||
| ID09 | 6.0240 | () | 4 | ||||||||
| ID14 | 6.7510 | () | 4 | ||||||||
| ID38 | 6.5930 | () | 4 | ||||||||
| IDX25 | 6.3570 | () | 4 | ||||||||
| ID44 | 7.3600 | () | 4 | ||||||||
| ID49 | 6.0510 | () | 4 | ||||||||
| HZ7 | 5.2532 | () | 1 | ||||||||
| ID27 | 7.5750 | () | 4 | ||||||||
| HZ5 | 5.3089 | () | 1 | ||||||||
| HZ5a | 5.3089 | () | 1 | ||||||||
| HZ1 | 5.6886 | () | 1 | ||||||||
| HZ6a | 5.2928 | () | 2 | ||||||||
| HZ8 | 5.1533 | () | 1 | ||||||||
| HZ8W | 5.1532 | () | 1 | ||||||||
| ID31 | 7.4940 | () | 4 | ||||||||
| HZ2 | 5.6697 | () | 1 |
References
- Álvarez-Márquez et al. (2016) Álvarez-Márquez, J., Burgarella, D., Heinis, S., et al. 2016, A&A, 587, A122
- Anders & Fritze-v. Alvensleben (2003) Anders, P., & Fritze-v. Alvensleben, U. 2003, A&A, 401, 1063
- Ando et al. (2007) Ando, M., Ohta, K., Iwata, I., et al. 2007, PASJ, 59, 717
- Aravena et al. (2016) Aravena, M., Decarli, R., Walter, F., et al. 2016, ArXiv e-prints, arXiv:1607.06772
- Armus et al. (2009) Armus, L., Mazzarella, J. M., Evans, A. S., et al. 2009, PASP, 121, 559
- Baker et al. (2001) Baker, A. J., Lutz, D., Genzel, R., Tacconi, L. J., & Lehnert, M. D. 2001, A&A, 372, L37
- Baldwin et al. (1981) Baldwin, J. A., Phillips, M. M., & Terlevich, R. 1981, PASP, 93, 5
- Barišić et al. (2017) Barišić, I., Faisst, A. L., Capak, P. L., et al. 2017, ArXiv e-prints, arXiv:1707.02980
- Battisti et al. (2017) Battisti, A. J., Calzetti, D., & Chary, R.-R. 2017, ArXiv e-prints, arXiv:1704.07426
- Bendo et al. (2012) Bendo, G. J., Galliano, F., & Madden, S. C. 2012, MNRAS, 423, 197
- Béthermin et al. (2015) Béthermin, M., Daddi, E., Magdis, G., et al. 2015, A&A, 573, A113
- Bian et al. (2016) Bian, F., Kewley, L., Dopita, M., & Blanc, G. 2016, ArXiv e-prints, arXiv:1611.08595
- Boquien et al. (2009) Boquien, M., Calzetti, D., Kennicutt, R., et al. 2009, ApJ, 706, 553
- Boquien et al. (2012) Boquien, M., Buat, V., Boselli, A., et al. 2012, A&A, 539, A145
- Bourne et al. (2017) Bourne, N., Dunlop, J. S., Merlin, E., et al. 2017, MNRAS, 467, 1360
- Bouwens et al. (2009) Bouwens, R. J., Illingworth, G. D., Franx, M., et al. 2009, ApJ, 705, 936
- Bouwens et al. (2012) Bouwens, R. J., Illingworth, G. D., Oesch, P. A., et al. 2012, ApJ, 754, 83
- Bouwens et al. (2016) Bouwens, R. J., Aravena, M., Decarli, R., et al. 2016, ApJ, 833, 72
- Bruzual & Charlot (2003) Bruzual, G., & Charlot, S. 2003, MNRAS, 344, 1000
- Buat et al. (2005) Buat, V., Iglesias-Páramo, J., Seibert, M., et al. 2005, ApJ, 619, L51
- Buat et al. (2010) Buat, V., Giovannoli, E., Burgarella, D., et al. 2010, MNRAS, 409, L1
- Buat et al. (2012) Buat, V., Noll, S., Burgarella, D., et al. 2012, A&A, 545, A141
- Burgarella et al. (2005) Burgarella, D., Buat, V., & Iglesias-Páramo, J. 2005, MNRAS, 360, 1413
- Calzetti et al. (2000) Calzetti, D., Armus, L., Bohlin, R. C., et al. 2000, ApJ, 533, 682
- Capak et al. (2011) Capak, P. L., Riechers, D., Scoville, N. Z., et al. 2011, Nature, 470, 233
- Capak et al. (2015) Capak, P. L., Carilli, C., Jones, G., et al. 2015, Nature, 522, 455
- Cardamone et al. (2009) Cardamone, C., Schawinski, K., Sarzi, M., et al. 2009, MNRAS, 399, 1191
- Carilli & Walter (2013) Carilli, C. L., & Walter, F. 2013, ARA&A, 51, 105
- Carilli et al. (2016) Carilli, C. L., Chluba, J., Decarli, R., et al. 2016, ApJ, 833, 73
- Casey (2012) Casey, C. M. 2012, MNRAS, 425, 3094
- Casey et al. (2014) Casey, C. M., Scoville, N. Z., Sanders, D. B., et al. 2014, ApJ, 796, 95
- Chabrier (2003) Chabrier, G. 2003, PASP, 115, 763
- Chapman et al. (2003) Chapman, S. C., Helou, G., Lewis, G. F., & Dale, D. A. 2003, ApJ, 588, 186
- Charlot & Fall (2000) Charlot, S., & Fall, S. M. 2000, ApJ, 539, 718
- Chu et al. (2017) Chu, J. K., Sanders, D. B., Larson, K. L., et al. 2017, ArXiv e-prints, arXiv:1702.01756
- Conley et al. (2011) Conley, A., Cooray, A., Vieira, J. D., et al. 2011, ApJ, 732, L35
- Coppin et al. (2010) Coppin, K., Pope, A., Menéndez-Delmestre, K., et al. 2010, ApJ, 713, 503
- Coppin et al. (2015) Coppin, K. E. K., Geach, J. E., Almaini, O., et al. 2015, MNRAS, 446, 1293
- Cormier et al. (2015) Cormier, D., Madden, S. C., Lebouteiller, V., et al. 2015, A&A, 578, A53
- Cortese et al. (2006) Cortese, L., Boselli, A., Buat, V., et al. 2006, ApJ, 637, 242
- Cowie et al. (2010) Cowie, L. L., Barger, A. J., & Hu, E. M. 2010, ApJ, 711, 928
- Cowie et al. (2011) —. 2011, ApJ, 738, 136
- Curti et al. (2016) Curti, M., Cresci, G., Mannucci, F., et al. 2016, ArXiv e-prints, arXiv:1610.06939
- da Cunha et al. (2013) da Cunha, E., Groves, B., Walter, F., et al. 2013, ApJ, 766, 13
- Daddi et al. (2007) Daddi, E., Dickinson, M., Morrison, G., et al. 2007, ApJ, 670, 156
- Dale et al. (2012) Dale, D. A., Aniano, G., Engelbracht, C. W., et al. 2012, ApJ, 745, 95
- De Barros et al. (2016) De Barros, S., Reddy, N., & Shivaei, I. 2016, ApJ, 820, 96
- de Barros et al. (2014) de Barros, S., Schaerer, D., & Stark, D. P. 2014, A&A, 563, A81
- De Looze et al. (2014) De Looze, I., Cormier, D., Lebouteiller, V., et al. 2014, A&A, 568, A62
- Díaz-Santos et al. (2014) Díaz-Santos, T., Armus, L., Charmandaris, V., et al. 2014, ApJ, 788, L17
- Draine (2006) Draine, B. T. 2006, ApJ, 636, 1114
- Dunlop (2016) Dunlop, J. S. 2016, The Messenger, 166, 48
- Dunne et al. (2000) Dunne, L., Eales, S., Edmunds, M., et al. 2000, MNRAS, 315, 115
- Elbaz et al. (2007) Elbaz, D., Daddi, E., Le Borgne, D., et al. 2007, A&A, 468, 33
- Elmegreen et al. (2009) Elmegreen, D. M., Elmegreen, B. G., Marcus, M. T., et al. 2009, ApJ, 701, 306
- Erb et al. (2016) Erb, D. K., Pettini, M., Steidel, C. C., et al. 2016, ApJ, 830, 52
- Faber et al. (2003) Faber, S. M., Phillips, A. C., Kibrick, R. I., et al. 2003, in Proc. SPIE, Vol. 4841, Instrument Design and Performance for Optical/Infrared Ground-based Telescopes, ed. M. Iye & A. F. M. Moorwood, 1657–1669
- Faisst (2016) Faisst, A. L. 2016, ApJ, 829, 99
- Faisst et al. (2016a) Faisst, A. L., Capak, P., Hsieh, B. C., et al. 2016a, ApJ, 821, 122
- Faisst et al. (2016b) Faisst, A. L., Capak, P. L., Davidzon, I., et al. 2016b, ApJ, 822, 29
- Feldmann (2015) Feldmann, R. 2015, MNRAS, 449, 3274
- Fitzpatrick (1986) Fitzpatrick, E. L. 1986, AJ, 92, 1068
- Förster Schreiber et al. (2011) Förster Schreiber, N. M., Shapley, A. E., Genzel, R., et al. 2011, ApJ, 739, 45
- Fudamoto et al. (2017) Fudamoto et al. 2017, MNRAS, submitted
- Genzel et al. (2015) Genzel, R., Tacconi, L. J., Lutz, D., et al. 2015, ApJ, 800, 20
- Gil de Paz et al. (2007) Gil de Paz, A., Boissier, S., Madore, B. F., et al. 2007, ApJS, 173, 185
- González et al. (2014) González, V., Bouwens, R., Illingworth, G., et al. 2014, ApJ, 781, 34
- González-López et al. (2014) González-López, J., Riechers, D. A., Decarli, R., et al. 2014, ApJ, 784, 99
- Gordon et al. (2000) Gordon, K. D., Witt, A. N., Rudy, R. J., et al. 2000, ApJ, 544, 859
- Green et al. (2012) Green, J. C., Froning, C. S., Osterman, S., et al. 2012, ApJ, 744, 60
- Greis et al. (2016) Greis, S. M. L., Stanway, E. R., Davies, L. J. M., & Levan, A. J. 2016, MNRAS, 459, 2591
- Greve et al. (2012) Greve, T. R., Vieira, J. D., Weiß, A., et al. 2012, ApJ, 756, 101
- Heinis et al. (2013) Heinis, S., Buat, V., Béthermin, M., et al. 2013, MNRAS, 429, 1113
- Heinis et al. (2014) —. 2014, MNRAS, 437, 1268
- Hemmati et al. (2014) Hemmati, S., Miller, S. H., Mobasher, B., et al. 2014, ApJ, 797, 108
- Herrera-Camus et al. (2015) Herrera-Camus, R., Bolatto, A. D., Wolfire, M. G., et al. 2015, ApJ, 800, 1
- Hodge et al. (2015) Hodge, J. A., Riechers, D., Decarli, R., et al. 2015, ApJ, 798, L18
- Hodge et al. (2016) Hodge, J. A., Swinbank, A. M., Simpson, J. M., et al. 2016, ApJ, 833, 103
- Hopkins et al. (2010) Hopkins, P. F., Younger, J. D., Hayward, C. C., Narayanan, D., & Hernquist, L. 2010, MNRAS, 402, 1693
- Howell et al. (2010) Howell, J. H., Armus, L., Mazzarella, J. M., et al. 2010, ApJ, 715, 572
- Hu et al. (2009) Hu, E. M., Cowie, L. L., Kakazu, Y., & Barger, A. J. 2009, ApJ, 698, 2014
- Ilbert et al. (2015) Ilbert, O., Arnouts, S., Le Floc’h, E., et al. 2015, A&A, 579, A2
- Jiang et al. (2016) Jiang, L., Finlator, K., Cohen, S. H., et al. 2016, ApJ, 816, 16
- Jones et al. (2017) Jones et al. 2017, ApJ, in prep.
- Kanekar et al. (2013) Kanekar, N., Wagg, J., Ram Chary, R., & Carilli, C. L. 2013, ApJ, 771, L20
- Karim et al. (2011) Karim, A., Schinnerer, E., Martínez-Sansigre, A., et al. 2011, ApJ, 730, 61
- Kennicutt et al. (2011) Kennicutt, R. C., Calzetti, D., Aniano, G., et al. 2011, PASP, 123, 1347
- Kewley & Ellison (2008) Kewley, L. J., & Ellison, S. L. 2008, ApJ, 681, 1183
- Kewley et al. (2013) Kewley, L. J., Maier, C., Yabe, K., et al. 2013, ApJ, 774, L10
- Knudsen et al. (2016) Knudsen, K. K., Richard, J., Kneib, J.-P., et al. 2016, MNRAS, 462, L6
- Knudsen et al. (2017) Knudsen, K. K., Watson, D., Frayer, D., et al. 2017, MNRAS, 466, 138
- Kong et al. (2004) Kong, X., Charlot, S., Brinchmann, J., & Fall, S. M. 2004, MNRAS, 349, 769
- Laigle et al. (2016) Laigle, C., McCracken, H. J., Ilbert, O., et al. 2016, ApJS, 224, 24
- Larson et al. (2016) Larson, K. L., Sanders, D. B., Barnes, J. E., et al. 2016, ApJ, 825, 128
- Lee et al. (2012) Lee, K.-S., Alberts, S., Atlee, D., et al. 2012, ApJ, 758, L31
- Lee et al. (2015) Lee, N., Sanders, D. B., Casey, C. M., et al. 2015, ApJ, 801, 80
- Lilly et al. (2007) Lilly, S. J., Le Fèvre, O., Renzini, A., et al. 2007, ApJS, 172, 70
- Lofthouse et al. (2017) Lofthouse, E. K., Houghton, R. C. W., & Kaviraj, S. 2017, ArXiv e-prints, arXiv:1701.07015
- Ma et al. (2016) Ma, J., Gonzalez, A. H., Vieira, J. D., et al. 2016, ApJ, 832, 114
- Madden et al. (2013) Madden, S. C., Rémy-Ruyer, A., Galametz, M., et al. 2013, PASP, 125, 600
- Magdis et al. (2012) Magdis, G. E., Daddi, E., Béthermin, M., et al. 2012, ApJ, 760, 6
- Magnelli et al. (2014) Magnelli, B., Lutz, D., Saintonge, A., et al. 2014, A&A, 561, A86
- Maiolino et al. (2008) Maiolino, R., Nagao, T., Grazian, A., et al. 2008, A&A, 488, 463
- Maiolino et al. (2015) Maiolino, R., Carniani, S., Fontana, A., et al. 2015, MNRAS, 452, 54
- Mannucci et al. (2010) Mannucci, F., Cresci, G., Maiolino, R., Marconi, A., & Gnerucci, A. 2010, MNRAS, 408, 2115
- Mármol-Queraltó et al. (2016) Mármol-Queraltó, E., McLure, R. J., Cullen, F., et al. 2016, MNRAS, 460, 3587
- Martin et al. (2005) Martin, D. C., Fanson, J., Schiminovich, D., et al. 2005, ApJ, 619, L1
- Mason et al. (2016) Mason, C. A., Treu, T., Fontana, A., et al. 2016, ArXiv e-prints, arXiv:1610.03075
- Masters et al. (2016) Masters, D., Faisst, A., & Capak, P. 2016, ApJ, 828, 18
- Meurer et al. (1999) Meurer, G. R., Heckman, T. M., & Calzetti, D. 1999, ApJ, 521, 64
- Meurer et al. (1995) Meurer, G. R., Heckman, T. M., Leitherer, C., et al. 1995, AJ, 110, 2665
- Miller et al. (2016) Miller, T. B., Chapman, S. C., Hayward, C. C., et al. 2016, ArXiv e-prints, arXiv:1611.08552
- Muñoz-Mateos et al. (2009) Muñoz-Mateos, J. C., Gil de Paz, A., Boissier, S., et al. 2009, ApJ, 701, 1965
- Narayanan et al. (2017) Narayanan, D., Dave, R., Johnson, B., et al. 2017, ArXiv e-prints, arXiv:1705.05858
- Noeske et al. (2007) Noeske, K. G., Weiner, B. J., Faber, S. M., et al. 2007, ApJ, 660, L43
- Oke (1974) Oke, J. B. 1974, ApJS, 27, 21
- Ota et al. (2014) Ota, K., Walter, F., Ohta, K., et al. 2014, ApJ, 792, 34
- Ouchi et al. (2013) Ouchi, M., Ellis, R., Ono, Y., et al. 2013, ApJ, 778, 102
- Overzier et al. (2011) Overzier, R. A., Heckman, T. M., Wang, J., et al. 2011, ApJ, 726, L7
- Pannella et al. (2009) Pannella, M., Carilli, C. L., Daddi, E., et al. 2009, ApJ, 698, L116
- Pannella et al. (2015) Pannella, M., Elbaz, D., Daddi, E., et al. 2015, ApJ, 807, 141
- Pavesi et al. (2016) Pavesi, R., Riechers, D. A., Capak, P. L., et al. 2016, ApJ, 832, 151
- Peng et al. (2011) Peng, C. Y., Ho, L. C., Impey, C. D., & Rix, H.-W. 2011, GALFIT: Detailed Structural Decomposition of Galaxy Images, Astrophysics Source Code Library, , , ascl:1104.010
- Pettini et al. (1998) Pettini, M., Kellogg, M., Steidel, C. C., et al. 1998, ApJ, 508, 539
- Pettini & Pagel (2004) Pettini, M., & Pagel, B. E. J. 2004, MNRAS, 348, L59
- Pilyugin & Thuan (2005) Pilyugin, L. S., & Thuan, T. X. 2005, ApJ, 631, 231
- Pineda et al. (2013) Pineda, J. L., Langer, W. D., Velusamy, T., & Goldsmith, P. F. 2013, A&A, 554, A103
- Pope et al. (2008) Pope, A., Chary, R.-R., Alexander, D. M., et al. 2008, ApJ, 675, 1171
- Popping et al. (2016) Popping, G., Somerville, R. S., & Galametz, M. 2016, ArXiv e-prints, arXiv:1609.08622
- Prestwich et al. (2013) Prestwich, A. H., Tsantaki, M., Zezas, A., et al. 2013, ApJ, 769, 92
- Prevot et al. (1984) Prevot, M. L., Lequeux, J., Prevot, L., Maurice, E., & Rocca-Volmerange, B. 1984, A&A, 132, 389
- Rasappu et al. (2016) Rasappu, N., Smit, R., Labbé, I., et al. 2016, MNRAS, 461, 3886
- Reddy et al. (2012) Reddy, N., Dickinson, M., Elbaz, D., et al. 2012, ApJ, 744, 154
- Reddy et al. (2010) Reddy, N. A., Erb, D. K., Pettini, M., Steidel, C. C., & Shapley, A. E. 2010, ApJ, 712, 1070
- Reddy et al. (2006) Reddy, N. A., Steidel, C. C., Fadda, D., et al. 2006, ApJ, 644, 792
- Reddy et al. (2015) Reddy, N. A., Kriek, M., Shapley, A. E., et al. 2015, ApJ, 806, 259
- Rémy-Ruyer et al. (2013) Rémy-Ruyer, A., Madden, S. C., Galliano, F., et al. 2013, A&A, 557, A95
- Rich et al. (2012) Rich, J. A., Torrey, P., Kewley, L. J., Dopita, M. A., & Rupke, D. S. N. 2012, ApJ, 753, 5
- Riechers et al. (2013) Riechers, D. A., Bradford, C. M., Clements, D. L., et al. 2013, Nature, 496, 329
- Riechers et al. (2014) Riechers, D. A., Carilli, C. L., Capak, P. L., et al. 2014, ApJ, 796, 84
- Rupke et al. (2008) Rupke, D. S. N., Veilleux, S., & Baker, A. J. 2008, ApJ, 674, 172
- Safarzadeh et al. (2016) Safarzadeh, M., Hayward, C. C., & Ferguson, H. C. 2016, ArXiv e-prints, arXiv:1604.07402
- Sanders et al. (2003) Sanders, D. B., Mazzarella, J. M., Kim, D.-C., Surace, J. A., & Soifer, B. T. 2003, AJ, 126, 1607
- Sanders et al. (2016) Sanders, R. L., Shapley, A. E., Kriek, M., et al. 2016, ApJ, 825, L23
- Schaerer et al. (2015) Schaerer, D., Boone, F., Zamojski, M., et al. 2015, A&A, 574, A19
- Schaerer et al. (2013) Schaerer, D., de Barros, S., & Sklias, P. 2013, A&A, 549, A4
- Schneider et al. (2016) Schneider, R., Hunt, L., & Valiante, R. 2016, MNRAS, 457, 1842
- Schreiber et al. (2017) Schreiber, C., Pannella, M., Leiton, R., et al. 2017, A&A, 599, A134
- Schreiber et al. (2015) Schreiber, C., Pannella, M., Elbaz, D., et al. 2015, A&A, 575, A74
- Scoville et al. (2015) Scoville, N., Faisst, A., Capak, P., et al. 2015, ApJ, 800, 108
- Scoville et al. (2007) Scoville, N., Aussel, H., Brusa, M., et al. 2007, ApJS, 172, 1
- Scoville et al. (2016) Scoville, N., Sheth, K., Aussel, H., et al. 2016, ApJ, 820, 83
- Scoville (2013) Scoville, N. Z. 2013, Evolution of star formation and gas, ed. J. Falcón-Barroso & J. H. Knapen, 491
- Scoville & Kwan (1976) Scoville, N. Z., & Kwan, J. 1976, ApJ, 206, 718
- Seaton (1979) Seaton, M. J. 1979, MNRAS, 187, 73P
- Seibert et al. (2005) Seibert, M., Martin, D. C., Heckman, T. M., et al. 2005, ApJ, 619, L55
- Shim et al. (2011) Shim, H., Chary, R.-R., Dickinson, M., et al. 2011, ApJ, 738, 69
- Shivaei et al. (2015) Shivaei, I., Reddy, N. A., Shapley, A. E., et al. 2015, ApJ, 815, 98
- Siana et al. (2009) Siana, B., Smail, I., Swinbank, A. M., et al. 2009, ApJ, 698, 1273
- Skibba et al. (2011) Skibba, R. A., Engelbracht, C. W., Dale, D., et al. 2011, ApJ, 738, 89
- Sklias et al. (2014) Sklias, P., Zamojski, M., Schaerer, D., et al. 2014, A&A, 561, A149
- Speagle et al. (2014) Speagle, J. S., Steinhardt, C. L., Capak, P. L., & Silverman, J. D. 2014, ApJS, 214, 15
- Stanway et al. (2014) Stanway, E. R., Eldridge, J. J., Greis, S. M. L., et al. 2014, MNRAS, 444, 3466
- Stark et al. (2013) Stark, D. P., Schenker, M. A., Ellis, R., et al. 2013, ApJ, 763, 129
- Steidel et al. (2014) Steidel, C. C., Rudie, G. C., Strom, A. L., et al. 2014, ApJ, 795, 165
- Steinhardt et al. (2014) Steinhardt, C. L., Speagle, J. S., Capak, P., et al. 2014, ApJ, 791, L25
- Strandet et al. (2016) Strandet, M. L., Weiss, A., Vieira, J. D., et al. 2016, ApJ, 822, 80
- Strom et al. (2016) Strom, A. L., Steidel, C. C., Rudie, G. C., et al. 2016, ArXiv e-prints, arXiv:1608.02587
- Tacchella et al. (2015) Tacchella, S., Lang, P., Carollo, C. M., et al. 2015, ApJ, 802, 101
- Tacconi et al. (2010) Tacconi, L. J., Genzel, R., Neri, R., et al. 2010, Nature, 463, 781
- Takeuchi et al. (2010) Takeuchi, T. T., Buat, V., Heinis, S., et al. 2010, A&A, 514, A4
- Takeuchi et al. (2012) Takeuchi, T. T., Yuan, F.-T., Ikeyama, A., Murata, K. L., & Inoue, A. K. 2012, ApJ, 755, 144
- Tasca et al. (2015) Tasca, L. A. M., Le Fèvre, O., Hathi, N. P., et al. 2015, A&A, 581, A54
- Temi et al. (2009) Temi, P., Brighenti, F., & Mathews, W. G. 2009, ApJ, 707, 890
- To et al. (2014) To, C.-H., Wang, W.-H., & Owen, F. N. 2014, ApJ, 792, 139
- U et al. (2012) U, V., Sanders, D. B., Mazzarella, J. M., et al. 2012, ApJS, 203, 9
- Vallini et al. (2017) Vallini, L., Ferrara, A., Pallottini, A., & Gallerani, S. 2017, MNRAS, 467, 1300
- Vallini et al. (2013) Vallini, L., Gallerani, S., Ferrara, A., & Baek, S. 2013, MNRAS, 433, 1567
- Vallini et al. (2015) Vallini, L., Gallerani, S., Ferrara, A., Pallottini, A., & Yue, B. 2015, ApJ, 813, 36
- Walter et al. (2012) Walter, F., Decarli, R., Carilli, C., et al. 2012, ApJ, 752, 93
- Watson et al. (2015) Watson, D., Christensen, L., Knudsen, K. K., et al. 2015, Nature, 519, 327
- Weiß et al. (2013) Weiß, A., De Breuck, C., Marrone, D. P., et al. 2013, ApJ, 767, 88
- Willott et al. (2015) Willott, C. J., Carilli, C. L., Wagg, J., & Wang, R. 2015, ApJ, 807, 180