Origin of chemically distinct discs in the Auriga cosmological simulations
Abstract
The stellar disk of the Milky Way shows complex spatial and abundance structure that is central to understanding the key physical mechanisms responsible for shaping our Galaxy. In this study, we use six very high resolution cosmological zoom simulations of Milky Way-sized haloes to study the prevalence and formation of chemically distinct disc components. We find that our simulations develop a clearly bimodal distribution in the – plane. We find two main pathways to creating this dichotomy which operate in different regions of the galaxies: a) an early () and intense high- star formation phase in the inner region ( kpc) induced by gas-rich mergers, followed by more quiescent low- star formation; and b) an early phase of high- star formation in the outer disc followed by a shrinking of the gas disc owing to a temporarily lowered gas accretion rate, after which disc growth resumes. In process b), a double-peaked star formation history around the time and radius of disc shrinking accentuates the dichotomy. If the early star formation phase is prolonged (rather than short and intense), chemical evolution proceeds as per process a) in the inner region, but the dichotomy is less clear. In the outer region, the dichotomy is only evident if the first intense phase of star formation covers a large enough radial range before disc shrinking occurs; otherwise, the outer disc consists of only low- sequence stars. We discuss the implication that both processes occurred in the Milky Way.
keywords:
galaxies: evolution - galaxies: kinematics and dynamics - galaxies: spiral - galaxies: structure1 Introduction
For many years, our understanding of the formation history of the Galaxy has heavily drawn on the concept of distinct thin and thick stellar disc components (see Combes, 2017, for a summary of the current status). A structural dichotomy was first surmised from star counts in the solar neighbourhood, which were found to make up a vertical density distribution consistent with a sum of two exponential profiles of different scale heights (Gilmore & Reid, 1983). The idea of two distinct components was then bolstered by the distribution of solar neighbourhood disk stars in the – ] plane (Gratton et al., 1996; Fuhrmann, 1998): a distinct group of high- and low- stars with a dearth of stars in between. Recent Galactic spectroscopic surveys such as the Apache Point Observatory Galactic Evolution Experiment (APOGEE) have extended our view of the Galaxy and have revealed that the high- component is thicker and more radially compact than the low- component (Reddy et al., 2003; Bensby et al., 2011; Bovy et al., 2012; Anders et al., 2014; Hayden et al., 2015). The radial truncation of the high- component at approximately the solar radius indicates that there is no simple mapping from the bimodal structure in abundance space to real space; the structural thick disc outside of the solar radius cannot be part of the high- component - the chemically defined thick disc. Instead, the current picture is that the low- component is composed of many sub-populations of unique metallicity (Bovy et al., 2016b; Minchev et al., 2017; Mackereth et al., 2017) - the so-called Mono-Abundance Populations (MAPs), each of which are distributed in a “donut” morphology that becomes radially larger and vertically thicker with decreasing metallicity. Moreover, the vertical scale height of each MAP flares (scale height increases with radius), with the flare becoming more emphatic with decreasing metallicity (Bovy et al., 2016b). Similar flaring patterns have also been reported for coeval stellar populations in simulations (Minchev et al., 2017). In contrast, the high- MAPs are inferred to have a centrally peaked surface density with similar exponential scale radii and non-flaring scale heights, suggestive of a different origin to the low- component (e.g. Haywood et al., 2015).
There are several proposed scenarios for creating a structurally distinct thick disc, including vertical heating from nearby satellites (Quinn et al., 1993; Villalobos & Helmi, 2008), turbulence in high-redshift gas-rich discs (Noguchi, 1998; Bournaud et al., 2009), violent gas-rich mergers (Brook et al., 2004) and the accretion of satellite stars (Abadi et al., 2003). More recently, it has been proposed that a distinct thick disc can be generated by the radial migration of kinematically hot stars from the inner to the outer disc (Schönrich & Binney, 2009; Loebman et al., 2011; Roškar et al., 2013). While radial migration is expected to be important to reproduce the flat age-metallicity relation (Casagrande et al., 2011) and the metallicity-rotation velocity relation (Allende Prieto et al., 2016; Kordopatis et al., 2017; Schönrich & McMillan, 2017), it is still hotly debated whether it plays a key role in generating a thick disc (Minchev et al., 2012; Kubryk et al., 2013; Vera-Ciro et al., 2014; Grand et al., 2016a; Kawata et al., 2017).
A promising explanation for both the geometrical and chemical properties of these two components is characterised by two phases of star formation: an early phase from gas infall during a rapid star formation phase to form a thick disc followed by gradual infall of primordial gas to form a thin disc. Chiappini et al. (1997) first devised a two-infall analytical chemical evolution framework to model this scenario, which provided a good fit to the dichotomy in the local metallicity distribution, under the assumption that metal-rich, high- stars migrated from the inner to the outer disc (see Grisoni et al., 2017, for an alternative explanation based on parallel evolution). However, these models could not account for the extremely metal-rich stars with thin disk kinematics at the local volume, which were shown to have a broad range in age (Trevisan et al. 2011; Casagrande et al. 2011 and discussion in Section 4 of Anders et al. 2017).
In recent years, numerical simulations have improved sufficiently to study the formation of thin and thick discs (e.g., Rahimi et al., 2011; Scannapieco et al., 2011; Loebman et al., 2011; Obreja et al., 2016; Miranda et al., 2016; Buck et al., 2017; Ma et al., 2017; Navarro et al., 2017, to name but a few). In particular, Brook et al. (2004) employed cosmological zoom simulations to show that infalling gas brought into the galaxy by violent gas rich mergers can create a compact, centralised component (see also Brook et al., 2007; Richard et al., 2010) distinct from the comparably quiescent subsequent formation of a younger, lower- component. More modern cosmological simulations that better resolve the disc seem to reinforce this picture, and consistently predict that the structural thin disc forms smoothly in an inside-out, upside-down fashion (e.g. Stinson et al., 2013; Bird et al., 2013; Minchev et al., 2014; Grand et al., 2016a; Domínguez-Tenreiro et al., 2017). The chemical dichotomy, however, does not seem to be a ubiquitous feature of simulations; Brook et al. (2012) finds some semblance of two distinct sequences in chemical abundance space, whereas the evolution is smooth and continuous in the simulations of Minchev et al. (2013). Thus, the formation of a clear chemical dichotomy is not guaranteed in simulations, which raises interesting questions regarding the formation mechanisms of the observed chemical dichotomy and whether it can be commonly reproduced in simulations.
In this paper, we analyse the Auriga simulation suite - a large set of high resolution, cosmological simulations of Milky Way-mass haloes (see Grand et al., 2017), which provide sufficient resolution to study the structure of the disc(s) in chemical abundance space in a fully cosmological context. A brief description of our simulations is given in Sec. 2. In particular, we focus on the evolution of the plane of star particles in the disc, as a function of radius and height above the plane. Our goal is to search for distinct chemical components. We identify the prevalence of such components and determine the factors relevant for their development in Sec. 3. We summarise out results and discuss the implications for the Milky Way formation history in Sec. 4.
2 Simulations
The Auriga simulations (Grand et al., 2017) are a suite of cosmological zoom simulations of haloes in the mass range - . The simulations begin at with cosmological parameters: , , and a Hubble constant of km s-1 Mpc-1, where , taken from Planck Collaboration et al. (2014). The simulations are performed with the magneto-hydrodynamic code arepo (Springel, 2010), with a comprehensive galaxy formation model (see Vogelsberger et al., 2013; Marinacci et al., 2014a; Grand et al., 2016a, for more details) that includes: primordial and metal line cooling, a prescription for a uniform background UV field for reionization (completed at ), a subgrid model for star formation, magnetic fields, and black hole seeding, accretion and feedback. For stellar feedback, a gas cell eligible for star formation is chosen (according to the Chabrier (2003) Initial Mass Function) to be either a site for SNII feedback or converted into a star particle. In the former case, a single wind particle is launched with a velocity that scales with the 1D local dark matter velocity dispersion in a random direction. Its metal content is determined by the initial metallicity of the gas cell that spawned the wind particle, the newly produced metals derived from the yield tables of Portinari et al. (1998), and the metal loading factor, : the wind particle is loaded with of the total metals, and the rest remains local. In the latter case, a star particle is created, which represents a single stellar population with a given mass, age and metallicity. Mass loss and metal enrichment from SNIa and AGB stars are modelled by calculating at each time step the mass moving off the main sequence for each star particle (see Grand et al., 2017, for more details). The mass and metals are then distributed among nearby gas cells with a top-hat kernel. We track a total of 9 elements: H, He, C, O, N, Ne, Mg, Si and Fe.
In this study, we focus on the 6 highest resolution simulations in the suite. The typical dark matter particle mass is , and the baryonic mass resolution is . The physical softening of collisionless particles grows with time (corresponding to a fixed comoving softening length of 250 pc ) until a maximum physical softening length of 185 pc is reached. The physical softening value for the gas cells is scaled by the gas cell radius (assuming a spherical cell shape given the volume), with a minimum softening set to that of the collisionless particles. We reiterate that in this study we analyse the 2-dimensional distribution of stars in chemical space in kiloparsec-scale spatial regions of the disc, which requires of order star particles in the main galaxy in order to sufficiently resolve the features for which we are searching.
3 Results
| Run | Subhalo | [Gyr] | |||
|---|---|---|---|---|---|
| Au 6 | 1 | 10.84 | 0.54 | 0.18 | 0.93 |
| Au 16 | 1 | 9.60 | 0.09 | 0.12 | 0.32 |
| Au 21 | 1 | 7.46 | 0.53 | 0.23 | 1.42 |
| 2 | 7.74 | 0.40 | 0.25 | 0.59 | |
| Au 23 | 1 | 11.74 | 0.34 | 0.21 | 0.87 |
| 2 | 9.92 | 0.34 | 0.45 | 0.59 | |
| Au 24 | 1 | 10.23 | 0.40 | 0.20 | 1.03 |
| Au 27 | 1 | 10.23 | 0.27 | 0.23 | 0.57 |
| 2 | 9.31 | 0.27 | 0.21 | 0.74 |
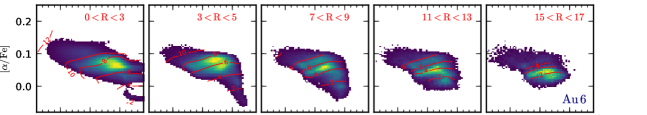
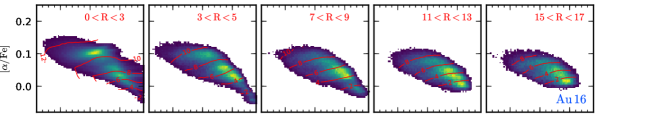
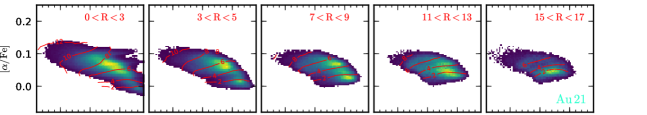
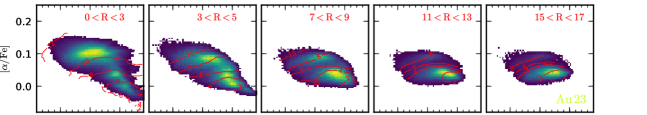
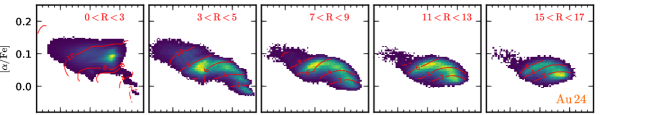
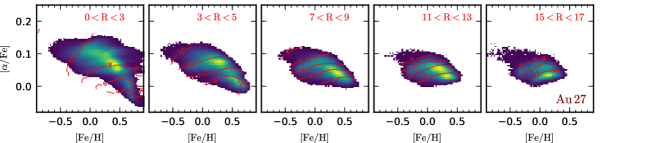
Following Bovy et al. (2016b), we define 111We do not follow the evolution of Sulphur and Calcium, therefore we do not include these elements in the average definition.. In Fig. 1, we show the distribution of star particles in the – plane at different radii, overlaid with contours of mean age, for all six simulations. In each case, we observe the expected result that older stars have higher and lower than younger star particles. We note that the distribution in chemical abundance space varies between radii and simulations; the distributions are either smooth or comprise two distinct sequences in , i.e., a chemical dichotomy, consisting of a high- and low- sequence located at around and , respectively. In the inner regions ( kpc), simulations Au 16, Au 23, Au 24 and Au 27 show a clear dichotomy, whereas the two sequences in Au 6 and Au 21 are connected to each other, resulting in a less clear dichotomy. In the outer regions ( kpc), only simulation Au 23 shows a dichotomy with a clear gap between the high- and low- sequences. In the other simulations, the high- disc does not extend farther than kpc, therefore the outer disc houses only the low- sequence. In general, the high- sequence is more radially compact than the low- disc, in agreement with what is observed in the Milky Way (e.g. Bensby et al., 2011; Hayden et al., 2015). We verified that these distributions are unchanged for in-situ stars only, therefore ex-situ material that may be accreted into a disc configuration (Gómez et al., 2017) is not a dominant mechanism for chemical dichotomy formation.
3.1 Pathways to a chemical dichotomy
In this section, we show that all the simulations have a strong high- star formation phase in the inner region followed by a more quiescent low- disc growth phase. Our galaxies show a variety of intensity, duration and size of the first star formation phase that together determine the strength of the dichotomy in the inner region. The simulated galaxies also show different histories of the low- disc growth. The radial extent of the high- disc relative to that of the initial low- disc determines the strength of the dichotomy in the outer region ( kpc), which indicates a dependence on the disc growth history. Hence, there are two pathways in which a clear dichotomy can be created: one which applies in the inner region ( kpc), and the other applies to the outer region ( kpc).
3.1.1 Centralised starburst pathway: inner disc dichotomy
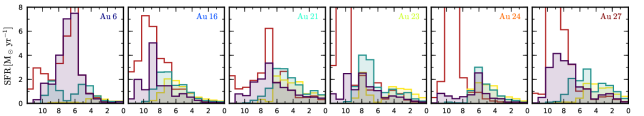
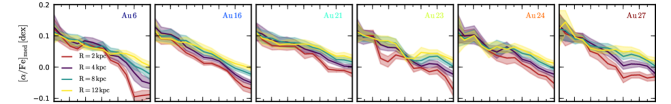
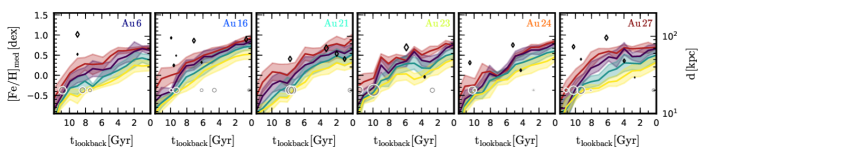
We show in the top-row of Fig. 2 the star formation histories (SFHs) in four radial regions222Note that the SFH is measured from the star formation rate of all gas cells within the given radial range at a given time, and not inferred from stellar ages at present day., for all simulations, using time-bins of 1 Gyr width. We note that simulations Au 16, Au 23, Au 24 and Au 27 have strong bursts of star formation in their inner regions ( kpc in Au 23 and Au 24 and kpc in Au 16 and Au 27) at Gyr. This star formation lasts for approximately 2 Gyr, after which time the SFR drops to a low level. The middle- and bottom-rows of Fig. 2 show the evolution of the median and root mean square of the gas and distributions, respectively, at the radii corresponding to those of the SFHs. In addition, the lower panels of Fig. 2 indicate the times of gas-rich mergers (listed in Table. 1) and flybys for each simulation.
We note that the short periods of intense star formation in these simulations are caused by gas-rich major mergers at Gyr, which produce stars from gas that maintains a roughly constant value of dex that populate the high- sequence. As SNeIa enrichment becomes important Gyr later, the gas rapidly transitions to lower values of dex and higher as the burst ends, which becomes star-forming material for the low- sequence that builds up during the subsequent period of lower SFR. Owing to this rapid transition and relatively low level of star formation, the transition region is populated with relatively few stars, therefore the subsequent star formation that follows from low- gas after the transition provides the over-density at lower (higher) ()333This is naturally expected in one zone models and the same scenario is demonstrated in the inner region of the chemical evolution model of Schönrich & Binney (2009). Note that in this process, the low- sequence starts from left-over gas of the high- sequence. Hence, unless there is massive inflow of low- gas (which does not occur in the inner regions in our simulations), the low- sequence has higher than the high- sequence.. This scenario is clearest in the inner regions for Au 16 and Au 23, in which the gas remains at dex for about 2 Gyr (after the concentration of high- stars formed from the initial rapid star formation), during which time star formation builds a concentration of low- stars. We note that in simulations Au 6, Au 21 and Au 27, the SFH in the inner regions is weaker at early times - which produces fewer high- stars, and more prolonged than the intense burst in Au 16 and Au 23. This leads to a significant amount of stars formed from gas that moves from high- to low- and high-. As a result, the transition region between the two sequences is populated such that the two sequences join at the same value, and no clear dichotomy can be discerned.
3.1.2 Shrinking disc pathway: outer disc dichotomy
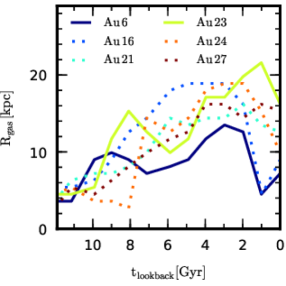
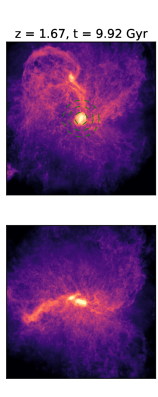
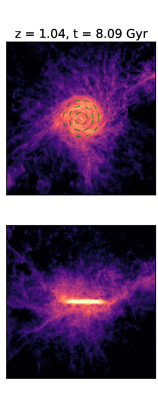
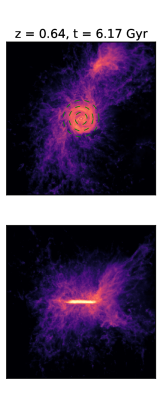
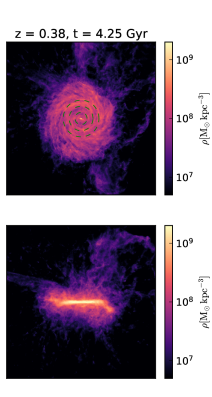
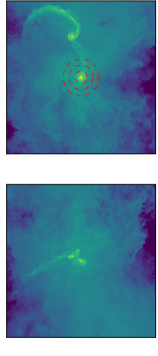
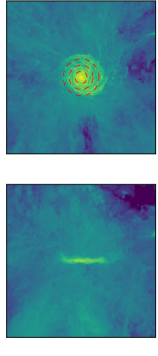
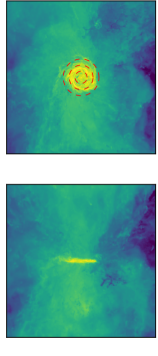
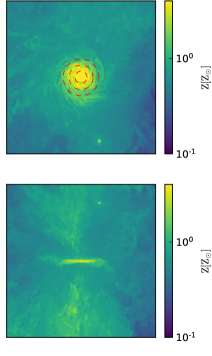
In the outer region ( kpc), only Au 23 shows a clear dichotomy in Fig. 1. This dichotomy was created from a different pathway to that of the inner region. The SFH at kpc reveals two peaks of SF: the first peak occurs at Gyr; the second at Gyr. Between these peaks the SFR drops nearly to zero, during which time the of the gas rapidly decreases from dex to dex. The dearth in the SFH at Gyr is caused by a temporary reduction in the size of the gas disc immediately after it grew to kpc at Gyr, which created the high- disc stars. Fig. 3 shows the evolution of the gas disc ‘edge’, defined to be the radius at which the gas surface density falls below . We note that this value is approximately the threshold value beyond which the gas in our simulations is star-forming: the star formation model of Springel & Hernquist (2003) is calibrated to the relation given by Kennicutt (1989) such that star formation rates are very low for surface densities below 10 . Furthermore, the HI gas surface density radial profiles of our simulations (presented in Marinacci et al., 2017) drop steeply after reaching a surface density of around , which can be considered the edge of the star-forming gas disc. It is clear from Fig. 3 that the gas disc grew from kpc at Gyr to kpc at Gyr, then decreased in size to kpc at Gyr, before resuming growth and reaching kpc again at Gyr. This evolution is also visualised in the top panels of Fig. 4.
The shrinking444We stress that the term ‘shrinking’ refers to the decrease in size of the gas disc only, and does not imply the bulk inward motion of gas. of the gas disc allows a halt in SF at kpc while SNeIa enrich the gas at this radius to lower before SF continues when the gas disc grows again to this radius. In this particular case, the gas decreases before the second peak in SF, which allows the low- sequence to begin at lower metallicity than the end of the high- sequence, thus forming a bimodal distribution in at dex. This is in stark contrast to the dichotomy pathway in the inner region, in which the low- sequence always starts at higher than the high- sequence, i.e. there is no bimodality in for any . A similar SFH is observed for Au 6 at kpc. However, as mentioned above, in Au 6 the initial star formation phase is prolonged, and the high- sequence is merged to the low- sequence. Hence, the dichotomy is far less clear.
Fig. 3 shows that the other simulations exhibit a more continuous inside-out growth of their discs, which is also seen in the SFHs that move progressively outward with time in the top-row of Fig. 2. This has two implications: i) the early star formation phase is concentrated only in the inner regions ( kpc), which does not produce a population of high- in the outer region555Unless radial migration brings them from the central region to the outer region. However, radial migration does not appear to play an important role in forming the dichotomy, which we discuss in Section. 4.. As a result, simulations Au 21, Au 24 and Au 27 show only the low- sequence in the outer disc. ii) There is no disc shrinking at any time. This means that even if the high- sequence extends to kpc, as in Au 16 (see Fig. 1), there is not a significant decrease in star formation or lowering of the gas metallicity to create a clear dichotomy extending to a lower , as in Au 23. Therefore, to have a chemical dichotomy in the outer region, the high- sequence must be built quickly ( Gyr) from the central regions up to kpc during a period of early, intense star formation. This is then followed by a clear reduction of star formation rate (caused by a shrinking of the gas disc) that drives a quick decrease in , with subsequent gas accretion that forms the low- disc in an inside-out fashion.
3.2 Gas disc evolution
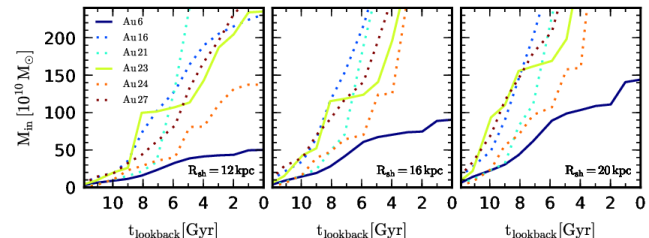
As discussed above, the formation of the chemical dichotomy in the outer disc region appears to rely on the temporary shrinking of the gas disc while the gas evolves to a low- state. To study the reasons behind the gas disc shrinking, we show in Fig. 5 the cumulative gas inflow mass for three spherical shells of 4 kpc width, centred on radii of 12 kpc, 16 kpc and 20 kpc, for all simulations. For the simulations in which the gas disc shrinks (Au 6 and Au 23), significantly low gas inflow rates are seen at all of these radii at -9 Gyr, whereas the gas inflow rates either increase or maintain a steady value for the other simulations. This indicates that, for Au 6 and Au 23, the gas accretion at these times is not sufficient to replenish the gas consumed by star formation around the disc edges, which leads to the shrinking of the gas disc until Gyr when gas accretion becomes significant enough to grow the disc. We note that the stellar disc does not shrink with the gas disc, which indicates that tidal forces from satellites are not a driver of gas disc shrinking.
At late times, the hot gas phase is already in place and the halo does not allow gas filaments to penetrate into the central regions (Kereš et al., 2005; Dekel & Birnboim, 2006; Brooks et al., 2009; Fernández et al., 2012). An important source of cold gas accretion at this late epoch appears to be minor gas-rich mergers that are able to penetrate the halo and reach the central galaxies. On their way to the centre, their gas is stripped and coalesces around the edge of the disc, allowing it to grow. This is shown in Fig. 4 for Au 23, in which the gas disc does not grow again until a satellite galaxy penetrates into the inner galaxy. Moreover, the gas accreted from the minor merger is more metal poor than that of the central galaxy (see lower panels of Fig. 4 and Table. 1), which leads to the temporary dip in gas metallicity around the disc edge as discussed in the previous sub-section and shown in the lower panels of Fig. 2 (see also Bustamante et al. in prep). This helps to create low- stars at lower than the highest stars of the high- sequence. On the other hand, the lower panels of Fig. 2 show that haloes Au 16 and Au 21, which undergo continuous inside-out growth, experience regular interactions with gas-rich satellites (we have verified this from the simulation snapshots). The galaxies in these simulations therefore have a constant supply of cold gas out of which the discs grow at all times. We note that generally, but especially in the simulations with smooth inside-out growth, the gas metallicity continues to increase with time even at late times. This is responsible for the banana shape in the low- sequence. In the Milky Way, the age-metallicity relation is expected to be flat, therefore the low- sequence is likely kept at similar at a given radius (see Fig. 4 of Hayden et al., 2015). The reason for the increasing gas metallicity in the simulations is unclear, and we leave this issue and its implications to a detailed future study.
4 Conclusions and Discussion
In this study, we have used a set of high resolution cosmological zoom simulations to analyse the evolution of the stars at different spatial regions in chemical space, with particular focus on the formation of two distinct sequences in –, a chemical-dichotomy. Our main results are as follows:
-
•
There are two pathways to forming a clear chemical dichotomy: an early centralised starburst mechanism that is relevant for the inner disc; and a shrinking disc mechanism that is relevant for the outer disc.
-
•
For the centralised starburst pathway: an early, gas-rich merger induced starburst creates stars at high- and high , which is followed by a low level of star formation that forms the low- sequence. The rapid transition from high- to low- ensures a depopulated region between the two sequences.
-
•
For the shrinking disc pathway: at later times ( Gyr), the gas disc shrinks after the high- sequence forms, causing a decrease in SFR while the gas transitions to a low- state. Subsequent low-metallicity gas accretion grows the low- sequence in an inside-out fashion from lower than the end of the high- sequence.
-
•
The main source of gas at Gyr is from gas-rich, minor mergers that penetrate the hot-mode dominated halo and deliver stripped gas to the main galaxy.
-
•
In general, the gas phase metallicity continuously increases with time at a given radius, even at late times.
Our study, as well as many previous studies of numerical simulations, is consistent with what is suggested in Brook et al. (2004), who showed that a violent, gas-rich merger can produce a thick and compact disc in the earlier epoch, followed by a more quiescent gas accretion and inside-out disc growth (Brook et al., 2005, 2006). However, none of the previous works clearly explained the origin of the chemical dichotomy seen in their simulations. Owing to our very high-resolution cosmological simulations, we have finally identified the origin of this dichotomy, and have clearly demonstrated that there are two different pathways to the dichotomy that operate in different regions of the disc.
We note that in the shrinking disc pathway, the high- sequence forms inside-out (see also Kawata et al., 2018) up to radii of kpc within Gyr. This is contrary to the notion that the chemical thick disc formed with a spatially homogeneous star formation history put forward by some chemical evolution models (Snaith et al., 2015). With regard to two-infall models, however, the temporary drop in gas accretion is remarkably reminiscent of the two distinct periods of gas infall discussed in Chiappini et al. (1997) and Chiappini et al. (2001). However, the secondary gas accretion in the simulation is not primordial, and the timescale of the chemical thick disc formation is not as short as found in that work (although the timescales are comparably short given the lack of thick disc metallicity constraints 20 years ago).
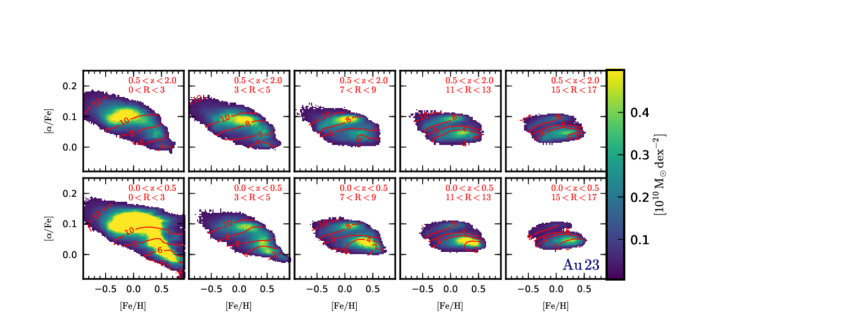
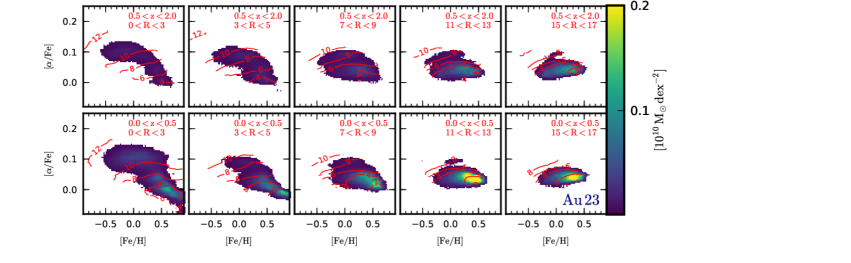
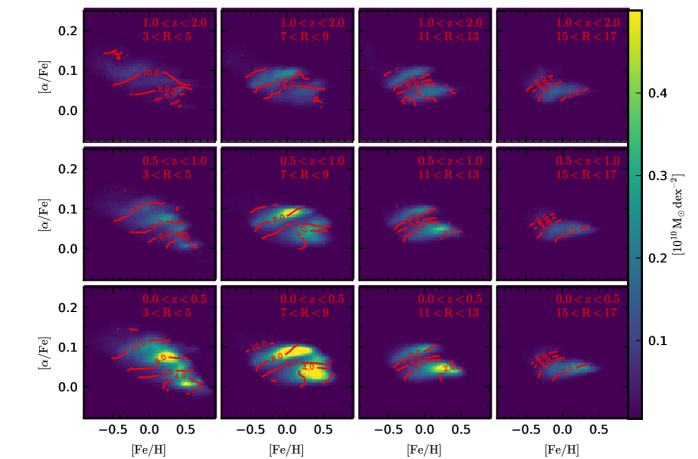
The inside-out formation of the low- sequence that occurs after the shrinking of the large high- star-forming gas disc appears to account for the clear dichotomy in the region kpc, at which the two sequences significantly overlap in (a bimodality in ). In addition, the outer regions are heavily dominated by the low- sequence. This is shown explicitly in Fig. 6 for the clearest case of Au 23, in which we show the chemical abundance plane at a series of radii and heights with a common normalisation, for all star particles (top panels) and for the APOGEE Red Clump age-dependent selection function (see equation (11) of Bovy et al., 2016a) (bottom panels). For all star particles, we see that for kpc in the plane, the distinct low- and high- sequences exist in equal parts, with the former increasing in dominance over the latter with increasing radii. The low- sequence fades with increasing distance above the plane in the inner radii, but becomes more prominent at larger radii to dominate over the high- sequence which fades at larger radii for all heights. It is interesting to note that the application of the age-dependent selection function (bottom panels of Fig. 6), the high- population is much less dominant than in the top panels of Fig. 6: it is visible only in the innermost regions, and almost not at all visible beyond kpc. These trends are consistent with two distinct chemical components that qualitatively reproduce the vertically thick, radially compact high- disc and the vertical thin, flaring and radially extended low- disc as claimed to be seen in observations (e.g. Bensby et al., 2011; Rahimi et al., 2014; Martig et al., 2016). We note also that the low- sequence follows a negative radial metallicity gradient (which is present in the gas at all times, see Fig. 2), and is consistent with the ‘donut’ distribution of MAPs noted in Bovy et al. (2016b).
Comparison between Fig. 6 and what is observed in the Milky Way (e.g. Nidever et al., 2014; Hayden et al., 2015) is interesting666We note that Hayden et al. (2015) studied the distribution of APOGEE giant stars - not only the Red Clump sample. Therefore, our comparison with the results of this study should be regarded in a qualitative sense only.. The APOGEE data shows that, in the inner disc ( kpc), the low- sequence is not extended to low , but instead the low- sequence is more metal rich than (or an extension of) the high- sequence, rather similar to our centralised starburst pathway. Around the solar radius of kpc, however, the two sequences overlap in : the low- sequence extends to lower and makes a clear gap in . This is similar to what our shrinking disc pathway produced in Au 23 in the outer region. Interestingly, Robin et al. (2014) suggest the shrinking of a younger thick disc from their stellar population analysis of SDSS and 2MASS data, which may indicate that their young thick disc corresponds to our shrunk initial low- disc. Hence, we expect that both of these pathways occurred in the Milky Way.
It is interesting to note that the features in chemical abundance space for the star particles are in place at birth (see Fig. 7), which implies that this formation scenario is consistent with a flared star-forming gas disc (increasing scale height with radius) that is argued to be required to produce the observed negative vertical metallicity gradients of coeval populations (Xiang et al., 2015; Kawata et al., 2017; Ciucă et al., 2017). Another implication is that processes such as radial migration are not required in order to form the chemical dichotomy if the high- disc is as large as in Au 23, but rather influence the detailed structure of the features through radial mixing (Grand et al., 2015; Loebman et al., 2016; Grand et al., 2016b) and heating (Hayden et al., 2015). These effects are beyond the scope of this paper.
Further implications for the Milky Way are the importance of the gas accretion history at late times, which seems to be dominated by gas-rich minor mergers in these simulations. This may indicate that, if the dichotomy observed in the Milky Way was formed by processes similar to the shrinking gas disc scenario discussed in this study, the merger history of the Galaxy ought to have been quiet during the period just after the early gas rich merger and when the hot gas halo has grown enough such that hot-mode accretion becomes dominant. This would allow the gas inflow to slow-down before the disc grew to its present size.
We stress that Au 23 and the other simulations in this study are not tailored to exactly match the properties of the Milky Way, which is reflected in chemical structure of the simulated discs: the precise loci and shapes of the two sequences in chemical space are different from that in the Milky Way. We note also that the mean stellar iso-age contours in the – plane tend to be quite flat, i.e., they do not have a negative slope as observed in APOGEE data (see Ness et al., 2016). The shape of these features are probably related to the interplay between SNII and SNIa, controlled mainly by the delay time distribution and normalisation of SNeIa in our simulations (explored in the Aquarius simulations in Marinacci et al., 2014b), but also by the initial mass function (see Gutcke & Springel, 2017, for a study of the effects of variable IMFs on the – plane). A detailed analysis of the stellar distribution in abundance and age space has the potential to place tight quantitative constraints on the assembly history of the Milky Way, and will be the subject of future studies.
The enrichment history seen in the simulations contrasts with the expectations of many analytic models: the simulations show that the gas metallicity continuously increases with time, whereas analytic models expect that, in the Milky Way, the gas metallicity reaches a constant value at all radii on timescales that increase with radius. This may indicate that the expected equilibrium between metal enrichment from stellar feedback and dilution of the ISM from gas infall is not reached in the simulations. If this is not the case for the Milky Way, this will cause differences between our simulations and observations in the detailed chemical structure and in particular the locus of the low- sequence in chemical abundance space. We will investigate the cause of this result in future studies.
Additional dependencies include the merger history, the rate of inside-out formation and the amount of radial migration, the last of which has further dependencies on the bar and spiral structure of the disc (e.g. Grand et al., 2012a, b; Monari et al., 2016) and therefore the dynamical heating history, which includes also external effects. Given this complexity, and that the simulations presented in this study do not match the Milky Way in every aspect, we do not expect the simulations to match the detailed structure of the Milky Way, but rather provide a cosmologically motivated insight into the mechanisms that may shape certain features of our Galaxy, in this case, its chemical structure. In the future, detailed analysis of simulations with more constrained initial conditions aimed at reproducing the Local Group environment will bring cosmological simulations more inline with the Galaxy, and provide important clues to its formation.
acknowledgements
We thank the referee, as well as Cristina Chiappini and Ivan Minchev, for useful comments that helped improve the manuscript. RG and DK acknowledge discussions held at the IAU symposium 334 ‘Rediscovering our Galaxy’, which helped encourage this study. RG and VS acknowledge support by the DFG Research Centre SFB-881 ‘The Milky Way System’ through project A1. DK acknowledges the support of the UK’s Science & Technology Facilities Council (STFC Grants ST/N000811/1). This work has also been supported by the European Research Council under ERC-StG grant EXAGAL- 308037. Part of the simulations of this paper used the SuperMUC system at the Leibniz Computing Centre, Garching, under the project PR85JE of the Gauss Centre for Supercomputing. This work used the DiRAC Data Centric system at Durham University, operated by the Institute for Computational Cosmology on behalf of the STFC DiRAC HPC Facility ‘www.dirac.ac.uk’. This equipment was funded by BIS National E-infrastructure capital grant ST/K00042X/1, STFC capital grant ST/H008519/1, and STFC DiRAC Operations grant ST/K003267/1 and Durham University. DiRAC is part of the National E-Infrastructure.
References
- Abadi et al. (2003) Abadi M. G., Navarro J. F., Steinmetz M., Eke V. R., 2003, ApJ, 597, 21
- Allende Prieto et al. (2016) Allende Prieto C., Kawata D., Cropper M., 2016, A&A, 596, A98
- Anders et al. (2014) Anders F., et al., 2014, A&A, 564, A115
- Anders et al. (2017) Anders F., et al., 2017, A&A, 597, A30
- Bensby et al. (2011) Bensby T., Alves-Brito A., Oey M. S., Yong D., Meléndez J., 2011, ApJ, 735, L46
- Bird et al. (2013) Bird J. C., Kazantzidis S., Weinberg D. H., Guedes J., Callegari S., Mayer L., Madau P., 2013, ApJ, 773, 43
- Bournaud et al. (2009) Bournaud F., Elmegreen B. G., Martig M., 2009, ApJ, 707, L1
- Bovy et al. (2012) Bovy J., et al., 2012, ApJ, 759, 131
- Bovy et al. (2016a) Bovy J., et al., 2016a, ApJ, 790, 131
- Bovy et al. (2016b) Bovy J., Rix H.-W., Schlafly E. F., Nidever D. L., Holtzman J. A., Shetrone M., Beers T. C., 2016b, ApJ, 823, 30
- Brook et al. (2004) Brook C. B., Kawata D., Gibson B. K., Freeman K. C., 2004, ApJ, 612, 894
- Brook et al. (2005) Brook C. B., Gibson B. K., Martel H., Kawata D., 2005, ApJ, 630, 298
- Brook et al. (2006) Brook C. B., Kawata D., Martel H., Gibson B. K., Bailin J., 2006, ApJ, 639, 126
- Brook et al. (2007) Brook C., Richard S., Kawata D., Martel H., Gibson B. K., 2007, ApJ, 658, 60
- Brook et al. (2012) Brook C. B., et al., 2012, MNRAS, 426, 690
- Brooks et al. (2009) Brooks A. M., Governato F., Quinn T., Brook C. B., Wadsley J., 2009, ApJ, 694, 396
- Buck et al. (2017) Buck T., Macciò A. V., Obreja A., Dutton A. A., Domínguez-Tenreiro R., Granato G. L., 2017, MNRAS, 468, 3628
- Casagrande et al. (2011) Casagrande L., Schönrich R., Asplund M., Cassisi S., Ramírez I., Meléndez J., Bensby T., Feltzing S., 2011, A&A, 530, A138
- Chabrier (2003) Chabrier G., 2003, PASP, 115, 763
- Chiappini et al. (1997) Chiappini C., Matteucci F., Gratton R., 1997, ApJ, 477, 765
- Chiappini et al. (2001) Chiappini C., Matteucci F., Romano D., 2001, ApJ, 554, 1044
- Ciucă et al. (2017) Ciucă I., Kawata D., Lin J., Casagrande L., Seabroke G., Cropper M., 2017, preprint, (arXiv:1706.05005)
- Combes (2017) Combes F., 2017, preprint, (arXiv:1707.07602)
- Dekel & Birnboim (2006) Dekel A., Birnboim Y., 2006, MNRAS, 368, 2
- Domínguez-Tenreiro et al. (2017) Domínguez-Tenreiro R., Obreja A., Brook C. B., Martínez-Serrano F. J., Serna A., 2017, ApJ, 846, 72
- Fernández et al. (2012) Fernández X., Joung M. R., Putman M. E., 2012, ApJ, 749, 181
- Fuhrmann (1998) Fuhrmann K., 1998, A&A, 338, 161
- Gilmore & Reid (1983) Gilmore G., Reid N., 1983, MNRAS, 202, 1025
- Gómez et al. (2017) Gómez F. A., et al., 2017, MNRAS, 472, 3722
- Grand et al. (2012a) Grand R. J. J., Kawata D., Cropper M., 2012a, MNRAS, 421, 1529
- Grand et al. (2012b) Grand R. J. J., Kawata D., Cropper M., 2012b, MNRAS, 426, 167
- Grand et al. (2015) Grand R. J. J., Kawata D., Cropper M., 2015, MNRAS, 447, 4018
- Grand et al. (2016a) Grand R. J. J., Springel V., Gómez F. A., Marinacci F., Pakmor R., Campbell D. J. R., Jenkins A., 2016a, MNRAS, 459, 199
- Grand et al. (2016b) Grand R. J. J., et al., 2016b, MNRAS, 460, L94
- Grand et al. (2017) Grand R. J. J., et al., 2017, MNRAS, 467, 179
- Gratton et al. (1996) Gratton R., Carretta E., Matteucci F., Sneden C., 1996, in Morrison H. L., Sarajedini A., eds, Astronomical Society of the Pacific Conference Series Vol. 92, Formation of the Galactic Halo…Inside and Out. p. 307
- Grisoni et al. (2017) Grisoni V., Spitoni E., Matteucci F., Recio-Blanco A., de Laverny P., Hayden M., Mikolaitis Ŝ., Worley C. C., 2017, MNRAS, 472, 3637
- Gutcke & Springel (2017) Gutcke T. A., Springel V., 2017, preprint, (arXiv:1710.04222)
- Hayden et al. (2015) Hayden M. R., et al., 2015, ApJ, 808, 132
- Haywood et al. (2015) Haywood M., Di Matteo P., Snaith O., Lehnert M. D., 2015, A&A, 579, A5
- Kawata et al. (2017) Kawata D., Grand R. J. J., Gibson B. K., Casagrande L., Hunt J. A. S., Brook C. B., 2017, MNRAS, 464, 702
- Kawata et al. (2018) Kawata D., et al., 2018, MNRAS, 473, 867
- Kennicutt (1989) Kennicutt Jr. R. C., 1989, ApJ, 344, 685
- Kereš et al. (2005) Kereš D., Katz N., Weinberg D. H., Davé R., 2005, MNRAS, 363, 2
- Kordopatis et al. (2017) Kordopatis G., Wyse R. F. G., Chiappini C., Minchev I., Anders F., Santiago B., 2017, MNRAS, 467, 469
- Kubryk et al. (2013) Kubryk M., Prantzos N., Athanassoula E., 2013, MNRAS, 436, 1479
- Loebman et al. (2011) Loebman S. R., Roškar R., Debattista V. P., Ivezić Ž., Quinn T. R., Wadsley J., 2011, ApJ, 737, 8
- Loebman et al. (2016) Loebman S. R., Debattista V. P., Nidever D. L., Hayden M. R., Holtzman J. A., Clarke A. J., Roškar R., Valluri M., 2016, ApJ, 818, L6
- Ma et al. (2017) Ma X., Hopkins P. F., Wetzel A. R., Kirby E. N., Anglés-Alcázar D., Faucher-Giguère C.-A., Kereš D., Quataert E., 2017, MNRAS, 467, 2430
- Mackereth et al. (2017) Mackereth J. T., et al., 2017, MNRAS, 471, 3057
- Marinacci et al. (2014a) Marinacci F., Pakmor R., Springel V., 2014a, MNRAS, 437, 1750
- Marinacci et al. (2014b) Marinacci F., Pakmor R., Springel V., Simpson C. M., 2014b, MNRAS, 442, 3745
- Marinacci et al. (2017) Marinacci F., Grand R. J. J., Pakmor R., Springel V., Gómez F. A., Frenk C. S., White S. D. M., 2017, MNRAS, 466, 3859
- Martig et al. (2016) Martig M., Minchev I., Ness M., Fouesneau M., Rix H.-W., 2016, ApJ, 831, 139
- Minchev et al. (2012) Minchev I., Famaey B., Quillen A. C., Dehnen W., Martig M., Siebert A., 2012, A&A, 548, A127
- Minchev et al. (2013) Minchev I., Chiappini C., Martig M., 2013, A&A, 558, A9
- Minchev et al. (2014) Minchev I., Chiappini C., Martig M., 2014, A&A, 572, A92
- Minchev et al. (2017) Minchev I., Steinmetz M., Chiappini C., Martig M., Anders F., Matijevic G., de Jong R. S., 2017, ApJ, 834, 27
- Miranda et al. (2016) Miranda M. S., et al., 2016, A&A, 587, A10
- Monari et al. (2016) Monari G., Famaey B., Siebert A., Grand R. J. J., Kawata D., Boily C., 2016, MNRAS, 461, 3835
- Navarro et al. (2017) Navarro J. F., et al., 2017, preprint, (arXiv:1709.01040)
- Ness et al. (2016) Ness M., Hogg D. W., Rix H.-W., Martig M., Pinsonneault M. H., Ho A. Y. Q., 2016, ApJ, 823, 114
- Nidever et al. (2014) Nidever D. L., et al., 2014, ApJ, 796, 38
- Noguchi (1998) Noguchi M., 1998, Nature, 392, 253
- Obreja et al. (2016) Obreja A., Stinson G. S., Dutton A. A., Macciò A. V., Wang L., Kang X., 2016, MNRAS, 459, 467
- Planck Collaboration et al. (2014) Planck Collaboration et al., 2014, A&A, 571, A16
- Portinari et al. (1998) Portinari L., Chiosi C., Bressan A., 1998, A&A, 334, 505
- Quinn et al. (1993) Quinn P. J., Hernquist L., Fullagar D. P., 1993, ApJ, 403, 74
- Rahimi et al. (2011) Rahimi A., Kawata D., Allende Prieto C., Brook C. B., Gibson B. K., Kiessling A., 2011, MNRAS, 415, 1469
- Rahimi et al. (2014) Rahimi A., Carrell K., Kawata D., 2014, Research in Astronomy and Astrophysics, 14, 1406
- Reddy et al. (2003) Reddy B. E., Tomkin J., Lambert D. L., Allende Prieto C., 2003, MNRAS, 340, 304
- Richard et al. (2010) Richard S., Brook C. B., Martel H., Kawata D., Gibson B. K., Sanchez-Blazquez P., 2010, MNRAS, 402, 1489
- Robin et al. (2014) Robin A. C., Reylé C., Fliri J., Czekaj M., Robert C. P., Martins A. M. M., 2014, A&A, 569, A13
- Roškar et al. (2013) Roškar R., Debattista V. P., Loebman S. R., 2013, MNRAS, 433, 976
- Scannapieco et al. (2011) Scannapieco C., White S. D. M., Springel V., Tissera P. B., 2011, MNRAS, 417, 154
- Schönrich & Binney (2009) Schönrich R., Binney J., 2009, MNRAS, 399, 1145
- Schönrich & McMillan (2017) Schönrich R., McMillan P. J., 2017, MNRAS, 467, 1154
- Snaith et al. (2015) Snaith O., Haywood M., Di Matteo P., Lehnert M. D., Combes F., Katz D., Gómez A., 2015, A&A, 578, A87
- Springel (2010) Springel V., 2010, MNRAS, 401, 791
- Springel & Hernquist (2003) Springel V., Hernquist L., 2003, MNRAS, 339, 289
- Stinson et al. (2013) Stinson G. S., et al., 2013, MNRAS, 436, 625
- Trevisan et al. (2011) Trevisan M., Barbuy B., Eriksson K., Gustafsson B., Grenon M., Pompéia L., 2011, A&A, 535, A42
- Vera-Ciro et al. (2014) Vera-Ciro C., D’Onghia E., Navarro J., Abadi M., 2014, ApJ, 794, 173
- Villalobos & Helmi (2008) Villalobos Á., Helmi A., 2008, MNRAS, 391, 1806
- Vogelsberger et al. (2013) Vogelsberger M., Genel S., Sijacki D., Torrey P., Springel V., Hernquist L., 2013, MNRAS, 436, 3031
- Xiang et al. (2015) Xiang M.-S., et al., 2015, Research in Astronomy and Astrophysics, 15, 1209