NGC 6535: the lowest mass Milky Way globular cluster with a Na-O anti-correlation?††thanks: Based on observations collected at ESO telescopes under programme 093.B-0583,††thanks: Table 2 is only available in electronic form at the CDS via anonymous ftp to cdsarc.u-strasbg.fr (130.79.128.5) or via http://cdsweb.u-strasbg.fr/cgi-bin/qcat?J/A+A/???/???
To understand globular clusters (GCs) we need to comprehend how their formation process was able to produce their abundance distribution of light elements. In particular, we seek to figure out which stars imprinted the peculiar chemical signature of GCs. One of the best ways is to study the light-element anti-correlations in a large sample of GCs that are analysed homogeneously. As part of our spectroscopic survey of GCs with FLAMES, we present here the results of our study of about 30 red giant member stars in the low-mass, low-metallicity Milky Way cluster NGC 6535. We measured the metallicity (finding [Fe/H]=, rms=0.04 dex in our homogeneous scale) and other elements of the cluster and, in particular, we concentrate here on O and Na abundances. These elements define the normal Na-O anti-correlation of classical GCs, making NGC 6535 perhaps the lowest mass cluster with a confirmed presence of multiple populations. We updated the census of Galactic and extragalactic GCs for which a statement on the presence or absence of multiple populations can be made on the basis of high-resolution spectroscopy preferentially, or photometry and low-resolution spectroscopy otherwise; we also discuss the importance of mass and age of the clusters as factors for multiple populations.
Key Words.:
Stars: abundances – Stars: atmospheres – Stars: Population II – Galaxy: globular clusters – Galaxy: globular clusters: individual: NGC 6535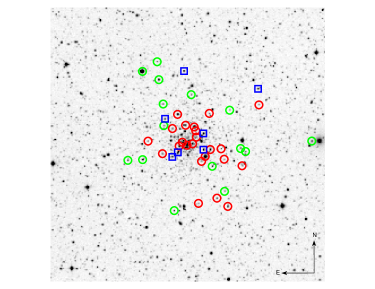
1 Introduction
Once considered as a good example of simple stellar populations (SSP), Galactic globular clusters (GCs) are currently thought to have formed in a complex chain of events, which left a fossil record in their chemical composition, in particular in their light elements He, C, N, O, Mg, Al, and Na (see e.g. the review by Gratton et al., 2012). Spectroscopically, almost all Milky Way (MW) GCs studied host multiple stellar populations that can be traced by the anti-correlated variations of light elements C and N (e.g. Kayser et al., 2008; Smolinsky et al., 2011), O and Na, and Mg and Al (see e.g. Carretta et al. 2009a, b; Bragaglia et al. 2015; Carretta et al. 2017 and references therein for our FLAMES survey of more than 25 MW GCs). Photometrically, light element variations manifest in colour-magnitude diagrams (CMD) as sequence broadening and splitting (e.g. Carretta et al., 2011b; Milone et al., 2012a; Monelli et al., 2013; Lee, 2015; Piotto et al., 2015, and references therein) which are particularly evident when appropriate combinations of UV filters (tracing CN, OH, NH bands) are used.
In normal, massive GCs at least two populations coexist. One has a composition that is indistinguishable from field stars of similar metallicity and is believed to be the long-lived remnant of the first generation (FG) formed in the cluster. The other, with a modified composition, is the second generation (SG), polluted by the most massive stars of the FG with ejecta from H burning at high temperature (Denisenkov & Denisenkova, 1989; Langer et al., 1993). Unfortunately, the question of which FG stars produced the gas of modified composition is still unsettled (see e.g. Ventura et al. (2001); Decressin et al. (2007); De Mink et al. (2009); Maccarone & Zureck (2012); Denissenkov & Hartwick (2014), and Bastian et al. (2015)). Hence we still do not fully understand how GCs, and their multiple populations, (MPs) formed. To attack the problem, we need to combine spectroscopic, photometric, and astrometric observations (yielding abundances, kinematics, and their spatial distribution in GCs) with theoretical modelling (stellar evolution, formation, and chemo-dynamical evolution of clusters).
On the observational front, it is crucial to study clusters covering the widest range of properties, that is mass, metallicity, age, structural parameters, and environment. While almost all MW GCs studied thus far show MPs, there are a few exceptions, such as Ruprecht 106 (Villanova et al., 2013), Palomar 12 (Cohen, 2004), and Terzan 7 (Sbordone et al., 2005). Interestingly, the last two are also associated with the disrupting Sagittarius dwarf galaxy (Sgr dSph), the closest extragalactic environment. As of today, MPs have been detected in several extragalactic GCs. High-resolution spectroscopy has been used for old, massive clusters of the Magellanic Clouds (MCs); see Johnson et al. (2006); Mucciarelli et al. (2009) for the Large Magellanic Cloud (LMC), and Dalessandro et al. (2016) for the Small Magellanic Cloud (SMC), or the Fornax dwarf spheroidal (Fnx dSph; Letarte et al., 2006). Low-resolution spectroscopy and photometry have been employed to study younger clusters in the MCs or the Fnx dSph; see e.g. Hollyhead et al. (2017); Niederhofer et al. (2017b); Larsen et al. (2014) discussed in Sect. 7. While these clusters can be used to explore a possible dependence on age and environment of the MPs, these clusters are comparable in mass to the bulk of the MW GCs and do not allow us to evaluate the impact of the environment on the low-mass end of the GC mass distribution.
We found that, apparently, there is an observed minimum cluster mass for appearance of the Na-O anti-correlation, i.e. of SG (see Carretta et al. 2010a, Fig. 1 in Bragaglia et al. 2012, and Sect. 7 for further discussion). This is an important constraint for GC formation mechanisms because it indicates the mass at which we expect that a GC is able to retain part of the ejecta of the FG. It is important to understand if this limit is real or due to the small statistics, since only a handful of low-mass clusters have been studied and only a few stars in each were spectroscopically observed. The problem of statistics can be bypassed using low-resolution spectroscopy and photometry, which can reach fainter magnitudes and larger samples than high-resolution spectroscopy; however, this means that only C and N— plus O with Hubble Space Telescope (HST) far-UV filters, and possibly He— can be studied. To increase the sample studied with high-resolution spectroscopy, we obtained data for a few old and massive open clusters (OCs; i.e. Berkeley 39, NGC 6791: Bragaglia et al., 2012, 2014) and low-mass GCs, which are also connected with the Sgr dSph (Terzan 8, NGC 6139, and NGC 5634; Carretta et al., 2014a; Bragaglia et al., 2015; Carretta et al., 2017).
We concentrate here on the low-mass GC NGC 6535, which has (Harris, 1996, and 2010 web update). This would be the lowest present-day mass GC in which an Na-O anti-correlation is found, since the present record holder, Palomar 5, has , after shedding a good fraction of its mass, as witnessed by its tidal tails (e.g. Odenkirchen et al. 2001). In Section 2 we present literature information on the cluster, in Section 3 we describe the photometric data, spectroscopic observations, and derivation of atmospheric parameters. The abundance analysis is presented in Section 4 and a discussion on the light-element abundances is given in Section 5. Kinematics is discussed in Section 6 and the age and mass limits for the appearance of multiple populations in Section 7. A summary and conclusion are given in Section 8.
2 NGC 6535 in literature
NGC 6535 is a low-concentration, low-mass GC; its absolute visual magnitude, a proxy for present-day mass, is , the King-model concentration is , and the core radius and half-mass radius are , (Harris, 1996, 2010 web update). NGC 6535 is located towards the centre of the MW, at , , and suffers from severe field contamination (see Fig. 1). Notwithstanding its present small Galactocentric distance, the cluster is metal-poor (R kpc, [Fe/H]=-1.79; from Harris 1996) and is considered a halo GC. While there are several photometric papers in the literature, it has never been studied with high-resolution spectroscopy before.
After the first colour-magnitude diagram (CMD) obtained by Liller (1980), the cluster was studied by Anthony-Twarog & Twarog (1985) and Sarajedini (1994). Rosenberg et al. (1999); Rosenberg et al. (2000) used the ground-based CCD data of this and more than 30 other GCs to determine its age and found it coeval with the bulk of GCs. Marín-Franch et al. (2009), using data obtained within the Hubble Space Telescope ACS Treasury Program on GCs (Sarajedini et al., 2007), placed NGC 6535 among the young clusters. An old absolute age was instead derived by VandenBerg et al. (2013) once again using the ACS data and theoretical isochrones; these authors found a value of 12.75 Gyr, which, combined with its low metallicity, placed NGC 6535 among the halo, accreted clusters in the age-metallicity plot.
Testa et al. (2001) presented the photometric data we used in our selection of targets. They observed NGC 6535 with HST (Cycle 6, proposal 6625), using the Wide-Field Planetary Camera 2 (WFPC2), F555W, and F814W filters. These authors centred the cluster on the PC chip. Since the small field of view of the WPFC2 did not cover the entire cluster, they supplemented it with ground-based data (0.9m Dutch telescope, La Silla, Chile, program 59.E-0532) obtaining five fields in the and filters.
Using ACS Treasury Program data for GCs, Milone et al. (2014) studied the HBs and their relations with cluster parameters; referring to their Fig. 7, we would expect an interquartile range (IQR) [O/Na] that is larger than about 0.5 dex(see Sect. 5). NGC 6535 is also included in the HST UV Legacy survey (Piotto et al., 2015); referring to their Fig. 16, the cluster displays a normally split RGB (i.e. presence of MPs) and a general paucity of stars. This is confirmed by Milone et al. (2017) who found a fraction of first-generation stars of using a total sample of 62 RGB stars.
Leon et al. (2000) included NGC 6535 among the 20 Galactic GCs they investigated to find tidal tails; as for most of their sample, the cluster shows evidence of interactions and shocks with the Galactic plane/bulge in the form of tidal extensions aligned with the tidal field gradient. Halford & Zaritsky (2015) used the HST data described above and measured an unusually flat (i.e. bottom-light) present-day stellar mass function, which is at odds with the exceptionally high mass-to-light ratio based on dynamical mass calculations. This could be due to very strong external influence leading to mass stripping or to large amounts of dark remnants; however, they were unable to clearly pinpoint the cause. Finally, Askar et al. (2017) proposed that NGC 6535 has the kinematic and photometric characteristic of what they call a ’dark cluster’, i.e. a cluster in which the majority of the mass is presently locked in an intermediate black hole.
The spectroscopic material is much less abundant. Zinn & West (1984) used a low-resolution, integrated spectrum to measure a radial velocity (RV) of km s-1 and determine [Fe/H]= (). The same technique was used by Hesser et al. (1986) to obtain RV= km s-1. A very different value is reported by Pryor & Meylan (1993), who give an average RV of km s-1, based on unpublished MMT and CTIO echelle spectra. Rutledge et al. (1997a, b) observed the near-IR calcium triplet region in giant stars in 52 GCs (seven stars in NGC 6535); they found RV= km s-1 and derived the cluster metallicity as [Fe/H]= (on the Zinn & West 1984 scale) and (on the Carretta & Gratton 1997 scale). Finally, Martell et al. (2008), in an effort to study carbon depletion in giants of 11 GCs, took low-resolution spectra of two stars in NGC 6535 finding [C/Fe]= and respectively.
| Setup | UT Date | UTinit | exptime | airmass | seeing |
|---|---|---|---|---|---|
| (yyyy-mm-dd) | (hh:mm:ss) | (s) | (arcsec) | ||
| HR11 | 2014-07-01 | 07:03:25.899 | 3600 | 1.511 | 0.86 |
| HR11 | 2014-07-02 | 03:30:04.291 | 3600 | 1.111 | 1.09 |
| HR11 | 2014-07-25 | 04:27:17.459 | 3600 | 1.243 | 0.75 |
| HR11 | 2014-07-29 | 02:10:50.669 | 3600 | 1.098 | 0.61 |
| HR11 | 2014-08-01 | 04:05:18.439 | 3600 | 1.259 | 1.15 |
| HR11 | 2014-08-02 | 00:47:02.373 | 3600 | 1.162 | 1.30 |
| HR13 | 2014-08-02 | 03:00:05.225 | 3600 | 1.131 | 1.20 |
| HR13 | 2014-08-02 | 04:41:08.280 | 3600 | 1.418 | 1.15 |
| HR13 | 2014-08-03 | 01:11:16.019 | 3600 | 1.123 | 1.19 |
| HR13 | 2014-08-03 | 02:25:19.678 | 3600 | 1.104 | 1.04 |
| HR13 | 2014-08-03 | 03:38:27.712 | 3090 | 1.207 | 0.77 |
3 Observations and analysis
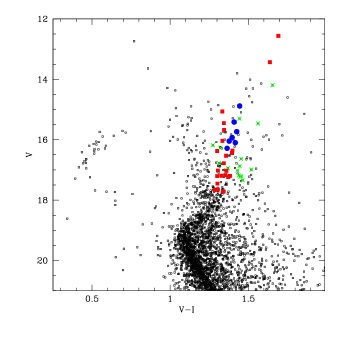
To select our targets for FLAMES we used the photometry by Testa et al. (2001), downloading the catalogue from ViZier. The CMD is shown in Fig. 1, lower panel. As expected from its Galactic position, the field stars contamination is conspicuous, but the cluster RGB and HB are visible, especially when restricting to the very central region covered by HST.
We converted the positions, given as offsets with respect to the cluster centre, to RA and Dec using stars in the HST Guide Star Catalogue-II for the astrometric conversion.111We used the code CataXcorr, developed by Paolo Montegriffo at the INAF - Osservatorio Astronomico di Bologna; see http://www.bo.astro.it/paolo/Main/CataPack.html We then selected stars on and near the RGB and allocated targets with the ESO positioner FPOSS. The observed targets are indicated in Fig. 1, upper panel. Given the small field of view available and the positioner restrictions we were able to observe only 45 stars (and about 30 sky positions).
| ID | RA | Dec | V | V-I | K | RV | err | 2MASS ID & Qflg |
|---|---|---|---|---|---|---|---|---|
| (hh:mm:ss) | (dd:pp:ss) | (2MASS) | (km s-1) | (km s-1) | ||||
| UVES | ||||||||
| ESO1182 | 18:03:53.18 | -00:18:24.92 | 15.732 | 1.426 | 10.601 | -211.66 | 0.19 | 18035317-0018247, AAA |
| ESO1217 | 18:03:52.22 | -00:18:12.90 | 16.046 | 1.378 | 10.856 | -216.35 | 0.30 | 18035223-0018129, EEE |
| ESO157 | 18:03:54.43 | -00:16:45.04 | 16.285 | 1.365 | 11.329 | -219.44 | 0.52 | 18035444-0016449, AAA |
| ESO1601 | 18:03:51.08 | -00:14:39.89 | 16.097 | 1.417 | 11.706 | -216.81 | 0.49 | 18035108-0014396, AAA |
| ESO2416 | 18:03:38.14 | -00:15:26.96 | 15.927 | 1.397 | 12.049 | -215.86 | 0.31 | 18033813-0015267, AAA |
| WF22 | 18:03:47.73 | -00:18:06.20 | 15.416 | 1.410 | 12.261 | -215.96 | 0.23 | 18034771-0018059, AAA |
| WF33 | 18:03:47.74 | -00:17:23.55 | 14.884 | 1.445 | 12.383 | -215.10 | 0.19 | 18034773-0017234, AAA |
| GIRAFFE, members | ||||||||
| ESO102 | 18:03:54.90 | -00:18:16.35 | 16.531 | 1.358 | 13.426 | -213.30 | 0.35 | 18035489-0018161, AAA |
| ESO1155 | 18:03:44.64 | -00:18:03.96 | 17.671 | 1.286 | 14.914 | -214.11 | 0.55 | 18034463-0018037, AAB |
| ESO1208 | 18:03:46.69 | -00:16:31.06 | 17.172 | 1.355 | 14.215 | -213.75 | 0.34 | 18034668-0016308, AAA |
| ESO2304 | 18:03:40.97 | -00:18:48.56 | 17.649 | 1.306 | 14.564 | -209.99 | 0.42 | 18034096-0018483, AAA |
| ESO2369 | 18:03:37.99 | -00:16:09.06 | 17.197 | 1.383 | 14.145 | -213.34 | 0.84 | 18033799-0016087, AAA |
| ESO24 | 18:03:44.10 | -00:18:31.27 | 17.453 | 1.303 | 14.590 | -214.71 | 1.10 | 18034409-0018310, AAA |
| ESO62 | 18:03:57.42 | -00:17:43.40 | 17.201 | 1.301 | 14.216 | -214.96 | 1.32 | 18035741-0017431, AAA |
| ESO659 | 18:03:43.48 | -00:20:34.96 | 16.359 | 1.399 | 13.084 | -214.68 | 0.54 | 18034348-0020347, AAA |
| ESO666 | 18:03:48.62 | -00:20:26.88 | 17.713 | 1.343 | 14.644 | -216.48 | 0.39 | 18034862-0020265, AAA |
| PC112 | 18:03:49.62 | -00:17:50.70 | 16.443 | 1.396 | 13.150 | -217.15 | 0.51 | 18034961-0017505, AAA |
| PC117 | 18:03:50.59 | -00:17:54.40 | 17.032 | 1.360 | 13.316 | -213.56 | 0.51 | 18035058-0017538, AAA |
| PC119 | 18:03:51.41 | -00:17:46.56 | 17.236 | 1.372 | 13.751 | -214.86 | 0.45 | 18035139-0017467, AAA |
| PC13 | 18:03:51.98 | -00:17:56.53 | 15.450 | 1.344 | 12.198 | -214.52 | 1.09 | 18035199-0017564, AAA |
| WF214 | 18:03:48.06 | -00:18:36.79 | 17.718 | 1.338 | 14.817 | -211.00 | 0.83 | 18034805-0018366, AAB |
| WF21 | 18:03:47.42 | -00:18:23.69 | 12.563 | 1.693 | 8.274 | -216.59 | 0.72 | 18034741-0018234, AAA |
| WF23 | 18:03:46.52 | -00:18:05.76 | 15.676 | 1.345 | 12.584 | -217.25 | 4.25 | 18034651-0018054, AAA |
| WF312 | 18:03:48.95 | -00:17:33.14 | 17.195 | 1.330 | 14.291 | -218.28 | 0.86 | 18034895-0017331, AAA |
| WF411 | 18:03:49.06 | -00:17:16.71 | 16.780 | 1.344 | 13.747 | -215.08 | 0.84 | 18034904-0017160, AAA |
| WF41 | 18:03:49.34 | -00:17:06.57 | 13.434 | 1.638 | 9.627 | -215.64 | 0.66 | 18034932-0017059, AAA |
| WF43 | 18:03:52.24 | -00:16:33.45 | 15.064 | 1.334 | 11.960 | -212.09 | 0.90 | 18035223-0016330, AAA |
| WF47 | 18:03:50.84 | -00:17:02.05 | 16.037 | 1.335 | 12.890 | -213.21 | 0.87 | 18035083-0017015, AEA |
| WF49 | 18:03:53.15 | -00:17:10.50 | 16.373 | 1.301 | 13.246 | -218.34 | 1.33 | 18035315-0017101, AAA |
| ESO803 | 18:03:45.38 | -00:20:13.23 | 17.020 | 1.306 | 13.966 | -181.46 | 3.37 | 18034538-0020129, AUU, NM? |
| GIRAFFE, non-members | ||||||||
| ESO121 | 18:03:54.65 | -00:17:02.78 | 17.343 | 1.464 | 38.92 | 0.36 | ||
| ESO1518 | 18:03:55.79 | -00:14:15.37 | 17.215 | 1.455 | 31.15 | 0.51 | ||
| ESO152 | 18:03:54.76 | -00:16:06.26 | 16.873 | 1.445 | 20.30 | 1.63 | ||
| ESO1588 | 18:03:55.50 | -00:15:02.35 | 15.301 | 1.444 | 134.75 | 0.39 | ||
| ESO2006 | 18:03:58.37 | -00:14:40.61 | 14.194 | 1.655 | -34.88 | 0.07 | ||
| ESO2048 | 18:04:00.96 | -00:18:33.59 | 16.265 | 1.321 | 23.66 | 0.50 | ||
| ESO2273 | 18:03:43.12 | -00:16:22.86 | 16.770 | 1.313 | 123.23 | 0.47 | ||
| ESO2320 | 18:03:40.35 | -00:18:11.16 | 16.631 | 1.455 | -48.77 | 0.22 | ||
| ESO2326 | 18:03:41.22 | -00:18:03.31 | 16.989 | 1.520 | -96.89 | 0.50 | ||
| ESO2334 | 18:03:28.75 | -00:17:44.19 | 17.022 | 1.431 | -10.14 | 0.35 | ||
| ESO395 | 18:03:49.84 | -00:15:41.79 | 17.183 | 1.440 | 44.42 | 0.25 | ||
| ESO647 | 18:03:52.86 | -00:20:45.65 | 16.184 | 1.274 | -15.00 | 0.04 | ||
| ESO819 | 18:03:44.05 | -00:19:55.54 | 17.216 | 1.449 | 28.91 | 0.11 | ||
| ESO99 | 18:03:58.38 | -00:18:31.82 | 15.463 | 1.563 | 60.59 | 0.03 | ||
| WF210 | 18:03:46.20 | -00:18:49.69 | 16.942 | 1.370 | 92.75 | 0.77 | ||
3.1 FLAMES spectra
NGC 6535 was observed with the multi-object spectrograph FLAMES@VLT (Pasquini et al., 2002). The observations were performed in service mode; a log is presented in Table 1. We used the GIRAFFE high-resolution set-ups HR11 and HR13 (R=24200 and 22500, respectively), which contain two Na doublets and the [O i] line at 6300 Å, plus several Mg lines. The GIRAFFE observations of 38 stars were coupled with the spectra of 7 stars obtained with the high-resolution (R=47000) UVES 580nm set-up ( Å). Information on the 45 stars (ID, coordinates, , , , RV) is given in Table 2.
The spectra were reduced using the ESO pipelines for UVES-FIBRE and GIRAFFE data; they take care of bias and flat-field correction, order tracing, extraction, fibre transmission, scattered light, and wavelength calibration. We then used IRAF222IRAF is distributed by the National Optical Astronomical Observatory, which are operated by the Association of Universities for Research in Astronomy, under contract with the National Science Foundation. routines on the 1-D, wavelength-calibrated individual spectra to subtract the (average) sky, correct for barycentric motion, combine all the exposures for each star, and shift to zero RV. The region near the [O i] line was corrected for telluric lines contamination before combining the exposures.
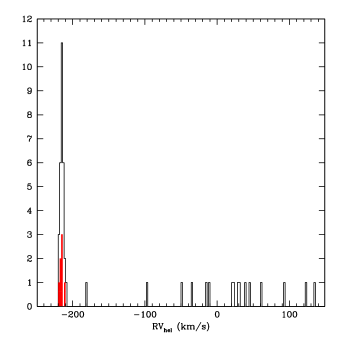
The RV was measured via DOOp (Cantat-Gaudin et al., 2014a), an automated wrapper for DAOSPEC (Stetson & Pancino, 2008) on the stacked spectra; the average heliocentric value for each star is given in Table 2, together with the rms. We show in Fig. 2 the histogram of the RVs; the cluster signature is evident and we identified 29 of the 45 observed targets as cluster members on the basis of their RV. Their average RV is km s-1 (with ), which is in very good agreement with the value reported by Harris (1996).
3.2 Atmospheric parameters
Only 30 stars (the 29 members plus one of more uncertain status) were retained for further analysis. We retrieved their 2MASS magnitudes (Skrutskie et al., 2006), which were used to determine the temperature, mag, 2MASS identification, and quality flag are given in Table 2.
Following our well-tested procedure (for a lengthy description, see e.g. Carretta et al., 2009a, b), effective temperatures for our targets were derived with an average relation between apparent magnitudes and first-pass temperatures from colours and the calibrations of Alonso et al. (1999, 2001). This method permits us to decrease the star-to-star errors in abundances due to uncertainties in temperatures, since magnitudes are less affected by uncertainties than colours. The adopted reddening and distance modulus are from the Harris (1996) catalogue; the input metallicity [Fe/H]= is from Carretta et al. (2009c) and (Harris, 1996, web update). Gravities were obtained from apparent magnitudes and distance modulus, assuming the bolometric corrections from Alonso et al. (1999). We adopted a mass of 0.85 M⊙ for all stars and as the bolometric magnitude for the Sun, as in our previous studies.
We measured the equivalent widths (EW) of iron and other elements via the code ROSA (Gratton, 1988), adopting a relationship between EW and FWHM (for details, see Bragaglia et al. 2001). We eliminated trends in the relation between abundances from Fe i lines and expected line strength (Magain, 1984) to obtain values of the microturbulent velocity . Finally, using the above values we interpolated within the Kurucz (1993) grid of model atmospheres (with the option for overshooting on) to derive the final abundances, adopting for each star the model with the appropriate atmospheric parameters and whose abundances matched those derived from Fe i lines. The adopted atmospheric parameters ( , , [Fe/H], and ) are presented in Table 3.
| Star | [A/H] | nr | [Fe/H]i | nr | [Fe/Hii | |||||
| (K) | (dex) | (dex) | (km s-1) | (dex) | (dex) | |||||
| UVES | ||||||||||
| ESO1182 | 4752 | 2.19 | -1.96 | 1.41 | 37 | -1.958 | 0.100 | 10 | -1.904 | 0.114 |
| ESO1217 | 4787 | 2.27 | -1.92 | 1.18 | 37 | -1.919 | 0.132 | 10 | -1.895 | 0.098 |
| ESO157 | 4847 | 2.43 | -2.00 | 1.36 | 26 | -1.997 | 0.098 | 10 | -1.975 | 0.141 |
| ESO1601 | 4830 | 2.40 | -1.89 | 1.37 | 37 | -1.890 | 0.115 | 8 | -1.843 | 0.162 |
| ESO2416 | 4794 | 2.31 | -1.97 | 1.29 | 34 | -1.969 | 0.107 | 8 | -1.914 | 0.053 |
| WF22 | 4712 | 2.10 | -1.97 | 1.43 | 40 | -1.973 | 0.101 | 8 | -1.957 | 0.040 |
| WF33 | 4600 | 1.80 | -1.96 | 1.53 | 56 | -1.959 | 0.106 | 13 | -1.958 | 0.115 |
| GIRAFFE | ||||||||||
| ESO102 | 4901 | 2.58 | -1.88 | 0.80 | 12 | -1.880 | 0.153 | 2 | -1.917 | 0.175 |
| ESO1155 | 5140 | 3.16 | -1.92 | 1.17 | 11 | -1.914 | 0.143 | 0 | 99.999 | 9.999 |
| ESO1208 | 5028 | 2.92 | -1.95 | 1.03 | 15 | -1.948 | 0.193 | 1 | -1.906 | 9.999 |
| ESO2304 | 5084 | 3.04 | -1.98 | 0.27 | 17 | -1.982 | 0.189 | 0 | 99.999 | 9.999 |
| ESO2369 | 5017 | 2.88 | -1.92 | 1.03 | 15 | -1.919 | 0.141 | 1 | -1.945 | 9.999 |
| ESO24 | 5088 | 3.08 | -1.92 | 1.03 | 9 | -1.915 | 0.140 | 0 | 99.999 | 9.999 |
| ESO62 | 5028 | 2.91 | -1.96 | 0.93 | 14 | -1.958 | 0.169 | 0 | 99.999 | 9.999 |
| ESO659 | 4847 | 2.42 | -2.04 | 0.61 | 23 | -2.038 | 0.192 | 1 | -1.961 | 9.999 |
| ESO666 | 5097 | 3.07 | -1.91 | 1.37 | 15 | -1.907 | 0.155 | 1 | -1.904 | 9.999 |
| PC112 | 4857 | 2.45 | -2.01 | 1.29 | 14 | -2.006 | 0.177 | 1 | -2.010 | 9.999 |
| PC117 | 4998 | 2.84 | -1.99 | 0.34 | 10 | -1.992 | 0.141 | 0 | 99.999 | 9.999 |
| PC119 | 5038 | 2.94 | -2.01 | 0.80 | 16 | -2.007 | 0.204 | 0 | 99.999 | 9.999 |
| PC13 | 4749 | 2.11 | -2.06 | 0.13 | 18 | -2.063 | 0.100 | 2 | -2.093 | 0.059 |
| WF214 | 5125 | 3.17 | -1.87 | 0.73 | 14 | -1.867 | 0.172 | 0 | 99.999 | 9.999 |
| WF21 | 4075 | 0.41 | -1.93 | 2.17 | 32 | -1.933 | 0.150 | 3 | -1.884 | 0.080 |
| WF23 | 4926 | 2.29 | -1.97 | 1.39 | 21 | -1.970 | 0.176 | 1 | -1.967 | 9.999 |
| WF312 | 5040 | 2.96 | -1.93 | 0.95 | 15 | -1.929 | 0.123 | 1 | -1.915 | 9.999 |
| WF411 | 4953 | 2.72 | -2.07 | 0.91 | 13 | -2.066 | 0.143 | 1 | -2.095 | 9.999 |
| WF41 | 4292 | 0.99 | -1.98 | 1.56 | 32 | -1.976 | 0.140 | 1 | -1.955 | 9.999 |
| WF43 | 4912 | 2.04 | -1.98 | 0.90 | 26 | -1.977 | 0.177 | 1 | -1.896 | 9.999 |
| WF47 | 4864 | 2.40 | -2.00 | 1.17 | 22 | -1.999 | 0.155 | 0 | 99.999 | 9.999 |
| WF49 | 4886 | 2.55 | -1.95 | 0.83 | 18 | -1.950 | 0.146 | 1 | -1.900 | 9.999 |
| Star | nr | [O/Fe] | lim | nr | [Na/Fe] | PIE | nr | [Mg/Fe] | |||
| lines | (dex) | (dex) | lines | (dex) | (dex) | lines | (dex) | (dex) | |||
| UVES | |||||||||||
| ESO1182 | 2 | 0.408 | 0.086 | 0 | 2 | 0.177 | 0.017 | P | 2 | 0.461 | 0.091 |
| ESO1217 | 1 | 0.588 | — | 0 | 2 | 0.426 | 0.091 | I | 2 | 0.429 | 0.093 |
| ESO157 | 1 | 0.699 | — | 0 | 2 | 0.323 | 0.030 | I | 2 | 0.517 | 0.230 |
| ESO1601 | 1 | 0.496 | — | 1 | 2 | 0.403 | 0.097 | I | 2 | 0.519 | 0.161 |
| ESO2416 | 1 | 0.401 | — | 0 | 2 | 0.461 | 0.089 | I | 2 | 0.465 | 0.192 |
| WF22 | 1 | 0.608 | — | 0 | 1 | 0.129 | — | P | 2 | 0.502 | 0.120 |
| WF33 | 1 | 0.238 | — | 1 | 2 | 0.459 | 0.004 | I | 2 | 0.451 | 0.132 |
| GIRAFFE | |||||||||||
| ESO102 | 1 | 0.596 | — | 0 | 1 | -0.170 | — | P | 2 | 0.482 | 0.320 |
| ESO1155 | 0 | — | — | 1 | - | — | — | - | 1 | 0.436 | — |
| ESO1208 | 1 | 0.600 | — | 0 | 2 | 0.485 | 0.265 | I | - | — | — |
| ESO2304 | 1 | 0.695 | — | 0 | 1 | 0.300 | — | I | - | — | — |
| ESO2369 | 1 | 0.784 | — | 0 | 1 | -0.015 | — | P | - | — | — |
| ESO24 | 1 | 0.852 | — | 0 | 1 | 0.299 | — | I | 1 | 0.411 | — |
| ESO62 | 1 | 0.645 | — | 1 | 1 | 0.353 | — | I | 1 | 0.515 | — |
| ESO659 | 1 | 0.472 | — | 1 | 2 | 0.549 | 0.029 | I | 2 | 0.598 | 0.236 |
| ESO666 | 1 | 0.996 | — | 0 | 1 | 0.024 | — | P | 1 | 0.567 | — |
| PC112 | 1 | 0.532 | — | 1 | 2 | 0.419 | — | I | 1 | 0.438 | — |
| PC117 | 1 | 0.698 | — | 1 | 2 | 0.297 | 0.104 | I | 1 | 0.510 | — |
| PC119 | 1 | 0.918 | — | 0 | 0 | — | — | - | - | — | — |
| PC13 | 1 | 0.414 | — | 0 | 2 | 0.374 | 0.007 | I | 1 | 0.514 | — |
| WF214 | - | — | — | 1 | - | — | — | - | 1 | 0.467 | — |
| WF21 | 2 | 0.510 | 0.002 | 1 | 2 | 0.344 | 0.073 | I | 2 | 0.478 | 0.091 |
| WF23 | 1 | 0.846 | — | 1 | 2 | -0.017 | 0.054 | P | 1 | 0.486 | — |
| WF312 | 1 | 0.657 | — | 0 | 1 | 0.024 | — | P | 1 | 0.494 | — |
| WF411 | 1 | 0.693 | — | 1 | 2 | 0.240 | 0.016 | I | - | — | — |
| WF41 | 1 | 0.210 | — | 1 | 4 | 1.032 | 0.105 | I | 1 | 0.482 | — |
| WF43 | 1 | 0.586 | — | 1 | 2 | 0.242 | 0.035 | I | 1 | 0.342 | — |
| WF47 | 1 | 0.407 | — | 0 | 3 | 0.618 | 0.163 | I | 1 | 0.472 | — |
| WF49 | 1 | 0.693 | — | 1 | 2 | -0.059 | 0.076 | P | 1 | 0.470 | — |
| Star | nr | [Si/Fe] | rms | nr | [Ca/Fe] | rms | nr | [Ti/Fe]I | rms | nr | [Ti/Fe]II | rms | nr | [Sc/Fe]II | rms |
|---|---|---|---|---|---|---|---|---|---|---|---|---|---|---|---|
| lines | (dex) | (dex) | lines | (dex) | (dex) | lines | (dex) | (dex) | lines | (dex) | (dex) | lines | (dex) | (dex) | |
| ESO1182 | 2 | 0.408 | 0.063 | 15 | 0.280 | 0.090 | 7 | 0.176 | 0.131 | 4 | 0.164 | 0.036 | 4 | -0.113 | 0.074 |
| ESO1217 | 2 | 0.455 | 0.071 | 15 | 0.304 | 0.144 | 8 | 0.131 | 0.159 | 3 | 0.236 | 0.102 | 2 | -0.094 | 0.052 |
| ESO157 | 1 | 0.465 | 14 | 0.305 | 0.184 | 8 | 0.195 | 0.168 | 3 | 0.226 | 0.077 | 1 | -0.012 | ||
| ESO1601 | 2 | 0.379 | 0.016 | 15 | 0.328 | 0.105 | 8 | 0.231 | 0.135 | 5 | 0.202 | 0.207 | 2 | -0.101 | 0.022 |
| ESO2416 | 2 | 0.418 | 0.058 | 15 | 0.327 | 0.155 | 8 | 0.217 | 0.130 | 4 | 0.187 | 0.211 | 2 | 0.003 | 0.189 |
| WF22 | 15 | 0.317 | 0.097 | 8 | 0.192 | 0.120 | 4 | 0.233 | 0.108 | 3 | 0.012 | 0.187 | |||
| WF33 | 2 | 0.385 | 0.073 | 19 | 0.328 | 0.103 | 14 | 0.149 | 0.094 | 6 | 0.229 | 0.130 | 8 | -0.029 | 0.089 |
| Star | nr | [Cr/Fe]I | rms | nr | [Cr/Fe]II | rms | nr | [Mn/Fe] | rms | nr | [Ni/Fe] | rms | |||
| lines | (dex) | (dex) | lines | (dex) | (dex) | lines | (dex) | (dex) | lines | (dex) | (dex) | ||||
| ESO1182 | 6 | -0.177 | 0.086 | 2 | -0.010 | 0.029 | 1 | -0.589 | 5 | -0.127 | 0.105 | ||||
| ESO1217 | 6 | -0.197 | 0.119 | 2 | -0.035 | 0.037 | 1 | -0.588 | 3 | -0.126 | 0.120 | ||||
| ESO157 | 6 | -0.178 | 0.112 | 1 | 0.044 | 1 | -0.546 | 3 | -0.162 | 0.100 | |||||
| ESO1601 | 7 | -0.168 | 0.122 | 2 | -0.128 | 0.079 | 1 | -0.568 | 4 | -0.141 | 0.115 | ||||
| ESO2416 | 7 | -0.158 | 0.135 | 2 | 0.038 | 0.008 | 1 | -0.569 | 3 | -0.172 | 0.013 | ||||
| WF22 | 6 | -0.164 | 0.157 | 2 | -0.019 | 0.079 | 1 | -0.495 | 5 | -0.138 | 0.180 | ||||
| WF33 | 7 | -0.194 | 0.106 | 3 | 0.038 | 0.083 | 3 | -0.524 | 0.224 | 9 | -0.156 | 0.092 |
4 Abundances
In addition to iron, we present here results for the light elements O, Na, and Mg for the entire sample of stars. The abundance ratios for these elements are given in Table 4, together with number of lines used and rms scatter.
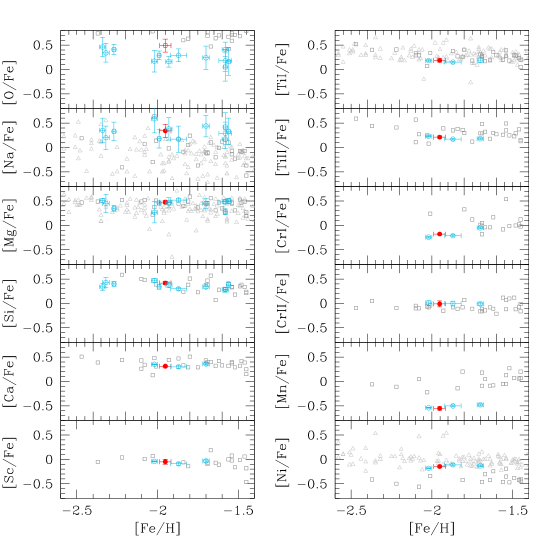
For the seven stars observed with UVES, we also provide abundances for Si, Ca, Ti i,ii, Sc ii, Cr i,ii, Mn, and Ni; these abundances are presented in Table 5. Since the cluster presents some peculiarities, it is important to see whether these also extend to the whole pattern of abundances. Some of the peculiarities of the cluster include that it is metal poor but located in the inner Galaxy, it is perhaps the lowest mass GC to show MPs, and the Na-O anti-correlation seems more extended than expected from its present-day mass; see next Section. The cluster mean elemental ratios are plotted in Fig. 3 in comparison to field stars and other GCs of our FLAMES survey of similar metallicity. We do not see any anomalous behaviour; NGC 6535 seems to be a normal (inner) halo GC; see also below. Hence, in the present paper we dwell only on the light element abundances and we defer any further discussion on heavier species and all neutron-capture elements to future papers.
The abundances were derived using EWs. The atomic data for the lines and solar reference values come from Gratton et al. (2003). The Na abundances were corrected for departure from local thermodynamical equilibrium according to Gratton et al. (1999), as in all the other papers of our FLAMES survey.
To estimate the error budget we closely followed the procedure described in Carretta et al. (2009a, b). Table 6 (for UVES spectra) and Table 7 (for GIRAFFE spectra) provide the sensitivities of abundance ratios to errors in atmospheric parameters and EWs and the internal and systematic errors. For systematic errors we mean the errors that are different for the various GCs considered in our series and that produce scatter in relations involving different GCs; however, they do not affect the star-to-star scatter in any given GC. The sensitivities were obtained by repeating the abundance analysis for all stars, while changing one atmospheric parameter at the time, then taking the average; this was carried out separately for UVES and GIRAFFE spectra. The amount of change in the input parameters used in the sensitivity computations is given in the Table header.
The derived Fe abundances do not show any trend with temperature and gravity and the neutral and ionized species give essentially the same value, as do results based on GIRAFFE or UVES spectra (see Table 8). In fact, we obtain the following mean values: [Fe/H]i=-1.952 (rms=0.036), [Fe/H]ii=-1.921 (rms=0.046) dex for the 7 UVES stars; and [Fe/H]i=-1.963 (rms=0.053), [Fe/H]ii=-1.953 (rms=0.069) dex for the 22 GIRAFFE stars.
This the first high-resolution spectroscopic study of this cluster, and hence no real comparison with previous determinations is possible. However, the metallicity we find is in reasonable agreement with that based on CaT ( or Rutledge et al., 1997b). The metallicity is also consistent with the value in Harris (1996, i.e. -1.79), which comes from Carretta et al. (2009c). In that paper we built a metallicity scale based on GCs observed at high resolution (NGC 6535 was not among these GCs) and recalibrated other scales.
Several studies have shown that the age-metallicity relation of MW GCs is bifurcated with one sequence of old, essentially coeval GCs at all metallicities and a second sequence of metal-richer GCs; see e.g. VandenBerg et al. (2013); Leaman et al. (2013) and references therein. These sequences are populated by clusters associated with the halo and the disk, respectively (see Fig. 2 in Leaman et al. 2013, in which Rup 106, Ter 7, Pal 12, and NGC 6791 are highlighted, which are discussed in Sect. 7). The old age and the confirmed low metallicity, place NGC 6535 in the sequence of halo, accreted GCs; see e.g. VandenBerg et al. (2013); Leaman et al. (2013).
| Element | Average | Teff | [A/H] | EWs | Total | Total | ||
|---|---|---|---|---|---|---|---|---|
| n. lines | (K) | (dex) | (dex) | kms-1 | (dex) | Internal | Systematic | |
| Variation | 50 | 0.20 | 0.10 | 0.10 | ||||
| Internal | 3 | 0.04 | 0.04 | 0.10 | 0.02 | |||
| Systematic | 61 | 0.06 | 0.09 | 0.04 | ||||
| Fe/Hi | 38 | +0.074 | 0.019 | 0.014 | 0.023 | 0.018 | 0.030 | 0.092 |
| Fe/Hii | 10 | 0.008 | +0.075 | +0.017 | 0.016 | 0.034 | 0.041 | 0.031 |
| O/Fei | 1 | 0.048 | +0.094 | +0.038 | +0.022 | 0.108 | 0.113 | 0.088 |
| Na/Fei | 2 | 0.042 | 0.014 | +0.002 | +0.019 | 0.076 | 0.079 | 0.073 |
| Mg/Fei | 2 | 0.029 | 0.016 | +0.002 | +0.006 | 0.076 | 0.077 | 0.038 |
| Si/Fei | 2 | 0.045 | +0.029 | +0.009 | +0.016 | 0.076 | 0.078 | 0.058 |
| Ca/Fei | 15 | 0.025 | 0.001 | +0.001 | +0.003 | 0.028 | 0.028 | 0.031 |
| Sc/Feii | 3 | +0.019 | 0.002 | +0.002 | +0.006 | 0.062 | 0.063 | 0.031 |
| Ti/Fei | 9 | +0.012 | 0.003 | 0.004 | 0.005 | 0.036 | 0.036 | 0.020 |
| Ti/Feii | 4 | +0.017 | 0.003 | +0.000 | +0.002 | 0.054 | 0.054 | 0.023 |
| V/Fei | 1 | +0.014 | +0.001 | 0.001 | +0.021 | 0.108 | 0.110 | 0.095 |
| Cr/Fei | 6 | +0.003 | +0.000 | 0.003 | 0.005 | 0.044 | 0.044 | 0.007 |
| Cr/Feii | 2 | 0.005 | 0.002 | 0.007 | +0.010 | 0.076 | 0.077 | 0.024 |
| Mn/Fei | 1 | 0.011 | +0.001 | +0.000 | +0.004 | 0.108 | 0.108 | 0.019 |
| Ni/Fei | 5 | 0.012 | +0.017 | +0.005 | +0.012 | 0.048 | 0.050 | 0.018 |
| Element | Average | Teff | [A/H] | EWs | Total | Total | ||
| n. lines | (K) | (dex) | (dex) | kms-1 | (dex) | Internal | Systematic | |
| Variation | 50 | 0.20 | 0.10 | 0.10 | ||||
| Internal | 3 | 0.04 | 0.05 | 0.25 | 0.04 | |||
| Systematic | 62 | 0.06 | 0.08 | 0.05 | ||||
| Fe/Hi | 17 | +0.059 | 0.010 | 0.010 | 0.018 | 0.038 | 0.059 | 0.075 |
| Fe/Hii | 1 | 0.015 | +0.078 | +0.012 | 0.003 | 0.158 | 0.159 | 0.035 |
| O/Fei | 1 | 0.032 | +0.085 | +0.028 | +0.018 | 0.158 | 0.166 | 0.063 |
| Na/Fei | 2 | 0.030 | 0.013 | +0.000 | +0.016 | 0.112 | 0.119 | 0.082 |
| Mg/Fei | 1 | 0.028 | +0.004 | +0.001 | +0.013 | 0.158 | 0.161 | 0.038 |
5 Na-O anti-correlation
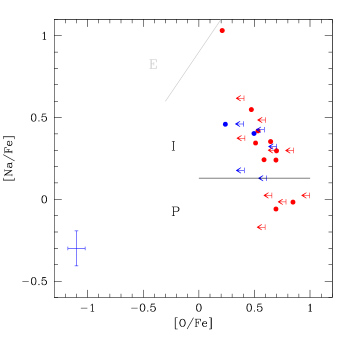
Unfortunately, we could only obtain upper limits in O abundance for many stars, but this did not compromise the main goal of our work, i.e. detecting (or not) MPs in this low-mass cluster. Indeed, NGC 6533 turned out to be a normal MW GC, showing the usual anti-correlation between O and Na; see Fig. 4. This would not have been evident using only the seven stars observed with UVES. We need to be cautious in relying on small number statistics to exclude the presence of MPs (e.g. Terzan 7, Pal 12).
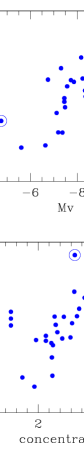
The extension of the Na-O anti-correlation in NGC 6535 can be measured with the interquartile ratio of [O/Na] (see Carretta, 2006); from the 26 stars with both Na and O abundances, we find IQR[O/Na]=0.44. This value is close to the expectation based on HST photometry of its horizontal branch (Milone et al., 2014, see Sect. 2), but looks large for the present cluster mass, according to the relation between IQR[O/Na] and absolute magnitude MV we found (see Fig. 5, upper panel). However, this is true also in other cases in which a strong mass loss is suspected, such as NGC 288, M71, and NGC 6218. In Carretta et al. (2014b) we suggested that cluster concentration () also plays a role and may explain part of the scatter in the IQR-MV relation. If we plot the residuals around this relation against , we see a neat anti-correlation (Fig. 5, lower panel). The outliers are three post-core collapse GCs, for which the concentration parameter is arbitrarily set at 2.5 since they do not fit a King luminosity profile, and NGC 6535, which again indicates some peculiarity for this cluster.
Using the separation defined in Carretta et al. (2009a) of FG and SG stars in the P, I, and E populations (i.e. primordial, intermediate, and extreme, respectively), we see that NGC 6535 does not harbour any E star but has a large number of I stars. The lack of E stars is consistent with the low mass of the cluster and also suggests that its initial mass should not have been too large. The fraction of P (FG) and I (SG) stars turns out and , respectively, which is in line with the other GCs of our survey (Carretta et al., 2010a).
From our extensive FLAMES survey, we derived an almost constant (e.g. Carretta et al., 2009a, 2010a, and following works) fraction of FG to SG stars with FG stars constituting about one-third of the present-day cluster population, according to Na and O abundances (confirmed also by Bastian & Lardo 2015). This is valid at least for the more massive GCs (Terzan 8 is an exception, see Carretta et al. 2014a), even with some variation, from about 25% to 50%. Also, a different fraction could be obtained with a separation based on photometry; see the case of NGC 288 discussed in Carretta et al. (2011b) or M 13 (Massari et al., 2016). Milone et al. (2017) used the HST UV Legacy survey to characterize MPs using what they called a “chromosome map”. They were able to measure the fraction of FG stars (indicated as 1G) and found it variable from cluster to cluster, from to . However, their median value is 36% (rms=0.09) and if we compare their values and what we obtain from our Na-O sample for the GCs in common, 1G and P fractions generally follow a one-to-one relation (Carretta et al., in preparation). For NGC 6535, their is only marginally inconsistent with our value for 1G/P stars. According to Milone et al. (2017) there is a correlation of the MP phenomenon with cluster mass with higher mass GCs showing a lower frequency of 1G stars. While this closely matches what we found for the extension of the Na-O anti-correlation, larger in more massive GCs (Carretta et al. 2010a, see also Fig. 5), we do not find a relation between the fraction of FG stars and cluster mass (or age), when the separation in populations is based on Na and O.
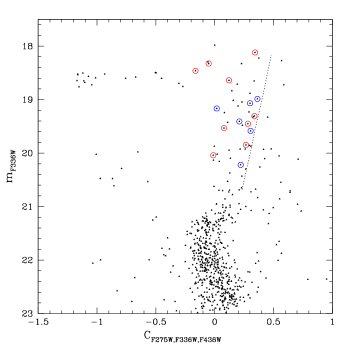
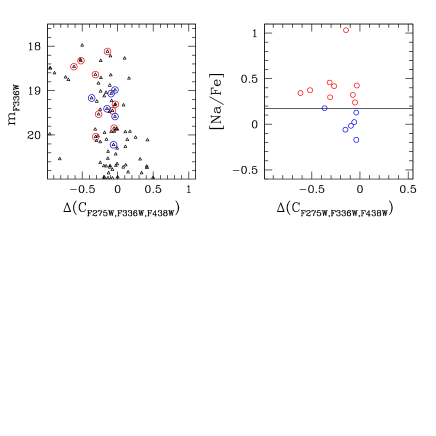
Also because photometry and high-resolution spectroscopy do not seem to tell exactly the same story, it is interesting to compare their results for NGC 6535. We downloaded the HST UV Legacy early-release data from the Mikulski Archive for Space Telescopes (MAST) and cross-matched the catalogue with our stars, finding only 15 objects in common. Figure 6 shows a diagram plotting the pseudo-colour against F336W magnitude with our stars indicated by large open circles. We did not apply any quality selection to the photometry or try differential reddening correction, and therefore the RGB separation in two branches is less evident than in Piotto et al. (2015). We may see that P and I separate along different sequences, although not perfectly. To better appreciate this, we used a line to straighten the RGB and compute the difference in pseudo-colour, i.e. . The left-hand panel of Fig. 7 shows the result; all P stars (with one exception) are confined to the right side and I stars tend to occupy the left side of the RGB, but are more spread out. If we consider Na abundance (right-hand panel of Fig. 7), we see that five of the P stars share the same value (mean [Na/Fe]=, rms=0.11). The exception is exactly at the border of our P, I separation and may also be a misclassification. Instead, at about the same sodium, I stars may have a wide range of (that is, a range in C, N abundance), another manifestation that Na and N are correlated, but do not tell exactly the same story, as previously stated, e.g. by Smith et al. (2013); Smith (2015).
| Element | stars | mean | rms | stars | mean | rms |
|---|---|---|---|---|---|---|
| UVES | GIRAFFE | |||||
| O/Fei | 7 | +0.491 | 0.134 | 20 | +0.639 | 0.184 |
| Na/Fei | 7 | +0.340 | 0.136 | 20 | +0.314 | 0.320 |
| Mg/Fei | 7 | +0.478 | 0.035 | 17 | +0.470 | 0.057 |
| Si/Fei | 6 | +0.418 | 0.035 | |||
| Ca/Fei | 7 | +0.312 | 0.018 | |||
| Sc/Feii | 7 | -0.048 | 0.053 | |||
| Ti/Fei | 7 | +0.184 | 0.036 | |||
| Ti/Feii | 7 | +0.211 | 0.027 | |||
| Cr/Fei | 7 | -0.177 | 0.015 | |||
| Cr/Feii | 7 | -0.010 | 0.061 | |||
| Mn/Fei | 7 | -0.554 | 0.035 | |||
| Fe/Hi | 7 | -1.952 | 0.036 | 22 | -1.963 | 0.054 |
| Fe/Hii | 7 | -1.921 | 0.046 | 14 | -1.953 | 0.069 |
| Ni/Fei | 7 | -0.146 | 0.018 | |||

6 Internal kinematics
In spite of the relatively small number of cluster members the present dataset represents the most extensive set of radial velocities for NGC 6535 and is very useful to study the internal kinematics of this cluster.
As a first step, we test the presence of systemic rotation. For this purpose, in Fig. 8 the radial velocities of the 29 bona fide members are plotted against their position angles. The best-fit sinusoidal curve indicates a rotation amplitude of km s-1, compatible with no significant rotation.
We then used our radial velocity dataset to estimate the dynamical mass of the system. For this purpose we fitted the distribution of radial velocities with both a single mass King (1966) model and a multi-mass King-Michie models (Gunn & Griffin, 1979). In particular, for each model we tuned the model mass to maximize the log-likelihood
where N(=29) is the number of available radial velocities, and are the radial velocity of the i-th star and its associated uncertainty, and is the line-of-sight velocity dispersion predicted by the model at the distance from the cluster centre of the i-th star. The best-fit single mass model provides a total mass of . For the multi-mass model we chose a present-day mass function of single stars with a positive slope of (for reference, a Salpeter mass function has ). Such a peculiar mass function is indeed necessary to reproduce the paucity of low-mass stars observed in the HST CMD presented by Halford & Zaritsky (2015). We adopted the prescriptions for dark remnants and binaries of Sollima et al. (2012) assuming a binary fraction of 4% and a flat distribution of mass ratios. The derived mass turned out to be 2.21 with a typical uncertainty of . This value is larger than found by McLaughlin & van der Marel (2005), who have Log(mass)=3.53; the difference comes from the different methods used (kinematics versus photometric profiles). In any case, even our value places NGC 6535 among the presently less massive MW GCs.
By assuming the absolute magnitude listed for this cluster in the Harris catalogue (Harris 1996, 2010 edition), the corresponding ratio are 3.12 and 3.25 for the single mass and multi-mass models, respectively, while larger M/L ratios (3.78 and 3.95) are instead obtained if the integrated magnitude by McLaughlin & van der Marel (2005) is adopted. Such a large M/L ratio is consistent with what was already measured in other low-mass clusters of our survey (e.g. Carretta et al., 2014a). This evidence can be interpreted as an effect of the strong interaction of this cluster with the Galactic tidal field affecting the M/L in a twofold way: i) the tidal heating inflates the cluster velocity dispersion spuriously increasing the derived dynamical mass, and ii) the efficient loss of stars leads to an increased relative fraction of remnants contributing to the mass without emitting any light. Dedicated N-body simulations are needed to understand the relative impact of the two above-mentioned effects.
7 Age and mass limits for multiple populations
As already put forward in the Introduction, there seems to be an observational lower limit to the mass of a cluster to display the Na-O anti-correlation (Carretta et al., 2010a). We used the absolute magnitude in the band, MV, as a proxy for mass, since it is available for all MW GCs (see the catalogue by Harris, 1996) while the mass is not. However, the majority of clusters for which information on the presence (or, very rarely, absence) of anti-correlations between light elements is available have high mass. We then decided to observe systematically lower mass GCs along with old and massive OCs to obtain and analyse homogeneously samples of stars as large as those for the other clusters of our survey. We obtained data on a few objects (see Introduction), but also other groups were active on the same line and therefore the situation improved in recent years.
We revise here the census of clusters for which indication on MPs has been obtained. Starting from the clusters in Carretta et al. (2010a) (see their Fig. 3) and the updated table in Krause et al. (2016), we scanned the literature up to June 2017 for new results on the anti-correlation of light elements in GCs based on high-resolution spectroscopy (i.e. involving Na, O or Mg, Al). At variance with Carretta et al. (2010a), we also considered evidence of MPs based on photometry or low-resolution spectroscopy (i.e. involving C, N), whenever no high-resolution spectroscopy was available for the particular cluster. For the OCs, we only considered a subsample: the two old, massive OCs Berkeley 39 and NGC 6791444For this cluster, Geisler et al. (2012) proposed the presence of MPs, which we and Cunha et al. (2015) did not confirm. We consider it to be a single stellar population unless otherwise proved by new observations. observed and analyzed homogeneously by us (Bragaglia et al., 2012, 2014), five OCs in the Gaia-ESO Survey (Gilmore et al., 2012), one in APOGEE (Majewski et al., 2016), and four more from different groups. While not exhaustive, the OC list comprises only clusters in which large samples of stars were analysed; for more data on OCs and MPs, see MacLean et al. (2015); Krause et al. (2016).
The result of this process is presented in Table 9 and Fig. 9 for the MW clusters. The table lists all the MW GCs (plus several OCs) for which a statement on MPs can be made. The Table also presents the clusters’ metallicity and MV (both from Harris, 1996), relative age (collected from Carretta et al., 2010a, or individual papers), mass (from McLaughlin & van der Marel, 2005, whenever present), a reference to the first paper(s) discussing MPs or to our homogeneous survey, if available, and a flag indicating whether MPs are actually present. We gathered information on 90 GCs out of 157 in Harris (1996), i.e. about 57% of the known MW GCs. Of these clusters, 77 show definitely the presence of MPs, 63 on the basis of Na,O and/or Mg,Al anti-correlations, and 14 on the basis of C,N variations. For eight more clusters the answer is uncertain, but generally the positive option is favoured. Finally, only a handful of cases seem to host SSPs (but note Pal 12, for which two answers are provided by different methods); all of these have a low , except Ruprecht 106. On the contrary, all the OCs are SSPs.
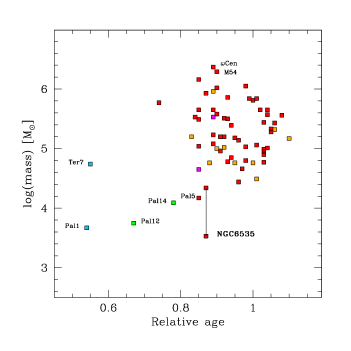
Figure 9 shows graphically the same information, using MV and relative age (in a scale where 1=13.5 Gyr). The plot confirms that NGC 6535 is the smallest GC showing MPs and that the bulk of old, high-mass GCs hosts MPs. Figure 10 is similar, but shows the mass, taken from McLaughlin & van der Marel (2005), for homogeneity sake; in fact, there are the two different values for NGC 6535. Even if the information is available for fewer GCs, the picture is the same: cluster mass is surely one of the main drivers for the presence/absence of MPs.
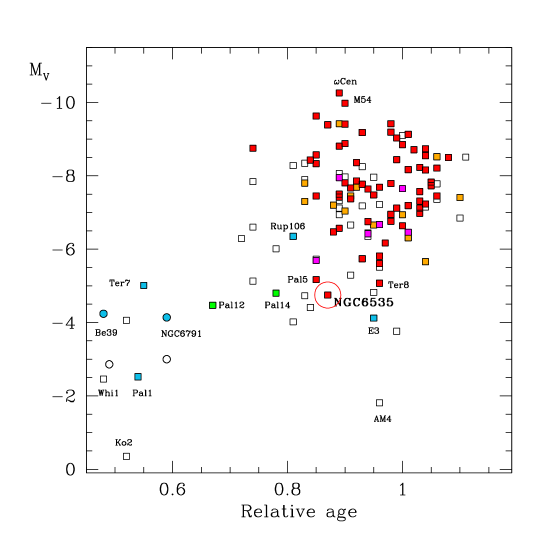
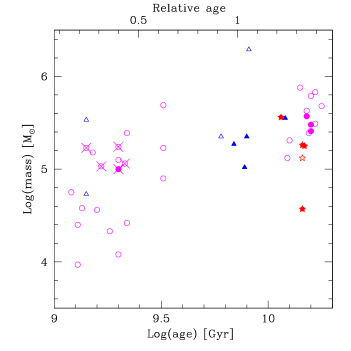
However, a second factor seems important, the cluster age: with the exception of E3, all other SSP clusters are young. To constrain models for cluster formation and test pollution of the SG by pristine stars, it is fundamental to study the presence of MPs as a function of both mass and age. Of course, we must take into account that age and mass seem to be related, at least in the MW, since massive clusters tend to be old (see Figs. 9 and 10). This means that we need to resort to extragalactic clusters, where we find young(er) and massive clusters, at variance with the MW. By limiting the study to clusters in which individual stars can be resolved and observed, some clusters in nearby dwarfs have been studied. We represent the collected information on the extragalactic clusters in Table 10, where we took metallicity from the individual papers, mass, and age from Mackey & Gilmore (2003a, b, c). Figure 11 plots age versus mass for these LMC, SMC, and Fnx dSph clusters.
Letarte et al. (2006) obtained high-resolution spectra of three stars in each of three metal-poor GCs in Fnx dSph, finding MPs. Larsen et al. (2014) confirmed the finding by means of HST near-UV and optical photometry, thereby adding a fourth cluster. Mucciarelli et al. (2009) found MPs in three old GCs in the LMC on the basis of their Na, O distribution. In all these cases the SG does not seem to be as predominant as in the MW GCs of similar mass and age. When however younger ages are considered, Mucciarelli et al. (2008, 2011, 2014) did not find MPs in intermediate-age LMC clusters, seemingly reproducing what we see in the MW (but see below).
Dalessandro et al. (2016) discovered the presence of MPs in NGC 121, the only SMC cluster as old as the classical MW GCs, using mostly near-UV HST photometry. This was the first SMC cluster to display the presence of MPs; the discovery was confirmed by Niederhofer et al. 2017a using a similar HST filter set. Interestingly, Dalessandro et al. (2016) found a dominant FG (about 65%), which could be due either to a smaller formation of SG stars or to a smaller loss of FG stars than in MW GCs of similar mass and metallicity. These authors also acquired high-resolution spectra of five giants, but they seem to belong only to FG, according to their Na, O and Al, Mg abundances. This may be due to small number statistics, especially in the presence of a dominant FG, or to the decoupling of “C,N” and “Na,O” effects. The latter effect was touched upon in Carretta (2016) and we plan to discuss the issue in a forthcoming paper.
Other MC clusters have indeed been found to host MPs on the basis of their (UV-visual) CMDs and/or CN, CH band strengths; both methods rely ultimately on the increased N and decreased C abundance in SG stars. Apart from the increasing number of studied clusters, the interesting part is that MPs are found in younger and younger clusters. For instance, Hollyhead et al. (2017) detected MPs in the SMC cluster Lindsay 1 (age about 8 Gyr) using low-resolution spectra and CN, CH bands; Niederhofer et al. (2017b), using photometry, confirmed the result and added two more not-so-old SMC clusters, NGC 339 and NGC 416 (ages between 6 and 7.5 Gyr). These authors also measured the fraction of SG in the three clusters, which always resulted to be lower than the average MW value, at least to the values based on the Na, O anti-correlation (36%, 25%, and 45% in Lindsay 1, NGC 339, and NGC 416, respectively). These clusters are massive, about M⊙, and are filling the gap between the classical old MW clusters and the intermediate-age and young SMC, LMC clusters, where no indication of MPs has been found; see Mucciarelli et al. (2009, 2011, 2014), Martocchia et al. (2017a), and Table 10. However, the situation evolved recently, with the discovery of split sequences in the LMC cluster NGC 1978 (Lardo, priv. comm.; Martocchia et al. 2017b), which is only 2 Gyr old (translating to a redshift ). This cluster had been considered a SSP by Mucciarelli et al. (2008), looking at Na and O.
The presence of MPs also at young ages (i.e. in clusters formed at redshifts well past the epoch of GC formation) seems at odds with what we find in the MW (see Table 9 and Figs. 9,10) and needs to be explained. More observations of the same clusters using both photometry/CN bands and high-resolution spectroscopy are also required to clarify if they are really tracing the same phenomenon.
8 Summary and conclusions
As part of our large, homogeneous survey of MW GCs with FLAMES, we observed NGC 6535, which is possibly the lowest mass cluster in which MPs are present (see Fig. 9). We collected our data just before the first CMDs of the HST UV Legacy Survey were made public and we may confirm spectroscopically that stars belonging to different stellar populations co-exist in this cluster.
We measured abundances of Fe and other species, but concentrated here only on the light elements. The extension of the Na-O anti-correlation has been measured, with IQR[O/Na]=0.44, in line with the idea that the cluster has suffered a strong mass loss. Using the Na, O distribution, we found that FG and SG are about 30% and 70%, respectively, while the separation based on UV-optical filters is close to 50-50% (Milone et al., 2017). This difference is not unusual when comparing fractions based essentially on O and Na or C and N, respectively. Using the RVs and King models, we estimated the cluster mass; even if our result is larger than in McLaughlin & van der Marel (2005), we confirm that NGC 6535 has a low present-day mass.
To put NGC 6535 in context, we collected all available literature information on the presence (or absence) of MPs in clusters. Using either MV or mass, we confirm that this cluster lies near the lower envelope of MW GCs hosting MPs (see Figs. 9, 10). In addition to mass, age also seems to play a role in deciding upon the appearance of MPs and this puts important constraints to models of cluster formation. While all young MW clusters (open clusters) studied so far seem to be SSPs, some younger extragalactic clusters have been found to host MPs. To really advance in our comprehension of the MP phenomenon, further observations are required and a strong synergy between theory/models and photometry, low-resolution, and high-resolution spectroscopy is to be encouraged.
| Cluster | [Fe/H] | MV | Age | LogM | MP? | Ref for MPs |
|---|---|---|---|---|---|---|
| NGC104 | -0.72 | -9.42 | 0.98 | 6.05 | Y | 1,2 |
| NGC288 | -1.32 | -6.75 | 0.94 | 4.85 | Y | 1,2 |
| NGC362 | -1.26 | -8.43 | 0.84 | 5.53 | Y | 3 |
| NGC1851 | -1.18 | -8.33 | 0.85 | 5.49 | Y | 4,5 |
| NGC1904 | -1.60 | -7.86 | 0.92 | 5.20 | Y | 1,2 |
| NGC2808 | -1.14 | -9.39 | 0.87 | 5.93 | Y | 6 |
| NGC3201 | -1.59 | -7.45 | 0.85 | 5.04 | Y | 1,2 |
| NGC4147 | -1.80 | -6.17 | 0.97 | 4.66 | Y | 7 |
| NGC4372 | -2.17 | -7.79 | 0.98 | Y | 8 | |
| NGC4590 | -2.23 | -7.37 | 0.91 | 4.96 | Y | 1,2 |
| NGC4833 | -1.85 | -8.17 | 1.01 | Y | 9 | |
| NGC5024 | -2.10 | -8.71 | 1.02 | 5.65 | Y | 10,11 |
| NGC5053 | -2.27 | -6.76 | 0.98 | 4.80 | Y | 12 |
| NGC5139 | -1.53 | -10.26 | 0.89 | 6.37 | Y | 13,14 |
| NGC5272 | -1.50 | -8.88 | 0.90 | 5.58 | Y | 15,16,17 |
| NGC5286 | -1.69 | -8.74 | 1.04 | 5.65 | Y | 18 |
| Pal5 | -1.41 | -5.17 | 0.85 | 4.17 | Y | 19 |
| NGC5466 | -1.98 | -6.98 | 1.03 | 4.77 | Y | 10 |
| NGC5634 | -1.88 | -7.69 | 0.96 | 5.14 | Y | 20 |
| NGC5694 | -1.98 | -7.83 | 1.05 | 5.33 | Y | 21 |
| NGC5824 | -1.91 | -8.85 | 1.00 | 5.81 | Y | 22 |
| NGC5927 | -0.49 | -7.81 | 0.90 | Y | 23 | |
| NGC5897 | -1.90 | -7.23 | 1.04 | 5.01 | Y | 24 |
| NGC5904 | -1.29 | -8.81 | 0.89 | 5.65 | Y | 1,2 |
| NGC5986 | -1.59 | -8.44 | 0.99 | Y | 25 | |
| NGC6093 | -1.75 | -8.23 | 1.03 | 5.44 | Y | 26 |
| NGC6121 | -1.16 | -7.19 | 1.01 | 5.06 | Y | 1,2 |
| NGC6139 | -1.65 | -8.36 | 0.92 | 5.51 | Y | 27 |
| NGC6171 | -1.02 | -7.12 | 1.03 | 4.90 | Y | 1,2 |
| NGC6205 | -1.53 | -8.55 | 1.04 | 5.57 | Y | 16,17 |
| NGC6218 | -1.37 | -7.31 | 1.03 | 4.95 | Y | 28 |
| NGC6254 | -1.56 | -7.48 | 0.95 | 5.18 | Y | 1,2 |
| NGC6266 | -1.18 | -9.18 | 0.93 | 5.86 | Y | 29,30 |
| NGC6273 | -1.74 | -9.13 | 1.01 | 5.84 | Y | 31 |
| NGC6341 | -2.31 | -8.21 | 1.06 | 5.43 | Y | 10 |
| NGC6352 | -0.64 | -6.47 | 0.88 | Y | 32 | |
| NGC6362 | -0.99 | -6.95 | 0.98 | 5.03 | Y | 33 |
| NGC6366 | -0.59 | -5.74 | 0.93 | 4.78 | Y | 34 |
| NGC6388 | -0.55 | -9.41 | 0.90 | 6.02 | Y | 35,1 |
| NGC6397 | -2.02 | -6.64 | 1.00 | Y | 1,2 | |
| NGC6440 | -0.36 | -8.75 | 0.74 | 5.77 | Y | 36 |
| NGC6441 | -0.46 | -9.63 | 0.85 | 6.16 | Y | 37,38 |
| NGC6528 | -0.11 | -6.57 | 0.89 | 5.08 | Y | 39 |
| NGC6535 | -1.79 | -4.75 | 0.87 | 3.53 | Y | This paper |
| NGC6553 | -0.18 | -7.77 | 0.93 | 5.50 | Y | 39,40 |
| NGC6626 | -1.32 | -8.16 | 1.04 | Y | 41 | |
| NGC6637 | -0.64 | -7.64 | 0.94 | 5.39 | Y | 42 |
| NGC6656 | -1.70 | -8.50 | 1.08 | 5.56 | Y | 43,44 |
| NGC6681 | -1.62 | -7.12 | 0.99 | Y | 45,46 | |
| NGC6712 | -1.02 | -7.50 | 0.89 | 5.23 | Y | 47 |
| NGC6715 | -1.49 | -9.98 | 0.90 | 6.29 | Y | 48,49 |
| NGC6723 | -1.10 | -7.83 | 1.05 | 5.28 | Y | 50 |
| NGC6752 | -1.54 | -7.73 | 1.05 | Y | 51 | |
| NGC6809 | -1.94 | -7.57 | 1.03 | 4.99 | Y | 1,2 |
| NGC6838 | -0.78 | -5.61 | 0.96 | Y | 1,2 | |
| NGC6864 | -1.29 | -8.57 | 0.85 | 5.65 | Y | 52 |
| Terzan8 | -2.16 | -5.07 | 0.96 | Y | 53 | |
| NGC7006 | -1.52 | -7.67 | 0.91 | 5.20 | Y | 54 |
| NGC7078 | -2.37 | -9.19 | 0.98 | Y | 1,2 | |
| NGC7089 | -1.65 | -9.03 | 0.99 | 5.84 | Y | 55 |
| NGC7099 | -2.27 | -7.45 | 1.06 | Y | 1,2 | |
| NGC7492 | -1.78 | -5.81 | 0.96 | 4.44 | Y | 56 |
| Terzan5 | -0.23 | -7.42 | 0.89 | Y | 39 |
| Cluster | [Fe/H] | MV | Age | LogM | MP? | Ref for MPs |
| NGC1261 | -1.27 | -7.80 | 0.83 | 5.20 | P | 46,57 |
| NGC2298 | -1.92 | -6.31 | 1.01 | 4.49 | P | 46,57 |
| NGC2419 | -2.15 | -9.42 | 0.89 | 5.96 | P | 58,59,60,61 |
| NGC6101 | -1.98 | -6.94 | 1.00 | 4.76 | P | 46,57 |
| NGC6304 | -0.45 | -7.30 | 0.83 | P | 46,57 | |
| NGC6496 | -0.46 | -7.20 | 0.88 | 4.76 | P | 46,57 |
| NGC6541 | -1.81 | -8.52 | 1.06 | 5.32 | P | 62,46,57 |
| NGC6584 | -1.50 | -7.69 | 0.92 | 5.02 | P | 46,57 |
| NGC6624 | -0.44 | -7.49 | 0.89 | P | 46,57 | |
| NGC6652 | -0.81 | -6.66 | 0.95 | 4.76 | P | 46,57 |
| NGC6717 | -1.26 | -5.66 | 1.04 | P | 46,57 | |
| NGC6779 | -1.98 | -7.41 | 1.10 | 5.17 | P | 46,57 |
| NGC6934 | -1.47 | -7.45 | 0.91 | 5.20 | P | 63,46,57 |
| NGC6981 | -1.42 | -7.04 | 0.90 | 5.00 | P | 46,57 |
| Pal6 | -0.91 | -6.79 | Y? | 39 | ||
| NGC6333 | -1.77 | -7.95 | 0.89 | 5.53 | Y? | 64 |
| NGC6426 | -2.15 | -6.67 | 0.96 | Y? | 65 | |
| NGC6522 | -1.34 | -7.65 | 1.00 | Y? | 39 | |
| NGC6342 | -0.55 | -6.42 | 0.94 | Y? | 34 | |
| HP1 | -1.00 | -6.46 | 1.01 | Y? | 66 | |
| Pal3 | -1.63 | -5.69 | 0.85 | 4.65 | Y? | 67 |
| Pal14 | -1.62 | -4.80 | 0.78 | 4.09 | N? | 68 |
| Pal12 | -0.85 | -4.47 | 0.67 | 3.75 | N/P | 69,70 |
| E3 | -0.83 | -4.12 | 0.95 | N | 71 | |
| Terzan7 | -0.32 | -5.01 | 0.55 | 4.74 | N | 72,73 |
| Rup106 | -1.68 | -6.35 | 0.81 | N | 74 | |
| Pal1 | -0.65 | -2.52 | 0.54 | 3.67 | N | 75 |
| NGC6791 | +0.40 | -4.14 | 0.59 | N | 76,77,78 | |
| Berkeley39 | -0.20 | -4.24 | 0.48 | N | 79 | |
| Trumpler20 | +0.17 | 0.11 | N | 80 | ||
| NGC6705 | +0.10 | -6.00 | 0.02 | N | 81 | |
| Berkeley81 | +0.23 | -4.70 | 0.07 | N | 82 | |
| Trumpler23 | +0.14 | 0.06 | N | 83 | ||
| NGC6802 | +0.10 | 0.07 | N | 84 | ||
| NGC2420 | -0.16 | -3.44 | 0.15 | N | 85 | |
| NGC7789 | +0.03 | 0.12 | N | 86 | ||
| Collinder261 | -0.03 | -2.87 | 0.44 | N | 87 | |
| NGC752 | -0.02 | 0.12 | N | 88 | ||
| NGC2682 | +0.03 | -3.16 | 0.30 | N | 89 |
Values for MV for OCs come from Lata et al. (2002), relative age and metallicity from the individual papers. stands for APOGEE, for Gaia-ESO survey.
References. (1) Carretta et al. (2009a); (2) Carretta et al. (2009b); (3) Carretta et al. (2013b); (4) Carretta et al. (2010d); (5) Carretta et al. (2011a); (6) Carretta (2006); (7) Villanova et al. (2016); (8) San Roman et al. (2015) ; (9) Carretta et al. (2014b); (10) Mészáros et al. (2015); (11) Boberg et al. (2016); (12) Boberg et al. (2015); (13) Johnson & Pilachowski (2010); (14) Marino et al. (2011); (15) Cohen (1978); (16) Kraft et al. (1992); (17) Cohen & Meléndez (2005b); (18) Marino et al. (2015); (19) Smith et al. (2002); (20) Carretta et al. (2017); (21) Mucciarelli et al. (2013); (22) Roederer et al. (2016); (23) Pancino et al. (2017); (24) Koch & McWilliam (2014); (25) Johnson et al. (2017); (26) Carretta et al. (2015); (27) Bragaglia et al. (2015); (28) Carretta et al. (2007b); (29) Yong et al. (2014a); (30) Lapenna et al. (2015); (31) Johnson et al. (2015); (32) Feltzing et al. (2009); (33) Mucciarelli et al. (2016); (34) Johnson et al. (2016); (35) Carretta et al. (2007c); (36) Muñoz et al. (2017); (37) Gratton et al. (2006); (38) Gratton et al. (2007); (39) Schiavon et al. (2017); (40) Tang et al. (2017a); (41) Villanova et al. (2017); (42) Lee (2007); (43) Cohen (1981); (44) Marino et al. (2009); (45) O’Malley et al. (2017); (46) Soto et al. (2017); (47) Yong et al. (2008); (48) Carretta et al. (2010b); (49) Carretta et al. (2010c); (50) Gratton et al. (2015); (51) Carretta et al. (2007a); (52) Kacharov et al. (2014); (53) Carretta et al. (2014a); (54) Kraft et al. (1998); (55) Yong et al. (2014b); (56) Cohen & Melendez (2005a); (57) Milone et al. (2017); (58) Cohen & Kirby (2012) (59) Mucciarelli et al. (2012); (60) Beccari et al. (2013); (61) Frank et al. (2015); (62) Geisler (1988); (63) Smith & Bell (1986); (64) Johnson et al. (2013); (65) Hanke et al. (2017); (66) Barbuy et al. (2016); (67) Koch et al. (2009); (68) Çalışkan et al. (2012); (69) Cohen (2004); (70) Pancino et al. (2010); (71) Salinas & Strader (2015); (72) Tautvaišienė et al. (2004); (73) Sbordone et al. (2005); (74) Villanova et al. (2013); (75) Sakari et al. (2011); (76) Bragaglia et al. (2014); (77) Cunha et al. (2015) (); (78) Geisler et al. (2012); (79) Bragaglia et al. (2012); (80) Donati et al. (2014) (); (81) Cantat-Gaudin et al. (2014b) (); (82) Magrini et al. (2015) (); (83) Overbeek et al. (2017) (); (84) Tang et al. (2017b) (); (85) Souto et al. (2016) (); (86) Overbeek et al. (2015); (87) De Silva et al. (2007); (88) Böcek Topcu et al. (2015); (89) Randich et al. (2006).
| Cluster | [Fe/H] | LogMass | LogAge | MP? | Ref for MPs |
|---|---|---|---|---|---|
| LMC NGC1786 | -1.87 | 5.57 | 10.18 | Y | 1 |
| LMC NGC2210 | -1.97 | 5.48 | 10.20 | Y | 1 |
| LMC NGC2257 | -1.63 | 5.41 | 10.20 | Y | 1 |
| SMC NGC121 | -1.71 | 5.55 | 10.08 | Y | 2,3 |
| FNX Fnx1 | -2.5 | 4.57 | 10.16 | Y | 4,5 |
| FNX Fnx2 | -2.1 | 5.26 | 10.16 | Y | 4,5 |
| FNX Fnx3 | -2.3 | 5.56 | 10.06 | Y | 4,5 |
| FNX Fnx5 | -2.1 | 5.25 | 10.17 | P | 5 |
| SMC Lindsay1 | -1.35 | 5.35 | 9.90 | P | 6,7 |
| SMC NGC339 | -1.50 | 5.02 | 9.89 | P | 7 |
| SMC NGC416 | -1.41 | 5.27 | 9.84 | P | 7 |
| SMC NGC419 | 9.18 | N | 8 | ||
| LMC NGC1978 | 5 | 9.3 | N,P | 9,10 | |
| LMC NGC1651 | -0.37 | 5.24 | 9.30 | N | 9 |
| LMC NGC1806 | -0.6 | 5.03 | 9.22 | N | 11 |
| LMC NGC1783 | N | 9 | |||
| LMC NGC1866 | -0.50 | 4.63 | 8.12 | N | 12 |
| LMC NGC2173 | -0.24 | 5.06 | 9.33 | N | 9 |
References. (1) Mucciarelli et al. (2009); (2) Dalessandro et al. (2016); (3) P: Niederhofer et al. (2017a); (4) Letarte et al. (2006); (5) P: Larsen et al. 2014; (6) CN: Hollyhead et al. (2017); (7) P: Niederhofer et al. (2017b); (8) Martocchia et al. (2017a) (phot.); (9) N: Mucciarelli et al. (2008); (10) P: Martocchia et al. (2017b); (11) Mucciarelli et al. (2014); (12) Mucciarelli et al. (2011);
Acknowledgements.
This research has made use of Vizier and SIMBAD, operated at CDS, Strasbourg, France, NASA’s Astrophysical Data System, and TOPCAT (http://www.starlink.ac.uk/topcat/). The Guide Star Catalogue-II is a joint project of the Space Telescope Science Institute and the Osservatorio Astronomico di Torino. Space Telescope Science Institute is operated by the Association of Universities for Research in Astronomy, for the National Aeronautics and Space Administration under contract NAS5-26555. The participation of the Osservatorio Astronomico di Torino is supported by the Italian Council for Research in Astronomy. Additional support is provided by European Southern Observatory, Space Telescope European Coordinating Facility, the International GEMINI project, and the European Space Agency Astrophysics Division. This publication makes use of data products from the Two Micron All Sky Survey, which is a joint project of the University of Massachusetts and the Infrared Processing and Analysis Center/California Institute of Technology, funded by the National Aeronautics and Space Administration and the National Science Foundation. Some of the data presented in this paper were obtained from the Mikulski Archive for Space Telescopes (MAST). STScI is operated by the Association of Universities for Research in Astronomy, Inc., under NASA contract NAS5-26555. Support for MAST for non-HST data is provided by the NASA Office of Space Science via grant NNX09AF08G and by other grants and contracts.References
- Alonso et al. (1999) Alonso, A., Arribas, S., & Martínez-Roger, C. 1999, A&AS, 140, 261
- Alonso et al. (2001) Alonso, A., Arribas, S., & Martínez-Roger, C. 2001, A&A, 376, 1039
- Anthony-Twarog & Twarog (1985) Anthony-Twarog, B. J., & Twarog, B. A. 1985, ApJ, 291, 595
- Barbuy et al. (2016) Barbuy, B., Cantelli, E., Vemado, A., et al. 2016, A&A, 591, A53
- Askar et al. (2017) Askar, A., Bianchini, P., de Vita, R., et al. 2017, MNRAS, 464, 3090
- Bastian et al. (2013) Bastian, N., Lamers, H. J. G. L. M., de Mink, S. E., et al. 2013, MNRAS, 436, 2398
- Bastian & Lardo (2015) Bastian, N., & Lardo, C. 2015, MNRAS, 453, 357
- Bastian et al. (2015) Bastian, N., Cabrera-Ziri, I., & Salaris, M. 2015, MNRAS, 449, 3333
- Beccari et al. (2013) Beccari, G., Bellazzini, M., Lardo, C., et al. 2013, MNRAS, 431, 1995
- Boberg et al. (2015) Boberg, O. M., Friel, E. D., & Vesperini, E. 2015, ApJ, 804, 109
- Boberg et al. (2016) Boberg, O. M., Friel, E. D., & Vesperini, E. 2016, ApJ, 824, 5
- Böcek Topcu et al. (2015) Böcek Topcu, G., Afşar, M., Schaeuble, M., & Sneden, C. 2015, MNRAS, 446, 3562
- Bragaglia et al. (2001) Bragaglia, A., Carretta, E., Gratton, R. G., et al. 2001, AJ, 121, 327
- Bragaglia et al. (2012) Bragaglia, A., Gratton, R. G., Carretta, E., et al. 2012, A&A, 548, AA122
- Bragaglia et al. (2014) Bragaglia, A., Sneden, C., Carretta, E., et al. 2014, ApJ, 796, 68
- Bragaglia et al. (2015) Bragaglia, A., Carretta, E., Sollima, A., et al. 2015, A&A, 538, A69
- Çalışkan et al. (2012) Çalışkan, Ş., Christlieb, N., & Grebel, E. K. 2012, A&A, 537, A83
- Cantat-Gaudin et al. (2014a) Cantat-Gaudin, T., Donati, P., Pancino, E., et al. 2014a, A&A, 562, AA10
- Cantat-Gaudin et al. (2014b) Cantat-Gaudin, T., Vallenari, A., Zaggia, S., et al. 2014b, A&A, 569, A17
- Carretta (2006) Carretta, E. 2006, AJ, 131, 1766
- Carretta (2016) Carretta, E. 2016, arXiv:1611.04728
- Carretta & Gratton (1997) Carretta, E., & Gratton, R. G. 1997, A&AS, 121, 95
- Carretta et al. (2007a) Carretta, E., Bragaglia, A., Gratton, R. G., Lucatello, S., & Momany, Y. 2007a, A&A, 464, 927
- Carretta et al. (2007b) Carretta, E., Bragaglia, A., Gratton, R. G., et al. 2007b, A&A, 464, 939
- Carretta et al. (2007c) Carretta, E., Bragaglia, A., Gratton, R. G., et al. 2007, A&A, 464, 967
- Carretta et al. (2009a) Carretta, E., Bragaglia, A., Gratton, R. G., et al. 2009a, A&A, 505, 117
- Carretta et al. (2009b) Carretta, E., Bragaglia, A., Gratton, R.G., Lucatello, S. 2009b, A&A, 505, 139
- Carretta et al. (2009c) Carretta, E., Bragaglia, A., Gratton, R.G., D’Orazi, V., Lucatello, S. 2009c, A&A, 508, 695
- Carretta et al. (2010a) Carretta, E., Bragaglia, A., Gratton, R.G., Recio-Blanco, A., Lucatello, S., D’Orazi, V., Cassisi, S. 2010a, A&A, 516, 55
- Carretta et al. (2010b) Carretta, E., Bragaglia, A., Gratton, R. G., et al. 2010b, ApJ, 714, L7
- Carretta et al. (2010c) Carretta, E., Bragaglia, A., Gratton, R. G., et al. 2010c, A&A, 520, A95
- Carretta et al. (2010d) Carretta, E., Gratton, R. G., Lucatello, S., et al. 2010d, ApJ, 722, L1
- Carretta et al. (2011a) Carretta, E., Lucatello, S., Gratton, R. G., Bragaglia, A., & D’Orazi, V. 2011a, A&A, 533, A69
- Carretta et al. (2011b) Carretta, E., Bragaglia, A., Gratton, R., D’Orazi, V., & Lucatello, S. 2011b, A&A, 535, AA121
- Carretta et al. (2013b) Carretta, E., Bragaglia, A., Gratton, R. G., et al. 2013b, A&A, 557, A138
- Carretta et al. (2014a) Carretta, E., Bragaglia, A., Gratton, R. G., et al. 2014a, A&A, 561, AA87
- Carretta et al. (2014b) Carretta, E., Bragaglia, A., Gratton, R. G., et al. 2014b, A&A, 564, AA60
- Carretta et al. (2015) Carretta, E., Bragaglia, A., Gratton, R. G., et al. 2015, A&A, 478, AA116
- Carretta et al. (2017) Carretta, E., Bragaglia, A., Lucatello, S., et al. 2017, A&A, 600, A118
- Cohen (1978) Cohen, J. G. 1978, ApJ, 223, 487
- Cohen (1981) Cohen, J. G. 1981, ApJ, 247, 869
- Cohen (2004) Cohen, J. G. 2004, AJ, 127, 1545
- Cohen & Melendez (2005a) Cohen, J. G., & Melendez, J. 2005a, AJ, 129, 1607
- Cohen & Meléndez (2005b) Cohen, J. G., & Meléndez, J. 2005b, AJ, 129, 303
- Cohen & Kirby (2012) Cohen, J. G., & Kirby, E. N. 2012, ApJ, 760, 86
- Cunha et al. (2015) Cunha, K., Smith, V. V., Johnson, J. A., et al. 2015, ApJ, 798, L41
- Dalessandro et al. (2012) Dalessandro, E., Schiavon, R. P., Rood, R. T., et al. 2012, AJ, 144, 126
- Dalessandro et al. (2016) Dalessandro, E., Lapenna, E., Mucciarelli, A., et al. 2016, ApJ, 829, 77
- Decressin et al. (2007) Decressin, T., Charbonnel, C., & Meynet, G. 2007, A&A, 475, 859
- De Mink et al. (2009) de Mink, S. E., Pols, O. R., Langer, N., & Izzard, R. G. 2009, A&A, 507, L1
- Denisenkov & Denisenkova (1989) Denisenkov, P. A., & Denisenkova, S. N. 1989, Astronomicheskij Tsirkulyar, 1538, 11
- Denissenkov & Hartwick (2014) Denissenkov, P. A., & Hartwick, F. D. A. 2014, MNRAS, 437, L21
- De Silva et al. (2007) De Silva, G. M., Freeman, K. C., Asplund, M., et al. 2007, AJ, 133, 1161
- Donati et al. (2014) Donati, P., Cantat Gaudin, T., Bragaglia, A., et al. 2014, A&A, 561, A94
- Feltzing et al. (2009) Feltzing, S., Primas, F., & Johnson, R. A. 2009, A&A, 493, 913
- Frank et al. (2015) Frank, M. J., Koch, A., Feltzing, S., et al. 2015, A&A, 581, A72
- Geisler (1988) Geisler, D. 1988, PASP, 100, 687
- Geisler et al. (2012) Geisler, D., Villanova, S., Carraro, G., et al. 2012, ApJ, 756, L40
- Gilmore et al. (2012) Gilmore, G., Randich, S., Asplund, M., et al. 2012, The Messenger, 147, 25
- Gratton (1988) Gratton, R.G. 1988, Rome Obs. Preprint Ser. 29
- Gratton et al. (1999) Gratton, R. G., Carretta, E., Eriksson, K., & Gustafsson, B. 1999, A&A, 350, 955
- Gratton et al. (2003) Gratton, R. G., Carretta, E., Claudi, R., Lucatello, S., & Barbieri, M. 2003, A&A, 404, 187
- Gratton et al. (2004) Gratton, R., Sneden, C., & Carretta, E. 2004, ARA&A, 42, 385
- Gratton et al. (2006) Gratton, R. G., Lucatello, S., Bragaglia, A., et al. 2006, A&A, 455, 271
- Gratton et al. (2007) Gratton, R. G., Lucatello, S., Bragaglia, A., et al. 2007, A&A, 464, 953
- Gratton et al. (2010) Gratton, R. G., Carretta, E., Bragaglia, A., Lucatello, S., & D’Orazi, V. 2010, A&A, 517, AA81
- Gratton et al. (2012) Gratton, R.G., Carretta, E., Bragaglia, A. 2012, A&A Rev., 20, 50
- Gratton et al. (2015) Gratton, R. G., Lucatello, S., Sollima, A., et al. 2015, A&A, 573, A92
- Gunn & Griffin (1979) Gunn, J. E., & Griffin, R. F. 1979, AJ, 84, 752
- Halford & Zaritsky (2015) Halford M., Zaritsky D., 2015, ApJ, 815, 86
- Hanke et al. (2017) Hanke, M., Koch, A., Hansen, C. J., & McWilliam, A. 2017, A&A, 599, A97
- Harris (1996) Harris, W. E. 1996, AJ, 112, 1487
- Hesser et al. (1986) Hesser, J. E., Shawl, S. J., & Meyer, J. E. 1986, PASP, 98, 403
- Hollyhead et al. (2017) Hollyhead, K., Kacharov, N., Lardo, C., et al. 2017, MNRAS, 465, L39
- Johnson et al. (2006) Johnson, J. A., Ivans, I. I., & Stetson, P. B. 2006, ApJ, 640, 801
- Johnson & Pilachowski (2010) Johnson, C. I., & Pilachowski, C. A. 2010, ApJ, 722, 1373
- Johnson et al. (2013) Johnson, C. I., Rich, R. M., Pilachowski, C. A., & Kunder, A. M. 2013, American Astronomical Society Meeting Abstracts #221, 221, 250.19
- Johnson et al. (2015) Johnson, C. I., Rich, R. M., Pilachowski, C. A., et al. 2015, AJ, 150, 63
- Johnson et al. (2016) Johnson, C. I., Caldwell, N., Rich, R. M., Pilachowski, C. A., & Hsyu, T. 2016, AJ, 152, 21
- Johnson et al. (2017) Johnson, C. I., Caldwell, N., Rich, R. M., et al. 2017, ApJ, 842, 24
- Kacharov et al. (2014) Kacharov, N., Bianchini, P., Koch, A., et al. 2014, A&A, 567, A69
- Kayser et al. (2008) Kayser, A., Hilker, M., Grebel, E. K., & Willemsen, P. G. 2008, A&A, 486, 437
- King (1966) King, I. R. 1966, AJ, 71, 64
- Koch & McWilliam (2014) Koch, A., & McWilliam, A. 2014, A&A, 565, A23
- Koch et al. (2009) Koch, A., Côté, P., & McWilliam, A. 2009, A&A, 506, 729
- Kraft et al. (1992) Kraft, R. P., Sneden, C., Langer, G. E., & Prosser, C. F. 1992, AJ, 104, 645
- Kraft et al. (1998) Kraft, R. P., Sneden, C., Smith, G. H., Shetrone, M. D., & Fulbright, J. 1998, AJ, 115, 1500
- Krause et al. (2016) Krause, M. G. H., Charbonnel, C., Bastian, N., & Diehl, R. 2016, A&A, 587, A53
- Kurucz (1993) Kurucz, R. 1993, ATLAS9 Stellar Atmosphere Programs and 2 km/s grid. Kurucz CD-ROM No. 13. Cambridge, Mass.: Smithsonian Astrophysical Observatory, 1993., 13,
- Langer et al. (1993) Langer, G. E., Hoffman, R., & Sneden, C. 1993, PASP, 105, 301
- Lapenna et al. (2015) Lapenna, E., Mucciarelli, A., Ferraro, F. R., et al. 2015, ApJ, 813, 97
- Larsen et al. (2012) Larsen, S. S., Brodie, J. P., & Strader, J. 2012, A&A, 546, A53
- Larsen et al. (2014) Larsen, S. S., Brodie, J. P., Grundahl, F., & Strader, J. 2014, ApJ, 797, 15
- Lata et al. (2002) Lata, S., Pandey, A. K., Sagar, R., & Mohan, V. 2002, A&A, 388, 158
- Leaman et al. (2013) Leaman, R., VandenBerg, D. A., & Mendel, J. T. 2013, MNRAS, 436, 122
- Lee (2007) Lee, J.-W. 2007, Revista Mexicana de Astronomia y Astrofisica Conference Series, 28, 120
- Lee (2015) Lee, J.-W. 2015, ApJS, 219, 7
- Leon et al. (2000) Leon, S., Meylan, G., & Combes, F. 2000, A&A, 359, 907
- Letarte et al. (2006) Letarte, B., Hill, V., Jablonka, P., et al. 2006, A&A, 453, 547
- Liller (1980) Liller, M. H. 1980, AJ, 85, 1480
- Maccarone & Zureck (2012) Maccarone, T. J., & Zurek, D. R. 2012, MNRAS, 423, 2
- Mackey & Gilmore (2003a) Mackey, A. D., & Gilmore, G. F. 2003a, MNRAS, 338, 85
- Mackey & Gilmore (2003b) Mackey, A. D., & Gilmore, G. F. 2003b, MNRAS, 338, 120
- Mackey & Gilmore (2003c) Mackey, A. D., & Gilmore, G. F. 2003c, MNRAS, 340, 175
- MacLean et al. (2015) MacLean, B. T., De Silva, G. M., & Lattanzio, J. 2015, MNRAS, 446, 3556
- Magain (1984) Magain, P. 1984, A&A, 134, 189
- Magrini et al. (2015) Magrini, L., Randich, S., Donati, P., et al. 2015, A&A, 580, A85
- Majewski et al. (2016) Majewski, S. R., APOGEE Team, & APOGEE-2 Team 2016, Astronomische Nachrichten, 337, 863
- Marín-Franch et al. (2009) Marín-Franch, A., Aparicio, A., Piotto, G., et al. 2009, ApJ, 694, 1498
- Marino et al. (2009) Marino, A. F., Milone, A. P., Piotto, G., et al. 2009, A&A, 505, 1099
- Marino et al. (2011) Marino, A. F., Milone, A. P., Piotto, G., et al. 2011, ApJ, 731, 64
- Marino et al. (2015) Marino, A. F., Milone, A. P., Karakas, A. I., et al. 2015, MNRAS, 450, 815
- Martell et al. (2008) Martell, S. L., Smith, G. H., & Briley, M. M. 2008, AJ, 136, 2522
- Martocchia et al. (2017a) Martocchia, S., Bastian, N., Usher, C., et al. 2017a, MNRAS, 468, 3150
- Martocchia et al. (2017b) Martocchia, S., Cabrera-Ziri, I., Lardo, C., et al. 2017b, MNRAS, submitted
- Massari et al. (2016) Massari, D., Lapenna, E., Bragaglia, A., et al. 2016, MNRAS, 458, 4162
- McLaughlin & van der Marel (2005) McLaughlin, D. E., & van der Marel, R. P. 2005, ApJS, 161, 304
- Mészáros et al. (2015) Mészáros, S., Martell, S. L., Shetrone, M., et al. 2015, AJ, 149, 153
- Milone et al. (2012a) Milone, A. P., Piotto, G., Bedin, L. R., et al. 2012a, ApJ, 744, 58
- Milone et al. (2014) Milone, A. P., Marino, A. F., Dotter, A., et al. 2014, ApJ, 785, 21
- Milone et al. (2017) Milone, A. P., Piotto, G., Renzini, A., et al. 2017, MNRAS, 464, 3636
- Monelli et al. (2013) Monelli, M., Milone, A. P., Stetson, P. B., et al. 2013, MNRAS, 431, 2126
- Mucciarelli et al. (2008) Mucciarelli, A., Carretta, E., Origlia, L., & Ferraro, F. R. 2008, AJ, 136, 375
- Mucciarelli et al. (2009) Mucciarelli, A., Origlia, L., Ferraro, F. R., & Pancino, E. 2009, ApJ, 695, L134
- Mucciarelli et al. (2011) Mucciarelli, A., Cristallo, S., Brocato, E., et al. 2011, MNRAS, 413, 837
- Mucciarelli et al. (2012) Mucciarelli, A., Bellazzini, M., Ibata, R., et al. 2012, MNRAS, 426, 2889
- Mucciarelli et al. (2013) Mucciarelli, A., Bellazzini, M., Catelan, M., et al. 2013, MNRAS, 435, 3667
- Mucciarelli et al. (2014) Mucciarelli, A., Dalessandro, E., Ferraro, F. R., Origlia, L., & Lanzoni, B. 2014, ApJ, 793, L6
- Mucciarelli et al. (2016) Mucciarelli, A., Dalessandro, E., Massari, D., et al. 2016, ApJ, 824, 73
- Muñoz et al. (2017) Muñoz, C., Villanova, S., Geisler, D., et al. 2017, arXiv:1705.02684
- Niederhofer et al. (2017a) Niederhofer, F., Bastian, N., Kozhurina-Platais, V., et al. 2017a, MNRAS, 464, 94
- Niederhofer et al. (2017b) Niederhofer, F., Bastian, N., Kozhurina-Platais, V., et al. 2017b, MNRAS, 465, 4159
- Odenkirchen et al. (2001) Odenkirchen, M., Grebel, E. K., Rockosi, C. M., et al. 2001, ApJ, 548, L165
- O’Malley et al. (2017) O’Malley, E. M., Kniazev, A., McWilliam, A., Chaboyer, B. 2017, arXiv:1706.06962
- Overbeek et al. (2015) Overbeek, J. C., Friel, E. D., Jacobson, H. R., et al. 2015, AJ, 149, 15
- Overbeek et al. (2017) Overbeek, J. C., Friel, E. D., Donati, P., et al. 2017, A&A, 598, A68
- Pancino et al. (2010) Pancino, E., Rejkuba, M., Zoccali, M., & Carrera, R. 2010, A&A, 524, A44
- Pancino et al. (2017) Pancino, E., Romano, D., Tang, B., et al. 2017, A&A, 601, A112
- Pasquini et al. (2002) Pasquini, L., Avila, G., Blecha, A., et al. 2002, The Messenger, 110, 1
- Piotto et al. (2015) Piotto, G., Milone, A. P., Bedin, L. R., et al. 2015, AJ, 149, 91
- Pryor & Meylan (1993) Pryor, C., & Meylan, G. 1993, Structure and Dynamics of Globular Clusters, 50, 357
- Randich et al. (2006) Randich, S., Sestito, P., Primas, F., Pallavicini, R., & Pasquini, L. 2006, A&A, 450, 557
- Roederer et al. (2016) Roederer, I. U., Mateo, M., Bailey, J. I., et al. 2016, MNRAS, 455, 2417
- Rosenberg et al. (1999) Rosenberg, A., Aparicio, A., Saviane, I., & Piotto, G. 2000, A&AS, 145, 451
- Rosenberg et al. (2000) Rosenberg, A., Saviane, I., Piotto, G., & Aparicio, A. 1999, AJ, 118, 2306
- Rutledge et al. (1997a) Rutledge, G. A., Hesser, J. E., Stetson, P. B., et al. 1997a, PASP, 109, 883
- Rutledge et al. (1997b) Rutledge, G. A., Hesser, J. E., & Stetson, P. B. 1997b, PASP, 109, 907
- Sakari et al. (2011) Sakari, C. M., Venn, K. A., Irwin, M., et al. 2011, ApJ, 740, 106
- Salinas & Strader (2015) Salinas, R., & Strader, J. 2015, ApJ, 809, 169
- San Roman et al. (2015) San Roman, I., Muñoz, C., Geisler, D., et al. 2015, A&A, 579, A6
- Sarajedini (1994) Sarajedini, A. 1994, PASP, 106, 404
- Sarajedini et al. (2007) Sarajedini, A., Bedin, L. R., Chaboyer, B., et al. 2007, AJ, 133, 1658
- Sbordone et al. (2005) Sbordone, L., Bonifacio, P., Marconi, G., Buonanno, R., & Zaggia, S. 2005, A&A, 437, 905
- Schiavon et al. (2017) Schiavon, R. P., Johnson, J. A., Frinchaboy, P. M., et al. 2017, MNRAS, 466, 1010
- Skrutskie et al. (2006) Skrutskie, M. F., et al. 2006, AJ, 131, 1163
- Smith & Bell (1986) Smith, G. H., & Bell, R. A. 1986, AJ, 91, 1121
- Smith et al. (2002) Smith, G. H., Sneden, C., & Kraft, R. P. 2002, AJ, 123, 1502
- Smith et al. (2013) Smith, G. H., Modi, P. N., & Hamren, K. 2013, PASP, 125, 1287
- Smith (2015) Smith, G. H. 2015, PASP, 127, 1204
- Smolinsky et al. (2011) Smolinski, J. P., Martell, S. L., Beers, T. C., & Lee, Y. S. 2011, AJ, 142, 126
- Sollima et al. (2012) Sollima, A., Nipoti, C., Mastrobuono Battisti, A., Montuori, M., & Capuzzo-Dolcetta, R. 2012, ApJ, 744, 196
- Soto et al. (2017) Soto, M., Bellini, A., Anderson, J., et al. 2017, AJ, 153, 19
- Souto et al. (2016) Souto, D., Cunha, K., Smith, V., et al. 2016, ApJ, 830, 35
- Stetson & Pancino (2008) Stetson, P. B., & Pancino, E. 2008, PASP, 120, 1332
- Tang et al. (2017a) Tang, B., Geisler, D., Friel, E., et al. 2017a, A&A, 601, A56
- Tang et al. (2017b) Tang, B., Cohen, R. E., Geisler, D., et al. 2017b, MNRAS, 465, 19
- Tautvaišienė et al. (2004) Tautvaišienė, G., Wallerstein, G., Geisler, D., Gonzalez, G., Charbonnel, C. 2004, AJ, 127, 373
- Testa et al. (2001) Testa, V., Corsi, C. E., Andreuzzi, G., et al. 2001, AJ, 121, 916
- VandenBerg et al. (2013) VandenBerg, D. A., Brogaard, K., Leaman, R., & Casagrande, L. 2013, ApJ, 775, 134
- Venn et al. (2004) Venn, K. A., Irwin, M., Shetrone, M. D., et al. 2004, AJ, 128, 1177
- Ventura et al. (2001) Ventura, P., D’Antona, F., Mazzitelli, I., & Gratton, R. 2001, ApJ, 550, L65
- Villanova et al. (2013) Villanova, S., Geisler, D., Carraro, G., Moni Bidin, C., & Muñoz, C. 2013, ApJ, 778, 186
- Villanova et al. (2016) Villanova, S., Monaco, L., Moni Bidin, C., & Assmann, P. 2016, MNRAS, 460, 2351
- Villanova et al. (2017) Villanova, S., Moni Bidin, C., Mauro, F., Munoz, C., & Monaco, L. 2017, MNRAS, 464, 2730
- Yong et al. (2008) Yong, D., Meléndez, J., Cunha, K., et al. 2008, ApJ, 689, 1020-1030
- Yong et al. (2014a) Yong, D., Alves Brito, A., Da Costa, G. S., et al. 2014a, MNRAS, 439, 2638
- Yong et al. (2014b) Yong, D., Roederer, I. U., Grundahl, F., et al. 2014b, MNRAS, 441, 3396
- Zinn & West (1984) Zinn, R., & West, M.J. 1984, ApJS, 55, 45