Ab initio calculations of ultra-short carrier dynamics in 2D materials: valley depolarization in single-layer WSe2
Abstract
In single-layer WSe2, a paradigmatic semiconducting transition metal dichalcogenide, a circularly polarized laser field can selectively excite electronic transitions in one of the inequivalent valleys. Such selective valley population corresponds to a pseudospin polarization. This can be used as a degree of freedom in a “valleytronic” device provided that the time scale for its depolarization is sufficiently large. Yet, the mechanism behind the valley depolarization still remains heavily debated. Recent time–dependent Kerr experiments have provided an accurate way to visualize the valley dynamics by measuring the rotation of a linearly polarized probe pulse applied after a circularly polarized pump pulse. We present here a clear, accurate and parameter–free description of the valley dynamics. By using an atomistic, ab initio approach we fully disclose the elemental mechanisms that dictate the depolarization effects. Our results are in excellent agreement with recent time–dependent Kerr experiments. We explain the Kerr dynamics and its temperature dependence in terms of electron–phonon mediated processes that induce spin–flip inter–valley transitions.
keywords:
Valley physics, 2D materials, carrier dynamics, time-dependent Kerr rotation spectroscopyThe semiconducting transition metal dichalcogenides (TMDs) are layered materials with a two–dimensional honeycomb crystal structure and a peculiar electronic structure: in the single-layer, the direct band gap located at the corners of the hexagonal Brillouin zone gives rise to two inequivalent valleys1, 2, 3, and . An electron/hole being able to move between these two valleys can be described as a two–component pseudo–spinor. Therefore, the valley degree of freedom is also known as pseudospin, a new quantum number that distinguishes between carriers in different valleys4. The pseudospin is able to carry information and, also, to generate a valley Hall effect5, 6, turning TMDs into promising building blocks of the new emerging field of valleytronics and potential valleytronic–based devices.7
The generation and persistence8, 9, 10, 11 of a carrier imbalance between valleys is the key requirement for the efficient use of the pseudospin12, 13, 4. Ultrafast spectroscopy is an advanced and accurate experimental technique able to investigate the pseudospin real–time dynamics14, identifying the key mechanisms that drive the valley depolarization. Time-dependent Kerr rotation spectroscopy (TD-KERR) measures the Kerr angle, which is directly proportional to the valley polarization.15, 16, 17 The TD-KERR experiments on TMDs18, 19 show very different decay times of the valley polarization, spanning from pico to nanoseconds. The large difference has been tentatively attributed to intrinsic doping or localized defect states.9
While both theoretical models and first–principles simulations have described the key physical properties of TMDs and how valley polarization is induced by circularly polarized pulses, the microscopic understanding of the subsequent valley depolarization is still strongly debated, despite the numerous experimental data available. 20, 21, 22, 23, 24, 25
One of the most renowned mechanism proposed in the literature to explain the valley depolarization is the electron-hole exchange (eh-X) mechanism22. In the eh-X case the circularly polarized pump pulse is assumed to excite an independent electron–hole pair in a single valley. This pair is subsequently scattered to the other valley via virtual transitions caused by the bare electron–hole exchange interaction. Temperature is introduced by assuming that the initial pairs are distributed according to a Boltzmann distribution at a given temperature 25. In the eh-X mechanism the out–of–equilibrium dynamics of the material is reduced to the solution of the equation of motion for a 22 matrix and the scattering part of the dynamics is introduced using adjustable, ad–hoc lifetimes.26
Although appealing, the eh-X approach is based on a crucial approximation. The initial non-equilibrium state, which should mimic the state after the action of the pump pulse, is assumed to be uncorrelated. However, it is well known that the optical properties of TMDs are characterized by a strong electron-hole interaction27, 28. This is easily visualized in the optical spectrum of WSe2, dominated by excitonic peaks that are composed by several, correlated and coherent electron–hole pairs 29, 30. Thus the electron–hole exchange interaction should not be considered on the uncorrelated state, but on the correlated state created by the pump. To this end a correct modeling should include the pump pulse in the simulation.
Such a coherent approach, where excitonic effects are included from the beginning together with realistic scattering mechanisms, does exist. It is based on an atomistic description of the material and it is rooted on the well–know merging of Many–Body techniques with Density–Functional–Theory 31 (also known as ab initio approaches). An ab initio non–equilibrium dynamics is not based on a simplified model and on adjustable parameters. All ingredients of the method are calculated from the very elementary atomic structure of the material. This make ab initio approaches predictive. Therefore, an ab initio simulation can provide a quantitative result and thus a convincing answer to the mechanism which drives the valley depolarization in TMDs.
Such a non–equilibrium ab initio simulation must, however, include several key ingredients to be accurate and convincing. First of all, both the pump pulse and the scattering mechanism need to be included in a first–principles manner and going beyond simple models based on parameters extracted a posteriori from the experimental results. Second, electronic correlation needs to be included to account for the strong electron–hole interaction during the absorption of the pump pulse. Finally, the spin–orbit interaction also needs to be fully described to couple the spin and pseudospin polarization dynamics 13, 7. In this work we use such a set of theoretical and numerical tools to model the valley depolarization in two–dimensional TMDs in a clear and convincing way.
We consider a TD–KERR experiment performed on a single layer WSe2 (see Fig. 1 and 2). The Kerr angle shows a clear exponential decay, with a lifetime that increases as the temperature drops and reaches a low–temperature plateau. We use an ab initio implementation of the Kadanoff–Baym out–of–equilibrium equations to describe the dynamics in a Kohn–Sham basis. Our theoretical simulations describe the creation of a valley polarization and perfectly reproduce its experimental decay, which allows us to give a complete and exhaustive explanation of the physics involved. We find that the valley depolarization is mainly caused by spin–flip transitions mediated by electron–phonon interaction. We also successfully explain the temperature dependence of the Kerr angle.
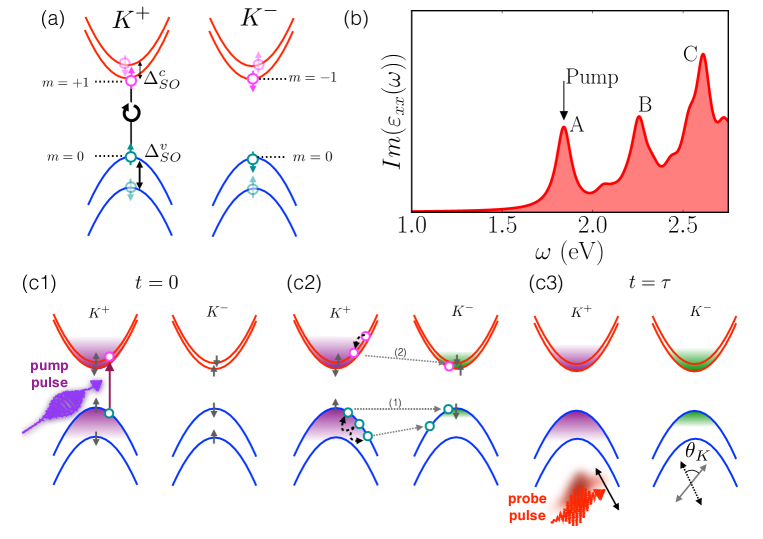
An atomistic approach to the Time–dependent Kerr effect. In a prototype TD-KERR experiment (Fig. 1.(c1-c3)), a sharp circularly polarized laser pulse is used to pump the material by photo–exciting electrons to the empty conduction states (step c1), creating the carrier imbalance at the inequivalent valleys2, 3, 32, 33. Circularly polarized light mainly excites electron–hole pairs in a given valley, as summarized in Fig. 1(a). While selection rules impose spin conservation, the azimuthal quantum number () changes from in valence to () in conduction at () when left (right) circularly polarized light is used, respectively1. The imbalance between the valley population entails a slight magnetization of the layer, responsible for the Kerr angle rotation. After a time delay , the system is probed with a second weak field, linearly polarized. If there is a finite valley polarization, i. e., the carrier imbalance persists, the probe axis will be rotated by an angle (steps c3).
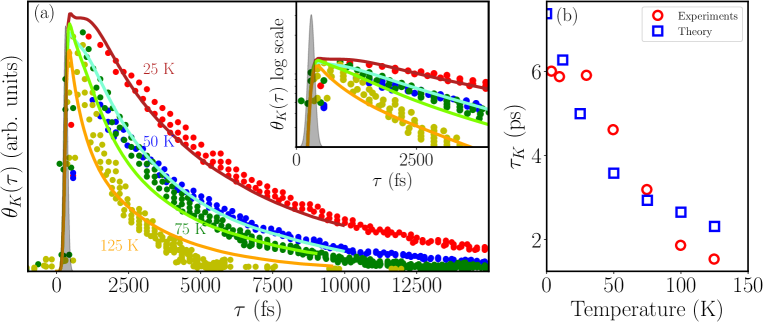
The TD-KERR experiment on WSe2 single layer18 (see Fig. 2) clearly shows that the Kerr angle decays exponentially, with a dependence on the delay that can be well described by a lifetime of the order of a few pico–seconds (ps). The lifetime decreases with temperature. We aim to find the cause of this decay and how to describe the temperature dependence.
Our approach is based on a fully ab initio framework that merges the non–equilibrium Green’s function (NEGF) theory with the well–known Density Functional Theory (DFT) (See Methods in Supporting Information). DFT is used to calculate all ingredients of the NEGF dynamics: the electronic and phononic states, the electron–phonon, electron–electron and electron–photon scattering amplitudes.
As it will become clear in the following, the speed of the valley depolarization is strongly influenced by the spin–orbit coupling (SOC) of the electronic bands near (see Fig. 1 (a)). In particular, the SOC of the valence band maximum is very strong ( eV) and leads to opposite spin polarization of the VB maxima in the valleys. This slows down considerably the electron-phonon mediated scattering of holes between the valleys. The fact that means that the SOC impact on the electron dynamics is much less pronounced. In any case, a careful simulation of TD–KERR dynamics requires a precise calculation of the band structure using full spinorial wave functions.
The time–dependent dynamics is obtained by solving the Kadanoff–Baym equation (KBE) for the time evolution of the single–time density–matrix, . is written in the Kohn–Sham basis for the electron–hole pairs, . Here (and ) are spinorial band indices and is the crystal momentum. The KBE34, 35, 36, 37 reads
| (1) |
where are the coherent/collision terms of the dynamics, respectively.
The interaction with the pump pulse. The term describes the interaction of the pump laser with the system and embodies correlation effects induced by the electron–electron interaction. It is approximated within the statically screened exchange approximation 38 that describes correctly excitonic effects coherently with the well–known and widely used Bethe–Salpeter equation 31. The present form of has been shown to be reliable in several works about out–of–equilibrium dynamics 39, 36, 40 and non–linear optical properties 41, 42, 43.
The first step in the simulation of the TD-KERR spectra is to calculate the optical absorption. Neglecting the collision term, from the solution of the KBE, the frequency dependent dielectric function can be extracted by Fourier transform (Fig. 1(b)). This corresponds to a calculation of the absorption spectrum with the static Bethe–Salpeter equation 38. The spectrum shows a clear excitonic peak , and a secondary peak . The splitting is induced by the large SOC splitting of the valence bands of single–layer WSe2 27, in Fig. 1(a). The good description of the optical properties ensures that the pump pulse is correctly absorbed.
The experimental TD–KERR spectra we want to reproduce18 are measured with a circularly polarized laser pump pulse2 with 100 fs full width at half maximum of the envelope profile. The pump intensity is kWm2 and it is energetically centered on the exciton. The experimental intensity corresponds to a maximum carrier density of 10-12 cm-2 and allows us to work in the low–intensity regime, formally defined in Refs. 36, 37.
Valley polarization dynamics: electron–phonon–mediated spin–flips. The driving force of the dynamics is carried by the collision term . It describes dephasing and scattering induced by electron–phonon (and possibly electron–electron and electron–photon ) processes, and it permits a clear estimation of their role and interaction with the spin and pseudospin polarizations. Temperature in our work enters naturally via the Bose distribution of the phonons. It affects the interaction with the pump, as discussed in Ref. 44, and the subsequent dynamics, as established in Refs. 34 and 45. Equation (1) has been derived from the very general KBE by using a series of approximations that we have summarized in the Methods section of the Supporting Information and that has been extensively discussed in Refs. 34, 37. The collision term has been used to describe inter–valley scattering in Silicon 35 and the complex interplay between dissipation and correlation in the ultra–fast formation of Fermi distributions 35 of the photo–excited carriers.
The time dependent density matrix, solution of Eq. (1), provides the non–equilibrium (NEQ) occupations of the electronic levels, as a function of the delay time
| (2) |
From the NEQ occupations we can calculate several time–dependent observables. Our strategy relies on the idea that the physics we are interested in occurs in a time window that does not overlap with the pump laser pulse. Therefore we are in a quasi–adiabatic regime46, where the density–matrix off–diagonal matrix elements have been dephased and are zero. All physical observables can be made time–dependent by expressing them in terms of the time–dependent occupation functions. This approach has been successfully applied to the dielectric tensor 36 (with ) and used to describe the transient absorption experiments in MoS239 and bulk Silicon36.
The time and temperature dependent Kerr signal. In the TD-KERR spectra the typical order of magnitude of the Kerr angle is milliradians 19. In this small-angle limit, the Kerr angle is directly related to the non-diagonal matrix elements of the dielectric function by the equation 47
| (3) |
with the probe frequency. The spin in the Kerr angle enters via the SOC coupling between spin and the spatial part of the wave function47. The dielectric function is expressed as
| (4) |
with the optical dipole matrix elements, the difference between the electronic occupations and the difference between the electronic energies. The off-diagonal term, i.e. is non-zero only if there is a breaking of symmetry which, in the present case, is induced by the circularly polarized pump pulse. It is worth to notice that the dielectric function is here defined “per surface unit”, with the surface factors absorbed in the definition of the dipoles. Our approach fully accounts for the contributions of SOC and the difference in valley occupation contribution to the Kerr angle. The calculated is compared with the experiment results of Ref. 18 in Fig. 2. As in the experiment we tune the probe frequency to , i.e. the maximum of , just after the pump pulse. The decay of the simulated Kerr signal is simultaneous with the end of the pump pulse (see Supporting Information for details). We obtain a good agreement if we fit the theoretical Kerr curves with a single exponential, as represented in Fig. 2(b). The predicted nicely agrees with the experimental results in the long time regime for all the measured temperatures, K. We can also see that both theory and experiment exhibit a finite value when K. This finite value is due to the atomic zero–point vibrations. Only in the high temperature regime we observe a deviation for ps.
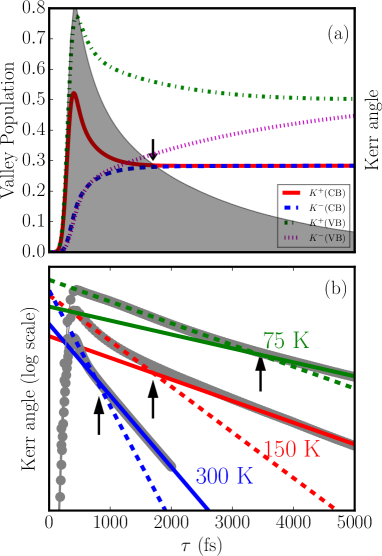
As schematically represented in Fig. 1(c2), the decay of the Kerr angle and of the valley polarization depends on the scattering rates in the valence (VB) and conduction bands (CB). The large difference in the SOC splitting for VB and CB suggests different scattering rates for electrons and holes, which can be visualized as two characteristic lifetimes: one fast, and the other slow, . Fig. 3(a) show the VB and CB valley populations at the inequivalent points for K. The carrier inter–valley scattering is much faster for the CB, compared to the VB. While at 150 K and ps the CB populations are the same and the CB contribution to the pseudospin polarization vanishes, the VB carriers are still slowly moving out of the valley. We can see a clear signature of this different dynamics in the logarithmic representation of the Kerr signal, Fig. 3(b). The values of the fast and slow lifetimes are shown in Table 1. Indeed, the transition from fast to slow decay corresponds exactly to the point where the CB populations are the same and the entire Kerr dynamics is dictated by the slower VB contribution. As a consequence the decay lifetime changes from to . In agreement with the experimental results, with increasing temperature, the transition from fast to slow decay occurs at earlier times. Notice that in the model of Ref. 18 the lifetimes diverge at low temperature, while our calculations capture the finite zero–temperature lifetime. Our approach gives also the full dynamics of the Kerr angle as function of time, in which we observe two different lifetimes, a result which a model based in a single lifetime cannot reproduce. The experimental data shows a very scattered distribution which does not allow a clear identification of the faster dynamics.
| T (K) | (ps) | (ps) |
|---|---|---|
| 75 | 2.59 | 3.73 |
| 150 | 0.89 | 2.50 |
| 300 | 0.37 | 0.75 |
Relaxation paths in the hexagonal Brillouin zone. While the electron–phonon and electron–electron channels can contribute to the inter–valley scattering by using finite momentum phonons and electron–hole pairs (as sketched in Fig. 1(c2)), the electron–photon interaction cannot. Since photon–assisted transitions are vertical in momentum space, photon–assisted inter–valley scattering is unlikely. Experimental data in time-resolved photoluminescence seems to indicate radiative lifetime that increase with temperature.48, 49 The same trend is predicted in ab initio simulations 50. This is in contrast to the trend observed in the TD–KERR experiment. We thus conclude that electron-photon interaction is not relevant in the present context.
We have performed simulations including both electron–electron and electron–phonon interactions. We found the electron–phonon channel to be dominant with the electron–electron scattering only giving a minor contribution. The reason is that the electron–phonon and electron–electron channels have a different dependence on the photo–excited carrier density and energy. Indeed, the electron–electron channel can be split into two terms. The first, or equilibrium term, is activated only when carriers are excited with sufficient energy to generate cascade Auger processes internal to the low–energy valence/conduction bands 34, 51. This is not the case of the present TD–KERR experiment since (bound) electrons and holes are created near the conduction band minimum and valence band maximum. The second term, or non–equilibrium term, does not have any energy constraint but scales either quadratically or with the third power of the carrier density. For increasing number of carriers the electron-electron channel is expected to gain importance. Verification of the role of electron-electron interaction can be done by increasing the pump intensity. In contrast the electron–phonon channel is always active and scales linearly with the density. It is, therefore, dominant in the experimental range of carrier densities (10-12 cm-2, in Ref.18) studied here.
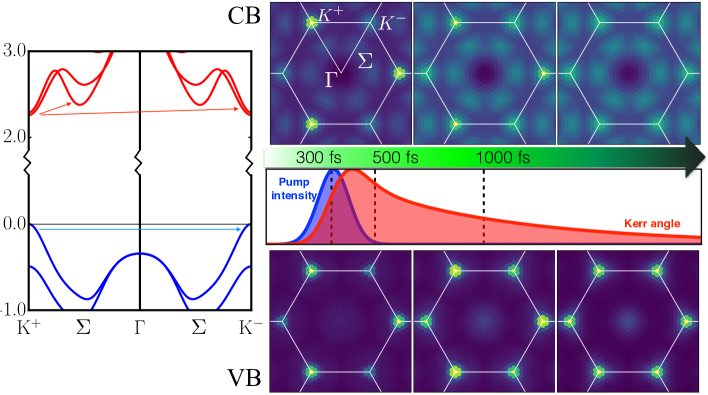
The contrasting CB and VB dynamics can now be fully understood thanks to our microscopic approach. Figure 4 shows the electronic density of the CB and VB as two–dimensional snapshots in -space corresponding to fs and ps. The temperature is K. We have labelled the K± valleys and the high symmetry line. The band structure along is shown in the left frame.
We clearly see that the circularly polarized pump initially populates only the K+ valley thus creating a pseudospin (and spin) polarized excited state. As the delay increases, also the K- valley acquires a finite population but following a different dynamics for the valence and conduction bands. Electrons and holes can jump from one valley to the other following two possible paths: either by (i) direct spin–flip 52 or by (ii) conserving spin and overcoming the SOC splitting which exists between the () state at and the () state at (see Fig. 1 step c2). The conduction band SOC splitting is small ( meV, see Fig. 1) and electrons can easily jump quickly to the K-, emitting phonons without spin–flip in a first instance and then equilibrate the population of the two conduction bands.
On the other hand, the valence band holes have a slower dynamics. The SOC splitting for the VB states at is eV, a barrier which cannot be overcome via the emission of phonons. The only option for a hole at to scatter directly into is to flip its spin. A direct process where the spin is flipped by the emission of a phonon is possible in WSe2 because of the spinorial nature of the electronic states. In practice this means that every electron (and hole) has both an and spin component and a single electronic transition is from a spinor to another and does not, in general, preserve the spin. However such a direct process has a very small transition rate (see SI for the representation of the electron-phonon matrix elements). Therefore, holes follow a very slow dynamics in comparison with electrons even when the temperature is as high as K. We recall here the importance of including full spinorial wave functions. Otherwise the scattering rate of the VB would be similarly fast as the one of the CB. Our simulations show that the point as an intermediate step in the relaxation plays only a very minor role.21. The relative energy between and is 0.35 eV, which makes unlikely such scattering path at experimental temperatures. Acoustic and optical phonon branches contribute with similar weight to the scattering. From Ref. 28 we learned that conduction and valence states around the point couple to both acoustic and optical phonons, consistent with the current results.
The picture provided by the present simulations rules out any other mechanisms based on solely electronic degrees of freedom. We already pointed out, in the introduction, why the electron–hole exchange interaction mechanism 22, 26 alone cannot explain the valley depolarization. The electron–hole exchange interaction is fully included in the term of Eq.(1). But only the scattering term is responsible for the valley depolarization, with the coherent part only describing the correct coupling with the laser pulse. The present simulations, instead, points to a dominant role played by the electron–phonon scattering53.
Conclusions Our ab initio simulations of the TD–KERR angle accurately reproduces the experimental results for all temperatures and time ranges. The use of an atomistic approach allows us to explain the mechanisms that drive the dynamics. We demonstrate that the electron–phonon interaction is the driving force of the valley depolarization and motivate the features observed experimentally with a microscopic analysis of the scattering paths of the carriers.
The two key experimental facts are reproduced and explained: (i) electrons and holes tend to equalize the population in the valleys, and (ii) the valley relaxation lifetime drops as the temperature increases.
The photo–excited electrons and holes follow very different dynamics to reach the final equilibrium configuration. Due to the small spin–orbit splitting of the conduction bands near the valley minima and to the presence of several local minima in the Brillouin zone the photo–excited electrons scattering is enhanced and the carriers are quickly spread over wide regions of the Brillouin zone. On the contrary, the large valence spin–orbit splitting hinders efficient scattering processes. The holes transition is bound to be a slow cascade process, involving mainly direct valley to valley transitions.
The calculated ultra-short valley depolarization times correspond to a comparison with intrinsic or low-doped single-layer WSe2. Similar lifetimes have been observed in intrinsic samples of single-layer Mo219. Differing lifetimes that are attributed to doped samples will be the topic of future work.
The key feature of the present ab initio simulation scheme is the use of a fully spinorial basis. This is a mandatory feature to gain a successful description of the pseudospin dynamics: all ingredients (band structure, vibrational modes, electron–phonon matrix elements) must be calculated including spin–orbit effects. This rules out any use of simplified, few–bands models. A precise, predictive and accurate description requires an atomistic treatment.
The present scheme provides a unique, parameter–free and universal approach to interpret and predict several time–dependent experiments, like time–dependent Kerr, time-dependent photo–reflectance and, in general, any pump-probe technique in the scale of femtoseconds to picoseconds.
Acknowledgements
A. M.-S. and L.W. acknowledge support by the National Research Fund, Luxembourg (Projects C14/MS/773152/FAST-2DMAT and INTER/ANR/13/20/NANOTMD). AM acknowledges the funding received from the European Union project MaX Materials design at the eXascale H2020-EINFRA-2015-1, Grant agreement n. 676598 and Nanoscience Foundries and Fine Analysis - Europe H2020-INFRAIA-2014-2015, Grant agreement n. 654360. The simulations were done using the HPC facilities of the University of Luxembourg 54. The authors declare no competing financial interests.
The Supporting Information contains additional details about the rate equations implemented for the carrier dynamics simulation, the electronic band structure of single-layer WSe2, the time-dependent Kerr spectra and the electron-phonon matrix elements.
References
- Cao et al. 2012 Cao, T.; Wang, G.; Han, W.; Ye, H.; Zhu, C.; Shi, J.; Niu, Q.; Tan, P.; Wang, E.; Liu, B. et al. Nat Commun 2012, 3, 887–
- Mak et al. 2012 Mak, K. F.; He, K.; Shan, J.; Heinz, T. F. Nat Nano 2012, 7, 494–498
- Zeng et al. 2012 Zeng, H.; Dai, J.; Yao, W.; Xiao, D.; Cui, X. Nat Nano 2012, 7, 490–493
- Xu et al. 2014 Xu, X.; Yao, W.; Xiao, D.; Heinz, T. F. Nat Phys 2014, 10, 343–350
- Urbaszek and Marie 2015 Urbaszek, B.; Marie, X. Nat Phys 2015, 11, 94–95
- Lee et al. 2016 Lee, J.; Mak, K. F.; Shan, J. Nat Nano 2016, 11, 421–425
- Schaibley et al. 2016 Schaibley, J. R.; Yu, H.; Clark, G.; Rivera, P.; Ross, J. S.; Seyler, K. L.; Yao, W.; Xu, X. Nature Reviews Materials 2016, 1, 16055–16069
- Glazov et al. 2014 Glazov, M. M.; Amand, T.; Marie, X.; Lagarde, D.; Bouet, L.; Urbaszek, B. Phys. Rev. B 2014, 89, 201302
- Yang et al. 2015 Yang, L.; Sinitsyn, N. A.; Chen, W.; Yuan, J.; Zhang, J.; Lou, J.; Crooker, S. A. Nat Phys 2015, 11, 830–834
- Rivera et al. 2016 Rivera, P.; Seyler, K. L.; Yu, H.; Schaibley, J. R.; Yan, J.; Mandrus, D. G.; Yao, W.; Xu, X. Science 2016, 351, 688–691
- Ye et al. 2016 Ye, Y.; Xiao, J.; Wang, H.; Ye, Z.; Zhu, H.; Zhao, M.; Wang, Y.; Zhao, J.; Yin, X.; Zhang, X. Nat Nano 2016, 11, 598–602
- Rycerz et al. 2007 Rycerz, A.; Tworzydlo, J.; Beenakker, C. W. J. Nat Phys 2007, 3, 172–175
- Xiao et al. 2012 Xiao, D.; Liu, G.-B.; Feng, W.; Xu, X.; Yao, W. Phys. Rev. Lett. 2012, 108, 196802
- Marie and Urbaszek 2015 Marie, X.; Urbaszek, B. Nat Mater 2015, 14, 860–861
- Poellmann et al. 2015 Poellmann, C.; Steinleitner, P.; Leierseder, U.; Nagler, P.; Plechinger, G.; Porer, M.; Bratschitsch, R.; Schuller, C.; Korn, T.; Huber, R. Nat Mater 2015, 14, 889–893
- Nie et al. 2014 Nie, Z.; Long, R.; Sun, L.; Huang, C.-C.; Zhang, J.; Xiong, Q.; Hewak, D. W.; Shen, Z.; Prezhdo, O. V.; Loh, Z.-H. ACS Nano 2014, 8, 10931–10940
- Zhukov et al. 2007 Zhukov, E. A.; Yakovlev, D. R.; Bayer, M.; Glazov, M. M.; Ivchenko, E. L.; Karczewski, G.; Wojtowicz, T.; Kossut, J. Phys. Rev. B 2007, 76, 205310
- Zhu et al. 2014 Zhu, C. R.; Zhang, K.; Glazov, M.; Urbaszek, B.; Amand, T.; Ji, Z. W.; Liu, B. L.; Marie, X. Phys. Rev. B 2014, 90, 161302
- Dal Conte et al. 2015 Dal Conte, S.; Bottegoni, F.; Pogna, E. A. A.; De Fazio, D.; Ambrogio, S.; Bargigia, I.; D’Andrea, C.; Lombardo, A.; Bruna, M.; Ciccacci, F. et al. Phys. Rev. B 2015, 92, 235425
- Winnerl et al. 2011 Winnerl, S.; Orlita, M.; Plochocka, P.; Kossacki, P.; Potemski, M.; Winzer, T.; Malic, E.; Knorr, A.; Sprinkle, M.; Berger, C. et al. Phys. Rev. Lett. 2011, 107, 237401
- Mai et al. 2014 Mai, C.; Barrette, A.; Yu, Y.; Semenov, Y. G.; Kim, K. W.; Cao, L.; Gundogdu, K. Nano Letters 2014, 14, 202–206
- Yu and Wu 2014 Yu, T.; Wu, M. W. Phys. Rev. B 2014, 89, 205303
- Glazov et al. 2015 Glazov, M. M.; Ivchenko, E. L.; Wang, G.; Amand, T.; Marie, X.; Urbaszek, B.; Liu, B. L. physica status solidi (b) 2015, 252, 2349–2362
- Sie et al. 2015 Sie, E. J.; McIver, J. W.; Lee, Y.-H.; Fu, L.; Kong, J.; Gedik, N. Nat Mater 2015, 14, 290–294
- Hao et al. 2016 Hao, K.; Moody, G.; Wu, F.; Dass, C. K.; Xu, L.; Chen, C.-H.; Sun, L.; Li, M.-Y.; Li, L.-J.; MacDonald, A. H. et al. Nat Phys 2016, 12, 677–682
- Maialle et al. 1993 Maialle, M. Z.; de Andrada e Silva, E. A.; Sham, L. J. Phys. Rev. B 1993, 47, 15776–15788
- Molina-Sánchez et al. 2015 Molina-Sánchez, A.; Hummer, K.; Wirtz, L. Surface Science Reports 2015, 70, 554 – 586
- Molina-Sánchez et al. 2016 Molina-Sánchez, A.; Palummo, M.; Marini, A.; Wirtz, L. Phys. Rev. B 2016, 93, 155435
- Cudazzo et al. 2011 Cudazzo, P.; Tokatly, I. V.; Rubio, A. Phys. Rev. B 2011, 84, 085406
- Latini et al. 2015 Latini, S.; Olsen, T.; Thygesen, K. S. Phys. Rev. B 2015, 92, 245123
- Onida et al. 2002 Onida, G.; Reining, L.; Rubio, A. Rev. Mod. Phys. 2002, 74, 601–659
- Wu et al. 2013 Wu, S.; Ross, J. S.; Liu, G.-B.; Aivazian, G.; Jones, A.; Fei, Z.; Zhu, W.; Xiao, D.; Yao, W.; Cobden, D. et al. Nat Phys 2013, 9, 149–153
- Xie and Cui 2016 Xie, L.; Cui, X. Proceedings of the National Academy of Sciences 2016, 113, 3746–3750
- Marini 2013 Marini, A. Journal of Physics: Conference Series 2013, 427, 012003
- Sangalli and Marini 2015 Sangalli, D.; Marini, A. EPL (Europhysics Letters) 2015, 110, 47004
- Sangalli et al. 2016 Sangalli, D.; Dal Conte, S.; Manzoni, C.; Cerullo, G.; Marini, A. Phys. Rev. B 2016, 93, 195205
- de Melo and Marini 2016 de Melo, P. M. M. C.; Marini, A. Phys. Rev. B 2016, 93, 155102
- Attaccalite et al. 2011 Attaccalite, C.; Grüning, M.; Marini, A. Phys. Rev. B 2011, 84, 245110
- Pogna et al. 2016 Pogna, E. A. A.; Marsili, M.; Fazio, D. D.; Conte, S. D.; Manzoni, C.; Sangalli, D.; Yoon, D.; Lombardo, A.; Ferrari, A. C.; Marini, A. et al. ACS Nano 2016, 10, 1182–1188
- Perfetto et al. 2016 Perfetto, E.; Sangalli, D.; Marini, A.; Stefanucci, G. Phys. Rev. B 2016, 94, 245303
- Grüning and Attaccalite 2014 Grüning, M.; Attaccalite, C. Phys. Rev. B 2014, 89, 081102
- Attaccalite and Grüning 2013 Attaccalite, C.; Grüning, M. Phys. Rev. B 2013, 88, 235113
- Attaccalite et al. 2015 Attaccalite, C.; Nguer, A.; Cannuccia, E.; Grüning, M. Phys. Chem. Chem. Phys. 2015, 17, 9533–9540
- Marini 2008 Marini, A. Phys. Rev. Lett. 2008, 101, 106405
- Sangalli and Marini 2015 Sangalli, D.; Marini, A. Journal of Physics: Conference Series 2015, 609, 012006
- Perfetto et al. 2015 Perfetto, E.; Sangalli, D.; Marini, A.; Stefanucci, G. Phys. Rev. B 2015, 92, 205304
- Sangalli et al. 2012 Sangalli, D.; Marini, A.; Debernardi, A. Phys. Rev. B 2012, 86, 125139
- Zhang et al. 2015 Zhang, X.-X.; You, Y.; Zhao, S. Y. F.; Heinz, T. F. Phys. Rev. Lett. 2015, 115, 257403
- Robert et al. 2016 Robert, C.; Lagarde, D.; Cadiz, F.; Wang, G.; Lassagne, B.; Amand, T.; Balocchi, A.; Renucci, P.; Tongay, S.; Urbaszek, B. et al. Phys. Rev. B 2016, 93, 205423
- Palummo et al. 2015 Palummo, M.; Bernardi, M.; Grossman, J. C. Nano Letters 2015, 15, 2794–2800
- Bernardi et al. 2014 Bernardi, M.; Vigil-Fowler, D.; Lischner, J.; Neaton, J. B.; Louie, S. G. Phys. Rev. Lett. 2014, 112, 257402
- 52 In the strict sense, spin is only a good quantum number exactly at and . In the region surrounding and , the electron/hole states are not exact eigenspinors of , making possible such a spin-flip transition.
- Kioseoglou et al. 2016 Kioseoglou, G.; Hanbicki, A. T.; Currie, M.; Friedman, A. L.; Jonker, B. T. Scientific Reports 2016, 6, 25041–
- Varrette et al. 2014 Varrette, S.; Bouvry, P.; Cartiaux, H.; Georgatos, F. Management of an Academic HPC Cluster: The UL Experience. Proc. of the 2014 Intl. Conf. on High Performance Computing & Simulation (HPCS 2014). Bologna, Italy, 2014; pp 959–967