The Nature of Deeply Buried Ultraluminous Infrared Galaxies:
A Unified Model for Highly Obscured Dusty Galaxy Emission
Abstract
We present models of deeply buried ultraluminous infrared galaxy (ULIRG) spectral energy distributions (SEDs) and use them to construct a three-dimensional diagram for diagnosing the nature of observed ULIRGs. Our goal is to construct a suite of SEDs for a very simple model ULIRG structure, and to explore how well this simple model can (by itself) explain the full range of observed ULIRG properties. We use our diagnostic to analyze archival Spitzer Space Telescope IRS spectra of ULIRGs and find that: (1) In general, our model does provide a comprehensive explanation of the distribution of mid-IR ULIRG properties; (2) 75% (in some cases 100%) of the bolometric luminosities of the most deeply buried ULIRGs must be powered by a dust-enshrouded active galactic nucleus; (3) an unobscured “keyhole” view through 10% of the obscuring medium surrounding a deeply buried ULIRG is sufficient to make it appear nearly unobscured in the mid-IR; and (4) the observed absence of deeply buried ULIRGs with large PAH equivalent widths is naturally explained by our models showing that deep absorption features are “filled-in” by small quantities of foreground unobscured PAH emission (e.g., from the host galaxy disk) at the level of 1% the bolometric nuclear luminosity. The modeling and analysis we present will also serve as a powerful tool for interpreting the high angular resolution spectra of high-redshift sources to be obtained with the James Webb Space Telescope.
Subject headings:
galaxies: active — galaxies: ISM — galaxies: starburst — infrared: galaxies1. Introduction
With , Ultraluminous Infrared Galaxies (ULIRGs) emit more in the infrared than typical galaxies emit at all wavelengths combined. This implies that ULIRGs contain a powerful, often unresolved, central source covered by of dust (Marshall et al. 2007; da Cunha et al. 2010) that captures the bulk of the outgoing radiation from the central source(s) and reprocesses it into the infrared. The exact origin of the central emission in ULIRGs has been the subject of debate for years and can plausibly be attributed only to accretion onto a supermassive black hole (i.e., an AGN) and/or powerful bursts of star formation. Since the central radiation is mostly (or completely) obscured by the surrounding dust, unprocessed X-ray or UV photons providing direct evidence about the nature of the central engine are generally unavailable. But since such infrared-luminous galaxies are believed to be the largest contributors to the far-IR background and star-formation energy density at – (Blain et al. 2002; Elbaz & Cesarsky 2003; Murphy et al. 2011; Magnelli et al. 2013), an accurate diagnosis of the mechanism by which their power is generated is critical for obtaining an accurate picture of the star-formation and galaxy evolution history of the universe. Thus, astronomers have shifted their attention to searching the indirect evidence about the nature of the obscured central source that can be gleaned from reprocessed infrared radiation.
Initial progress towards this goal was made with the Infrared Space Observatory (ISO). Diagnostic diagrams based upon the mid-IR continuum slope, AGN-indicating high-ionization mid-IR emission lines (e.g. [O IV] and [Ne V]), and the strengths of the star-formation-indicating and polycyclic aromatic hydrocarbon (PAH) emission features were constructed to quantify the relative contributions from accretion and star-formation to the bolometric luminosities of a small number of local ULIRGs (e.g. Genzel et al. 1998; Lutz et al. 1998; Laurent et al. 2000; Tran et al. 2001). These observations provided evidence that local ULIRGs are powered primarily by star-formation, but with the fraction of AGN activity increasing with bolometric luminosity.
With its expanded mid-IR coverage and much higher sensitivity, the Infrared Spectrograph (IRS; Houck et al. 2004) on the Spitzer Space Telescope (Werner et al. 2004) has provided an abundance of additional data, including mid-IR spectra of large samples of starburst galaxies (Brandl et al. 2006), AGNs (Hao et al. 2005; Weedman et al. 2005; Schweitzer et al. 2006; Hernán-Caballero et al. 2015), local LIRGs (Armus et al. 2009; Petric et al. 2011; Stierwalt et al. 2013, 2014), ULIRGs (Armus et al. 2006, 2007; Desai et al. 2007; Nardini et al. 2008), and their high-redshift analogs (e.g. Houck et al. 2005; Yan et al. 2005; Lutz et al. 2005; Sajina et al. 2007; Pope et al. 2008; Huang et al. 2009; Kirkpatrick et al. 2012). More recently, the expanded far-IR coverage of the Herschel Space Observatory (Pilbratt et al. 2010) has opened a new window into the far-IR universe and improved our understanding of the cooling of the interstellar medium (ISM) within dusty star-forming galaxies (e.g., Rosenberg et al. 2015; Díaz-Santos et al. 2013, 2014).
While this wealth of additional data has significantly improved our understanding of dust-enshrouded galaxies (e.g., Levenson et al. 2007; Spoon et al. 2007; Díaz-Santos et al. 2010, 2011; Stierwalt et al. 2014), the nature of the class of deeply buried ULIRGs—those whose nuclei are so enshrouded that most or all characteristic AGN emission is obscured—remains elusive. Of particular interest, some of the most obscured ULIRGs with the most extreme silicate absorption features also display, somewhat paradoxically, relatively flat (i.e.,“warm”) mid-infrared slopes. Understanding such an extreme mid-IR spectrum, seen for the first time in IRAS 08572+3915 (Armus et al. 2007), has been the subject of detailed radiative transfer modelling by Efstathiou et al. (2014), which revealed that reproducing the spectrum requires an edge-on inclination and the use of tapered disk models.
The notorious complexity of mid-IR emission from dusty galaxies is both a blessing and a curse: the wealth of features provide numerous possible diagnostic signals, but disentangling individual signals from one another to discern their relationship to the nature of the underlying power source is challenging. In particular, emission from silicate and carbonaceous dust grains heated to different characteristic temperatures, stellar photospheres, PAHs, and atomic and molecular lines—all of which may pass through and be reprocessed by different amounts of obscuring dust—combine to create a diverse variety of ULIRG spectral energy distributions (SEDs). This inherent richness of information, along with the aforementioned difficulty of diagnosing the nature of deeply buried ULIRGs via methods based upon single measurable quantities (such as PAH feature equivalent width or [Ne V] emission line strength), suggests the possibility of a more effective approach based upon the comparison of multiple mid-IR spectral properties to those obtained from a suite of radiative transfer models—such as those presented in this work.
As an added benefit, these models can also provide a powerful tool for exploring the basic geometries of highly obscured nuclei, and should therefore prove to be of great use for analyzing the spectroscopic observations at smaller physical size-scales that will soon be obtained using next-generation observatories such as the James Webb Space Telescope (JWST).
This paper presents our approach for producing model SEDs of deeply buried ULIRGs and provides quantitative tools for investigating the nature of ULIRG nuclei. In §2, we use the radiative transfer code DUSTY (Ivezic et al. 1999) and the observed spectra of low-obscuration starburst galaxies and AGN to construct models of highly obscured ULIRG SEDs that are powered by star-formation, AGN activity, or a combination of both. In §3, we discuss spectral diagnostics and calculate the mid-IR slope, PAH equivalent width, and silicate emission or absorption feature strength for each of our models and for a sample of Spitzer IRS spectra of AGNs, starburst galaxies, and ULIRGs. Finally, in §§4 and 5, we use these values to construct a three-dimensional diagram for diagnosing the nature of deeply buried ULIRG nuclei, and we use this diagnostic to analyze our sample of ULIRGs.
2. Modeling ULIRG SEDs
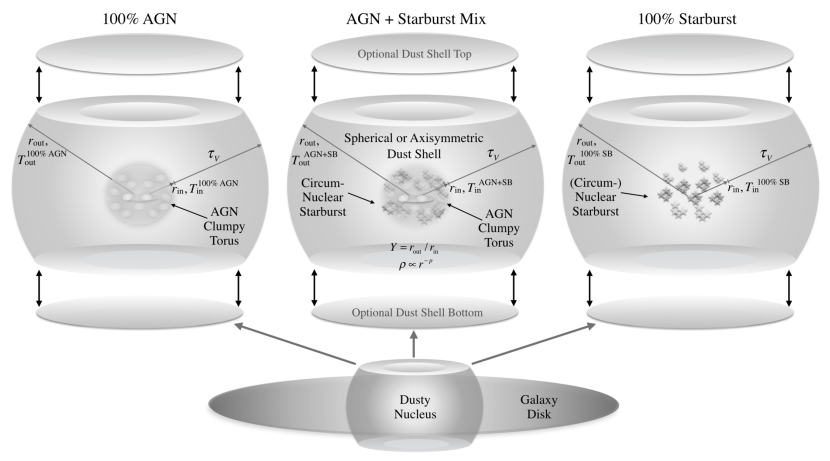
We have developed a method for calculating infrared SEDs of a very simple dust-enshrouded ULIRG structure. As shown in Figure 1, such a system is assumed to be comprised of (1) a central power source buried within an enshrouding shell of dust, and (2) a host galaxy disk. The nuclear component of our model is powered by emission from an AGN, a burst of star formation, or some combination thereof. If the obscuring shell surrounding the nuclear power source(s) is optically thick, spherically symmetric, and smoothly distributed (i.e., not clumpy), direct emission from the central power source(s) cannot be seen along any line of sight outside the shell. If the surrounding dust shell is instead clumpy, or if it is axisymmetric and viewed from a favorable angle, some fraction of the emission from the central power source may escape unimpeded even for lines of sight in which the nuclear power source(s) are generally obscured.
Our radiative transfer solutions and the SEDs derived from them hold for both spherical and (in the situations described below) axial symmetry. This has been discussed previously by Men’shchikov & Henning (1997), where it was shown that the dust temperature distribution in a sphere provides a good approximation to the solution of something as non-spherical as a thick flared disk. Thus, to good approximation, our models are applicable so long as an observer does not have a direct view of the hot inner edge of the obscuring shell (i.e., they must be looking “through” the spherical or axisymmetric dust shell). We note that these simplifying assumptions made in constructing our models mean that detailed properties of some complex axisymmetric or completely asymmetric systems—possibly including the deeply obscured ULIRGs IRAS 08572+3915 (Armus et al. 2007; Rupke & Veilleux 2013) and Arp 220 (e.g., Scoville et al. 2017)—may not be well-represented by our results. However, as demonstrated in this work, we emphasize that despite these limitations, our models provide a powerful tool for exploring the physical properties of the majority of the population of ULIRGs for which adequate data exist.
The following sections provide a detailed description of the assumptions and parameterizations made to model emission from the obscured nucleus (§§2.1, 2.2, and 2.3); the host galaxy disk (§2.4); and ultimately the entire ULIRG (§2.5).
2.1. The ULIRG Central Engine
Buried beneath the obscuring shell of dust at the heart of a ULIRG lies its central AGN and/or starburst power source. Sirocky et al. (2008) found that as long as the emission from this central source is concentrated in the optical/UV, its spectral shape has little effect on the spectrum of emission emerging from a surrounding dust shell. In particular, their Figure 1 shows that the SEDs emitted by dusty obscuring shells with radial are nearly identical for central heating by an A0 star, an AGN, or the optical/UV light from a starburst galaxy. But even if the spectrum of emission from the dust in such a shell is independent of the heating source, the total spectrum obtained by combining the emission from the obscuring dust and the obscured central source is not. The total emission includes light from the dusty obscuring shell as well as the obscured optical, UV, and possibly infrared emission from the various components of the extended central heating source—i.e., the clumpy dusty torus immediately surrounding the AGN accretion disk and/or the dusty knots surrounding (or in close proximity to) newly formed stars. A realistic model of the mid-IR properties of deeply obscured ULIRGs therefore must begin with a realistic model of the emission spectrum responsible for heating the obscuring material.
Since our goal in this paper is not to produce a “first-principles” model of ULIRGs (for examples of such comprehensive “first-principle” approaches see, e.g., Siebenmorgen & Krügel 2007; Rowan-Robinson & Efstathiou 2009; Efstathiou et al. 2014; Siebenmorgen et al. 2015), but is to construct a very simple model that reproduces the spectral properties of as many sources as possible, we choose a phenomenological approach and model the central engine heating sources using linear combinations of a fitted prototype AGN SED and either a low-obscuration or high-obscuration starburst nucleus SED. The quasar PG 0804+761 serves as our prototype AGN, and NGC 7714 and NGC 2623 serve as our prototype low-obscuration and high-obscuration starburst nuclei, respectively. These sources were selected as representative prototypes after carrying out a careful examination of nearly 500 high-quality Spitzer IRS spectra of local galaxies analyzed by our team as part of Spitzer GTO and GO programs.
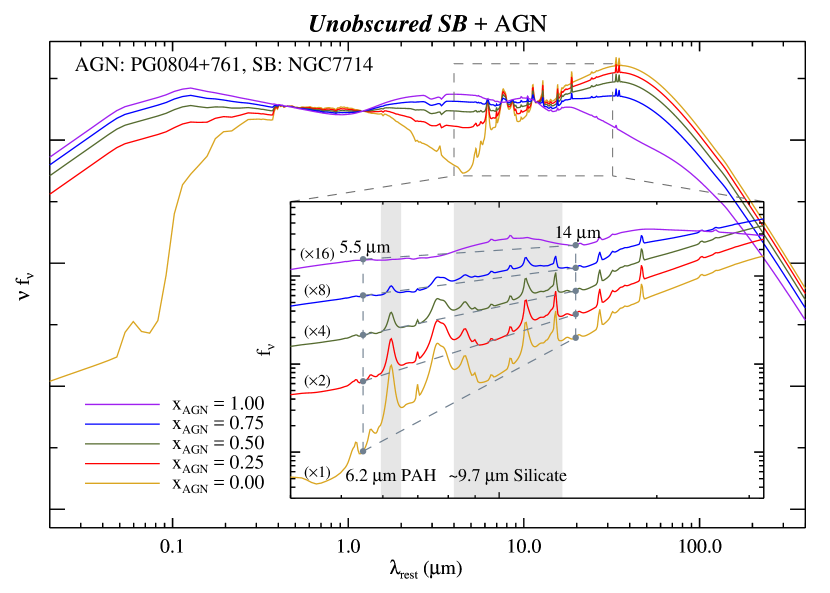
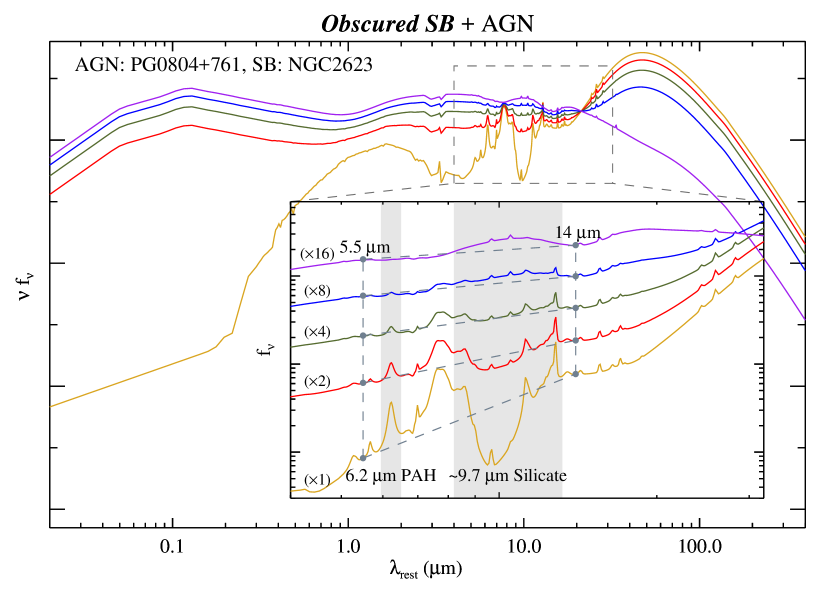
Figure 2 shows the central engine SEDs produced by this linear combination procedure for both the relatively unobscured and more heavily obscured starburst nuclei heating sources (left and right panels, respectively). For each pair of heating sources, we vary the relative contribution from the AGN and starburst—parametrized by , where varies from 0 to 1 for AGN contributions between 0% and 100%—to simulate the full range of potential central engines heating sources.
The fitted SEDs of our prototype AGN and starburst galaxies were derived from the “nuclear” fits from Marshall et al. (2007) in which the far-IR is constrained by Spitzer MIPS photometry extracted over spatial scales that match the Spitzer IRS slit widths as closely as possible to minimize the amount of included host galaxy disk emission. The SEDs of both template starburst galaxies were constructed by subtracting the fitted “cold” dust component from the total fit to further remove any emission from the host galaxy disk. This choice is supported by the detailed analysis presented in that paper where it is shown that the fitted quantity of extinguished optical/UV light for both starburst sources is sufficient to power all but the “cold” dust component. No such procedure was required for the template AGN since its “nuclear” and “global” fits in Marshall et al. (2007) are essentially identical—indicating very little contribution from a host galaxy disk to its total emission.
2.2. The Obscuring Dust Shell
We use the radiative transfer code DUSTY111http://faculty.washington.edu/ivezic/dusty_web/ to calculate the SED of emission emerging from a spherical dust shell surrounding the AGN and/or starburst central heating source(s) of §2.1. DUSTY (Ivezić & Elitzur 1997) calculates the emergent SED after the input radiation is processed and altered via scattering, absorption, and re-emission as it passes through the obscuring dust. Taking full advantage of the scaling properties of the radiative transfer problem, DUSTY requires the minimal set of input parameters for thermal emission from radiatively heated dust. In particular, the only relevant property of the central source is the spectral shape of its radiation—its luminosity is irrelevant (Ivezić & Elitzur 1997).
For the obscuring dust we adopt standard properties of interstellar grains. The grain-size distribution function is from Mathis et al. (1977), although we note that our results are not sensitive to this choice since, as stated in Sirocky et al. (2008), changes in this distribution function significantly affect the emergent SED only at near-IR and shorter wavelengths, and these are shorter than the wavelengths of interest in our analysis. We adopt a 53% silicate and 47% graphite grain composition, and use the optical properties of silicate and graphite grains from Ossenkopf et al. (1992) and Draine (2003), respectively. These choices were adopted from the work of Sirocky et al. (2008) who find that this composition and distribution function best reproduces the observed ratio of the to silicate absorption feature strengths in ULIRGs.
Unlike the models of Siebenmorgen & Krügel (2007) and Rowan-Robinson & Efstathiou (2009), the emission from our obscuring dust shell is devoid of PAH emission (since DUSTY itself does not model stochastic heating of small grains). In light of the fact that we use PAH feature equivalent width as a diagnostic in our analysis, this would appear to be a significant omission. However, as described in detail in §3.2, for the geometrical assumptions of our model, the total PAH emission from a galaxy will be dominated by the PAH emission from our nuclear heating source SEDs, and the obscuring dust shell will not contribute significantly to the total PAH output. In brief, this is because PAH molecules must be bathed in a sufficiently dilute yet sufficiently hard radiation field to emit stochastically. And, as such, PAH molecules within the enshrouding dust shell will not emit significantly since any radiation from the nuclear power source(s) will be devoid of UV/optical photons by the time it reaches them. Of course, it is possible that additional “knots” of star-formation exist within such an obscuring shell—the models presented here all assume a central nuclear power source located within the shell, and thus do not address this possibility.
For the distribution of dust within the shell, we adopt a radial power law, , with a free parameter. As shown in Figure 1, the shell extends from an inner radius , where the dust temperature is , to an outer radius (i.e., is the relative thickness). The actual values of and never enter—only and are relevant, and are specified as input parameters. Specifying the V-band dust optical depth through the shell, , sets the optical depths at all other wavelengths. Given the SED of the input heating source, the solution to our radiative transfer problem is therefore fully determined by the values of only four parameters: (1) the relative thickness of the obscuring dust cloud, ; (2) the exponent, , of the radial dust density distribution; (3) the total (V-band) optical depth, , to the heating source; and (4) the thermal equilibrium temperature, , of the dust at the inner-edge of the obscuring cloud.
We have generated models of ULIRGs with obscuring dust shells of relative thicknesses , 200, and 400 and radial density distributions of , 1, and 2. These choices permit us to investigate a wide range of values spanning the reasonable parameter space for an obscuring nuclear shell. Our models range from optically thin shells () up to = 200. Assuming standard interstellar dust abundance, the shell mass is , where and . The value of is , , and 1 for = 0, 1, and 2, respectively.
With these choices made, we have only to decide upon the assumed equilibrium temperature of dust at the inner-edge of the obscuring shell. As depicted in Figure 1, the inner edge of the shell in our purely AGN-powered model is assumed to be coincident with the clumpy torus surrounding the AGN accretion disk. We assume that the hard radiation from the AGN accretion disk therefore dominates the heating of the obscuring shell and raises its inner edge up to the grain sublimation temperature. Thus, for the case of pure AGN heating, we assume that the dust temperature at the inner-edge of the shell, , is equal to our adopted grain sublimation temperature of 1,000 K. Note that we found little variation in our results for slightly higher assumed sublimation temperatures. For reference, this choice of grain sublimation temperature gives a distance of pc to the inner edge of the obscuring shell in our model (see eq. [1] from Nenkova et al. 2008).
For ULIRGs not powered entirely by an AGN, the choice of the dust shell’s inner edge temperature is less straightforward since the heating source changes from central to fully distributed for a pure starburst (with a combination of both for an AGN/starburst hybrid). Motivated by our desire to build and test a simple yet comprehensive ULIRG model, we assume that although the nature of the heating source changes in going from a pure AGN to a pure starburst-powered system, the geometrical properties of the obscuring shell—in particular, , its physical size—remains constant. This choice can be justified if we assume that: (1) the vast majority of ULIRGs are powered by both star-formation and AGN activity at various points in their histories; (2) the relative strengths of these power sources vary over time; and (3) every ULIRG is AGN-dominated at some point in its history (perhaps just in its nascent phase before significant star-formation begins) even if no AGN activity is currently detectable.
When the ULIRG is in its AGN-dominated phase, dust in close proximity to the accretion disk will sublimate and the inner edge of the obscuring shell will therefore be coincident with the inner edge of the AGN torus. As noted above, for a galaxy of a given luminosity, this assumption sets the physical size of the obscuring shell’s inner edge (2.3 pc for an AGN). Dusty knots of star-formation cannot exist within the cavity bounded by the shell’s inner edge since dust in this region would also sublimate. Thus, as depicted in Figure 1, we assume that star-formation in a ULIRG’s nucleus is distributed around the inner edge of the obscuring shell. In other words, AGN activity clears the cavity and sets its physical dimensions—any subsequent changes in star-formation and/or AGN activity within or along the inner edge of the shell has no effect on the shell’s physical size, but it does change the spectrum of radiation which heats it. While these assumptions certainly do not hold for all ULIRGs, it is reasonable to assume that they hold for a sufficiently high fraction of sources to justify their adoption in our modeling.
In this scenario, a pure starburst’s infrared-dominated SED heats a surrounding shell less efficiently than the UV/optical-dominated SED of a pure AGN (since both are at the same physical distance from the dust222Note that dust along the inner edge of the shell receives the same flux (so is heated to the same temperature) whether stars are symmetrically distributed around the edge of the cavity or all placed at its center. This means that the inner edge dust temperature can be calculated by assuming that all flux from the combined heating spectrum is emitted at the center of the cavity.). For pure starburst heating, the relatively unobscured starburst in our model raises the shell’s inner edge to a temperature of = 580 K, while our obscured starburst heating source (with less UV/optical emission) raises the shell’s inner edge temperature to just = 350 K. Mixtures of the input heating templates shown in Figure 2 produce intermediate dust temperatures: AGN fractions of 75% and 50% yield = 980 K and 885 K for both the low- and high-obscuration starbursts, while an AGN fraction of 25% yields = 760 K and 735 K for the low- and high-obscuration starbursts, respectively.
2.3. ULIRG Nucleus Emission
Our obscured ULIRG nucleus models include emission from both an obscured central heating source having intrinsic (i.e., unobscured) spectral shape, , and reprocessed radiation from a surrounding obscuring dust shell, . In constructing our models of the emission from the ULIRG nucleus, we allow for the possibility that some radiation from the obscured central engine can escape unimpeded through “keyhole” passages in the shell, so that only a fraction, , of the central radiation is captured and reprocessed. The remaining fraction, , emerges unchanged. In the most general case then, the spectral shape of the radiation emerging from the nucleus is itself a mixture:
| (1) |
In this equation, all flux densities are normalized such that . Note that both and depend upon the AGN-fraction of the central heating source, .
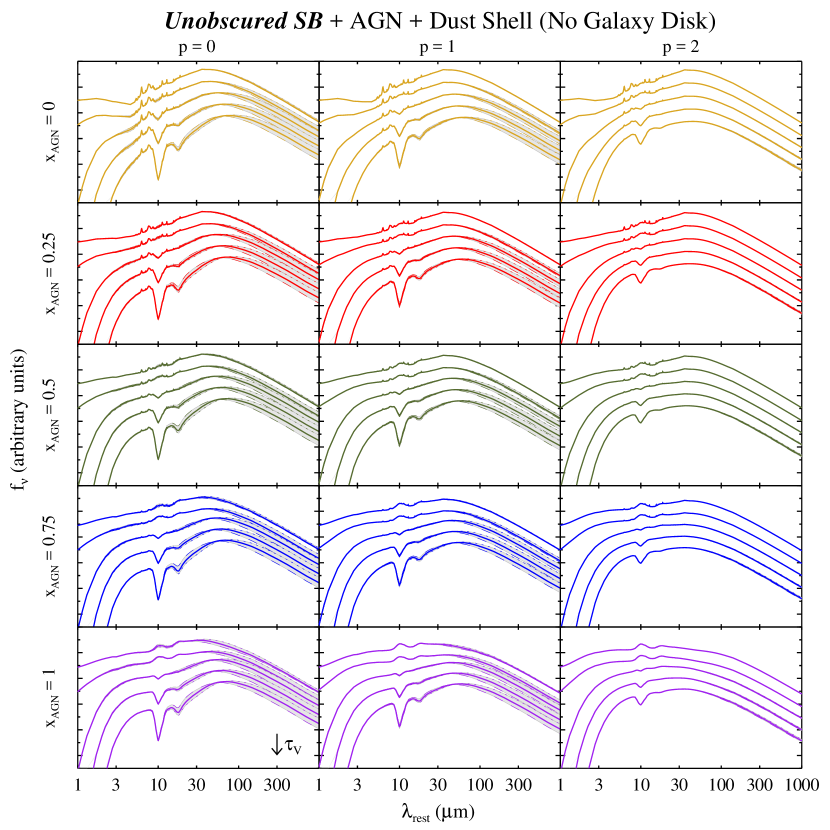
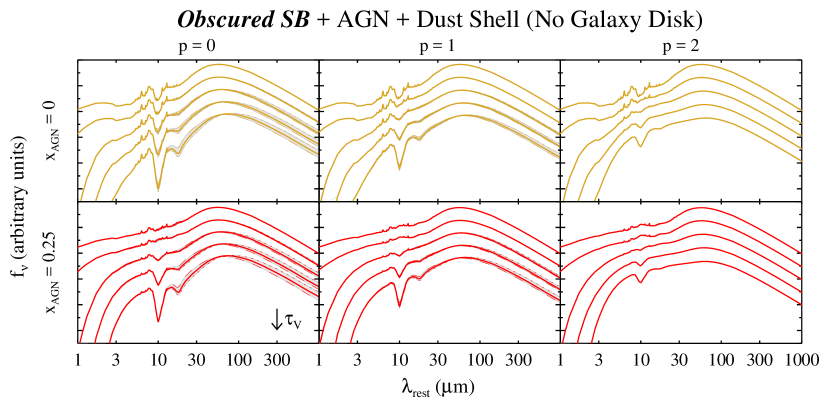
The combined radiation emerging from the nucleus, , is shown in Figure 3 for different combinations of central engine heating sources and dust shell properties. Note that models in Figure 3 are for fully covered geometries () and do not include emission from a host galaxy disk. Related models with host galaxy disk emission are shown in Figure 5, and their relationship to the models in Figure 3 are discussed in §2.5.
2.4. Galaxy Disk Emission
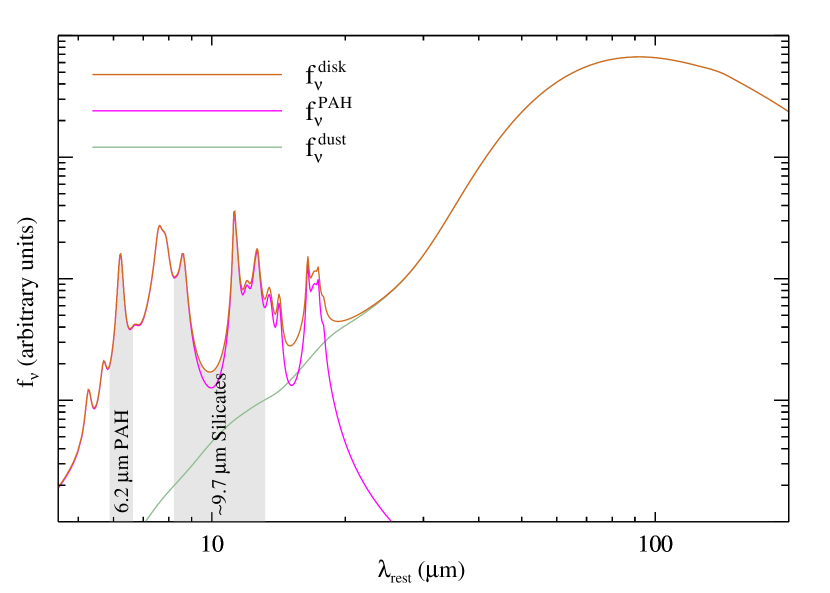
Our model also includes a disk emission component which represents unobscured dust and PAH emission from the extended disk of a ULIRG’s host galaxy. This model, shown in Figure 4, is composed of far-IR thermal dust continuum emission and mid-IR PAH feature emission:
| (2) |
In this equation, all flux densities are normalized such that and is the fraction of the disk component luminosity attributable to PAH emission. For our models, we adopt , a value typical for local star-forming galaxies (Smith et al. 2007).
The normalized flux densities of the model’s two sub-components, and , are derived from the “global” fit to NGC 7714 from Marshall et al. (2007). This fit was performed using large aperture far-IR photometric data and therefore contains significant mid-to-far-IR PAH and dust emission from the host galaxy disk. We adopt the PAH spectrum of NGC 7714 from that fit for our model of the emission from typical unobscured PAHs in host galaxy disks, . We use the “cold” (), “cool” (), and “warm” () dust components from the fit in Marshall et al. (2007) to construct our model of the mid-to-far-IR thermal dust continuum, . The fitted “cool” and “warm” components make up 5% of the total dust luminosity in our model, and are included to provide a low-level continuum beneath the PAH features and to match the observed mid-IR SEDs of regions within typical galactic disks—e.g., the of our model is similar to the slope observed in the coolest (in terms of mid-IR slope) regions of the M31 disk (Hemachandra et al. 2015).
2.5. Total ULIRG Emission
The models described in §2.3 represent the emission from obscured ULIRG nuclei. But the observed SED of an entire ULIRG is composed of both this obscured nuclear emission and the relatively unobscured emission from its host galaxy disk. At the distance to the median galaxy in our observed sample (to be described in §3.4), the SL slit of the Spitzer IRS instrument spans a physical projected size of 10.6 kpc. The portion of the Spitzer IRS spectra of galactic nuclei used in our analysis must, therefore, include a significant contribution from the host galaxy disk. We therefore model the total emission from a ULIRG as the sum of its nuclear emission, , and the emission from its host galaxy disk, .
The monochromatic luminosity of each component can be written as , where is the component’s bolometric luminosity and its normalized spectral shape, . Therefore, the spectral shape of the overall emergent radiation comprised of a mixture of the nuclear and disk components can be written
| (3) |
The luminosities of the two components, and only enter our models through the ratio
| (4) |
where is the starburst component of the nuclear luminosity. is therefore a parameter that characterizes the luminosity of disk star-formation relative to that of the nucleus. Díaz-Santos et al. (2010) show that of the – flux of ULIRGs originates outside an unresolved point source, and that ULIRGs which are stage 4 advanced mergers have extended emission. Based upon these findings and additional results from our modeling described in §5, we adopt a value of throughout this work (i.e., the luminosity of disk star-formation is 10% the nuclear starburst luminosity). We therefore explicitly include contributions from unobscured mid-to-far-IR thermal and PAH emission in all models that have some starburst contribution to the central engine SED (i.e., all models except ).
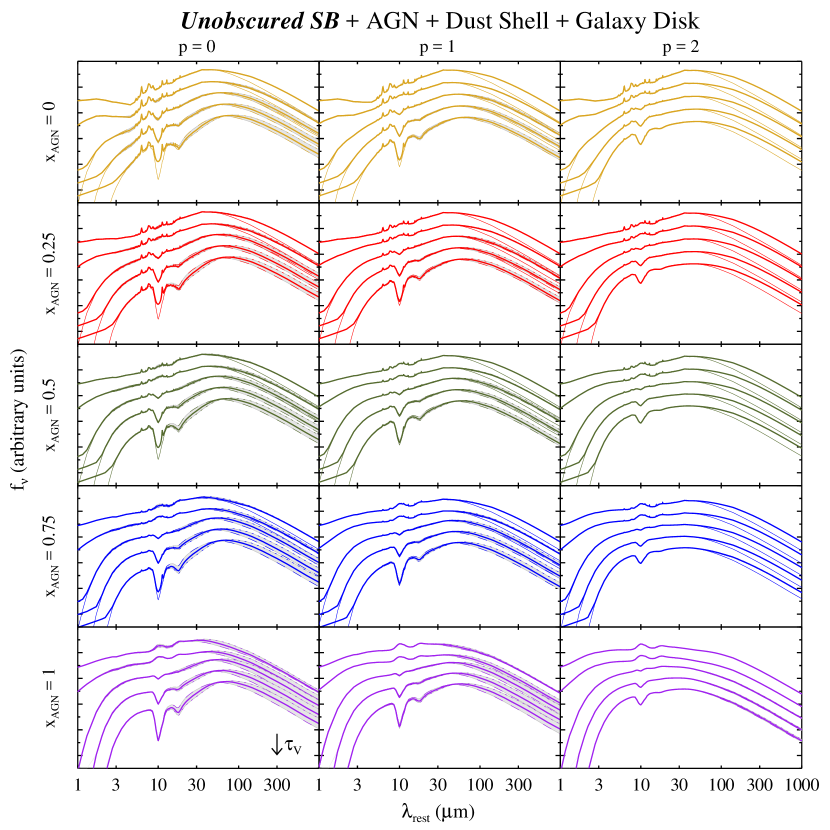
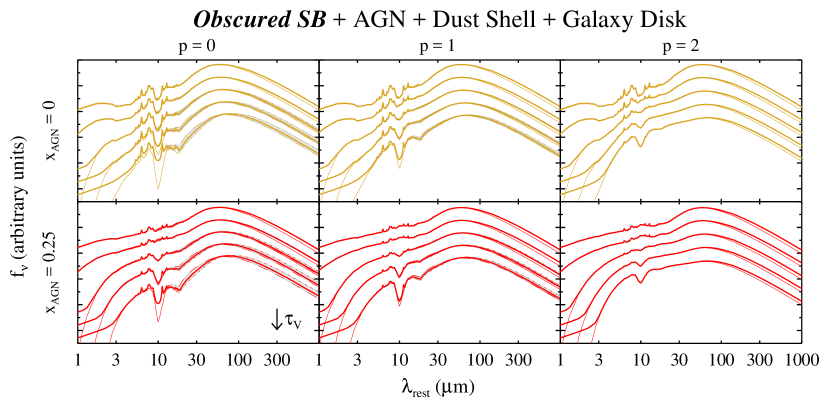
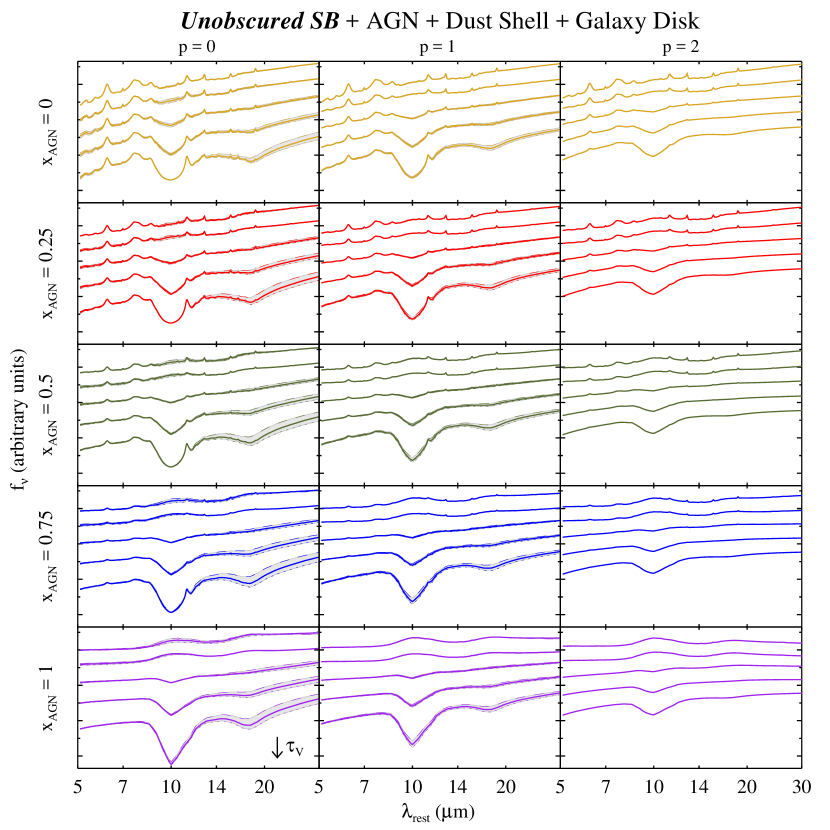
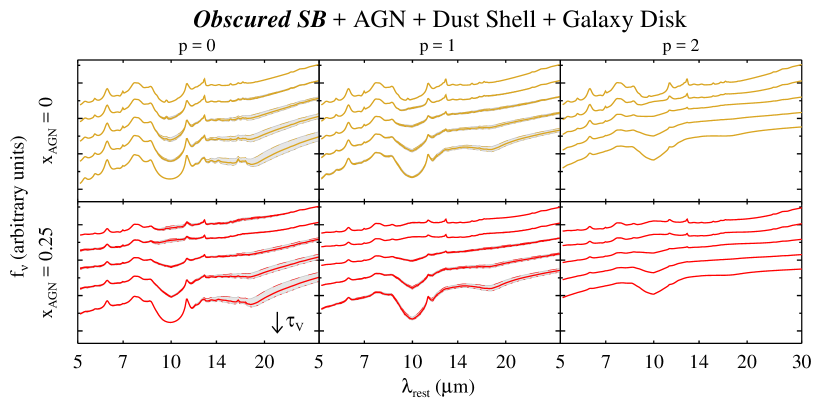
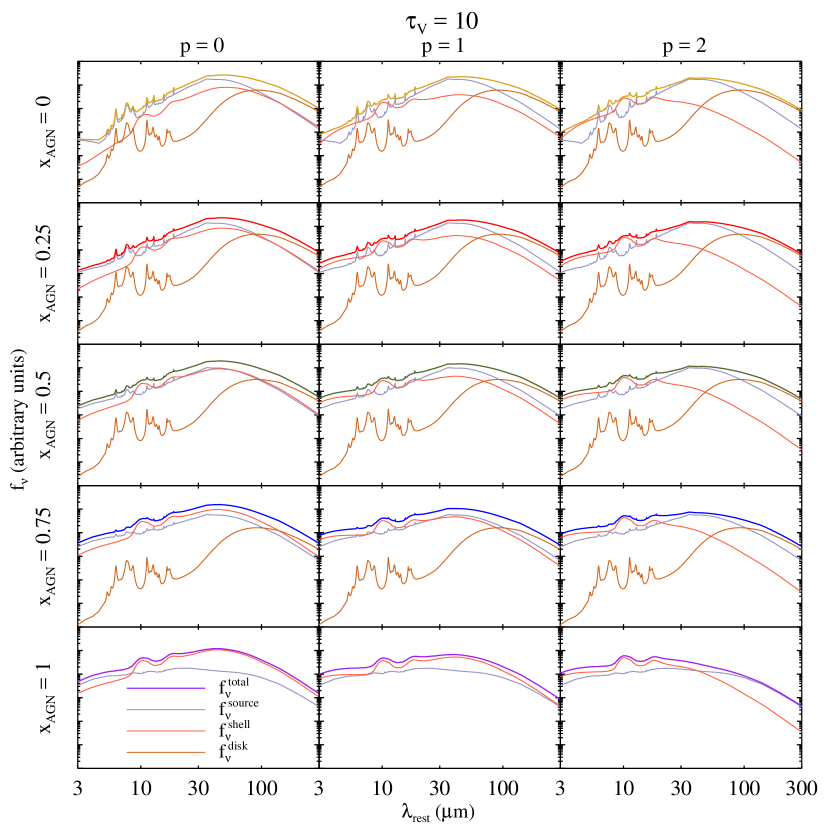
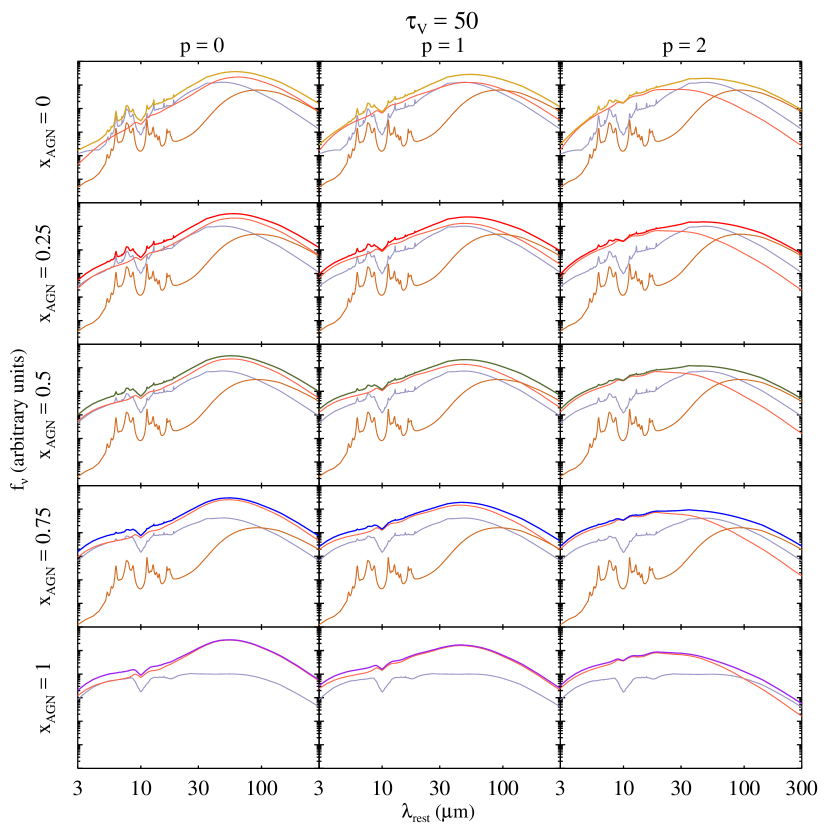
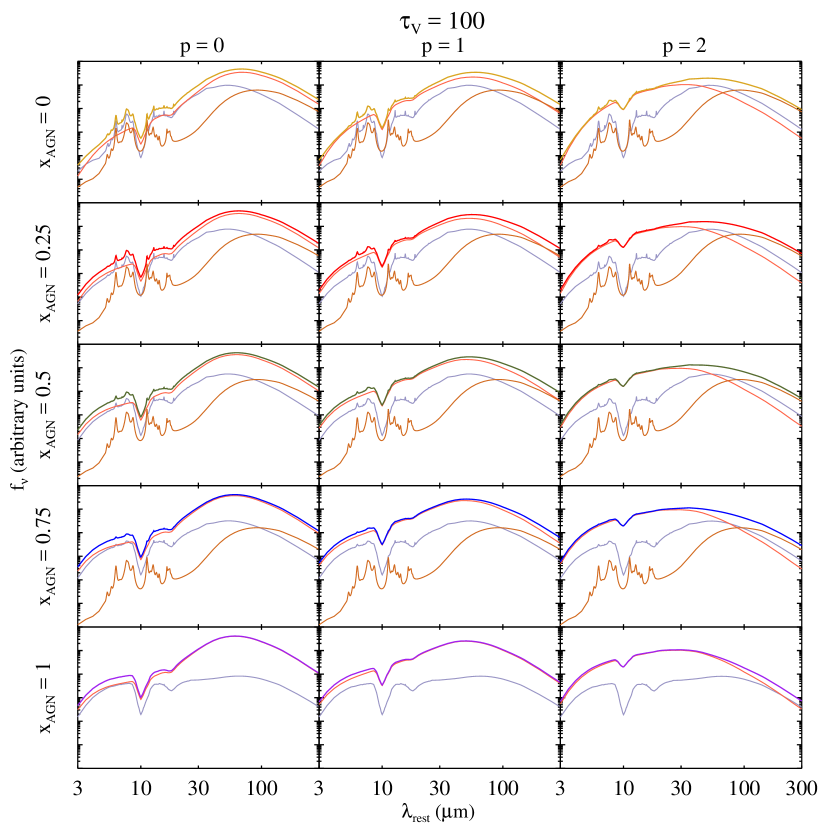
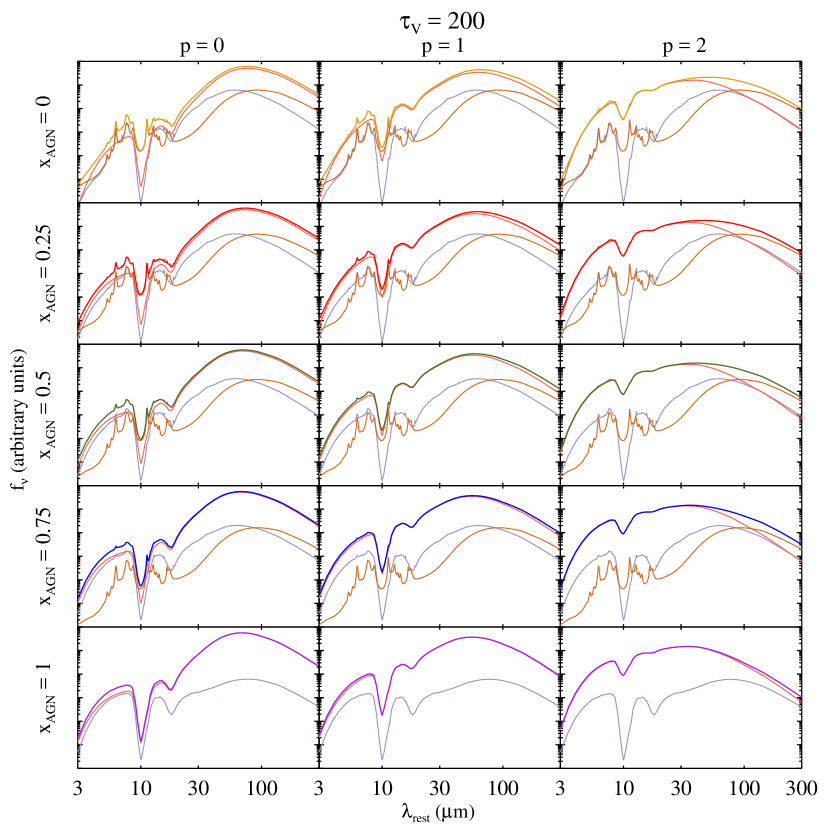
Figures 5 and 6 show near-to-far-IR and mid-IR views of the total emission from our deeply buried ULIRG models, respectively. These models differ from those in Figure 3 only in that they contain host galaxy disk emission. Figure 7 provides a detailed look at the “source” (), “shell” (), and “disk” () components that contribute to the total SEDs () of a subset of the models shown in Figures 5 and 6. As will be discussed in §3.1, at large optical depths every model develops a 9.7 silicate absorption feature which gets deeper as increases. For a given , the feature depth decreases with and is relatively independent of for the values explored in this work. Steep density distributions (such as ) resemble thin shells with little temperature variation (since most of the dust is concentrated in a small radial range), and therefore have absorption features that tend to be shallow since the absorption feature is “filled-in” by hot dust emission from the thin shell. In contrast, radiation from the hot inner regions of obscuring shells with flat density distributions propagates through large quantities of cool dust, resulting in deep absorption features.
The exception to this is for models with starburst-dominated central engines in which PAH emission from the host galaxy disk “fills-in” the absorption feature and keeps it from increasing in depth (this PAH emission also has a pronounced effect on the near-IR emission of these models). In comparison, the models in Figure 3 have no disk emission and thus have much deeper absorption features. The effect of this PAH emission on the spectra of our models is also apparent in the relative strengths of the components shown in Figure 7. This phenomenon wherein ULIRG SEDs are significantly affected by emission from their host galaxy disks is further discussed in §5.
3. Mid-IR Spectral Indicators
While a direct comparison of our models to a set of observed ULIRG SEDs could, in principle, be made by performing detailed fits to the data, such efforts have proven to be somewhat futile since the parameter space is not sufficiently well-constrained. We have instead found that a comparison of well-chosen spectral indicators from our models to the data is a more fruitful path forward.
In particular, the 9.7 silicate feature strength (), 6.2 PAH feature equivalent width (), and continuum slope are the most prominent features in the mid-IR spectra of ULIRGs and thus serve as excellent proxies to characterize their entire mid-IR SEDs (see Laurent et al. 2000; Spoon et al. 2007; Armus et al. 2007; Petric et al. 2011).
We begin with a description of each of these features and a look at the phenomenology of how they arise in our suite of models and the spectra of dusty galaxies.
3.1. Silicate Feature
The most prominent feature in the mid-IR spectra of many dusty galaxies occurs as a result of absorption and/or emission by silicate grains at approximately . In quasars and Seyfert galaxies, this feature appears as either an emission or a shallow absorption feature, whereas in ULIRGs that are not identified as AGNs the feature often appears as a deep absorption feature (Hao et al. 2007).
Assuming that and are the flux densities of the observed spectrum and underlying continuum, respectively, the silicate feature strength of a spectrum is defined as
| (5) |
Positive values of correspond to silicate emission features, while negative values indicate absorption features. ULIRG absorption features range down to where the feature dips by more than a factor of 50 below the continuum.
In principle, an absorbing cold dust screen between the observer and the IR emitter could produce such a deep feature. However, in order to remain cold, such a screen could not also reprocess the amount of radiation indicated by the enormous values associated with ULIRGs. Thus, in addition to such a cold screen, we must also invoke an optically thick reprocessing component. Furthermore, the screen must always fully cover the primary reprocessing dust along the line of sight. Such a geometry requiring two spatially separate but correlated dust regions located along the line of sight represents a contrived solution for ULIRGs. In a more plausible and general explanation, a single entity of embedding dust must account for both the total IR luminosities and deep absorption features seen in ULIRGs.
The appearance of the silicate feature in the spectrum of radiation reprocessed by dust was studied in detail by Levenson et al. (2007) and Sirocky et al. (2008). Radiation from centrally heated dust that is optically thin around 10 shows the feature in emission. As the optical depth through the obscuring medium increases, the feature transitions into an increasingly deep absorption feature. In addition to having a large optical depth through the obscuring cloud, an absorption feature requires the presence of a temperature gradient across the intervening dust—the larger the gradient, the deeper the feature. Geometrically thin dust shells have a limited temperature range and therefore a limited absorption depth (since their emission will effectively “fill-in” any absorption feature). A deep feature therefore requires a central radiation source that is enshrouded behind optically and geometrically thick dust so that radiation from the hot inner regions is reprocessed by successively distant outer layers containing increasing amounts of cooler dust. In addition, the density distribution must be smooth. Or, if the obscuring dust is clumpy, its volume filling factor must be very large to produce deep absorption. (See also Goulding et al. 2012, where it is suggested that deep silicate absorption in some Compton-thick AGN may arise from dust in the host galaxy disk.) In contrast, dust in the obscuring torus of an AGN is clumpy and has a small volume filling factor so that an otherwise deep absorption feature in an AGN is “filled-in” by emission from the hot sides of clouds visible through the clumpy torus.
These conditions are fairly restrictive. Any significant deviation reduces the depth of the absorption feature. While it is difficult to produce a deep silicate absorption feature, it is easy to make a shallow one. As we will describe in §5, a mere 5% mid-IR contamination from low-obscuration star-formation is sufficient to “fill-in” an otherwise deep absorption feature. The infrared radiation from ULIRGs with deep silicate absorption features must, therefore, arise from a single deeply obscured central source with very little emission contributed from elsewhere. The radiation emerging from this deep obscuration must also contain a sufficiently strong warm component to explain the observed flat mid-IR slopes of some ULIRGs—a significant challenge.
3.2. PAH Features
Beginning with the pioneering studies of Aitken, Roche and collaborators (see Roche et al. 1991, and references therein), it has been established that the mid-IR spectra of starburst galaxies show prominent PAH emission features, whereas AGN SEDs are generally devoid of such features. The latter has been attributed to the destruction of the PAH molecules by AGN X-rays (Voit 1992), although it may also be explained in terms of the feature excitation mechanism. Namely, the features arise from the stochastic heating of small grains that leads to sporadic deviations from equilibrium. Significant temperature spikes occur when the absorption of a single photon markedly increases a grain’s internal energy, and PAH emission occurs during the subsequent cooling-down period (see, e.g., Draine 2003). This requires a combination of very small grain mass and a diffuse radiation field of high-energy (UV) photons. When any of these conditions is violated, the grains either sublimate or reach thermal equilibrium with the radiation field (whatever their size), in which case their emission shows only small fluctuations around black-body radiation at their equilibrium temperature.
In particular, temperature fluctuations of small grains heated by UV radiation decrease when the photon density is sufficiently high that the grains are repeatedly hit before they have time to cool significantly between photon absorptions. As a result, PAH emission from young, hot stars originates at relatively large radial distances (where the photon density is sufficiently low). For example, around hot O-stars with luminosities from 3–5 , the PAH emission zone is at a radial distance of 0.2–1 pc, where the radiation field has been diluted by (e.g., Verstraete et al. 2001). Inside that radius dust emission is thermal. Scaling to AGN luminosities of yields radial distances of – pc, explaining why the central kiloparsec of an AGN host galaxy is a PAH “zone of avoidance” (Desert & Dennefeld 1988). Strong PAH emission from starburst galaxies arises from many star forming regions distributed over a large volume, where the collective emission reflects the combined effect of many diffuse radiation regions.
Pertinent to this work, it follows that a collection of hot stars inside an optically thick dust shell heated to temperatures that generate mid-IR emission will not produce significant PAH features. When the dust shell’s inner regions are heated to the high temperatures necessary for deep silicate absorption and appreciable mid-IR emission, the photon density of the radiation field is sufficiently high that all grains, including small surviving ones, are in thermal equilibrium. In the dust shell’s outer regions where the radiation field does become sufficiently diffuse, it is also nearly devoid of UV photons (which are absorbed in the inner layers), and thus cannot induce the stochastic heating necessary for PAH excitation. The presence of strong PAH features in ULIRGs therefore requires distributed—not centralized—heating. In contrast, as mentioned in §3.1, deep silicate absorption features require central heating of dust that is both optically and geometrically thick in order to provide a sufficient temperature gradient and cooler outer layers.
To understand the relationship between the intrinsic and observed strength of PAH emission as it propagates through an obscuring cloud (i.e., as expected in a ULIRG), let’s denote by the equivalent width of a PAH feature superposed on an underlying continuum with intensity . When this radiation propagates through dust with optical depth at the feature wavelength, the attenuated intensity of the emerging radiation is , while reprocessing of the radiation absorbed by the obscuring dust leads to thermal emission with intensity . Reprocessed radiation has no UV photons, and thus does not produce PAH emission. As a result, the emerging radiation exhibits a PAH feature with an equivalent width
| (6) |
As long as the reprocessed emission is small (), the feature emerges with equivalent width . Once the reprocessed emission becomes significant, the equivalent width is reduced, decreasing with increasing optical depth.
As noted earlier, the PAH features in our pure starburst models are quite resilient even at high optical depths. This behavior can be understood from equation (6): Heating by the starburst spectrum produces dust temperature no higher than = 580 K, thus the transmitted component of the original input radiation remains significant in comparison with the thermal emission of reprocessed radiation from the shell. As the AGN fraction of the heating spectrum rises, PAH feature equivalent widths decrease both as a result of their reduced prominence in the input SED and the increasing contribution of thermal emission from the shell in the spectral vicinity of the PAH feature as a result of its higher dust temperature.
3.3. Spectral Slope
ISO revealed that the slope of the 5–15 µm portion of the spectrum can be used as a powerful diagnostic tool for identifying the presence of AGN in obscured galaxies (Laurent et al. 2000). Within the general context of the unified model of AGN—and independent of whether the AGN is surrounded by a smooth torus or clumpy dense ISM clouds—dust in the proximity of the AGN is heated to near sublimation temperature (1,000 K for silicate or 1,500 K for graphitic grains). The hottest surviving grains in thermal equilibrium with an AGN radiation field therefore emit with a peak at 3 µm. Dust layers located further away from the AGN reprocess this radiation and are, therefore, cooler—emitting the bulk of their energy at longer mid-IR wavelengths (e.g., Granato et al. 1997; Clavel et al. 2000; Murayama et al. 2000; Alonso-Herrero et al. 2001). Photons from massive starbursts do not heat the same quantity of dust to such high temperatures and, as a result, produce much weaker 3–7 µm dust continua.
Infrared emission in the 15 µm range from dust heated to 200 K can, however, be produced either by star-formation or by the outer layers of the clouds or shell enshrouded an AGN. This behavior of the mid-IR continuum has been successfully used in analysis of Spitzer IRS spectra to reveal the power production mechanism in local ULIRGs (e.g., Armus et al. 2007; Petric et al. 2011). As described in §3.4, in this work we choose to characterize the mid-IR slope based upon the 14 µm to 5.5 µm flux density ratio since the continuum at these wavelengths is relatively free of strong PAH emission and silicate absorption features.
3.4. Analysis of Models and Data
Our observational sample of sources to compare to our models includes Spitzer IRS spectra of 103 ULIRGs from Armus et al. (2004, 2006, 2007) and Desai et al. (2007) which have sufficiently high signal-to-noise ratio data to yield accurate silicate absorption feature strength measurements. For comparison, our sample also includes SEDs of 16 lower luminosity starburst galaxies from Brandl et al. (2006) and 13 AGNs and quasars from Hao et al. (2005) and Weedman et al. (2005). All spectra were extracted and calibrated using the method described in Spoon et al. (2007).
Silicate feature strengths of observed and model SEDs are calculated from equation (5) with the continuum interpolation method described in Sirocky et al. (2008). PAH equivalent widths are calculated using the method described in Spoon et al. (2007). In short, the total flux in the PAH feature is measured by integrating the flux density above a local spline-interpolated continuum, and the equivalent width is calculated by dividing this by the value of the interpolated 6.2 continuum. Mid-IR continuum slopes are calculated from the interpolated 5.5 flux density and the continuum flux density at 14. These wavelengths were chosen because: (1) they both fall outside the range of any significant PAH emission features; and (2) the latter wavelength falls between the two silicate features at and .
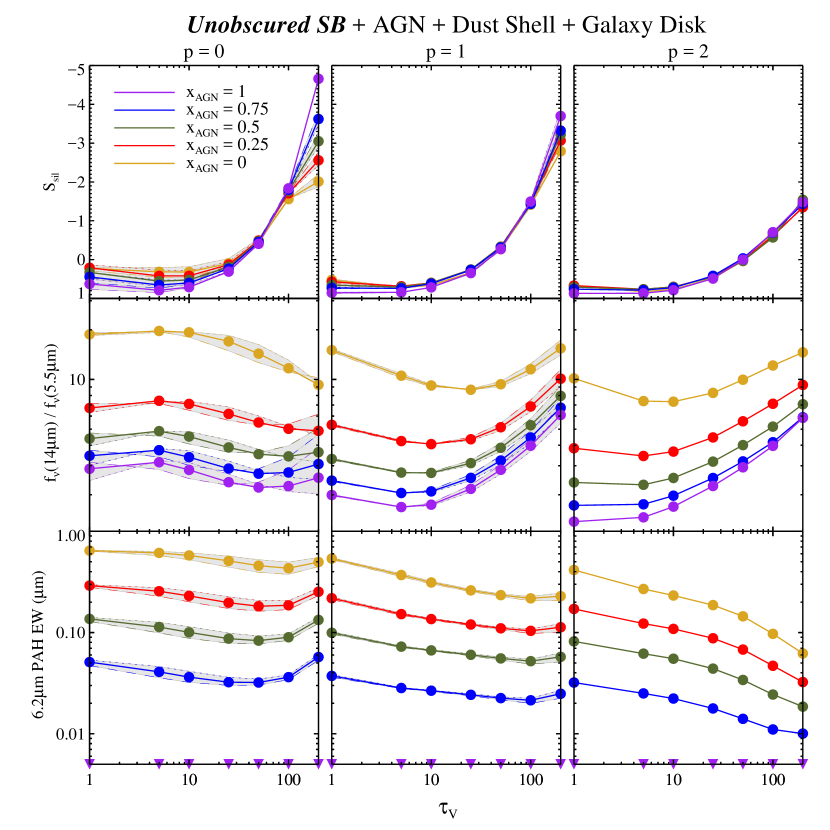
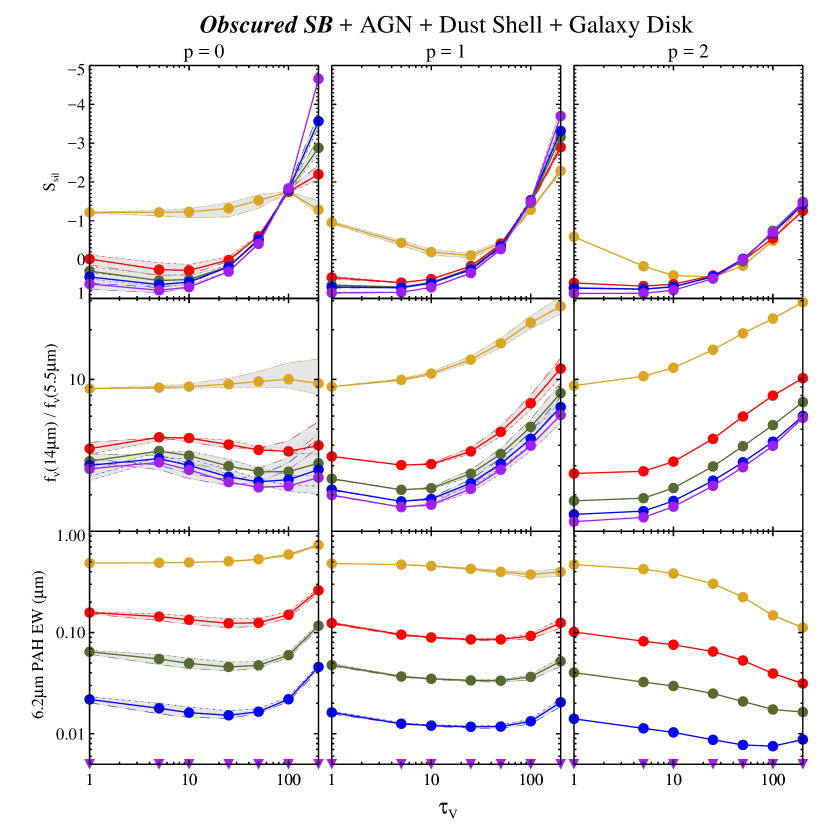
Figure 8 shows the dependence of these spectral indicators on the optical depth, , for the models shown in Figure 5. As is evident from the figure, our three indicators behave quite differently for the models of pure starburst galaxies and AGN. The starburst SEDs have shallower silicate absorption features at high optical depth, steeper mid-IR slopes (i.e., “cooler” 5.5 emission in comparison to their 14 emission), and larger PAH equivalent widths.
4. 3-D Diagnostic Diagram
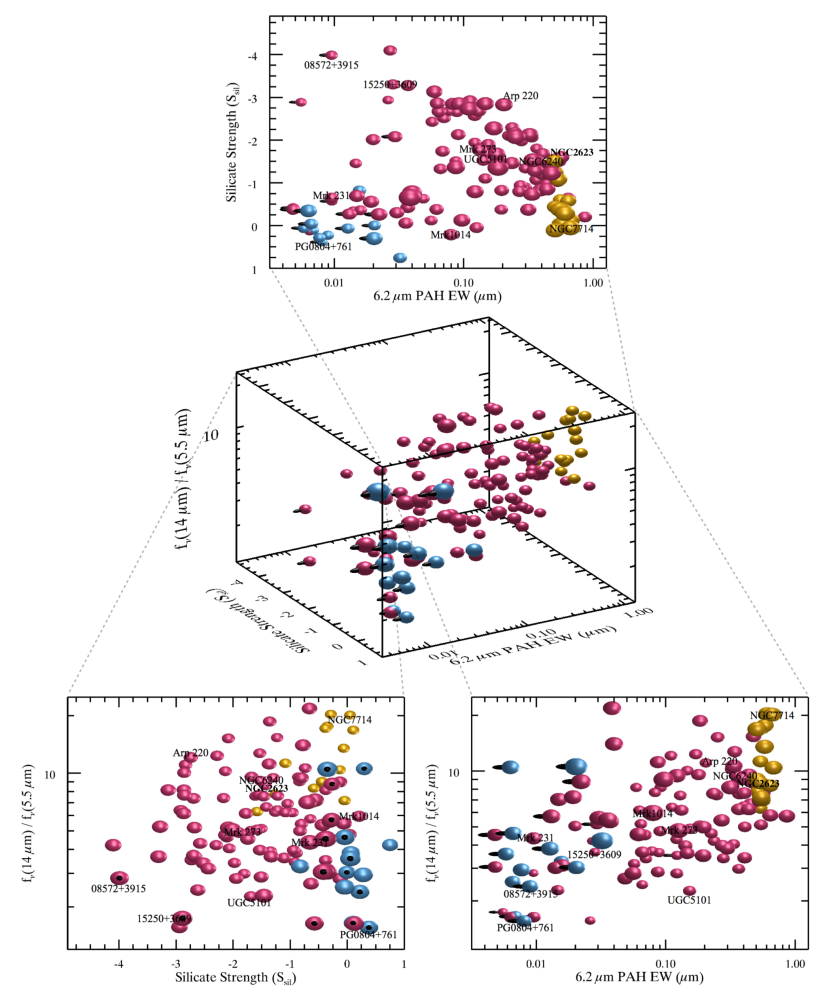
In Figure 9, we show a three-dimensional representation of the diagnostic features from §3.4 for the archival Spitzer IRS data of our sample. Along with the 3-D view, we also show its trio of 2-D projections. Two of these projections have been discussed extensively before, with versus PAH EW and mid-IR spectral slope versus PAH EW having first been presented in Spoon et al. (2007) and Laurent et al. (2000), respectively. We suggest that these two diagrams are best thought of as two-dimensional projections of a more fundamental three-dimensional phase space of mid-IR ULIRG properties. Sources from the AGN and starburst subsets of our sample tend to live in the same region of this phase space, while ULIRGs (due to their diverse nature) tend to maximally fill the space. The locations of several well-known sources from our sample—including our template AGN and starburst heating sources—are shown on each projection.
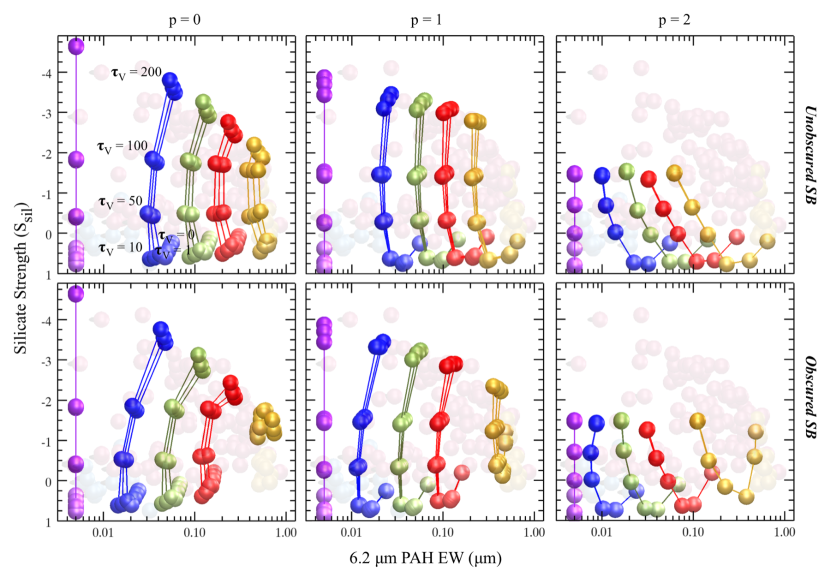
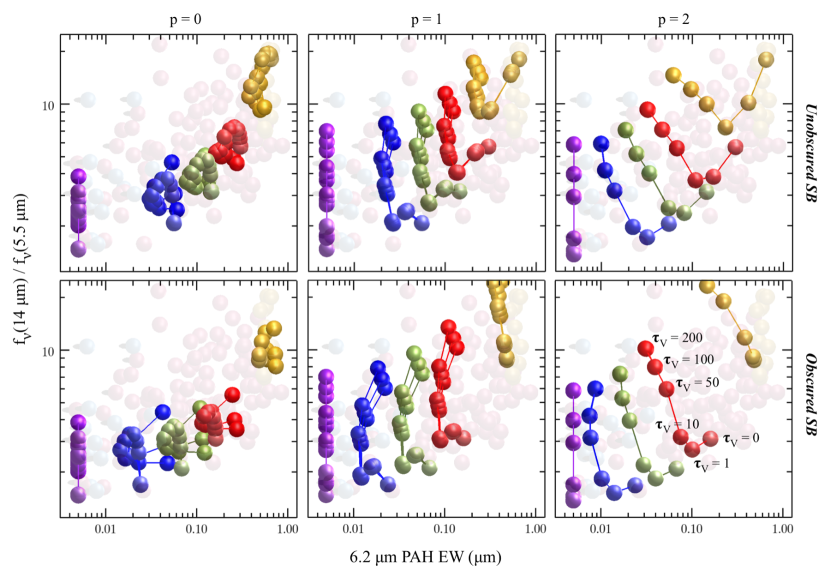
Figures 10 and 11 show the trio of 2-D projections from the 3-D diagnostic diagram in Figure 9 for the suite of ULIRG models described in §2.5 and presented in Figure 5. These models assume (i.e., a fully covered central source; see eq. [1]), (i.e., PAHs contributing 10% of the total luminosity of disk star formation; see eq. [2]), and (i.e., a host galaxy disk contribution of 10% the luminosity of the nuclear starburst; see eq. [4]). Overall, the models do an excellent job at reproducing the location of the ULIRGs (seen projected faintly behind each model diagram) in this three-dimensional phase space of mid-IR spectral properties. By mixing pure AGN and starburst models, we succeed in mapping out the entire space occupied by the ULIRGs, as well as those of the known pure AGN and starburst samples.
Of particular interest is the result that the somewhat paradoxical subclass of ULIRGs which simultaneously display extremely deep silicate features () and warm mid-IR colors () can only be reproduced by AGN-dominated models. This implies that these galaxies must have a buried AGN contributing significantly to their total power. Starbursts that contribute more than of the total power always generate mid-IR spectra with less silicate absorption and steeper slopes. Furthermore, in cases where degeneracies as to the nature of a ULIRG exist in one or even two projections, our new interpretation of the trio of spectral indicators as a 3-D diagnostic phase space can sometimes yield a diagnoses by adding input from the third projection.
Another perhaps less satisfying result is that in some regions of phase space—e.g., much of the spectral slope versus silicate strength projection—the models with different values of are degenerate. While the extremes or edges of the space are only populated by specific models, there are large regions where real galaxies live that can be accommodated by a wide range of model parameters. Determining the exact radial thickness and density distribution of the obscuring medium for many ULIRGs is difficult in the context of these models, especially when mixing starburst and AGN power sources in composite systems. The models are nonetheless useful as they, at a minimum, allow us to use simple observables to place important constraints on the power sources and the obscuring medium around ULIRG nuclei.
5. Discussion
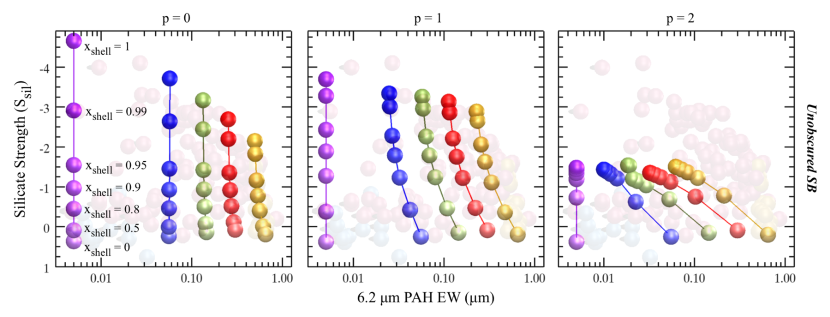
In Figure 12, we explore the effects of a clumpy obscuring medium surrounding the central source. Here the model provides a “keyhole” view through to a fraction of the underlying AGN and/or starburst-powered nuclear source. Of particular note, when only 10% of the underlying source is revealed (i.e., a 90% covering fraction), the highly obscured AGN located towards the top left of the silicate strength versus PAH EW plot quickly move from the deeply obscured region to the apparently unobscured region at the bottom of the diagram. As such, only completely obscured AGN with covering factors near unity can be found towards the upper left of this diagram (since even a 5% “keyhole” view is sufficient to move a source towards the region occupied by unobscured AGN).
This may explain why we find so few moderate-to-deeply buried ULIRGs with low PAH equivalent widths: ULIRGs with low PAH equivalent width either tend to have little-to-no apparent obscuration or they appear to be deeply buried (with very few in-between). Our models suggest that this change in the silicate strength is very sensitive to small changes in the fraction of the central source that is visible. As such, the removal of the obscuring dust from a highly extinguished, low PAH equivalent width source may or may not happen quickly. But as soon as a small window to the central source is revealed, the silicate strength changes dramatically. The dearth of real sources (see Spoon et al. 2007) and model points (see Fig. 9) with weak PAH emission at intermediate-to-large silicate depths may therefore be a result of the fact that the spectral properties of galaxies change easily and rather dramatically in this projected plane (see also Rowan-Robinson & Efstathiou 2009 for an alternate theoretical interpretation of the “Spoon” diagram). We note that this sensitivity to the geometry of the obscuring medium means that the distribution of sources in this plane should not necessarily be used to infer the relative amount of time a galaxy spends in the obscured and unobscured states.
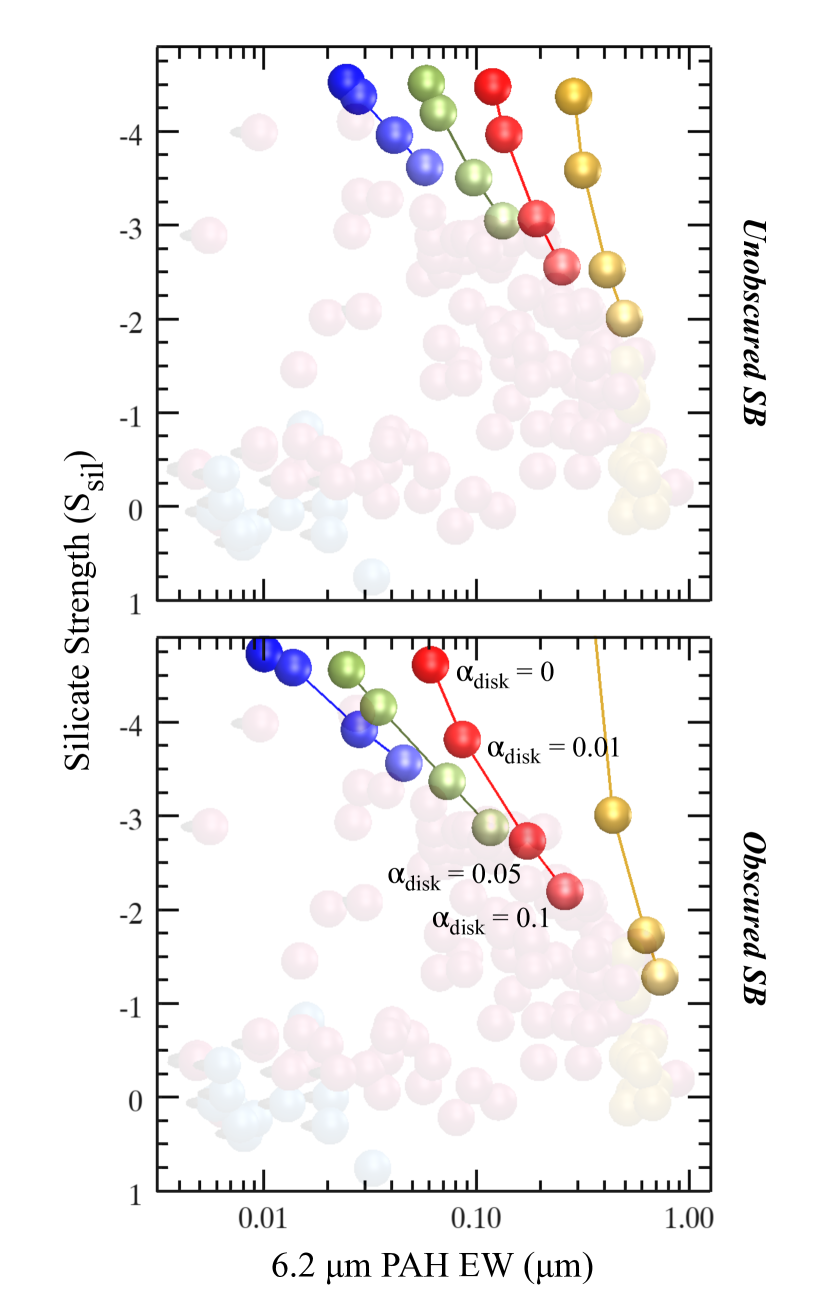
In Figure 13, we show the effect of adding small amounts of unobscured PAH emission from the host galaxy disk to the models. Specifically, we use values of , , , and (see eq. [4]), along with (see eq. [2]) to model the effect of a contribution from unobscured host galaxy disk emission at the 0%, 1%, 5%, and 10% level relative to the bolometric nuclear star-formation luminosity. Even these small amounts of PAH emission are sufficient to move galaxies from the upper-left to the lower-right in the diagram. This naturally explains why highly obscured starburst dominated ULIRGs are rarely seen. These sources may exist, but even a relatively small amount of disk PAH emission rapidly makes them appear much less obscured and moves them away from the upper part of Figure 10. Just as importantly, this also implies that ULIRGs with deep silicate absorption and low PAH equivalent width cannot have more than 10% of their total emission coming from unobscured star-formation. Otherwise, they would move towards the pure starburst galaxies in the lower-right of the diagram.
The vast majority of low-redshift ULIRGs were formed from major mergers of gas-rich disk galaxies. These disks will always have a small amount of residual star-formation that, although dwarfed by the subsequent central starburst, likely contributes a small amount of PAH emission to the mid-IR spectrum—even when that spectrum is centered on the nucleus. The IRS slits (which match the Spitzer beam) are relatively large in projection ( and for SL and LL, respectively), so disk emission from the surrounding host galaxy is likely to leak into the “nuclear” spectrum. In the context of our model, it is the relative amount of central starburst and disk PAH emission that controls where ULIRGs fall in Figure 13—even a small amount of circumnuclear star formation makes them appear much less obscured.
At high-redshift where apertures cover many kiloparsecs, it is likely to be extremely difficult to find highly-obscured systems in which even a small amount of disk star-formation is not present (whether or not a system has been involved in a major merger). This may be consistent with the findings of Pope et al. (2008) and Menéndez-Delmestre et al. (2009) who, on average, find stronger PAH and shallower silicate absorption in SMGs compared to local ULIRGs and interpret this as extended, less obscured star formation.
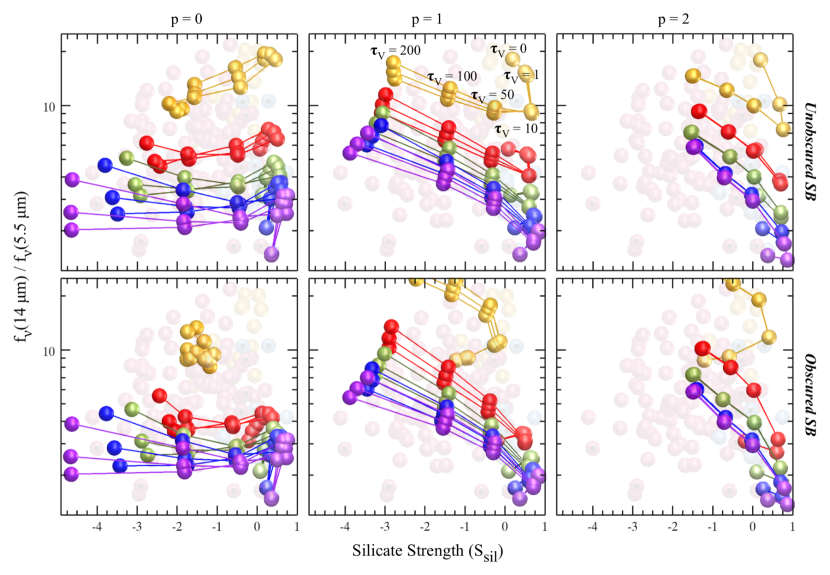
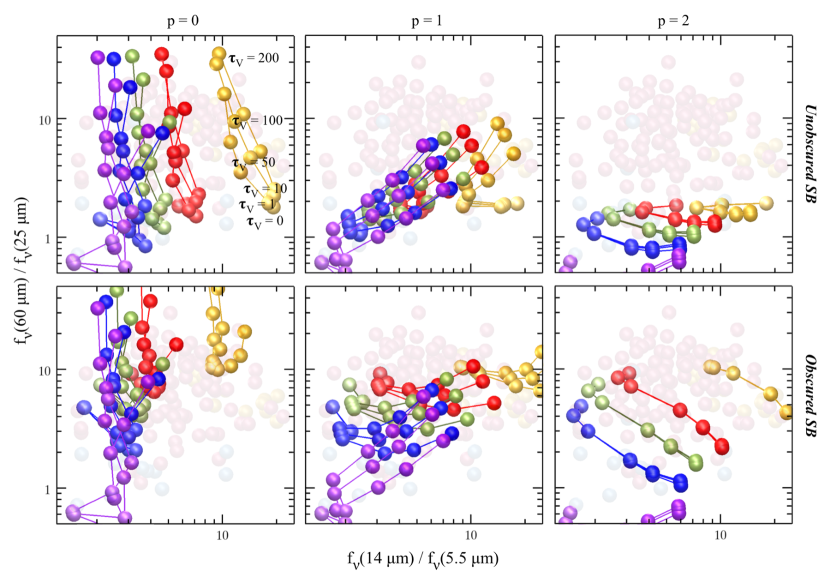
In Figure 14, we present the far-IR versus mid-IR colors of our models overlaid atop the positions of the sources in our archival sample. While we have not developed a comprehensive model of the far-IR emission emerging from ULIRG nuclei and their host galaxy disks, our suite of models nonetheless does a good job at fitting these far-IR colors. This result provides additional evidence that the assumptions used in generating the models for the ULIRG nuclei and host galaxies are reasonable.
According to our models, the obscuring shells surrounding the nuclei of sources with “cool” far-IR colors (i.e., ) in the upper regions of the color-color phase space of Figure 14 must have relatively flat () mass density profiles. The densities of the and models fall-off faster with radius and thus contain insufficient dust at large radii to produce the quantity of far-IR emission needed to populate the “cool” regions of this phase space. Note also that for the case, the model tracks are relatively insensitive to the choice of starburst template (i.e., unobscured versus obscured); however, the obscured starburst models with (and to a lesser extent ) are clearly cooler than the unobscured models for a given value of .
Finally, the superior sensitivity and unprecedented angular resolution of JWST will soon provide a unique opportunity to use mid-IR spectroscopy to dissect the dust enshrouded central regions of both nearby nuclei and more distant galaxies. These observations will benefit from a more than ten-fold improvement in angular resolution compared to Spitzer IRS for the 3000 local galaxies detected by that observatory (see Hernán-Caballero et al. 2016). JWST will also allow us to explore many more than the 300 moderate to high-z galaxies for which Spitzer has provided low-resolution spectra (see Kirkpatrick et al. 2015).
The integral field units (IFUs) of the JWST mid-infrared instrument (MIRI) will enable the same kind of analysis using the well known emission features in the 5–28 range that we have performed in this work with IRS spectra, but for numerous distinct resolved areas of target galaxies. Of particular interest will be the ability of the IFUs of the near infrared spectrograph (NIRSpec) on JWST to probe the spatial distribution of thermal dust emission near an AGN as well as the circumnuclear PAH feature at redshifts up to 0.7 (and thus spatial scales of pc). Such analyses of the detailed spectral features will provide additional constraints to quantify the AGN/star-formation power in nearby and distant galaxies currently limited to exploration via broad-band imaging alone (see Kirkpatrick et al. 2017).
6. Summary
We have presented a suite of radiative transfer models of the SEDs of deeply buried star-formation and/or AGN-powered ULIRGs and have compared them to the SEDs of a large sample of 100 ULIRG spectra taken with the IRS on Spitzer. We find that the properties that dominate the observed mid-IR spectra of ULIRGs (specifically their mid-IR colors, PAH equivalent widths, and silicate feature strengths) are consistent with the range of values obtained from our radiative transfer models of a spherically symmetric shell of obscuring dust surrounding a star-formation and/or AGN powered central source.
We find that the commonly used PAH equivalent width versus silicate strength and PAH equivalent width versus mid-IR slope diagrams are naturally described as two-dimensional projections of a more fundamental 3-D phase space of silicate strength, PAH equivalent width, and mid-IR spectral slope.
In addition to demonstrating the general consistency of our simple ULIRG models with observational data across this 3-D phase space (and even into the far-IR), we have shown:
-
1.
Our models agree with observations that the most heavily obscured ULIRGs (i.e., ) have flat mid-IR slopes and an apparent “excess” of hot dust emission (i.e., ). Furthermore, our models show that at least 75% of the bolometric luminosities of these sources must be powered by an AGN, with the most deeply buried likely being 100% AGN-powered. The bolometric luminosities of slightly less obscured ULIRGs (i.e., ) may be dominated by either an obscured AGN or an obscured starburst. This degeneracy can be (at least partially) broken using the mid-IR slope.
-
2.
Transitioning from a deeply buried (i.e., ) and low PAH equivalent width (¡ 0.01) AGN-dominated source to a relatively unextinguished () AGN-powered SED can be accomplished by unveiling just 5–10% of the underlying nuclear power source. In other words, only a small window through a clumpy dust shell is required for a source to “jump” from the upper to lower branch of the PAH equivalent width versus silicate strength diagram. This may explain the rarity of sources detected with Spitzer IRS having low PAH equivalent width and -3 ¡ . And it suggests that the distribution of sources in this plane should not necessarily be used to infer the relative amount of time a galaxy spends in the obscured and unobscured states.
-
3.
The absence of sources with observed SEDs that display both deep silicate absorption and strong PAH emission features is naturally explained by the presence of a small amount of unobscured star-formation (and therefore PAH emission) from the host galaxy disk. Unobscured star formation with a total PAH luminosity of only 1% that of the buried starburst (equivalent to a total disk luminosity of 10% the nuclear star-forming luminosity in our model) is sufficient to drive sources to the lower right of the PAH equivalent width versus silicate strength plot. On a related note, as shown in Figure 13, sources with cannot have more than 10% of their bolometric emission coming from unobscured star-formation. If they did, their deep silicate features would be partially “filled-in,” pushing them off the upper-branch of the diagram down towards the location populated by unobscured starburst galaxies.
References
- Alonso-Herrero et al. (2001) Alonso-Herrero, A., Quillen, A. C., Simpson, C., Efstathiou, A., & Ward, M. J. 2001, AJ, 121, 1369
- Armus et al. (2006) Armus, L., Bernard-Salas, J., Spoon, H. W. W., Marshall, J. A., Charmandaris, V., Higdon, S. J. U., Desai, V., Hao, L., Teplitz, H. I., Devost, D., Brandl, B. R., Soifer, B. T., & Houck, J. R. 2006, ApJ, 640, 204
- Armus et al. (2007) Armus, L., Charmandaris, V., Bernard-Salas, J., Spoon, H. W. W., Marshall, J. A., Higdon, S. J. U., Desai, V., Teplitz, H. I., Hao, L., Devost, D., Brandl, B. R., Wu, Y., Sloan, G. C., Soifer, B. T., Houck, J. R., & Herter, T. L. 2007, ApJ, 656, 148
- Armus et al. (2004) Armus, L., Charmandaris, V., Spoon, H. W. W., Houck, J. R., Soifer, B. T., Brandl, B. R., Appleton, P. N., Teplitz, H. I., Higdon, S. J. U., Weedman, D. W., Devost, D., Morris, P. W., Uchida, K. I., van Cleve, J., Barry, D. J., Sloan, G. C., Grillmair, C. J., Burgdorf, M. J., Fajardo-Acosta, S. B., Ingalls, J. G., Higdon, J., Hao, L., Bernard-Salas, J., Herter, T., Troeltzsch, J., Unruh, B., & Winghart, M. 2004, ApJS, 154, 178
- Armus et al. (2009) Armus, L., Mazzarella, J. M., Evans, A. S., Surace, J. A., Sanders, D. B., Iwasawa, K., Frayer, D. T., Howell, J. H., Chan, B., Petric, A., Vavilkin, T., Kim, D. C., Haan, S., Inami, H., Murphy, E. J., Appleton, P. N., Barnes, J. E., Bothun, G., Bridge, C. R., Charmandaris, V., Jensen, J. B., Kewley, L. J., Lord, S., Madore, B. F., Marshall, J. A., Melbourne, J. E., Rich, J., Satyapal, S., Schulz, B., Spoon, H. W. W., Sturm, E., U, V., Veilleux, S., & Xu, K. 2009, PASP, 121, 559
- Blain et al. (2002) Blain, A. W., Smail, I., Ivison, R. J., Kneib, J., & Frayer, D. T. 2002, Phys. Rep., 369, 111
- Brandl et al. (2006) Brandl, B. R., Bernard-Salas, J., Spoon, H. W. W., Devost, D., Sloan, G. C., Guilles, S., Wu, Y., Houck, J. R., Weedman, D. W., Armus, L., Appleton, P. N., Soifer, B. T., Charmandaris, V., Hao, L., Higdon, J. A., Marshall, S. J., & Herter, T. L. 2006, ApJ, 653, 1129
- Clavel et al. (2000) Clavel, J., Schulz, B., Altieri, B., Barr, P., Claes, P., Heras, A., Leech, K., Metcalfe, L., & Salama, A. 2000, A&A, 357, 839
- da Cunha et al. (2010) da Cunha, E., Charmandaris, V., Díaz-Santos, T., Armus, L., Marshall, J. A., & Elbaz, D. 2010, A&A, 523, A78
- Desai et al. (2007) Desai, V., Armus, L., Spoon, H. W. W., Charmandaris, V., Bernard-Salas, J., Brandl, B. R., Farrah, D., Soifer, B. T., Teplitz, H. I., Ogle, P. M., Devost, D., Higdon, S. J. U., Marshall, J. A., & Houck, J. R. 2007, ApJ, 669, 810
- Desert & Dennefeld (1988) Desert, F. X. & Dennefeld, M. 1988, A&A, 206, 227
- Díaz-Santos et al. (2014) Díaz-Santos, T., Armus, L., Charmandaris, V., Stacey, G., Murphy, E. J., Haan, S., Stierwalt, S., Malhotra, S., Appleton, P., Inami, H., Magdis, G. E., Elbaz, D., Evans, A. S., Mazzarella, J. M., Surace, J. A., van der Werf, P. P., Xu, C. K., Lu, N., Meijerink, R., Howell, J. H., Petric, A. O., Veilleux, S., & Sanders, D. B. 2014, ApJ, 788, L17
- Díaz-Santos et al. (2013) Díaz-Santos, T., Armus, L., Charmandaris, V., Stierwalt, S., Murphy, E. J., Haan, S., Inami, H., Malhotra, S., Meijerink, R., Stacey, G., Petric, A. O., Evans, A. S., Veilleux, S., van der Werf, P. P., Lord, S., Lu, N., Howell, J. H., Appleton, P., Mazzarella, J. M., Surace, J. A., Xu, C. K., Schulz, B., Sanders, D. B., Bridge, C., Chan, B. H. P., Frayer, D. T., Iwasawa, K., Melbourne, J., & Sturm, E. 2013, ApJ, 774, 68
- Díaz-Santos et al. (2010) Díaz-Santos, T., Charmandaris, V., Armus, L., Petric, A. O., Howell, J. H., Murphy, E. J., Mazzarella, J. M., Veilleux, S., Bothun, G., Inami, H., Appleton, P. N., Evans, A. S., Haan, S., Marshall, J. A., Sanders, D. B., Stierwalt, S., & Surace, J. A. 2010, ApJ, 723, 993
- Díaz-Santos et al. (2011) Díaz-Santos, T., Charmandaris, V., Armus, L., Stierwalt, S., Haan, S., Mazzarella, J. M., Howell, J. H., Veilleux, S., Murphy, E. J., Petric, A. O., Appleton, P., Evans, A. S., Sanders, D. B., & Surace, J. A. 2011, ApJ, 741, 32
- Draine (2003) Draine, B. T. 2003, ApJ, 598, 1017
- Efstathiou et al. (2014) Efstathiou, A., Pearson, C., Farrah, D., Rigopoulou, D., Graciá-Carpio, J., Verma, A., Spoon, H. W. W., Afonso, J., Bernard-Salas, J., Clements, D. L., Cooray, A., Cormier, D., Etxaluze, M., Fischer, J., González-Alfonso, E., Hurley, P., Lebouteiller, V., Oliver, S. J., Rowan-Robinson, M., & Sturm, E. 2014, MNRAS, 437, L16
- Elbaz & Cesarsky (2003) Elbaz, D. & Cesarsky, C. J. 2003, Science, 300, 270
- Genzel et al. (1998) Genzel, R., Lutz, D., Sturm, E., Egami, E., Kunze, D., Moorwood, A. F. M., Rigopoulou, D., Spoon, H. W. W., Sternberg, A., Tacconi-Garman, L. E., Tacconi, L., & Thatte, N. 1998, ApJ, 498, 579
- Goulding et al. (2012) Goulding, A. D., Alexander, D. M., Bauer, F. E., Forman, W. R., Hickox, R. C., Jones, C., Mullaney, J. R., & Trichas, M. 2012, ApJ, 755, 5
- Granato et al. (1997) Granato, G. L., Danese, L., & Franceschini, A. 1997, ApJ, 486, 147
- Hao et al. (2005) Hao, L., Spoon, H. W. W., Sloan, G. C., Marshall, J. A., Armus, L., Tielens, A. G. G. M., Sargent, B., van Bemmel, I. M., Charmandaris, V., Weedman, D. W., & Houck, J. R. 2005, ApJ, 625, L75
- Hao et al. (2007) Hao, L., Weedman, D. W., Spoon, H. W. W., Marshall, J. A., Levenson, N. A., Elitzur, M., & Houck, J. R. 2007, ApJ, 655, L77
- Hemachandra et al. (2015) Hemachandra, D., Barmby, P., Peeters, E., Willner, S. P., Ashby, M. L. N., Smith, H. A., Gordon, K. D., Smith, D. A., & Fazio, G. G. 2015, MNRAS, 454, 818
- Hernán-Caballero et al. (2015) Hernán-Caballero, A., Alonso-Herrero, A., Hatziminaoglou, E., Spoon, H. W. W., Ramos Almeida, C., Díaz Santos, T., Hönig, S. F., González-Martín, O., & Esquej, P. 2015, ApJ, 803, 109
- Hernán-Caballero et al. (2016) Hernán-Caballero, A., Spoon, H. W. W., Lebouteiller, V., Rupke, D. S. N., & Barry, D. P. 2016, MNRAS, 455, 1796
- Houck et al. (2004) Houck, J. R., Roellig, T. L., van Cleve, J., Forrest, W. J., Herter, T., Lawrence, C. R., Matthews, K., Reitsema, H. J., Soifer, B. T., Watson, D. M., Weedman, D., Huisjen, M., Troeltzsch, J., Barry, D. J., Bernard-Salas, J., Blacken, C. E., Brandl, B. R., Charmandaris, V., Devost, D., Gull, G. E., Hall, P., Henderson, C. P., Higdon, S. J. U., Pirger, B. E., Schoenwald, J., Sloan, G. C., Uchida, K. I., Appleton, P. N., Armus, L., Burgdorf, M. J., Fajardo-Acosta, S. B., Grillmair, C. J., Ingalls, J. G., Morris, P. W., & Teplitz, H. I. 2004, ApJS, 154, 18
- Houck et al. (2005) Houck, J. R., Soifer, B. T., Weedman, D., Higdon, S. J. U., Higdon, J. L., Herter, T., Brown, M. J. I., Dey, A., Jannuzi, B. T., Le Floc’h, E., Rieke, M., Armus, L., Charmandaris, V., Brandl, B. R., & Teplitz, H. I. 2005, ApJ, 622, L105
- Huang et al. (2009) Huang, J., Faber, S. M., Daddi, E., Laird, E. S., Lai, K., Omont, A., Wu, Y., Younger, J. D., Bundy, K., Cattaneo, A., Chapman, S. C., Conselice, C. J., Dickinson, M., Egami, E., Fazio, G. G., Im, M., Koo, D., Le Floc’h, E., Papovich, C., Rigopoulou, D., Smail, I., Song, M., Van de Werf, P. P., Webb, T. M. A., Willmer, C. N. A., Willner, S. P., & Yan, L. 2009, ApJ, 700, 183
- Ivezić & Elitzur (1997) Ivezić, Ž. & Elitzur, M. 1997, MNRAS, 287, 799
- Ivezic et al. (1999) Ivezic, Z., Nenkova, M., & Elitzur, M. 1999, User Manual for DUSTY, astro-ph/9910475
- Kirkpatrick et al. (2017) Kirkpatrick, A., Alberts, S., Pope, A., Barro, G., Bonato, M., Kocevski, D. D., Perez-Gonzalez, P., Rieke, G. H., Rodriguez-Munoz, L., Sajina, A., Grogin, N. A., Mantha, K. B., Pandya, V., Pforr, J., & Santini, P. 2017, ArXiv e-prints
- Kirkpatrick et al. (2012) Kirkpatrick, A., Pope, A., Alexander, D. M., Charmandaris, V., Daddi, E., Dickinson, M., Elbaz, D., Gabor, J., Hwang, H. S., Ivison, R., Mullaney, J., Pannella, M., Scott, D., Altieri, B., Aussel, H., Bournaud, F., Buat, V., Coia, D., Dannerbauer, H., Dasyra, K., Kartaltepe, J., Leiton, R., Lin, L., Magdis, G., Magnelli, B., Morrison, G., Popesso, P., & Valtchanov, I. 2012, ApJ, 759, 139
- Kirkpatrick et al. (2015) Kirkpatrick, A., Pope, A., Sajina, A., Roebuck, E., Yan, L., Armus, L., Díaz-Santos, T., & Stierwalt, S. 2015, ApJ, 814, 9
- Laurent et al. (2000) Laurent, O., Mirabel, I. F., Charmandaris, V., Gallais, P., Madden, S. C., Sauvage, M., Vigroux, L., & Cesarsky, C. 2000, A&A, 359, 887
- Levenson et al. (2007) Levenson, N. A., Sirocky, M. M., Hao, L., Spoon, H. W. W., Marshall, J. A., Elitzur, M., & Houck, J. R. 2007, ApJ, 654, L45
- Lutz et al. (1998) Lutz, D., Kunze, D., Spoon, H. W. W., & Thornley, M. D. 1998, A&A, 333, L75
- Lutz et al. (2005) Lutz, D., Valiante, E., Sturm, E., Genzel, R., Tacconi, L. J., Lehnert, M. D., Sternberg, A., & Baker, A. J. 2005, ApJ, 625, L83
- Magnelli et al. (2013) Magnelli, B., Popesso, P., Berta, S., Pozzi, F., Elbaz, D., Lutz, D., Dickinson, M., Altieri, B., Andreani, P., Aussel, H., Béthermin, M., Bongiovanni, A., Cepa, J., Charmandaris, V., Chary, R.-R., Cimatti, A., Daddi, E., Förster Schreiber, N. M., Genzel, R., Gruppioni, C., Harwit, M., Hwang, H. S., Ivison, R. J., Magdis, G., Maiolino, R., Murphy, E., Nordon, R., Pannella, M., Pérez García, A., Poglitsch, A., Rosario, D., Sanchez-Portal, M., Santini, P., Scott, D., Sturm, E., Tacconi, L. J., & Valtchanov, I. 2013, A&A, 553, A132
- Marshall et al. (2007) Marshall, J. A., Herter, T. L., Armus, L., Charmandaris, V., Spoon, H. W. W., Bernard-Salas, J., & Houck, J. R. 2007, ApJ, 670, 129
- Mathis et al. (1977) Mathis, J. S., Rumpl, W., & Nordsieck, K. H. 1977, ApJ, 217, 425
- Menéndez-Delmestre et al. (2009) Menéndez-Delmestre, K., Blain, A. W., Smail, I., Alexander, D. M., Chapman, S. C., Armus, L., Frayer, D., Ivison, R. J., & Teplitz, H. 2009, ApJ, 699, 667
- Men’shchikov & Henning (1997) Men’shchikov, A. B. & Henning, T. 1997, A&A, 318, 879
- Murayama et al. (2000) Murayama, T., Mouri, H., & Taniguchi, Y. 2000, ApJ, 528, 179
- Murphy et al. (2011) Murphy, E. J., Chary, R.-R., Dickinson, M., Pope, A., Frayer, D. T., & Lin, L. 2011, ApJ, 732, 126
- Nardini et al. (2008) Nardini, E., Risaliti, G., Salvati, M., Sani, E., Imanishi, M., Marconi, A., & Maiolino, R. 2008, MNRAS, 385, L130
- Nenkova et al. (2008) Nenkova, M., Sirocky, M. M., Nikutta, R., Ivezić, Ž., & Elitzur, M. 2008, ApJ, 685, 160
- Ossenkopf et al. (1992) Ossenkopf, V., Henning, T., & Mathis, J. S. 1992, A&A, 261, 567
- Petric et al. (2011) Petric, A. O., Armus, L., Howell, J., Chan, B., Mazzarella, J. M., Evans, A. S., Surace, J. A., Sanders, D., Appleton, P., Charmandaris, V., Díaz-Santos, T., Frayer, D., Haan, S., Inami, H., Iwasawa, K., Kim, D., Madore, B., Marshall, J., Spoon, H., Stierwalt, S., Sturm, E., U, V., Vavilkin, T., & Veilleux, S. 2011, ApJ, 730, 28
- Pilbratt et al. (2010) Pilbratt, G. L., Riedinger, J. R., Passvogel, T., Crone, G., Doyle, D., Gageur, U., Heras, A. M., Jewell, C., Metcalfe, L., Ott, S., & Schmidt, M. 2010, A&A, 518, L1
- Pope et al. (2008) Pope, A., Chary, R., Alexander, D. M., Armus, L., Dickinson, M., Elbaz, D., Frayer, D., Scott, D., & Teplitz, H. 2008, ApJ, 675, 1171
- Roche et al. (1991) Roche, P. F., Aitken, D. K., Smith, C. H., & Ward, M. J. 1991, MNRAS, 248, 606
- Rosenberg et al. (2015) Rosenberg, M. J. F., van der Werf, P. P., Aalto, S., Armus, L., Charmandaris, V., Díaz-Santos, T., Evans, A. S., Fischer, J., Gao, Y., González-Alfonso, E., Greve, T. R., Harris, A. I., Henkel, C., Israel, F. P., Isaak, K. G., Kramer, C., Meijerink, R., Naylor, D. A., Sanders, D. B., Smith, H. A., Spaans, M., Spinoglio, L., Stacey, G. J., Veenendaal, I., Veilleux, S., Walter, F., Weiß, A., Wiedner, M. C., van der Wiel, M. H. D., & Xilouris, E. M. 2015, ApJ, 801, 72
- Rowan-Robinson & Efstathiou (2009) Rowan-Robinson, M. & Efstathiou, A. 2009, MNRAS, 399, 615
- Rupke & Veilleux (2013) Rupke, D. S. N. & Veilleux, S. 2013, ApJ, 775, L15
- Sajina et al. (2007) Sajina, A., Yan, L., Armus, L., Choi, P., Fadda, D., Helou, G., & Spoon, H. 2007, ApJ, 664, 713
- Schweitzer et al. (2006) Schweitzer, M., Lutz, D., Sturm, E., Contursi, A., Tacconi, L. J., Lehnert, M. D., Dasyra, K. M., Genzel, R., Veilleux, S., Rupke, D., Kim, D., Baker, A. J., Netzer, H., Sternberg, A., Mazzarella, J., & Lord, S. 2006, ApJ, 649, 79
- Scoville et al. (2017) Scoville, N., Murchikova, L., Walter, F., Vlahakis, C., Koda, J., Vanden Bout, P., Barnes, J., Hernquist, L., Sheth, K., Yun, M., Sanders, D., Armus, L., Cox, P., Thompson, T., Robertson, B., Zschaechner, L., Tacconi, L., Torrey, P., Hayward, C. C., Genzel, R., Hopkins, P., van der Werf, P., & Decarli, R. 2017, ApJ, 836, 66
- Siebenmorgen et al. (2015) Siebenmorgen, R., Heymann, F., & Efstathiou, A. 2015, A&A, 583, A120
- Siebenmorgen & Krügel (2007) Siebenmorgen, R. & Krügel, E. 2007, A&A, 461, 445
- Sirocky et al. (2008) Sirocky, M. M., Levenson, N. A., Elitzur, M., Spoon, H. W. W., & Armus, L. 2008, ApJ, 678, 729
- Smith et al. (2007) Smith, J. D. T., Draine, B. T., Dale, D. A., Moustakas, J., Kennicutt, Jr., R. C., Helou, G., Armus, L., Roussel, H., Sheth, K., Bendo, G. J., Buckalew, B. A., Calzetti, D., Engelbracht, C. W., Gordon, K. D., Hollenbach, D. J., Li, A., Malhotra, S., Murphy, E. J., & Walter, F. 2007, ApJ, 656, 770
- Spoon et al. (2007) Spoon, H. W. W., Marshall, J. A., Houck, J. R., Elitzur, M., Hao, L., Armus, L., Brandl, B. R., & Charmandaris, V. 2007, ApJ, 654, L49
- Stierwalt et al. (2014) Stierwalt, S., Armus, L., Charmandaris, V., Diaz-Santos, T., Marshall, J., Evans, A. S., Haan, S., Howell, J., Iwasawa, K., Kim, D. C., Murphy, E. J., Rich, J. A., Spoon, H. W. W., Inami, H., Petric, A. O., & U, V. 2014, ApJ, 790, 124
- Stierwalt et al. (2013) Stierwalt, S., Armus, L., Surace, J. A., Inami, H., Petric, A. O., Diaz-Santos, T., Haan, S., Charmandaris, V., Howell, J., Kim, D. C., Marshall, J., Mazzarella, J. M., Spoon, H. W. W., Veilleux, S., Evans, A., Sanders, D. B., Appleton, P., Bothun, G., Bridge, C. R., Chan, B., Frayer, D., Iwasawa, K., Kewley, L. J., Lord, S., Madore, B. F., Melbourne, J. E., Murphy, E. J., Rich, J. A., Schulz, B., Sturm, E., Vavilkin, T., & Xu, K. 2013, ApJS, 206, 1
- Tran et al. (2001) Tran, Q. D., Lutz, D., Genzel, R., Rigopoulou, D., Spoon, H. W. W., Sturm, E., Gerin, M., Hines, D. C., Moorwood, A. F. M., Sanders, D. B., Scoville, N., Taniguchi, Y., & Ward, M. 2001, ApJ, 552, 527
- Verstraete et al. (2001) Verstraete, L., Pech, C., Moutou, C., Sellgren, K., Wright, C. M., Giard, M., Léger, A., Timmermann, R., & Drapatz, S. 2001, A&A, 372, 981
- Voit (1992) Voit, G. M. 1992, MNRAS, 258, 841
- Weedman et al. (2005) Weedman, D. W., Hao, L., Higdon, S. J. U., Devost, D., Wu, Y., Charmandaris, V., Brandl, B., Bass, E., & Houck, J. R. 2005, ApJ, 633, 706
- Werner et al. (2004) Werner, M. W., Roellig, T. L., Low, F. J., Rieke, G. H., Rieke, M., Hoffmann, W. F., Young, E., Houck, J. R., Brandl, B., Fazio, G. G., Hora, J. L., Gehrz, R. D., Helou, G., Soifer, B. T., Stauffer, J., Keene, J., Eisenhardt, P., Gallagher, D., Gautier, T. N., Irace, W., Lawrence, C. R., Simmons, L., Van Cleve, J. E., Jura, M., Wright, E. L., & Cruikshank, D. P. 2004, ApJS, 154, 1
- Yan et al. (2005) Yan, L., Chary, R., Armus, L., Teplitz, H., Helou, G., Frayer, D., Fadda, D., Surace, J., & Choi, P. 2005, ApJ, 628, 604