Mira Variable Stars From LAMOST DR4 Data:
Emission Features, Temperature Types, and Candidate Selection
Abstract
Based on an extensive spectral study of a photometrically confirmed sample of Mira variables, we find a relationship between relative Balmer emission-line strength and spectral temperature of O-rich Mira stars. The flux ratio increases from less than unity to five as stars cool down from M0 to M10, which is likely driven by increasing TiO absorption above the deepest shock-emitting regions. We also discuss the relationship between the equivalent widths of the Balmer emission lines and the photometric luminosity phase of our Mira sample stars. Using our 291 Mira spectra as templates for reference, 191 Mira candidates are newly identified from the LAMOST DR4 catalog. We summarize the criteria adopted to select Mira candidates based on emission-line indices and molecular absorption bands. This enlarged spectral sample of Mira variables has the potential to contribute significantly to our knowledge of the optical properties of Mira stars and will facilitate further studies of these late-type, long-period variables.
Subject headings:
catalogs — stars: AGB and post-AGB — stars: late-type — stars: statistics — surveys1. Introduction
Mira stars are a class of late-type, long period variables (LPVs) that coincide with the coolest, most luminous part of the asymptotic giant branch (AGB). The AGB is the final stellar evolutionary phase of low- to intermediate-mass (1–8 ) stars before the envelope ejection phase (Habing & Olofsson, 2003). Miras are, by definition, AGB variable stars exhibiting large luminosity amplitudes (>2.5 mag in the band) with periods in excess of 80 days.
Just like other AGB giants, Miras can be divided into M-, S-, and carbon N-type stars. The differences among these groups are defined in terms of the relative abundances of oxygen and carbon in their photospheres. In M-type stars, a small amount of carbon in the stellar atmosphere is largely consumed by carbon monoxide (CO), so there is surplus oxygen left to form molecules such as TiO. During the thermally pulsating AGB (TP-AGB) phase, s-process elements (e.g., ZrO) and carbon from deep inside the star can be dredged up to the surface in stars with sufficiently large initial masses. Stars containing both TiO and ZrO are known as MS stars. As a star evolves up the AGB, the dredge-up continues to enrich the stellar envelope, so more carbon soaks up all excess oxygen into CO, leading to pure S or SC stars. Further enrichment brings up plenty of carbon to form C2, CN, and/or CH molecules, which dominate the spectra of carbon N-type stars (Habing & Olofsson, 2003; Green, 2013; Van Eck et al., 2017). As soon as the C/O ratio increases to above unity, the difference in chemical composition leads to a significant decrease in the effective temperature, (Marigo et al., 2008).
Based on extensive observations of Mira stars since the 1940s, it has been found that one of the major spectral characteristics of these stars resides in their high-excitation emission lines. These lines vary over the pulsation cycle, but they are strongest around maximum light and weakest after minimum luminosity (Gray & Corbally, 2009). Shock-heating of the atmosphere is verifiably at the basis of these variations (Deutsch & Merrill, 1959; Gorbatskii, 1961; Willson, 1976; Fadeyev & Gillet, 2004).
For O-rich Miras, the emission-line flux of H is greater than that of H, which, in turn, is greater than that of H; H is weakest among the four lines in Balmer series. This so-called ‘Balmer increment’ is not found in C-rich stars, which show the opposite behavior (Merrill, 1940). This tendency for O-rich Miras was initially attributed to obscuration by overlying absorption (Merrill, 1945; Joy, 1947). Luttermoser & Bowen (1992) subsequently proposed that non-local thermal equilibrium (NLTE) radiative transfer on its own can also give rise to the phenomenon. However, their interpretation, based on Bowen (1988)’s models, assumed the existence of an extended chromosphere, which does not exist in real Mira variables. Instead, it is only the innermost shock region that produces the observable Balmer-line emission (Fox et al., 1984; Richter et al., 2003).
Apart from the hydrogen Balmer series, many metallic emission lines, such as Mgi, Mni, Sii, Fei, and Feii, as well as forbidden [Feii] emission lines, are also reported for M-type Mira stars. However, metallic emission lines appear late in the pulsation cycle, and vary independently of the hydrogen lines(Joy, 1954; Richter & Wood, 2001; Giridhar, 2010).
Mira variables have long been used as tracers of stellar populations, because they are visible beyond the Local Group (Rejkuba, 2004). Although Mira period–luminosity (PL) relations exhibit an intrinsic dispersion in the optical (de Grijs, 2011), it has been found that such dispersions are smaller at near- and mid-infrared (IR) wavelengths for Miras with thin dust shells and periods of less than 400 days (Whitelock et al., 2008; Matsunaga et al., 2009; Whitelock, 2013). Thus, their PL relations can be used to trace the structure of the Milky Way (MW) galaxy and beyond (Catchpole et al., 2016; López-Corredoira, 2017). Moreover, SiO masers from Mira stars have proved powerful tools for investigating stellar motions in optically obscured regions of the MW (Fujii et al., 2006; Deguchi et al., 2007, 2008, 2010; Deguchi, 2012). Stepping into the Gaia era, a first result from Gaia Data Release 1 (DR1) used Miras to probe the outer regions of the Large Magellanic Cloud (Deason et al., 2017). Therefore, increasing the number of either type of Mira stars would be very helpful for similar future studies.
Generally, the study of Mira stars involves both long-term IR photometric and carefully planned spectroscopic observations. Therefore, for years optical spectroscopy of Mira stars has focused on well-known targets. Thanks to the wide-field Large sky Area Multi-Object fiber Spectroscopic Telescope (LAMOST) survey, we now have a chance to perform a novel, comprehensive study of Mira variables, investigate their overall optical spectral properties, and provide insights into the physical mechanisms driving these late-type stars.
This paper is organized as follows. A brief introduction to the LAMOST survey and the sources of our photometrically confirmed Mira sample are given in Section 2. In Section 3, we provide a detailed description of our template Mira spectra, discuss new observational phenomena, and suggest possible stellar processes for interpretation. In Section 4, we outline the method used to search for Mira candidates in the LAMOST catalog. A discussion and conclusions of this work are given in Section 5.
2. Data
2.1. LAMOST
LAMOST is a 4 m-diameter reflective Schmidt telescope equipped with 4000 fibers in its focal plane, allowing it to obtain spectra covering the wavelength range from 380 to 900 nm at a spectral resolution of = 1800 (Zhao et al., 2012; Cui et al., 2012). The five-year General Survey of LAMOST (2012–2017) is mainly a Galactic stellar survey. As a major component, the ‘LAMOST Experiment for Galactic Understanding and Exploration’ (LEGUE) survey has been designed to target a uniform and (statistically) complete sample of all stellar populations (Deng et al., 2012). Therefore, Miras, as evolved AGB stars, are included in its observations.
By the end of March 2016, the LAMOST DR4 catalog had accumulated 7,681,185 spectra, of which 6,898,298 were of stars. These 1D spectra have been processed by the LAMOST data reduction system. Basic reduction steps such as de-biasing, flat-fielding, fiber tracing, sky subtraction, and wavelength calibration are included in its 2D pipeline. Absolute flux calibration has not been done. However, relative flux calibration was performed (in terms of the flux per unit wavelength) by selecting stars with high-quality spectra as standard stars. Using a cross-correlation method, the 1D pipeline assigns a spectral type and redshift to each 1D spectrum (Luo et al., 2012, 2015).
In this paper, we measure the spectral indices of LAMOST spectra. The relevant wavelength ranges of the indices and their shoulder bandpass(es) are included in Table 1. The definitions of the line indices, in terms of their integrated flux (; Section 3.2.1), equivalent width (EW; Sections 3.4, 4.3, and 4.4), and the band indices (; Section 4.2) will be included when they are first used in the text.
| Name | Index Bandpass (Å) | Shoulder Bandpass(es) (Å) |
|---|---|---|
| H | 4096–4109 | 4085–4094, 4112–4122 |
| Fe4202 | 4197–4208 | 4183–4192, 4208–4217 |
| Fe4308 | 4304–4314 | 4291–4302, 4315–4323 |
| H | 4332–4347 | 4320–4332, 4349–4352 |
| Fe4376 | 4370–4382 | 4361–4370, 4383–4392 |
| Mg4571 | 4567–4576 | 4556–4566, 4578–4584 |
| H | 4857–4868 | 4845–4855, 4875–4880 |
| H | 6548–6578 | 6505–6540, 6580–6610 |
| CaH2 | 6814–6846 | 7042–7046 |
| CaH3 | 6960–6990 | 7042–7046 |
| TiO5 | 7126–7135 | 7042–7046 |
2.2. A Photometrically Confirmed Sample
We compiled a photometrically confirmed sample of Mira variables from the Kiso Wide-Field Camera (KWFC) Intensive Survey of the Galactic Plane (KISOGP) (Matsunaga, 2017), the American Association of Variable Star Observers (AAVSO) International Database Variable Star Index (VSX; Watson, 2006, version 2017-05-02; we selected stars of variability type ‘M’), and the SIMBAD Astronomical Database.
The KISOGP survey uses the KWFC mounted on the 105 cm Schmidt telescope at Kiso observatory, Japan. Having obtained -band photometric measurements of –16.5 mag, from 2012 to 2015, this survey identified more than 700 Mira stars in the northern Galactic disk with periods between 100 and 600 days, of which roughly 90% were newly found.
We first cross-matched the KISOGP and VSX Miras with the LAMOST DR4 catalog. Spectra that suffer from serious contamination by sky lines, low signal-to-noise ratios (SNRs), flux saturation, or which display characteristics of a binary spectrum were excluded from the Mira sample. This resulted in 19 and 238 spectra for, respectively, KISOGP and VSX targets. (Eight spectra were in common between the VSX and KISOGP catalogs; they were only included among the 19 spectra with KISOGP designations.)
For KISOGP targets, the period and epoch (date of light maximum) were calculated from the KISOGP light curves using generalized Lomb Scargle (GLS) fitting (Zechmeister & Kürster, 2009), which is a common approach to estimate the sinusoidal primary frequency. The phases of each spectrum were calculated using
| (1) |
As regards VSX targets, if period or epoch information was available in the VSX catalog, we estimated the phase using Eq. (1), and adopted the resulting value if
| (2) |
to ensure accuracy. For targets without such information, we searched for their light curves in the Northern Sky Variability Survey111http://www.skydot.lanl.gov/nsvs/nsvs.php (Woźniak et al., 2004, NSVS) and the All Sky Automated Survey222http://www.astrouw.edu.pl/asas/?page=aasc (Pojmański, 2014, ASVS). If available, we fitted the light curve and repeated the steps of Eqs (1) and (2).
Finally, we cross-matched the DR4 catalog with the SIMBAD database, because some Mira stars have a SIMBAD designation but are not included in the VSX or KISOGP catalogs. This procedure resulted in the identification of another 34 Mira spectra,33324 of them are also tabulated in the VSX, 22 of which as semi-regular variables and the other two are marked as long-period variables. resulting in a total number of 291 Mira spectra.
3. Mira Spectra
3.1. Overview: the Spectral Sequence
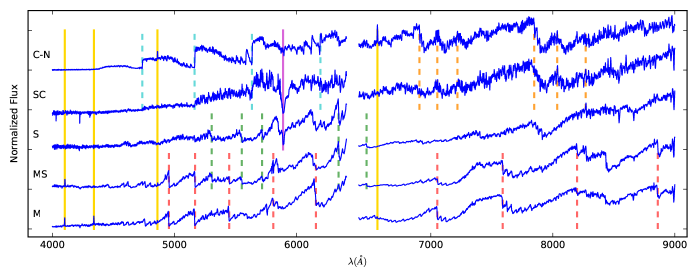
Based on the TiO, ZrO, C2 and CN molecular bands, we broadly divided the 291 Mira spectra into O-rich (258) and C-rich (33) Miras. Among the C-rich spectra, six are of type SC, which show no TiO, weak or no ZrO/C2, and very strong D lines, as defined in the Boeshaar–Keenan System (Keenan & Boeshaar, 1980). Among the O-rich spectra, about 20 are of types MS or S, which show prominent ZrO features. We show one spectrum of each type in Figure 1. The Balmer decrement in C-rich Miras () and the Balmer increment in O-rich Miras are also clearly seen.
Molecular dissociation calculations (Scalo & Ross, 1976) have demonstrated that the sequence M MS S SC C represents an increase in the ratio of carbon to oxygen; this ratio passes through a value of unity in SC stars (Gray & Corbally, 2009). The sample of LAMOST Mira spectra covers the entire evolutionary sequence of Mira variables in the TP-AGB phase.
3.2. O-rich
3.2.1 Balmer Emission in Subtypes
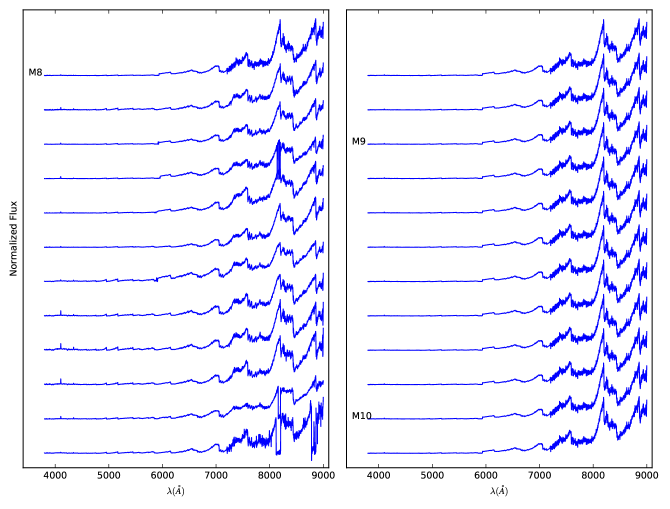
From among the 258 O-rich spectra, we selected 104 with observable Balmer emission(s), and assigned a temperature type to each of them by comparison with the LAMOST M0–M6 giant templates from Zhong et al. (2015, hereafter Z15), as well as the M0–M10 intrinsic templates derived by Fluks et al. (1994). From a careful comparison of these spectral templates, it follows that the Balmer increment relation only holds for late-type O-rich Miras (M5–M10). As for the early-type spectra, we see a Balmer decrement for M1 and M2, but H is weak in the only M0 spectrum in our sample. We also observe nearly equivalent strength for the Balmer lines in the case of M3. For spectra later than M4, the strengths of H and H decrease and H becomes the strongest line.
We use the flux ratio of H and H to quantify this relationship, because they are visible for the longest duration. We define the integrated line flux as
| (3) |
where is the flux of the spectral line in the relevant index bandpass (see Table 1) and is the pseudo-continuum estimated through linear interpolation in the shoulder bandpass(es).
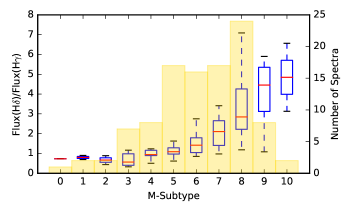
Box-and-whisker plots of for each subtype are shown in Figure 2, with the background yellow histogram indicating the number of spectra used for each subtype. Our sample is dominated by M5–M8. From M0 to M3 the ratio does not change much; it even decreases somewhat. The median inverts from ‘1’ to ‘1’ between M4 and M5. For spectra later than M5, the ratio increases. More M0–M4 and M9–M10 templates are needed to render this relation more accurate. From Figure 2, we are aware of the large intrinsic variance within each type, so this relationship cannot be used individually to assign spectral types to optical spectra.
Early observations by Merrill (1945) of bright Mira stars revealed that the low intensities of H, H, and H are mainly owing to absorption by TiO molecular bands. These overlapping absorptions originate above the deepest shock layer, and they can thus effectively block radiation from internal atmospheric layers where the Balmer lines are formed (Siviero et al., 2016). Our result agrees well with this scenario: as an AGB star cools down from M0 to M10, the TiO bands strengthen gradually, so more flux is absorbed by the lower-order Balmer lines, leading to an increase in . Note that narrow portions of H and H are sometimes absorbed by superimposed metal lines of iron, vanadium, yttrium, and indium (Adams, 1941; Joy, 1947), but this effect has little influence on the overall integrated flux of low-resolution spectra.
Also note that all five M0–M2 spectra in our O-rich sample have strong Balmer lines, regardless of our knowledge that the emission strengths are strongly correlated with luminosity phase.
3.2.2 Metallic Emission
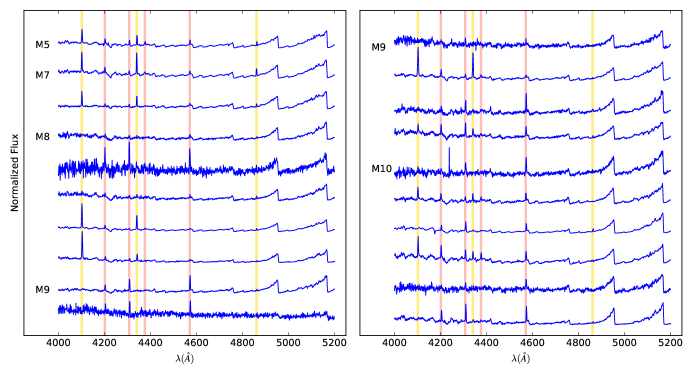 |
Among the 258 O-rich sample stars, we can distinguish four metallic lines in 20 spectra, as shown in Figure 3. The emission lines are Fe i 4202, 4308, 4376 and Mg i 4571, all of which are well-known emission features of Mira stars (Gray & Corbally, 2009). We note that 17 of the 20 spectra are of types M8–M10, with M5 being the earliest type. This is a strong indication that these four emission lines are mostly developed in late-type O-rich Miras.
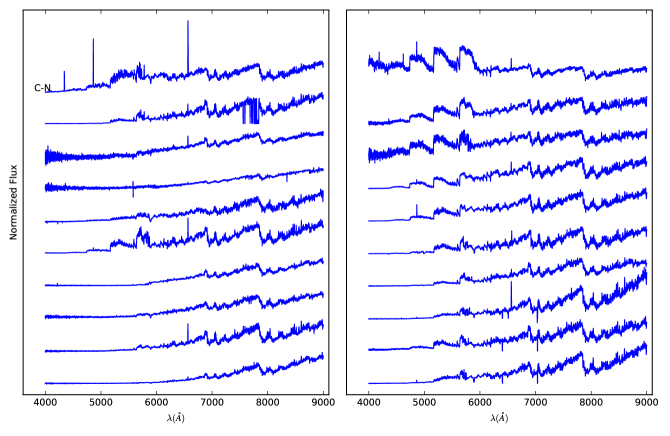
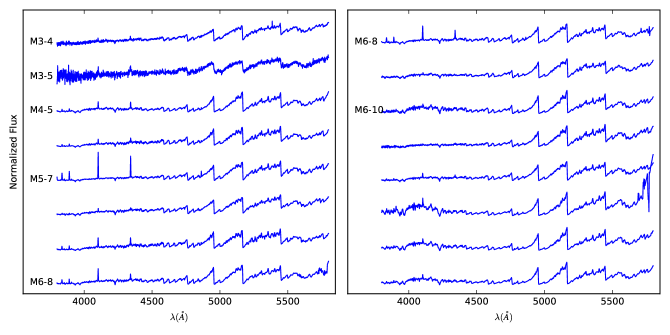
3.3. C-rich Spectra
All of our C-rich spectra are included in the Appendix (see Figure 11). The small number of C-rich sample stars, as well as the difficulty in finding a clean control sample of non-variable carbon N-type spectra, prevents us from carrying out a detailed study similar to what we did for our O-rich sample.
However, there are still two features of interest. First, more than half of the 33 spectra exhibit very strong H emission, much stronger than the weak emission shown in Barnbaum et al. (1996, the Bambaum Atlas includes a sample of non-variable carbon N-type stars). Second, except for two SC-type stars, none of our C-rich sample spectra show the Caii 8498,8542,8662 triplet.
3.4. Emission as A Function of Phase
We will next investigate the relationship between the Balmer emission strength and the corresponding luminosity phase, . Use of the flux-based definition of the line index, Eq. (3), is most appropriate when comparing fluxes of different lines based on a single spectrum, but here we need to characterize the emission strengths for all emission spectra in our sample. Hence, we use the EW (Worthey et al., 1994) as an indication of line strength. The EW is defined as
| (4) |
where and have the same meaning as in Eq. (3).
For spectra with low SNRs, fluxes in the shoulder bandpass(es) tend to be noisy, and thus the pseudo-continuum estimated through linear interpolation does not always represent the continuum level very well. Hence, we define a local SNR for every line index to quantify the significance of the measured EW. Using the concept of the inverse variance,
| (5) |
where the definition domain of includes the shoulder bandpass(es). For a spectrum with SNR , the typical uncertainty in the EW of an atomic line is less than 0.1 Å(Liu et al., 2015). Note that for emission lines the relevant EWs are negative, so the smallest value indicates the strongest line strength.
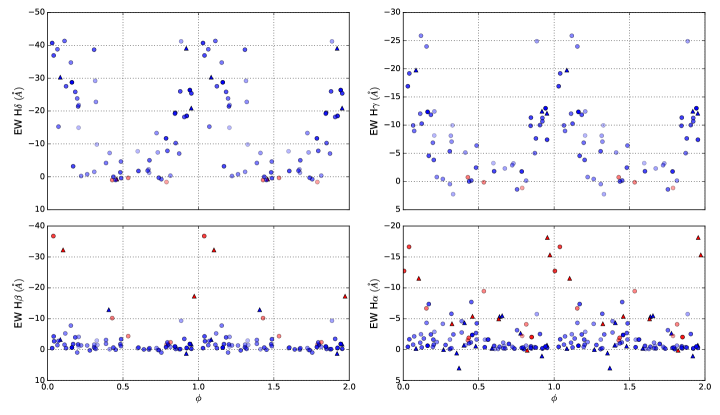
The measured emission-line indices were accepted if was greater than 5, and the number of bad pixels in the index bandpass was zero. The resulting measurements are shown in Figure 4.
The top two panels show the EW as a function of for H and H. The general trend of ‘higher luminosity, stronger emission’ for O-rich Miras is consistent with many previous case studies (e.g., Fox et al., 1984; Fox & Wood, 1985; de Laverny & Magnan, 1995; Castelaz et al., 2000). The bottom two panels clearly show that the C-rich Miras exhibit stronger emission in lower-order lines and particularly much greater variation in H. Mikulášek & Gráf (2005) showed that for C-rich Miras, the H EW is also strongly correlated with photometric phase. This can also be seen in the bottom right-hand panel of Figure 4.
Our limited sample is based on observations of different stars over different pulsation cycles, and it is thus not accurate enough to derive strict relations. However, it can provide an approximate test of how LAMOST spectra can support previous studies and provide us with information regarding which emission lines should be measured for the identification of O- and C-rich Mira candidates. Moreover, LAMOST has been scheduled to observe more KISOGP Miras, whose spectra will allow us to better constrain phases of light minima (or maxima), with higher precision. These data will allow us to provide a more secure treatment of the interaction between the propagation of shock waves and the stars’ pulsations.
4. Candidate Selection
In this section, we select possible Mira stars from the LAMOST DR4 catalog. We are motivated to do so with the expectation that such an inquiry may lead to the discovery of a large number of Mira candidates. The key steps are pre-selection based on photometric data, followed by spectral-line measurements.
4.1. Pre-selection
4.1.1 SNR Cut
Based on the notion that Miras have stronger fluxes at red wavelengths, we found the -band SNR to be a good diagnostic of high-quality Mira spectra. All of our 291 templates meet this criterion.
4.1.2 Header Subclass
As outlined in Section 2.1, every LAMOST spectrum has a spectral type assigned to it by the LAMOST 1D pipeline (Luo et al., 2015). This pipeline produces four primary classes, i.e., star, galaxy, qso, and unknown. Within the ‘star’ class, the ‘subclass’ keyword provides a more detailed subtype. For galaxies, quasars, or unknown objects, this keyword is set to ‘Non.’ To test the accuracy of the pipeline for Mira stars, we found that all of our sample objects were included in the ‘star’ or ‘unknown’ classes; the associated subclasses are included in Table 2.
| Type | Total | M | NonaaFailure to identify a subclass. | Carbon |
|---|---|---|---|---|
| Oxygen-rich | 258 | 219 | 38 | 1bbThis is a type-M9 spectrum, misclassified as a result of the small number of late-type M-giant templates. |
| Carbon-rich | 33 | 1ccThis is an SC-type star, misclassified as a result of the absence of S-star templates. | 5 | 27 |
Given that 257 of the 258 (99.6%) O-rich Mira templates are identified as ‘M’ or ‘Non,’ we selected the 311,867 spectra of these two subclasses as our O-rich Mira candidates. Although the automated pipeline is not sufficiently efficient in classifying carbon stars, Ji et al. (2016) already identified 108 N-type carbon stars in the LAMOST DR2 catalog, and Y. B. Li et al. (in prep.) identified 266 N-type carbon stars in the DR4 catalog using different techniques.44457 of the 266 carbon stars come from the LAMOST pilot survey; they are not included in the DR4 catalog. We included the results of these two studies and retrieved a total of 328 carbon stars, which were then combined with the 2184 spectra marked as ‘Carbon Star’ by the LAMOST pipeline. We subsequently removed all known Mira spectra from this database, yielding a total candidate number of 313,810.
4.1.3 2MASS Cuts

Next, these Mira candidates were mapped onto the Ks versus Ks plane. and Ks magnitudes were obtained through cross-identification with the Two Micron All-Sky Survey (2MASS) all-sky point source catalog (Skrutskie et al., 2006). Only those stars with good photometric data (an ‘A’ quality flag in the and Ks bands, i.e., 306,072 spectra) are shown in Figure 5. Among the 291 Mira templates, 229 Miras with high-quality 2MASS photometry are also included in the same plot. In Figure 5, 99.1% of the templates are sufficiently cool to be characterized by the empirical colors of giant stars, Ks mag (Wiśniewski et al., 2011), as well as bright, mag. Two outliers with Ks are relatively bluer O-rich Miras. Therefore, by applying careful cuts in the color–magnitude diagram, we can remove most of the possible contaminators, leaving 32,557 (24,819 accepted plus 7738 without good 2MASS data) candidates.
4.1.4 SIMBAD Data
Finally, these candidates were cross-matched with the SIMBAD database; 1064 objects have SIMBAD designations that rule out a possible Mira nature, thus leaving us with 31,493 candidates. In this step, we also collected 197 spectra of known young stellar objects (YSOs) and T Tauri stars (TTS), both of which are types of pre-main-sequence dwarf stars. Their spectra will also be used in the next step.
4.2. Selection of M Giants
Contamination among the 30,248 O-rich candidates occurs mainly in the form of M dwarfs and ‘Non’-marked spectra of other types. Mann et al. (2012) showed that molecular band indices of CaH2, CaH3, and TiO5 are good gravity indicators for the determination of giant and dwarf luminosity classes. Introduced by Reid et al. (1995), band indices are calculated using the ratio of the average flux over the specified wavelength range, i.e.,
| (6) |
Here, and are the mean fluxes of all pixels in the index bandpass and the shoulder bandpass defined in Table 1, respectively. is a unitless number between 0 and 1. It decreases as the absorption becomes stronger.
We map each candidate spectrum associated with a real value555191 of the measured indices are ‘infinity’ or ‘not a real number,’ which are the results of bad pixels or corrupted spectra. We inspected these spectra by eye and rejected them as Mira spectra. for the line index onto the CaH2+CaH3 versus TiO5 plane in Figure 6. Also included are the 258 O-rich templates (red) and the M0–M6 normal M-giant templates (blue) of Z15. Band indices of early-type giant stars are larger than those of late-type giants.
Ishihara et al. (2011) showed that some TTSs and YSOs have colors similar to O- or C-rich AGB stars. In addition, the optical spectra of M-type YSOs and TTSs (Saffe et al., 2003; Herczeg & Hillenbrand, 2014) also have strong Balmer emission lines. To test if the CaH2+CaH3 vs. TiO5 diagram can efficiently separate them from M giants, 197 spectra of YSO and TTSs (green) are shown in green.
Compared with M dwarfs, M giants are located in the top branch because of their weaker CaH molecular bands, and they are clearly distinguishable by a selection cut of
| (7) |
In the top right-hand region of Figure 6, a cluster of dots centered on (TiO5 = 1, CaH2+CaH3 = 2) do not have any CaH or TiO features and thus are not spectra of M-type stars. A small number of YSO and TTSs also reside in this region; these are F- or G-type stars. They should be excluded from our O-rich candidates by a selection cut of
| (8) |
After having applied the cuts of Eqs (7) and (8), the number of O-rich candidates has been reduced to 21,989. Most TTSs and YSOs are excluded by application of the two cuts.
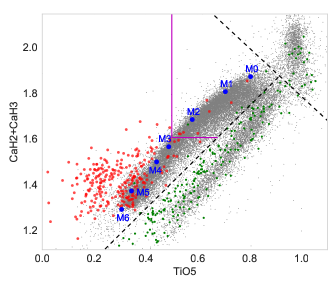
Following the distribution of M0–M6 templates, we roughly separated the accepted 21,989 candidates into 12,719 early- and 9270 late-type giants using cuts of
| (9) |
and
| (10) |
The intention of this separation is to leave spectra of M5–M10 for the next step, i.e., the measurement of metallic lines, because based on Section 3.2.2, we do not expect such emission to be present in warm O-rich spectra. We intentionally adopted a flexible and wide limit (retaining M3–M10 instead of M5–M10), since we allow for contamination of early-type spectra in the late-type group.
4.3. Fe and Mg Emission
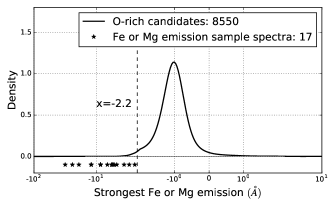
As suggested by Richter & Wood (2001, their Figure 23) and Gray & Corbally (2009, page 304), in O-rich Mira stars the metallic emission strength is not in phase with the Balmer strength. Therefore, before we measure the most commonly observed Balmer emission lines, line indices of Fei 4202,4308,4376 and Mgi 4571 were measured to identify Mira spectra with Fe or Mg emission, which might not display Balmer lines.
Our candidates are the 9270 late-type O-rich spectra obtained in the previous step, and our templates are the 20 emission spectra shown in Figure 3. Using Eq. (4) as our definition of the EW and Eq. (5) to quantify the local SNR, we only accepted EWs if their was no less than five, and if there was no bad pixel in the index bandpass, which means that we used the same criteria as those adopted in Section 3.4.
Figure 7 shows the probability density distribution of the strongest measured Fe or Mg EWs of our late-type, O-rich candidates. Here we choose the smallest value among the four measured line indices to single out the strongest emission. This might potentially bias the line indices to negative values for a given spectrum containing other spectral features or only noise across the measured wavelength range. Another potentially biasing effect is associated with an absorption band at 4582 Å, near the right-hand shoulder of Mgi 4571, which might cause an artificial emission feature and systematically drive the measured value to become smaller. Therefore, the peak of the profile in Figure 7 is centered on minus one rather than zero.
Since all of the 20 Fe or Mg emission spectra66617 have ‘accepted’ strongest EWs. among our templates have Å, we adopted a cut at
| (11) |
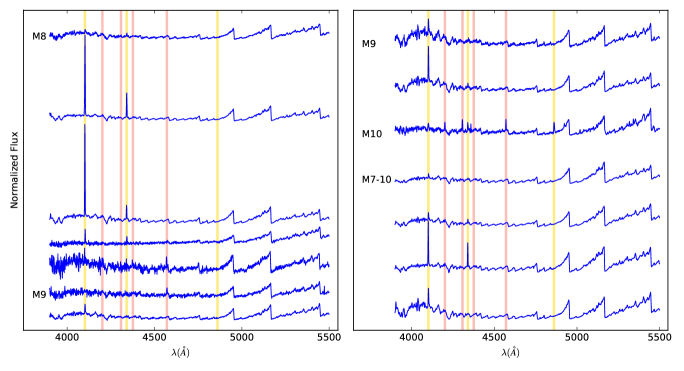
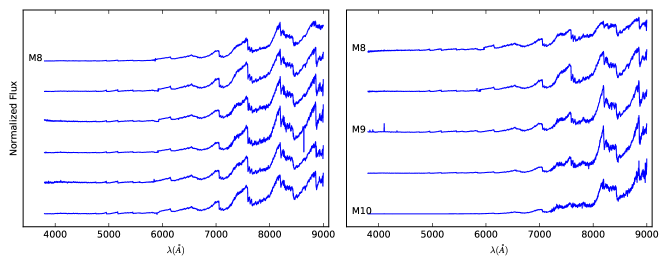
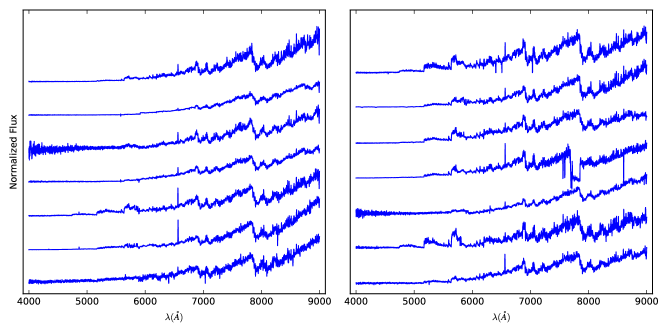
to select a sample composed of 338 candidates. We inspected the 338 spectra by eye. Most of their negative line indices are caused by noise. However, we also found 14 spectra in the range of M7–M10 that should be classified as Mira stars, as shown in the Appendix (see Figure 12). Three of these 14 spectra have prominent Fe or Mg lines (two with Balmer lines and one without), and the other 11 are classified based on the presence of hydrogen emission.
Now that we have successfully selected 14 Mira spectra, the number of O-rich candidates is reduced to 21,651.
4.4. Balmer Emission
| Step | Criteria | O-rich | C-rich | Total # candidates |
|---|---|---|---|---|
| 1 | 5,025,780 | |||
| 2 | LAMOST Pipeline subclass | 311,867 | 2184 | 314,051 |
| 3 | + Previously identified N-type star | 311,867 | 2314 | 314,181 |
| 4 | – Known Mira spectra | 311,537 | 2273 | 313,810 |
| 3 | >1 mag, <12 mag | 31,795 | 762 | 32,557 |
| 4 | – SIMBAD type: not a Mira | 30,738 | 755 | 31,493 |
| 5 | Eqs (7), (8) | 21,989 | 755 | 22,744 |
| 6 | Eq. (11) | 21,651(+14) | 755 | 20,542 |
| 7 | Eq. (12) | 937(+14) | 263 | 1214 |
| 8 | Inspection by eye | 106(+14) | 93 | 213 |
| 9 | Single epoch | 110 | 81 | 191 |
| R.A. (J2000) | Dec. (J2000) | Designation | EpochaaLAMOST Modified Julian Day (MJD). | SIMBADbbSIMBAD main type. | s | cc2MASS photometric uncertainty. | SpTypeddSpectral subtype. | ||||
|---|---|---|---|---|---|---|---|---|---|---|---|
| degree | degree | mag | mag | mag | mag | mag | mag | ||||
| 30.03712 | 41.62985 | J020008.90+413747.4 | 56256 | C* | 10.867 | 9.549 | 8.656 | 0.024 | 0.003 | 0.02 | Carbon |
| 301.53141 | 46.14646 | J200607.53+460847.2 | 56560 57298 eeLAMOST observed this target twice. | C* | 8.85 | 7.803 | 7.327 | 0.029 | 0.026 | 0.023 | Carbon |
| 78.49842 | 30.11585 | J051359.62+300657.0 | 55858 55909 | 8.902 | 7.931 | 7.44 | 0.026 | 0.026 | 0.02 | M5, M4ffTemperature type of different observations. | |
| 15.59558 | 37.91861 | J010222.93+375506.9 | 55907 | LPV* | 7.432 | 6.546 | 6.16 | 0.03 | 0.029 | 0.02 | M7 |
| 93.02157 | 12.11717 | J061205.17+120701.8 | 57388 | IR | 7.291 | 5.999 | 5.195 | 0.023 | 0.034 | 0.018 | M8 |
Note. — This table is available in its entirety in machine-readable form.
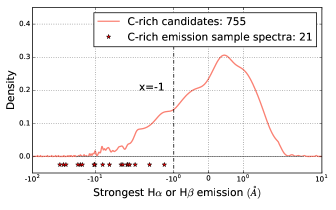
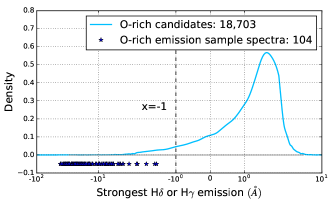
EWs of hydrogen emission lines need to be measured to identify Mira spectra, see Eq. (4), Table 1. We chose to measure the first two lines in the Balmer series (H and H) for our 755 C-rich candidates, and the next two lines (H and H) for the 21,651 O-rich candidates. Again, we adopted the smallest value as an indication of the emission features. The acceptance criteria for every measurement are also the same as those adopted in Sections 3.4 and 4.3. However, this time we do not retain the ‘rejected’ spectra in our next step, because a high SNR value in the Balmer region is essential for identification of Mira spectra. Balmer emission template spectra (21 C-rich and 104 O-rich) were measured at the same time. A more plausible diagnostic might be found in measuring H and H for C- and O-rich candidates, respectively. However, we measure two lines for each type, because if the of one line is low, we could potentially still use the other. In addition, one C-rich template spectrum only exhibits H emission (see Figure 11).
In each panel of Figure 8, the asterisk closest to zero is measured from a template spectrum whose Balmer emission can just be seen, and this can thus give us an upper limit to a distinguishable emission line. The peak of each profile is centered on a positive value, because for normal M giants and carbon stars, the Balmer lines are seen in absorption. For each panel a cut at
| (12) |
was adopted. We were thus left with 937 O-rich and 263 C-rich candidates, which were subsequently inspected by eye.
4.5. By-Eye Inspection
By-eye inspection can help us to decide whether a negative EW value represents real emission or just spectral noise. The major difficulty resides in identifying C-rich Mira spectra, because for normal C-rich stars of N spectral type, H tends to be filled in or weak in emission. We rejected spectra with deep Caii 8498,8542,8662 absorption features (Section 3.3). In addition, we tried to make sure that all selected C-rich spectra exhibited strong H or H emission. The 199 spectra identified in this step are shown in the Appendix (see Figures 13 and 14).
4.6. Spatial Distribution
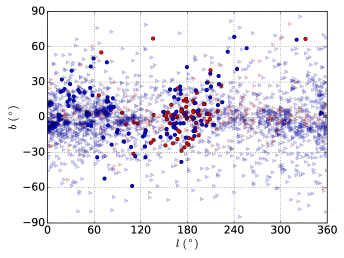
Figure 9 shows the spatial distribution of the newly identified Mira candidates in Galactic coordinates. Among the 2724 AAVSO Miras with available SIMBAD subtypes, the C- to O-rich ratio is only 0.13.777We did not include S stars, because they can be either O- or C-rich, and the total fraction of S-type Miras is small. As regards the 191 Miras identified using LAMOST, this ratio increases to 0.74. This difference might be the result of a difference between the spatial distributions of the different types of AGB stars. It has been reported that O-rich AGB stars are concentrated toward the Galactic Center, whereas C-rich AGB stars exhibit a relatively uniform distribution (Ishihara et al., 2011), including a few C-rich Miras recently confirmed in the bulge (Matsunaga et al., 2017). Since the target selection of the LAMOST survey is not spatially uniform, but has a concentration of stars in the Galactic Anticenter direction (Deng et al., 2012; Liu et al., 2014), our selected Miras contain larger numbers of carbon stars, and they are thus distributed more commonly toward the region.
5. Discussion and Conclusion
In this work, we have carefully studied 291 LAMOST spectra of known Mira stars to explore the optical properties of Miras. For O-rich stars, a relationship between the relative Balmer emission-line strength and spectral temperature is clearly shown. The emission-line flux ratio increases as stars cool down from M0 to M10. Spectra earlier than M4 exhibit stronger H than H, which is a new result reported here. This relation can be explained by overlying TiO molecular-band absorption affecting lower-order Balmer lines. Metallic emission of Fei 4202,4308,4376 and Mgi 4571 is only observed in late-type stars.
Based on the well-established relation between Balmer emission-line strength and the corresponding pulsation phase, our result shows that such a relation is indeed a population property exhibited by Mira variables. Future LAMOST observations can place stronger constraints on the rise duration and maximum phase of H and H for O-rich Miras.
Based on the characteristics of the 291 spectral templates, we identified 191 Mira candidates in the LAMOST DR4 catalog. Our criteria to select Mira stars make the most of a wide variety of available data (AAVSO VSX, SIMBAD, KISOGP, 2MASS, pipeline subclasses, spectral flux), and this is thus an efficient approach in terms of time commitment. Meanwhile, we made sure that every rejection was carefully assessed and that inaccurate measurements were not used. In terms of completeness, if we apply our the method outlined in Section 4, 135 of the 291 template spectra we studied in Section 3 can be selected. About half of the templates are rejected based on spectroscopic (null emission at a given phase) or photometric (bluer than the bulk of other Miras) criteria. Therefore, we estimate that the DR4 catalog may include a total of new Miras, with some remaining undetected.
Note that since Mira variables are defined by their luminosity variability, photometric observations are required to further confirm that the newly identified candidates are bona fide Mira stars. It is worth noting that six candidates have good photometric data and are located within the KISOGP field. The light curves of three candidates look like Miras (and all of them show long-term trends); two are found near the boundary between Miras and semi-regular variables, while the other is probably not a Mira. From this analysis we conservatively expect the ratio of bona fide Mira stars to the number of selected candidates to exceed 50%.
Newly discovered Mira candidates should usefully contribute to studies of stellar evolution of late-type stars (especially to shock-induced pulsation studies of C-rich stars) in the Galactic Anticenter. Eight of the 111 O-rich candidates are of type M0–M2, which are rare cases. This speaks volumes for LAMOST’s ability to capture the spectra of early-type Miras through such a ‘treasure hunt’. Also, at least 24 of the 191 Miras are located in the Galactic halo (Galactic latitude 30°) and can possibly be used as tracers of stellar streams, although their low space density may prevent us from investigating small structures.
References
- Adams (1941) Adams, W. S. 1941, ApJ, 93, 11
- Barnbaum et al. (1996) Barnbaum, C., Stone, R. P. S., & Keenan, P. C. 1996, ApJS, 105, 419
- Bowen (1988) Bowen, G. H. 1988, ApJ, 329, 299
- Castelaz et al. (2000) Castelaz, M. W., Luttermoser, D. G., Caton, D. B., & Piontek, R. A. 2000, AJ, 120, 2627
- Catchpole et al. (2016) Catchpole, R. M., Whitelock, P. A., Feast, M. W., et al. 2016, MNRAS, 455, 2216
- Cui et al. (2012) Cui, X.-Q., Zhao, Y.-H., Chu, Y.-Q., et al. 2012, RAA, 12, 1197
- Deason et al. (2017) Deason, A. J., Belokurov, V., Erkal, D., Koposov, S. E., & Mackey, D. 2017, MNRAS, 467, 2636
- de Grijs (2011) de Grijs, R. 2011, An Introduction to Distance Measurement in Astronomy, Wiley Acad. Publ.
- Deguchi et al. (2007) Deguchi, S., Fujii, T., Ita, Y., et al. 2007, PASJ, 59, 559
- Deguchi et al. (2008) Deguchi, S., Fujii, T., Ita, Y., et al. 2008, Astrophys. Space Sci. Proc., 4, 33
- Deguchi et al. (2010) Deguchi, S., Shimoikura, T., & Koike, K. 2010, PASJ, 62, 525
- Deguchi (2012) Deguchi, S. 2012, Cosmic Masers – from OH to H0, IAU Symp., 287, p. 265
- de Laverny & Magnan (1995) de Laverny, F., & Magnan, C. 1995, IAU Colloq. 155: Astrophysical Applications of Stellar Pulsation, 83, 419
- Deng et al. (2012) Deng, L.-C., Newberg, H. J., Liu, C., et al. 2012, RAA, 12, 735
- Deutsch & Merrill (1959) Deutsch, A. J., & Merrill, P. W. 1959, ApJ, 130, 570
- Fadeyev & Gillet (2004) Fadeyev, Y. A., & Gillet, D. 2004, A&A, 420, 423
- Fluks et al. (1994) Fluks, M. A., Plez, B., The, P. S., et al. 1994, A&AS, 105,
- Fox et al. (1984) Fox, M. W., Wood, P. R., & Dopita, M. A. 1984, ApJ, 286, 337
- Fox & Wood (1985) Fox, M. W., & Wood, P. R. 1985, ApJ, 297, 455
- Fujii et al. (2006) Fujii, T., Deguchi, S., Ita, Y., et al. 2006, PASJ, 58, 529
- Giridhar (2010) Giridhar, S. 2010, Bull. Astron. Soc. India, 38, 1
- Gorbatskii (1961) Gorbatskii, V. G. 1961, Soviet Ast., 5, 192
- Gray & Corbally (2009) Gray, R. O., & Corbally, C., J. 2009, Stellar Spectral Classification, Princeton, NJ: Princeton Univ. Press
- Green (2013) Green, P. 2013, ApJ, 765, 12
- Habing & Olofsson (2003) Habing, H. J., & Olofsson, H. 2003, Asymptotic giant branch stars, New York, Berlin: Springer
- Herczeg & Hillenbrand (2014) Herczeg, G. J., & Hillenbrand, L. A. 2014, ApJ, 786, 97
- Ishihara et al. (2011) Ishihara, D., Kaneda, H., Onaka, T., et al. 2011, A&A, 534, A79
- Ji et al. (2016) Ji, W., Cui, W., Liu, C., et al. 2016, ApJS, 226, 1
- Joy (1947) Joy, A. H. 1947, ApJ, 106, 288
- Joy (1954) Joy, A. H. 1954, ApJS, 1, 39
- Keenan & Boeshaar (1980) Keenan, P. C., & Boeshaar, P. C. 1980, ApJS, 43, 379
- Liu et al. (2015) Liu, C., Cui, W.-Y., Zhang, B., et al. 2015, RAA, 15, 1137
- Liu et al. (2014) Liu, X.-W., Yuan, H.-B., Huo, Z.-Y., et al. 2014, Setting the scene for Gaia and LAMOST, 298, 310
- López-Corredoira (2017) López-Corredoira, M. 2017, ApJ, 836, 218
- Luo et al. (2012) Luo, A.-L., Zhang, H.-T., Zhao, Y.-H., et al. 2012, RAA, 12, 1243
- Luo et al. (2015) Luo, A.-L., Zhao, Y.-H., Zhao, G., et al. 2015, RAA, 15, 1095
- Luttermoser & Bowen (1992) Luttermoser, D. G., & Bowen, G. H. 1992, Cool Stars, Stellar Systems, and the Sun, Giampapa, M. S., & Bookbinder, J. A., eds, ASP Conf. Ser., 26, 558
- Mann et al. (2012) Mann, A. W., Gaidos, E., Lépine, S., & Hilton, E. J. 2012, ApJ, 753, 90
- Marigo et al. (2008) Marigo, P., Girardi, L., Bressan, A., et al. 2008, A&A, 482, 883
- Matsunaga et al. (2009) Matsunaga, N., Kawadu, T., Nishiyama, S., et al. 2009, MNRAS, 399, 1709
- Matsunaga (2017) Matsunaga, N. 2017, arXiv:1705.08567
- Matsunaga et al. (2017) Matsunaga, N., Menzies, J. W., Feast, M. W., et al. 2017, MNRAS, 469, 4949
- Merrill (1940) Merrill, P. W. 1940, Spectra of long-period variable stars, Chicago, IL: Univ. Chicago Press
- Merrill (1945) Merrill, P. W. 1945, PASP, 57, 178
- Mikulášek & Gráf (2005) Mikulášek, Z., & Gráf, T. 2005, Contrib. Astron. Obs. Skalnate Pleso, 35, 83
- Neilson et al. (2014) Neilson, H. R., Ignace, R., & Henson, G. D. 2014, Precision Asteroseismology, Guzik, J. A., Chaplin, W. J., Handler, G., & Pigulski, A., eds, IAU Symp., 301, 463
- Osterbrock (1974) Osterbrock, D. E. 1974, Astrophysics of gaseous nebulae, San Francisco, CA: W. H. Freeman and Co.
- Pojmański (2014) Pojmański, G. 2014, Contrib. Astron. Obs. Skalnate Pleso, 43, 523
- Reid et al. (1995) Reid, I. N., Hawley, S. L., & Gizis, J. E. 1995, AJ, 110, 1838
- Rejkuba (2004) Rejkuba, M. 2004, A&A, 413, 903
- Richter et al. (2003) Richter, H., Wood, P. R., Woitke, P., Bolick, U., & Sedlmayr, E. 2003, A&A, 400, 319
- Richter & Wood (2001) Richter, H., & Wood, P. R. 2001, A&A, 369, 1027
- Saffe et al. (2003) Saffe, C., Gómez, M., Randich, S., et al. 2003, A&A, 409, 993
- Scalo & Ross (1976) Scalo, J. M., & Ross, J. E. 1976, A&A, 48, 219
- Siviero et al. (2016) Siviero, A., Munari, U., Righetti, G. L., & Graziani, M. 2016, Inf. Bull. Variable Stars, 6183, 1
- Skrutskie et al. (2006) Skrutskie, M. F., Cutri, R. M., Stiening, R., et al. 2006, AJ, 131, 1163
- Van Eck et al. (2017) Van Eck, S., Neyskens, P., Jorissen, A., et al. 2017, A&A, 601, A10
- Watson (2006) Watson, C. L. 2006, Soc. Astron. Sci. Annu. Symp., 25, 47
- Whitelock et al. (2008) Whitelock, P. A., Feast, M. W., & van Leeuwen, F. 2008, MNRAS, 386, 313
- Whitelock (2013) Whitelock, P. A. 2013, Advancing the Physics of Cosmic Distances, IAU Symp., 289, 209
- Willson (1976) Willson, L. A. 1976, ApJ, 205, 172
- Wiśniewski et al. (2011) Wiśniewski, M., Marquette, J. B., Beaulieu, J. P., et al. 2011, A&A, 530, A8
- Woźniak et al. (2004) Woźniak, P. R., Vestrand, W. T., Akerlof, C. W., et al. 2004, AJ, 127, 2436
- Worthey et al. (1994) Worthey, G., Faber, S. M., Gonzalez, J. J., & Burstein, D. 1994, ApJS, 94, 687
- Zechmeister & Kürster (2009) Zechmeister, M., & Kürster, M. 2009, A&A, 496, 577
- Zhao et al. (2012) Zhao, G., Zhao, Y.-H., Chu, Y.-Q., Jing, Y.-P., & Deng, L.-C. 2012, RAA, 12, 723
- Zhong et al. (2015) Zhong, J., Lépine, S., Li, J., et al. 2015, RAA, 15, 1154
![[Uncaptioned image]](/html/1708.04703/assets/x10.png) |
![[Uncaptioned image]](/html/1708.04703/assets/x11.png) |
![[Uncaptioned image]](/html/1708.04703/assets/x12.png) |
![[Uncaptioned image]](/html/1708.04703/assets/x13.png) |
 |
![[Uncaptioned image]](/html/1708.04703/assets/x15.png) |
 |
 |
![[Uncaptioned image]](/html/1708.04703/assets/x18.png) |
![[Uncaptioned image]](/html/1708.04703/assets/x19.png) |
![[Uncaptioned image]](/html/1708.04703/assets/x20.png) |
![[Uncaptioned image]](/html/1708.04703/assets/x21.png) |
 |
 |
![[Uncaptioned image]](/html/1708.04703/assets/x24.png) |
![[Uncaptioned image]](/html/1708.04703/assets/x25.png) |
![[Uncaptioned image]](/html/1708.04703/assets/x26.png) |
![[Uncaptioned image]](/html/1708.04703/assets/x27.png) |
 |