High-resolution of particle contacts via fluorophore exclusion in deep-imaging of jammed colloidal packings
Abstract
Understanding the structural properties of random packings of jammed colloids requires an unprecedented high-resolution determination of the contact network providing mechanical stability to the packing. Here, we address the determination of the contact network by a novel strategy based on fluorophore signal exclusion of quantum dot nanoparticles from the contact points. We use fluorescence labeling schemes on particles inspired by biology and biointerface science in conjunction with fluorophore exclusion at the contact region. The method provides high-resolution contact network data that allows us to measure structural properties of the colloidal packing near marginal stability. We determine scaling laws of force distributions, soft modes, correlation functions, coordination number and free volume that define the universality class of jammed colloidal packings and can be compared with theoretical predictions. The contact detection method opens up further experimental testing at the interface of jamming and glass physics.
I Introduction
The problem with the experimental investigation of jammed colloidal systems 1; 2; 3 is that it is difficult to look inside of a particulate packing. This is especially problematic from a theoretical standpoint. While recent theoretical advances have provided a fresh perspective on the long-standing packing problem — including replica theory from spin glasses, constraint satisfaction problems, geometrical and force ensembles — most of these theories are built from the bottom up 4; 5; 6; 7; 8; 9; 10; 11; 12; 13. Therefore, experimentally testing these theories requires full information of the contact network at sufficiently high resolution for resolving fragile contacts at the state of marginal stability observed during the jamming transition. Theoretical predictions of observables like coordination number (number of contacting particles), the scaling of the small-force distribution and geometrical order parameters require exact determination of contact between any two particles. While methods, like X-ray tomography, help analyze contacts between large grains 14; 15 (having diameter sizes on the order of mm) these methods are not as effective for studying jammed matter on colloidal length scales. Resolution is limited even in deep imaging of dense jammed colloids 16 and jammed emulsions 17; 18; 19; 20; 21 using confocal microscopy. Better resolution is needed if one seeks to determine whether two colloidal particles are in contact at a fragile state of marginal stability near the jamming transition. Here we use the fluorophore signal exclusion of quantum dot nanoparticles at the contact points to determine the contact network with higher resolution 22.
(a)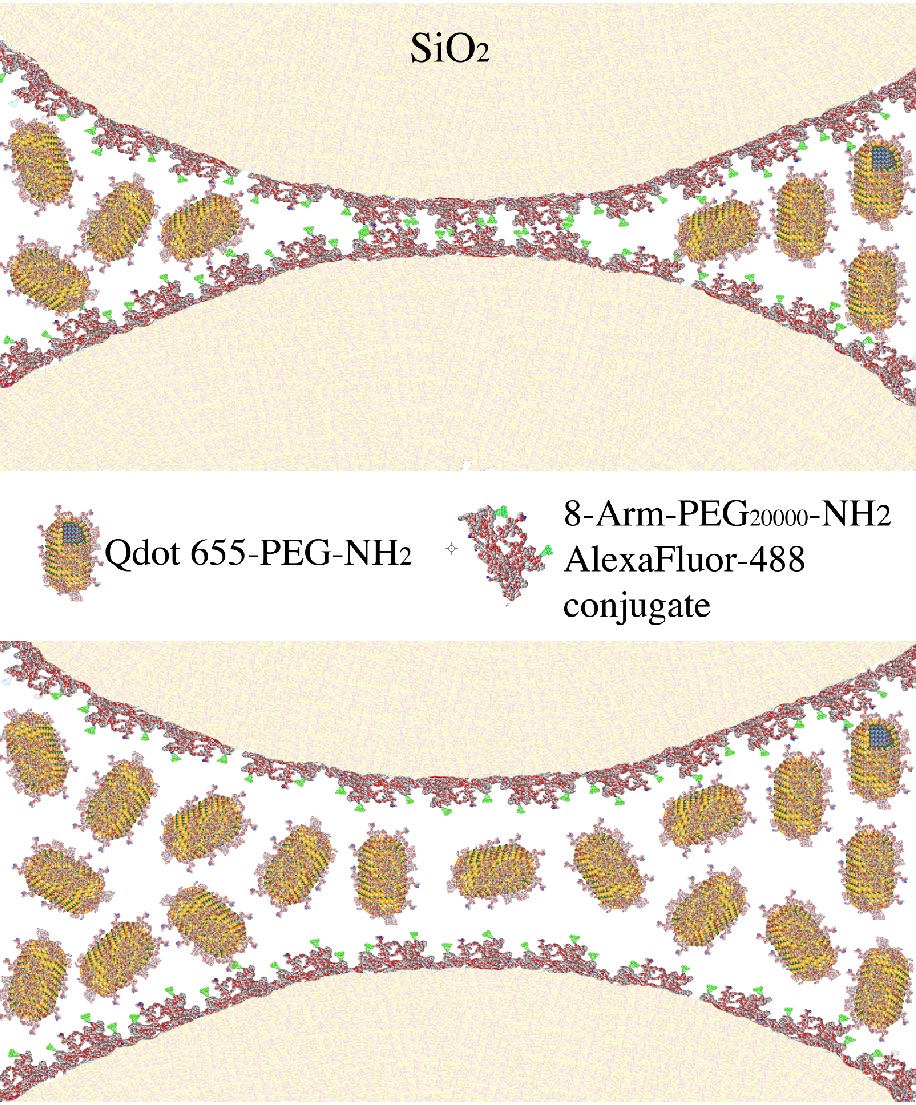 (b)
(b)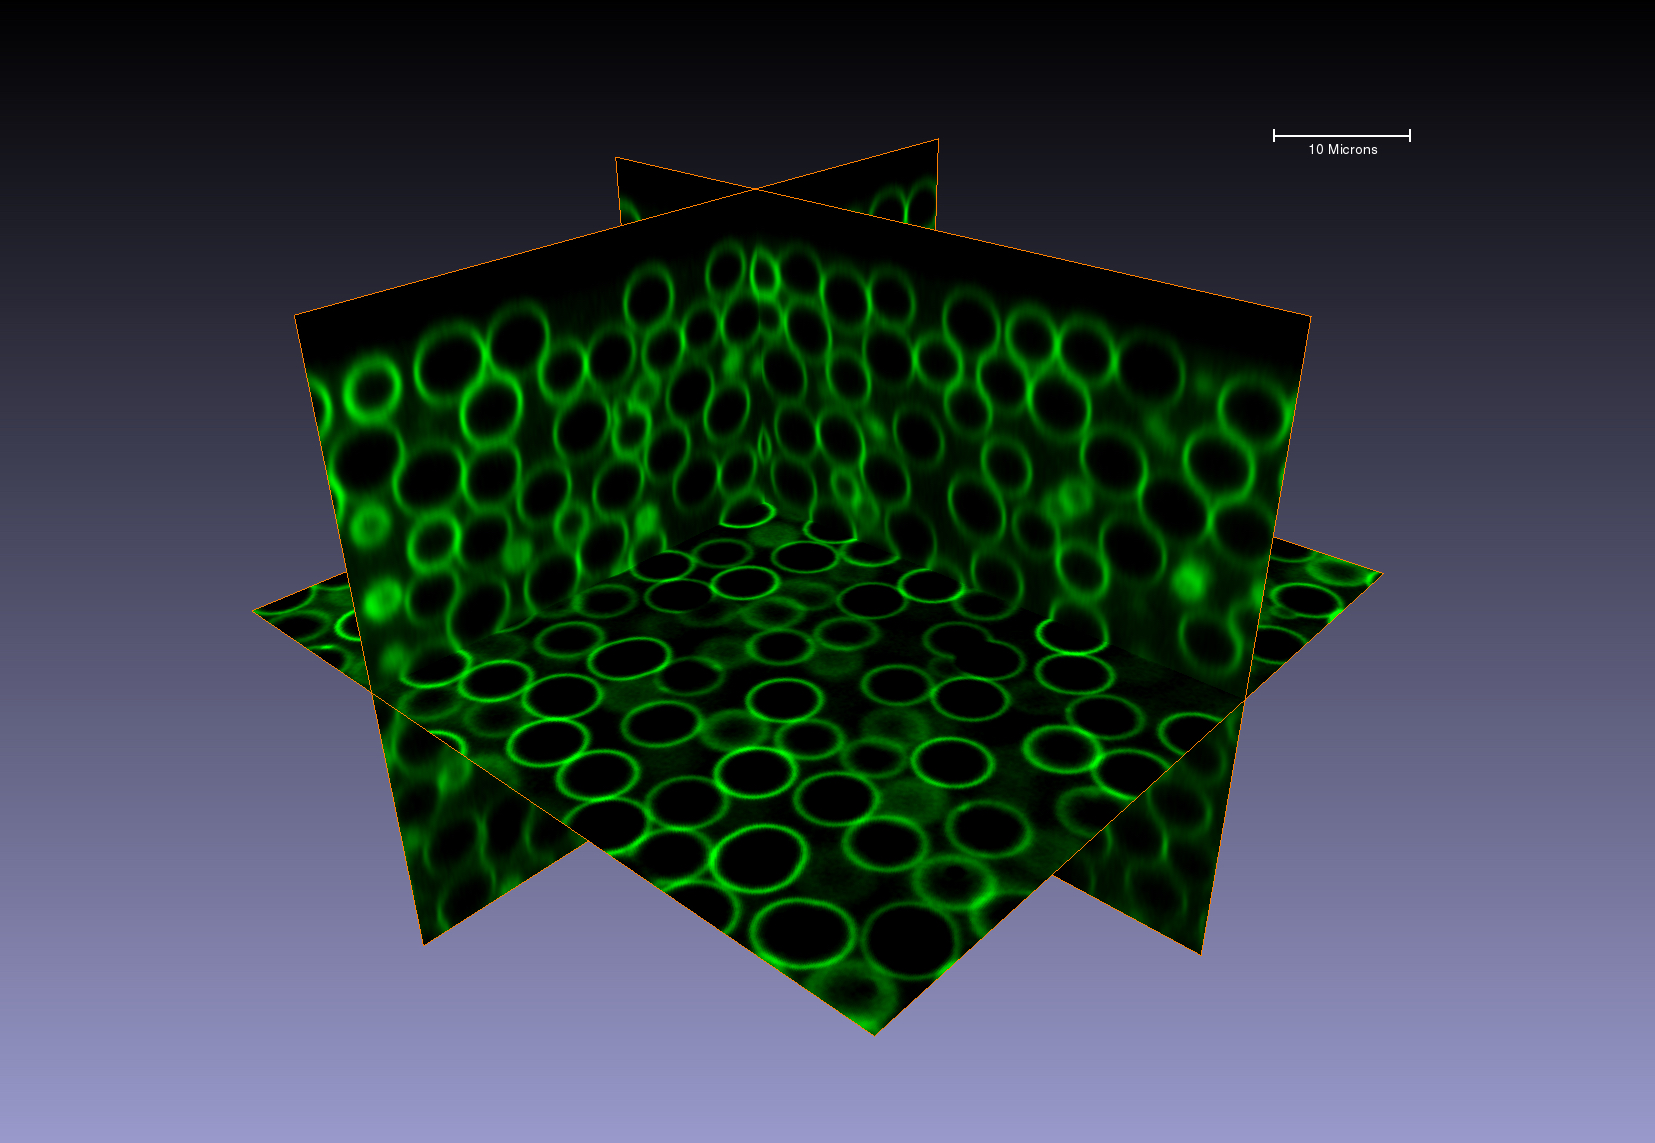
(c)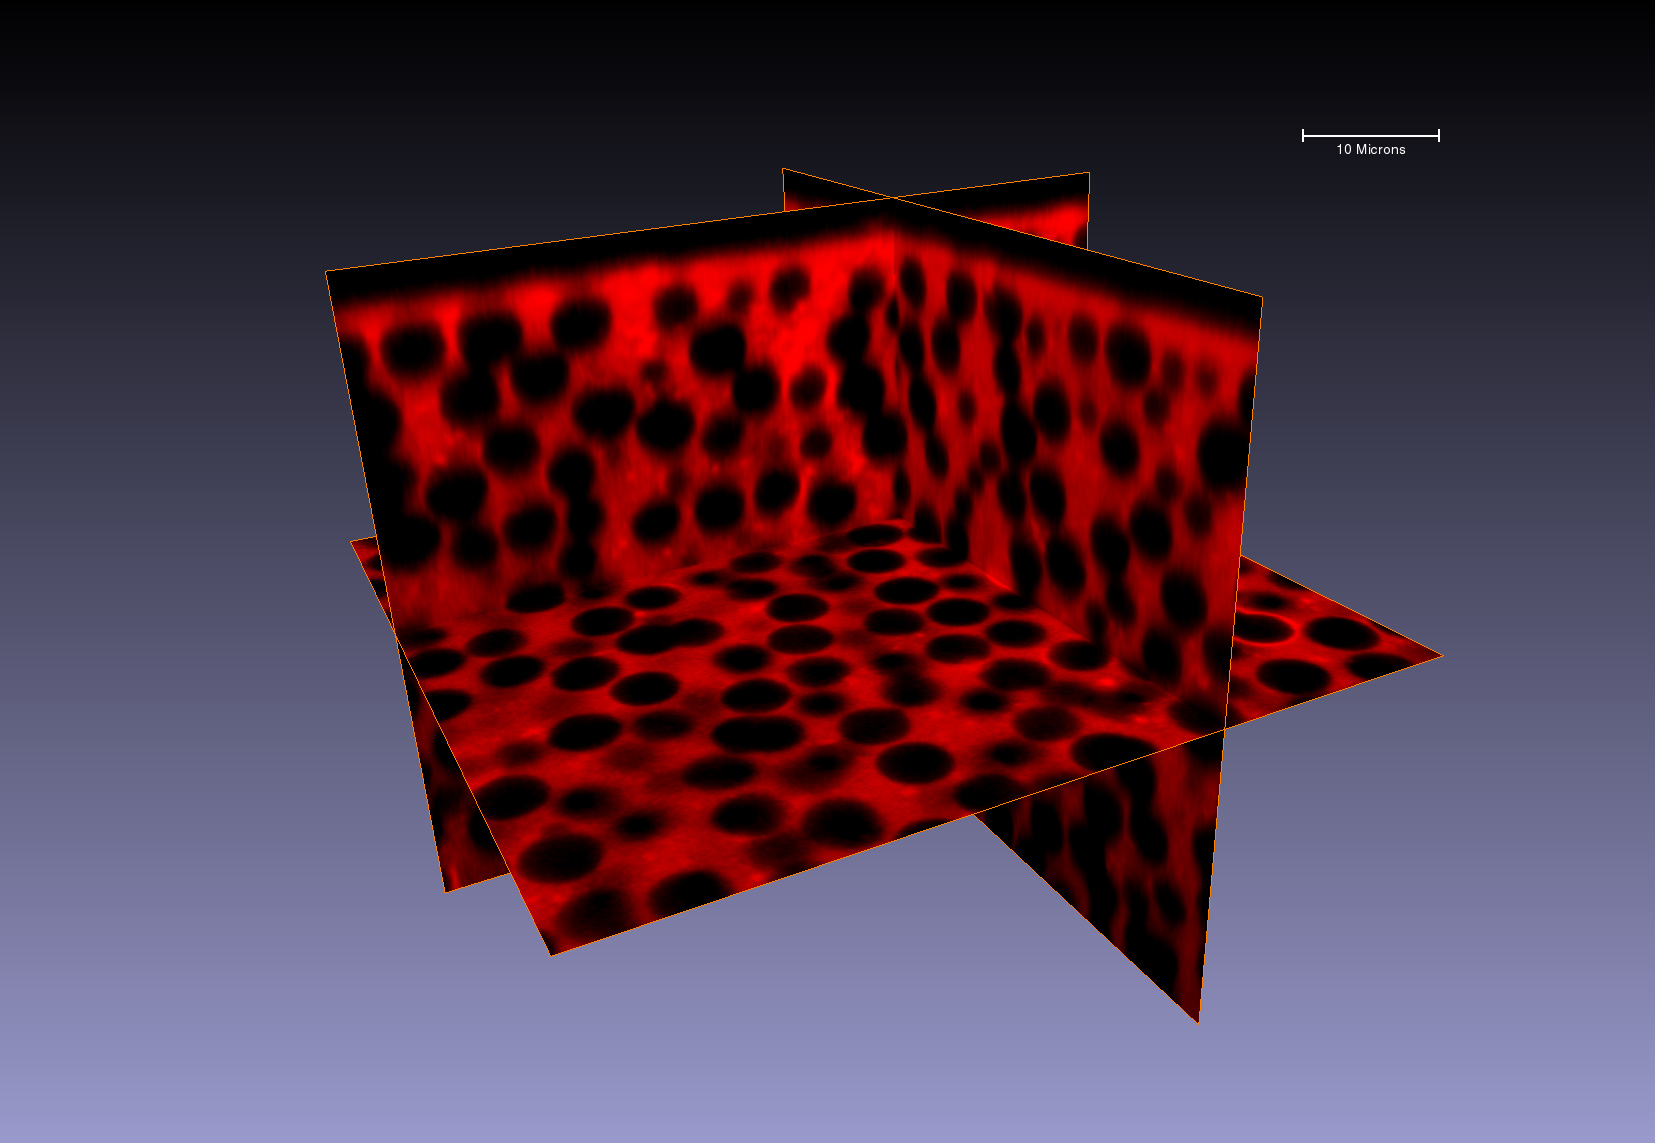
II Experimental methods
II.1 Sample preparation
We consider a colloidal system of green fluorescent (em: 515–555nm) silica microspheres in an aqueous-glycerol solution containing red fluorescent (em: 600–700nm) quantum dot (QD) nanoparticles. The green fluorescence on the surface of the microspheres comes from AlexaFluor® 488 (AF) manufactured by Life Technologies, Inc. This fluorescent dye is attached to surface of silica microspheres using amine and N-hydroxysuccinimide (NHS) ester reaction chemistry23. First Bis(succinimidyl) nona(ethlyene glycol), manufactured by ThermoFisher Scientific, Inc. is conjugated onto the surface of m SiO2-NH2 microspheres, manufactured by Bang Laboratories. The same chemistry then attaches 8-Arm polyethylene glycol (PEG) star-polymer (MW = 20kDa), manufactured by Nanocs, Inc. and finally attaches AlexaFluor® 488, AF (emission: 515–555nm). This surface chemistry is necessary for uniform fluorescence that is devoid of dark patches upon the surface of each particle. The added PEG also produces short-range steric repulsive interactions 24 that largely negates adhesive forces and minimizes friction between particles 25. This allows particles to move freely and to pack randomly in aqueous-glycerol solution.
The size and density of the fluorescent silica particles causes gravitational settling to exceed Brownian motion (i.e., Péclet number ). Hence, the particles pack naturally by sedimentation. Therefore, the “pressure” in each packing equals the weight of the particles themselves. Centrifugation momentarily adds to the weight or pressure of each packing to insure compaction. No centrifugation was used on packing A listed in table 1. Packings B and C were each centrifuged at 2210 and 4416, respectively, using an Eppendorf centrifuge (model 5804R).
Quantum dot (QD) nanoparticles manufactured by Thermo Fisher Scientific, Inc. (cylindrically shaped and approximately nm in size26 with a narrow red emission peak at 600–700nm) are added to the aqueous-glycerol solution of the compacted particulate system. The refractive index of the solution is carefully designed to match the refractive index of the particles which allows for deep-imaging into the packing using confocal microscopy. Fig. 1b-c show two 3D confocal images of green and red fluorescence from the same packing acquired at the same time using different fluorescent channels.
(a)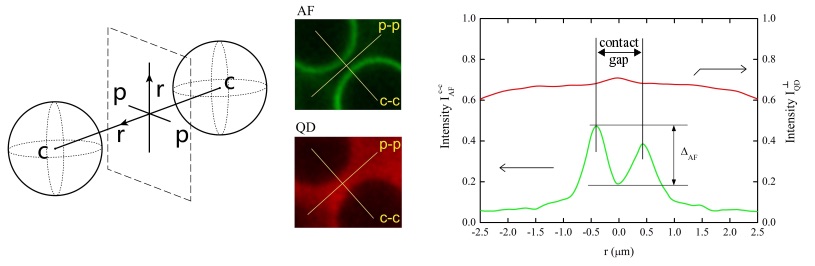
(b)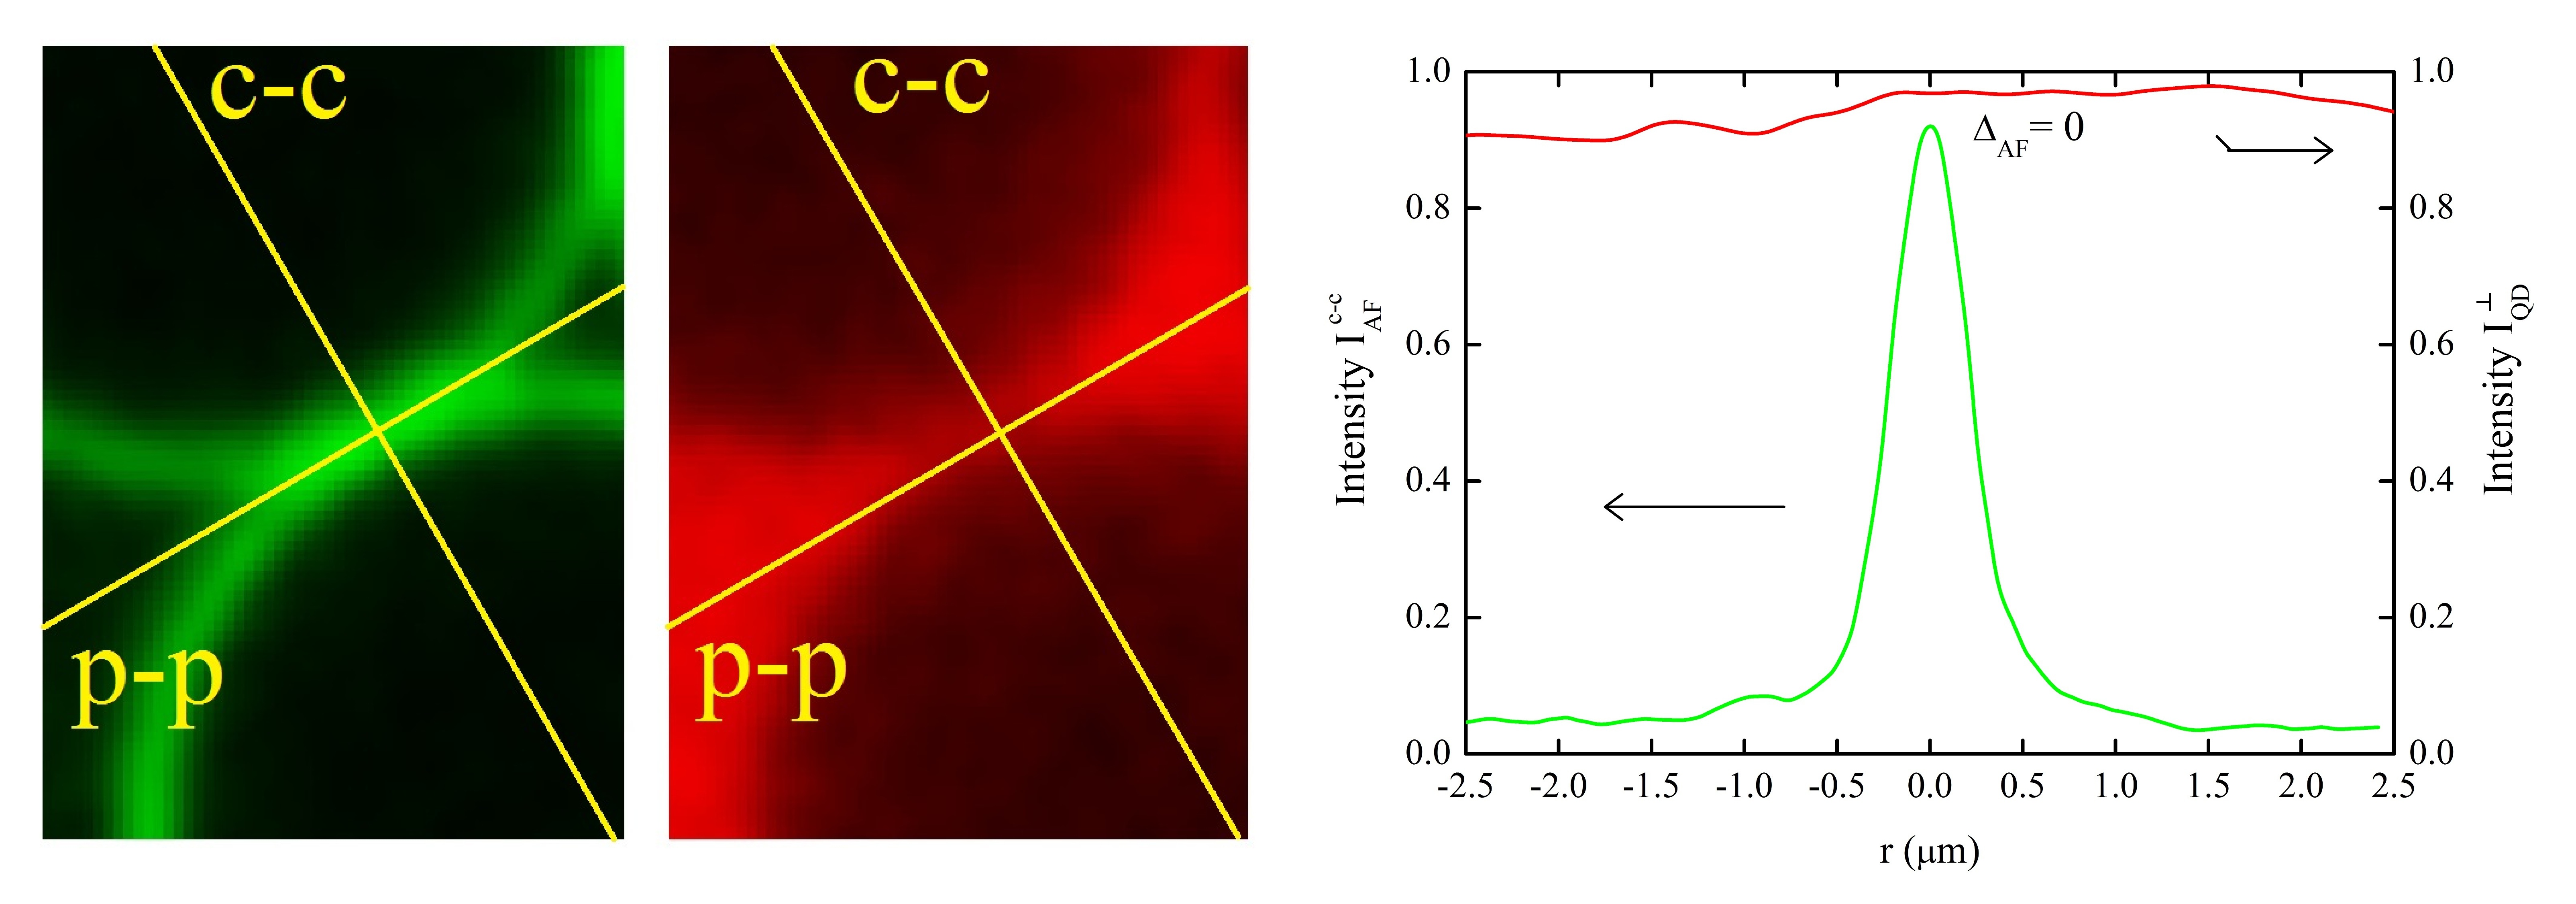
(c)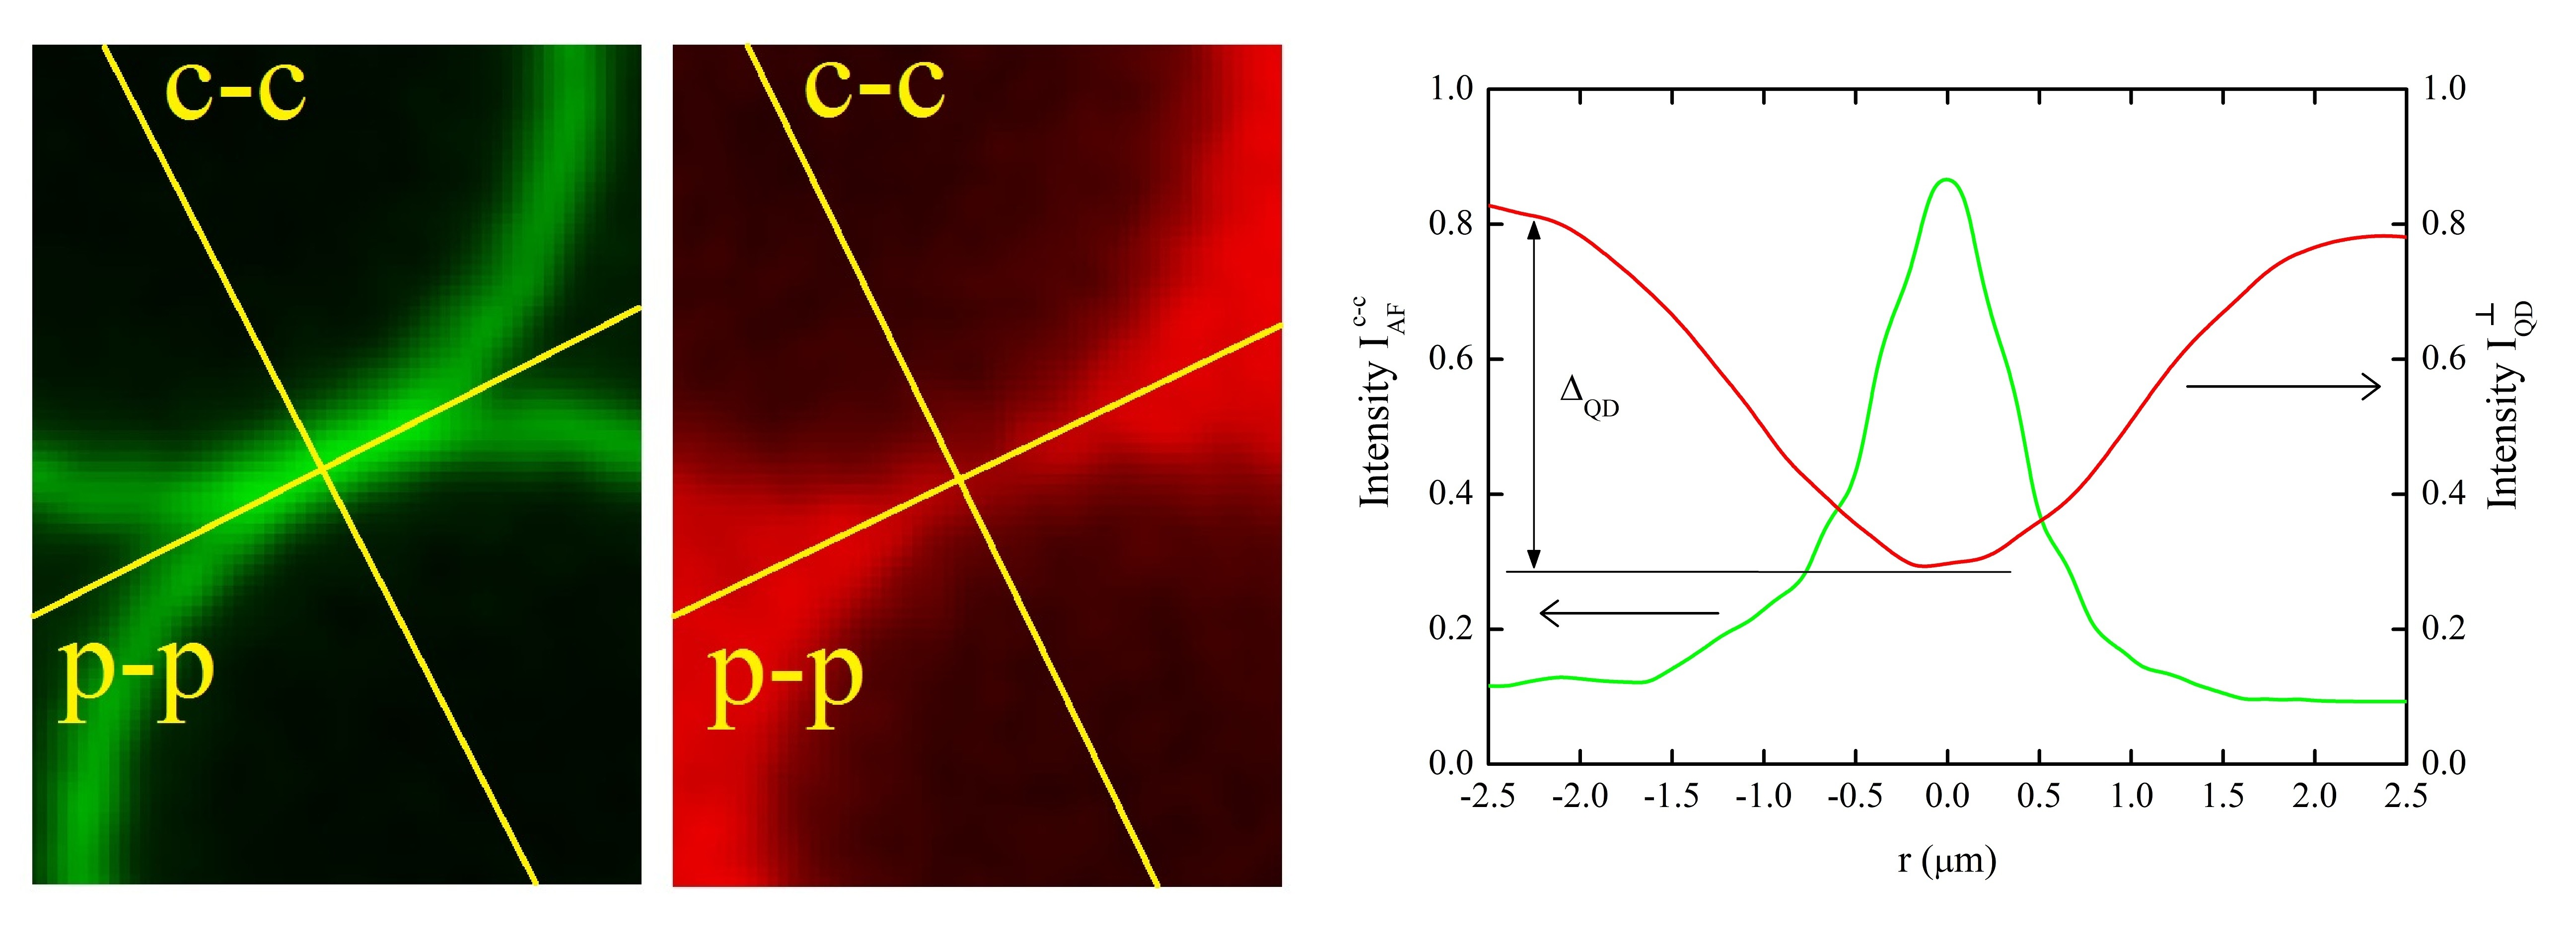
II.2 Analysis
The contact detection method probes the exclusion of quantum dot nanoparticles (QDs) from the contact gap between any two neighboring colloidal particles and also monitors the emission of AF at the surface of the particles. Fig. 1a provides a schematic representation of QDs being excluded from the contact gap. The exclusion of QDs is accompanied by a noticeable decrease in fluorescent signal from QDs. This decreasing signal intensity correlates with the size of the inter-particle space from which the QDs are excluded and thus provides a measure of the contact gap 27 in a process that we call fluorophore signal exclusion. We note that, technically, we are not measuring the size of QDs as in super-resolution Stimulated-Emission-Depletion (STED) techniques 28; 29. Thus, our detection method does not break the diffraction limit. Instead, we infer information on the contact gap by measuring the fluorescent signal from QDs and correlating it with the gap between particles.
Fig. 2a-c exemplify, for three characteristic cases of contacts, the intensity profile of AF () along a line c-c between the centers of nearest neighboring particles and the intensity profile of QDs () along a line p-p that is perpendicular to the line c-c as sketched in Fig. 2a, left panel.
Fig. 2a shows the case of well-separated particles. In this case, two adjacent peaks in locate the edges of neighboring particles (the green rings of AF). These peaks represent the bounding edges of the inter-particle space or the contact gap. Incidentally, the distance between the peaks is also the size of the contact gap. The flat profile of observed in Fig. 2a, right panel, represents QDs inside the contact gap that have not experienced exclusion due to the large size of the gap. In this case, the absence of a contact is unambiguous. We characterize similar cases of well-separated particles by measuring image-contrast, , which is defined as the difference between the highest and lowest values in between the two peaks (see Fig. 2a, right panel). When , the two peaks in are clearly distinguishable and the size of the contact gap is well above the diffraction limit. However, as the two peaks convolve into a single peak and the size of the contact gap becomes unresolvable.
In the case shown in Fig. 2b, the AF-detected contact gap disappears, , and neighboring particles seemingly touch. However, the emergence of a single peak in does not necessarily mean that a contact has been established. It simply means that the AF rings cannot be resolved any further. This resolution-limit occurs at 0.23m (see Fig. 3a). Although and particles appear to be touching in Fig. 2b, we still observe a flat profile in similar to that seen in Fig. 2a. The flat profile in suggests the contact gap is still large enough to accommodate QDs. Therefore, even though the rings have merged, we identify contacts like Fig. 2b as non-contacts or false positive contacts. This improves upon earlier methods 17; 19; 20; 21, where monitoring the fluorescence from AF rings alone would have identified similar non-contacts as positive contacts.
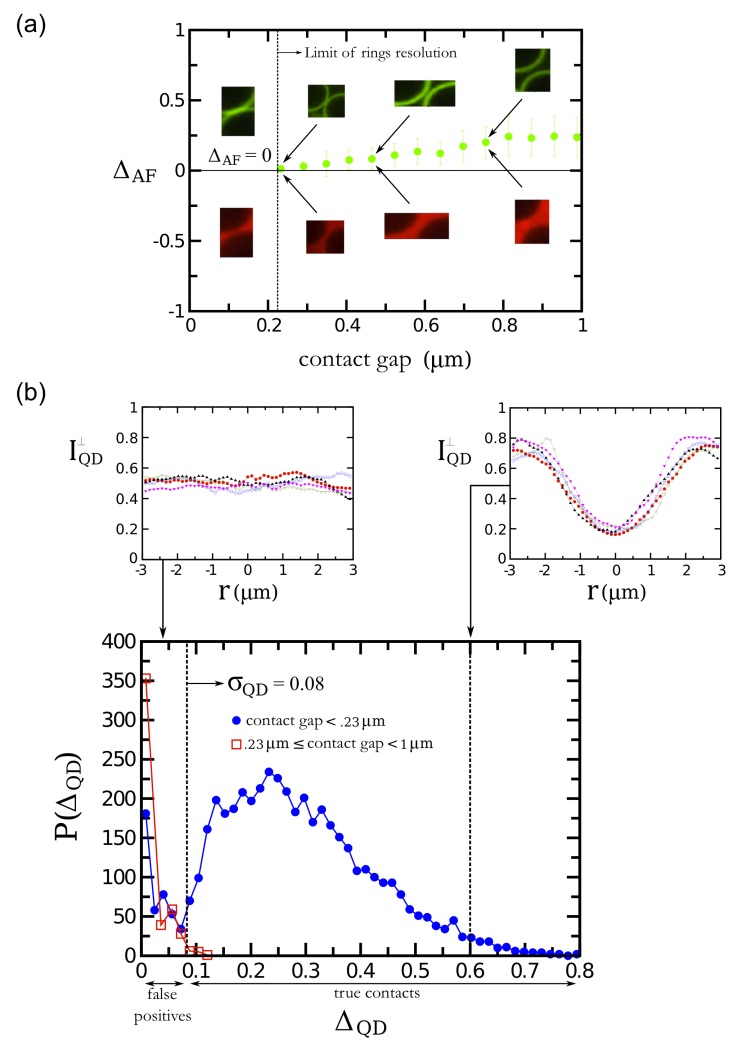
Now instead of relying upon AF rings alone, a dip in , resolves the contact gap at higher resolution to identify the most probable positive contacts. Fig. 2c shows a dip in that is measured as . The signature of a resolved contact at higher resolution is the emergence of a dip in QD fluorescence signal exclusion as seen in Fig. 2c. This occurs when and the contact gap is smaller than 0.23m, as illustrated by Fig. 3a which plots the average value of for numerous pairs of particles at different sizes of contact gaps. 0.23m marks the maximum resolution of the contact gap using AF rings. A higher resolution of the contact gap is achieved by monitoring the emergence of a dip in using .
Fig. 3b shows the distribution of dips in QD fluorescence signal exclusion, , for different contact gaps. For particles with contact gaps smaller than 230nm (see blue circles), Fig. 3b shows two populations of contacts well separated by a minimum in . We also notice that the minimum in appears for a value of equal to the average standard deviation, , of for flat profiles. This minimum in is observed at . Therefore, dips in having may be considered as random fluctuations since they are indistinguishable from the random fluctuations in the profile itself (i.e., they fall below 1). This observation introduces a natural definition of a false positive contact for contact gaps smaller than 230nm. After plotting for contact gaps ranging from 230nm to 1m (see red squares), we find that peaks at and falls off quickly to zero when . This result suggests that our method of contact detection is able to find false positives that previous methods could not detect.
In summary, our method measures the contact gap as the distance between peaks in , as seen in Fig. 2a. When these peaks merge below 230nm (as seen in Fig. 2b-c) it is not possible to know the exact size of the contact gap for these contacts. It is at this point that we analyze the QD dip profile to differentiate false positives from more probable contacts.
III Results
Next, we employ our contact detection method to determine the contact network of jammed colloidal packings. Theoretical findings posit a common physical explanation for jamming and glass transitions 7; 10; 13; 30; 31; 32; 11; 12. The emerging unifying laws are condensed in a set of key observables characterized by critical scaling exponents. But experimentally testing theoretical models requires high resolution of contacts to differentiate fragile contacts from close (non-contacting) neighbors. These fragile contacts contribute greatly to the marginal stability of jammed colloids which materializes into scaling laws for small forces, soft modes and near-contact pair correlation function 7; 10; 13; 30; 31; 32; 33; 11; 12. The contact detection method outlined here determines the contact network at high resolution and presents a unique opportunity for assessing key physical observables.
We analyze colloidal packings and (Table 1) and for each of them we measure the inter-particle force distribution, the pair correlation function, the vibrational density of states and the equation of state relating coordination number and volume fraction. We have jammed the packings at different centrifugation to study variations in properties with respect to the preparation protocol. The experimentally obtained packing fractions and coordination numbers are close enough, so that we are not able to reach definitive conclusions regarding protocol dependence.
The forces at the contacts can be calculated solely from the contact network as determined by the fluorophore exclusion technique without resorting to a contact force law, by using the fact that the system is close to isostatic. We resolve the contact forces at the contact points using the force network ensemble method proposed earlier 5 and calculate the force distribution as follows:
-
•
(i) The force balance equations are imposed as constraints:
(1) where the notation indicates the set of contact points around particle ;
-
•
(ii) Forces are repulsive, i.e.:
(2) where we denoted by the vector connecting the th particle’s position (of its center of mass) and the th contact on the th particle;
-
•
(iii) A fixed external force sets an overall force scale.
Then, we compute the force distribution at the contact points by using a simulated annealing algorithm. In practice, we use a penalty function given by equation 3 which disfavors force configurations that do not satisfy conditions above.
| (3) |
Finally, we obtain the mean force distribution by averaging over all the contacts.
Theoretically, at the jamming transition, the force distribution is expected to decay algebraically for as seen in equation 4:
| (4) |
where the exponents and describe, respectively, localized and delocalized excitations 11; 12; 13; 10; 32. Mean field theory of hard sphere glasses in infinite dimensions 13 predicts only the value of the exponent , since in infinite dimensions, where the mean field theory has been developed, there are no localized excitations. To adhere as much as possible to the theory, in this work we measure only the exponent by excluding localized excitations as done elsewhere 34. This is done by removing the so-called bucklers.
The profiles of the obtained force distributions are shown in Fig. 4a. We obtain values of ranging from 0.11-0.17 for the three packings (Table 1). We note that, in general, the presence of shear jamming can affect the scaling law of force distribution. In our case, each experimental packing was prepared by gravitational centrifugation. This preparation protocol may generate not only bulk jamming but also shear jamming, and these modes are responsible for jamming of the packing.
| Packing | 11 | |||||
|---|---|---|---|---|---|---|
| 0.110(5) | 0.42(2) | 0.474(1) | ||||
| 0.143(4) | 0.62(2) | 0.467(1) | ||||
| 0.170(6) | 0.75(3) | 0.461(1) |
The exponent (as well as ) is tightly related to another critical exponent, which controls the behavior of the pair correlation function for , where is the diameter of the particles. Specifically, the scaling law 35 in equation 5 holds true for .
| (5) |
Indeed, the exponents and satisfy the inequality
| (6) |
which is a consequence of the marginal stability of the jammed packing 11. The values of the exponent for the three packings are reported in Table 1, and the profiles of the are shown in Fig. 4b. With our values of and we find that packings and satisfy the theoretical bound, while packing does not. The reason is that turns out to be hyperstatic and, therefore, it is not supposed to satisfy the bound (we elaborate on this point below). The theoretically predicted mean-field value of the exponent 13 is , which is outside the numerical errors of our measured values for packings B and C, and agrees with packing A. We notice that the exponents we found for the force distribution at weak forces, and the pair correlation function at small gaps do not match the theoretical predictions from the replica theory of hard sphere glasses. Possible reasons of this discrepancy could be the natural particle size polydispersity and asphericity in the constitutive particle shapes of the experimental system. Each packing has roughly 10% polydispersity and roughly 10% of all the particles in each packing have asphericity. Current technology (Bang Lab) does not produce perfectly monodisperse silica particles which are simultaneously amenable to the grafting techniques required for the present contact detection process. A numerical study on how the small polydispersivity in our sample may affect the value of the exponents would complement the present measurements and test whether these universal exponents might affected by disorder.
However, marginality can still be suggested beyond the actual value of the exponents, as long as the exponents satisfy the inequality , which is a consequence of the marginal stability of the jammed packing. Thus, this inequality suggests marginality in packings and (in a weak sense), which is indeed less stringent than perfectly matching with predictions of replica theory, for which the inequality would be saturated.
We notice that certain expected features of for monodisperse packings are not seen in our results. For instance, there is no clear split-second peak, and the right-hand side of the split second peak is not at 1D. We think that these features are not present due to the polydispersivity and asphericity of the constitutive particles in the packing. We also notice that the scaling exponent of the week force and the relationship between and have been theoretically predicted for dry jammed packings, not for colloidal systems in the presence of hydrodynamic forces. However, we believe that the presence of the strong centrifugation forces produces a jammed static packing that may be comparable to theories for dry packings.
The knowledge of the contact network allows us to compute the vibrational density of states of the packing 11; 12; 5; 36. This quantity is obtained by computing the spectrum of the dynamical matrix (and does not need the existence of a force-law), which is defined as:
| (7) |
where the ’s are unit vectors directed from particle to particle . The vibrational modes are the square root of the eigenvalues of the matrix , i.e. , and is the probability density function of those ’s.
Thus, we obtain the vibrational density of states of the packing and the concomitant soft modes 11; 12; 5; 36 from the dynamical matrix . In Fig. 4c we show the function for the three packings. We find that the density of states for packing and shows an excess of low frequency modes (a flat profile as ) as compared to a crystalline solid, also known as the “boson peak” in the glass literature 10 which is typical of marginally stable jammed packings. The situation is again different for packing , which is discussed below. We also obtain the equation of state in the packing fraction-coordination number plane , shown in Fig. 4d, along with theoretical predictions for this quantity8.
(a)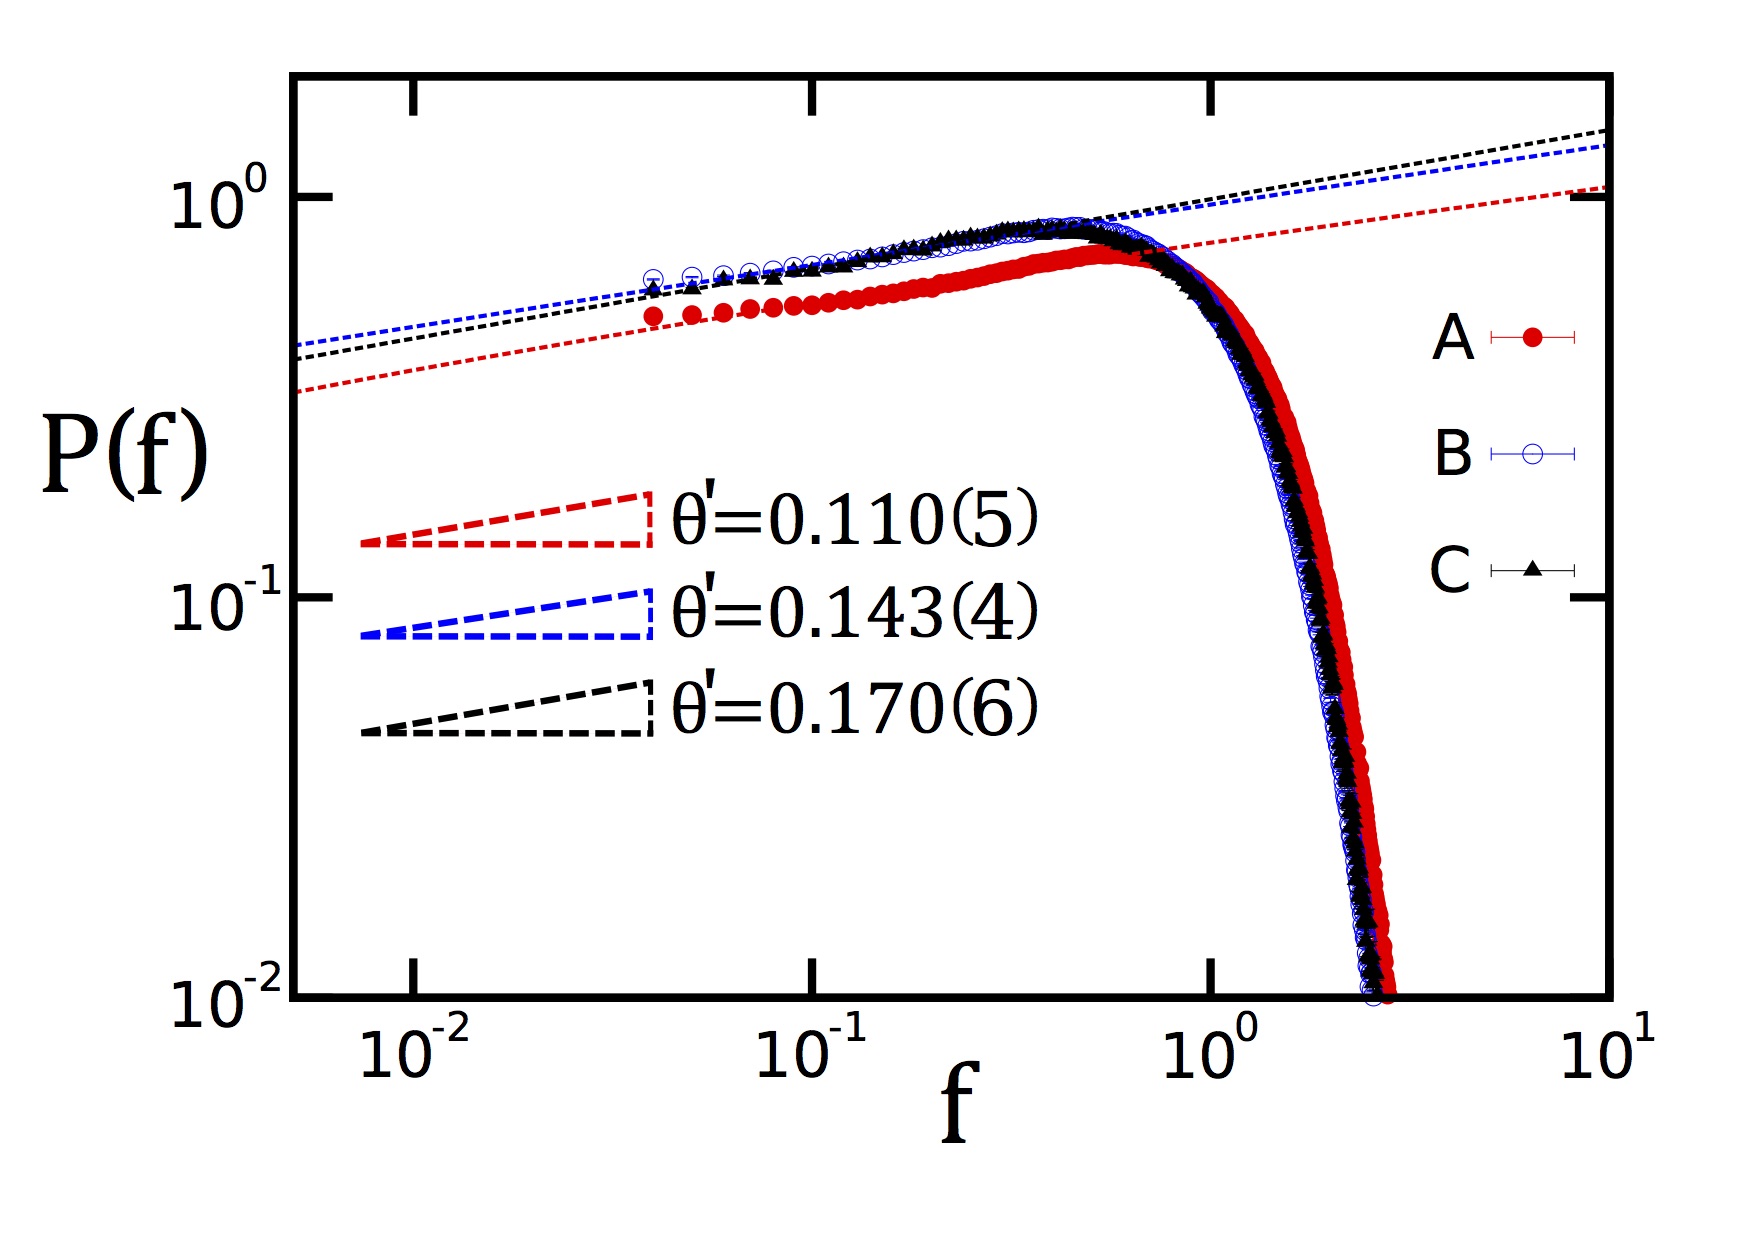 (b)
(b)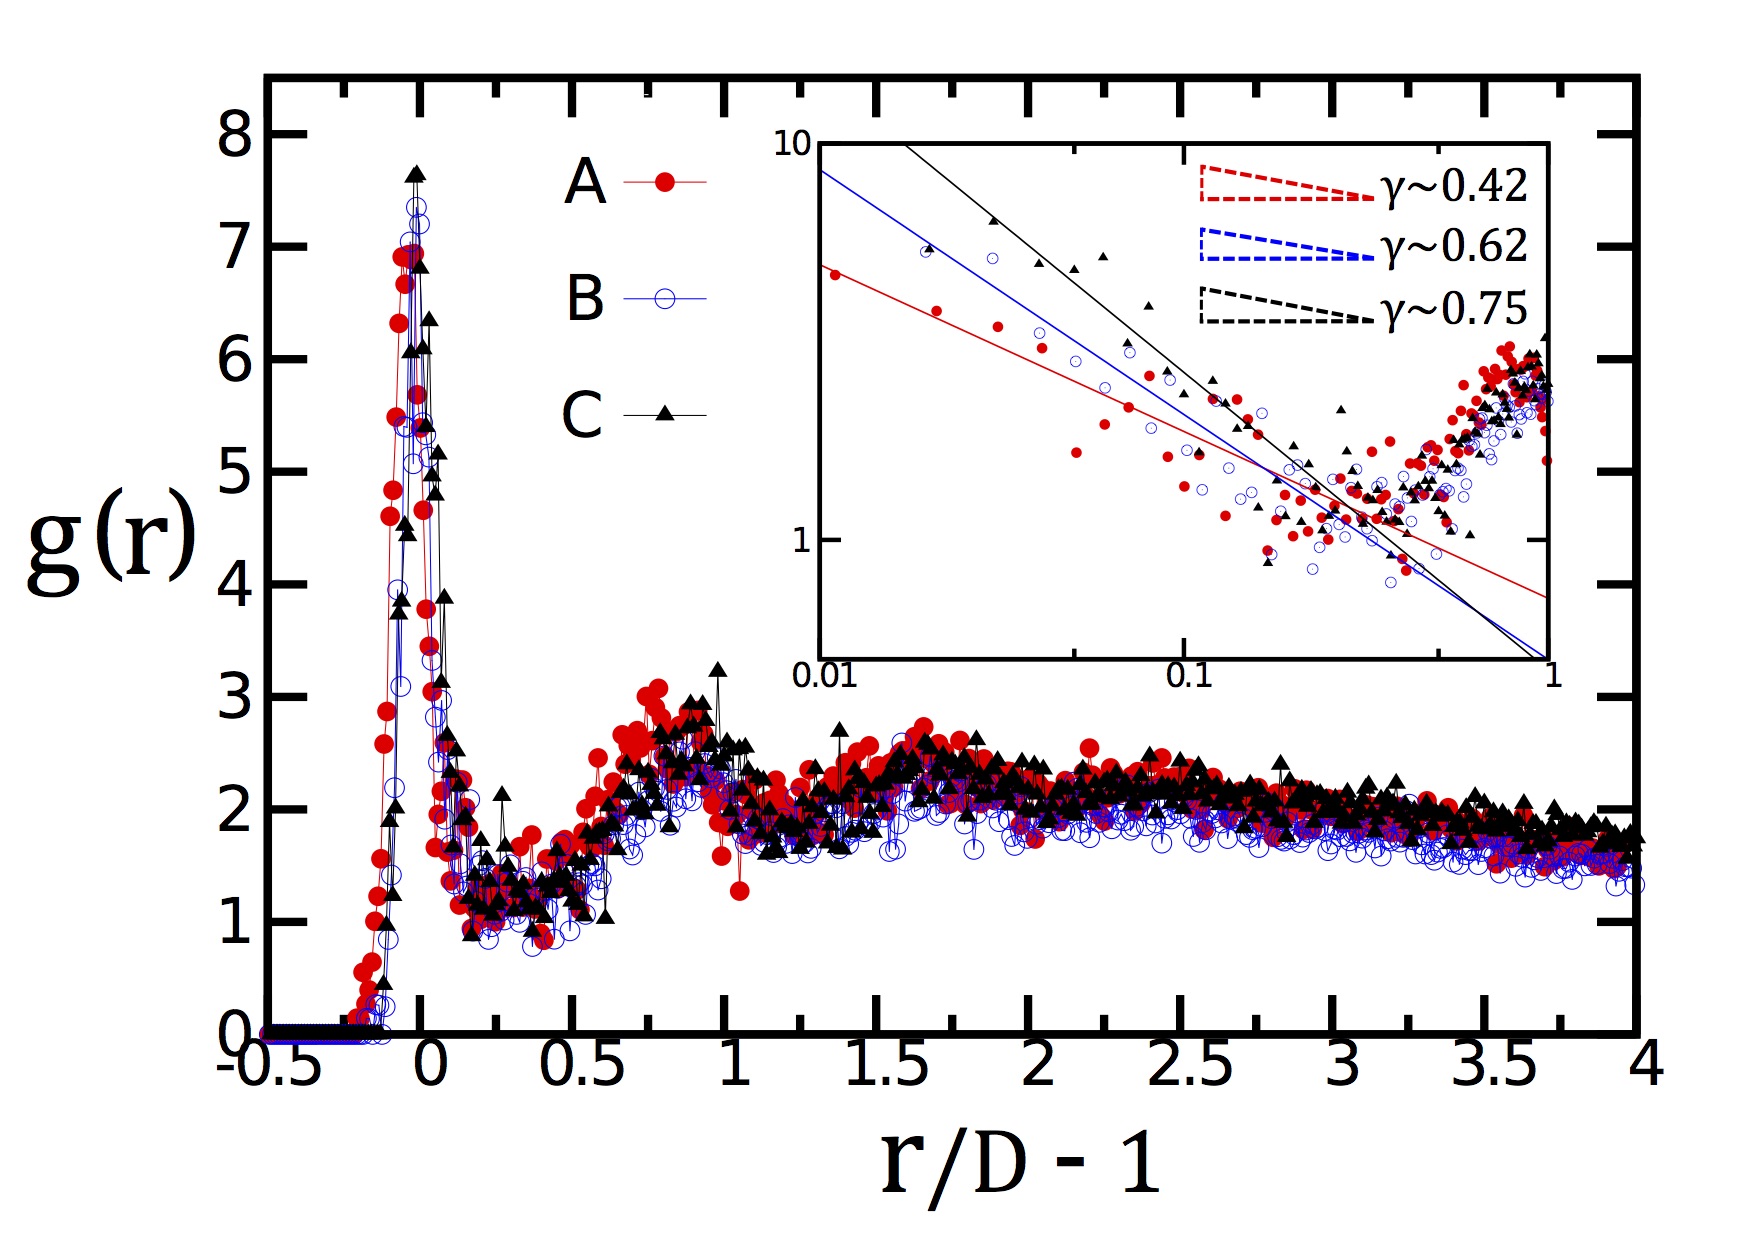
(c)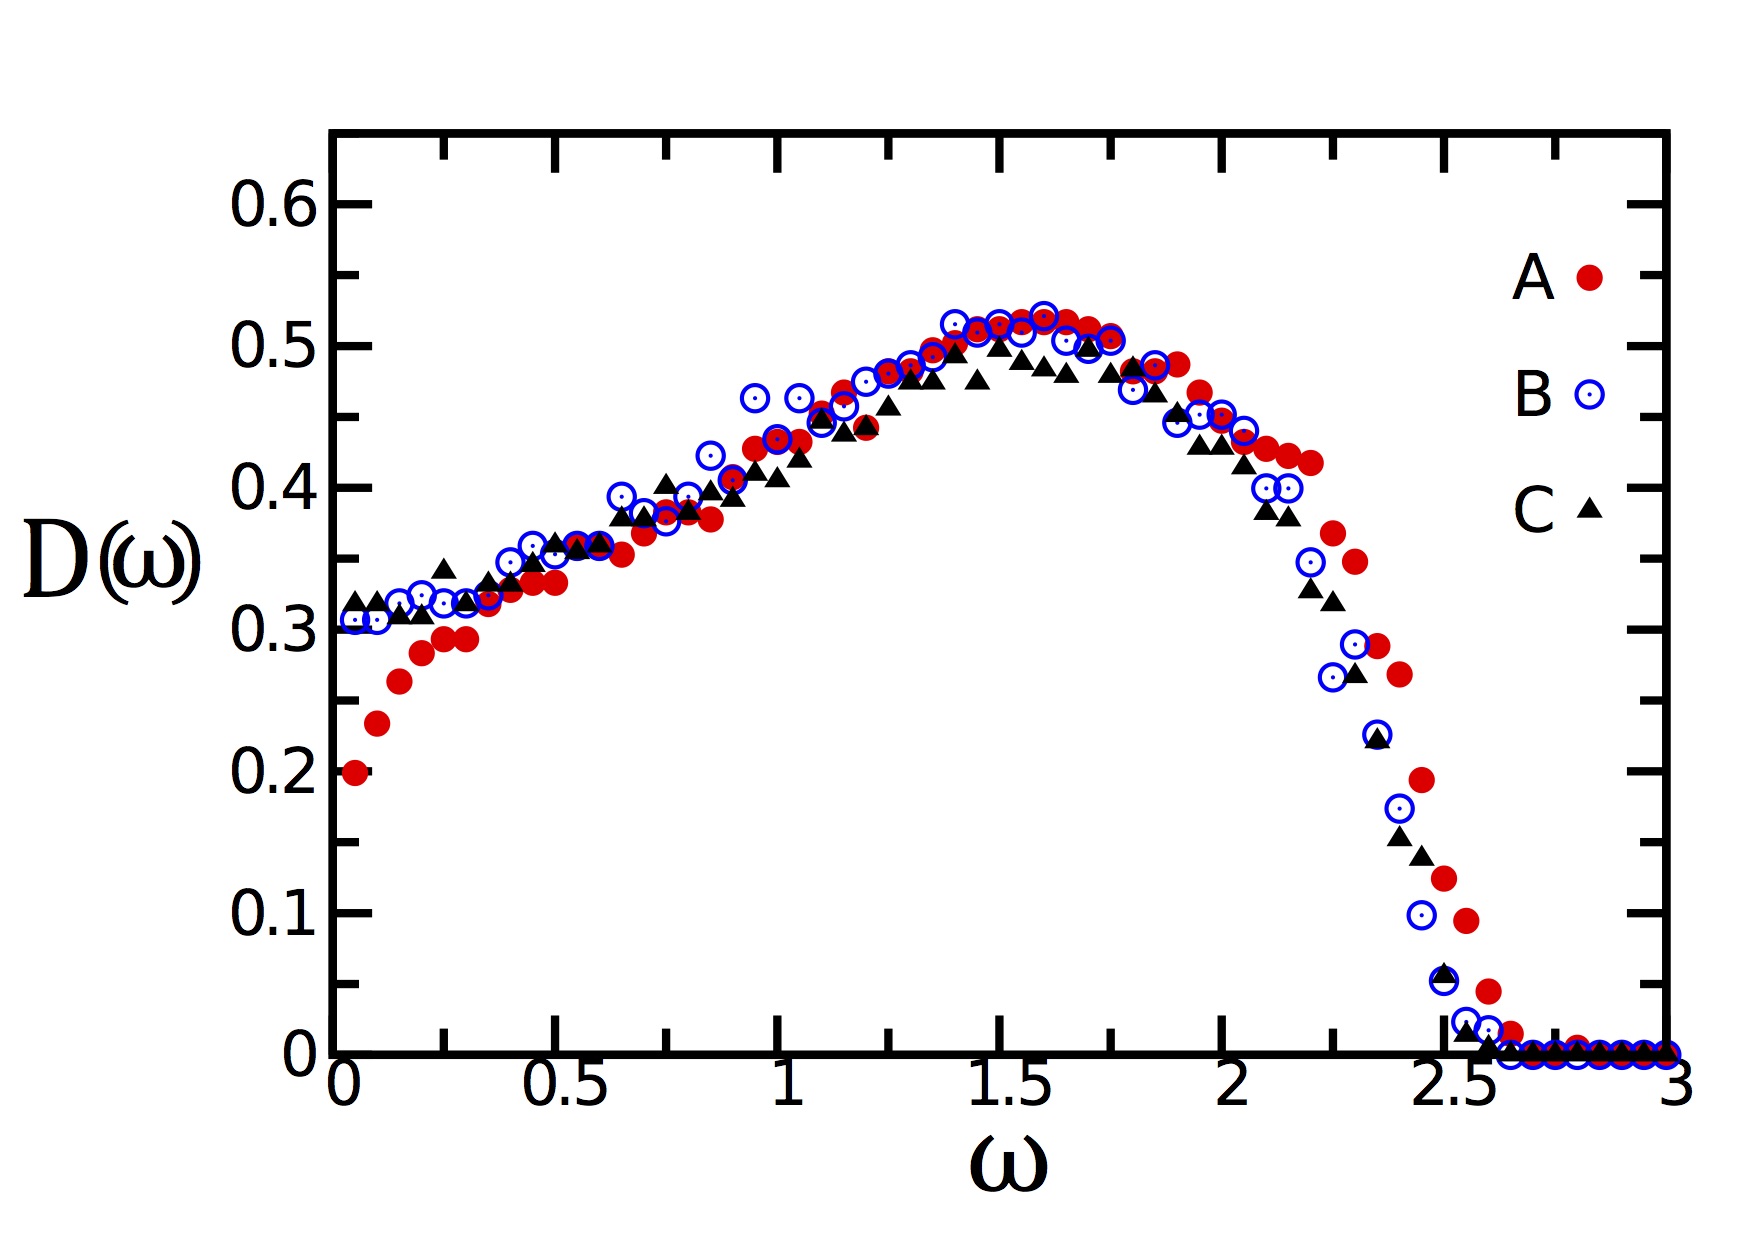 (d)
(d)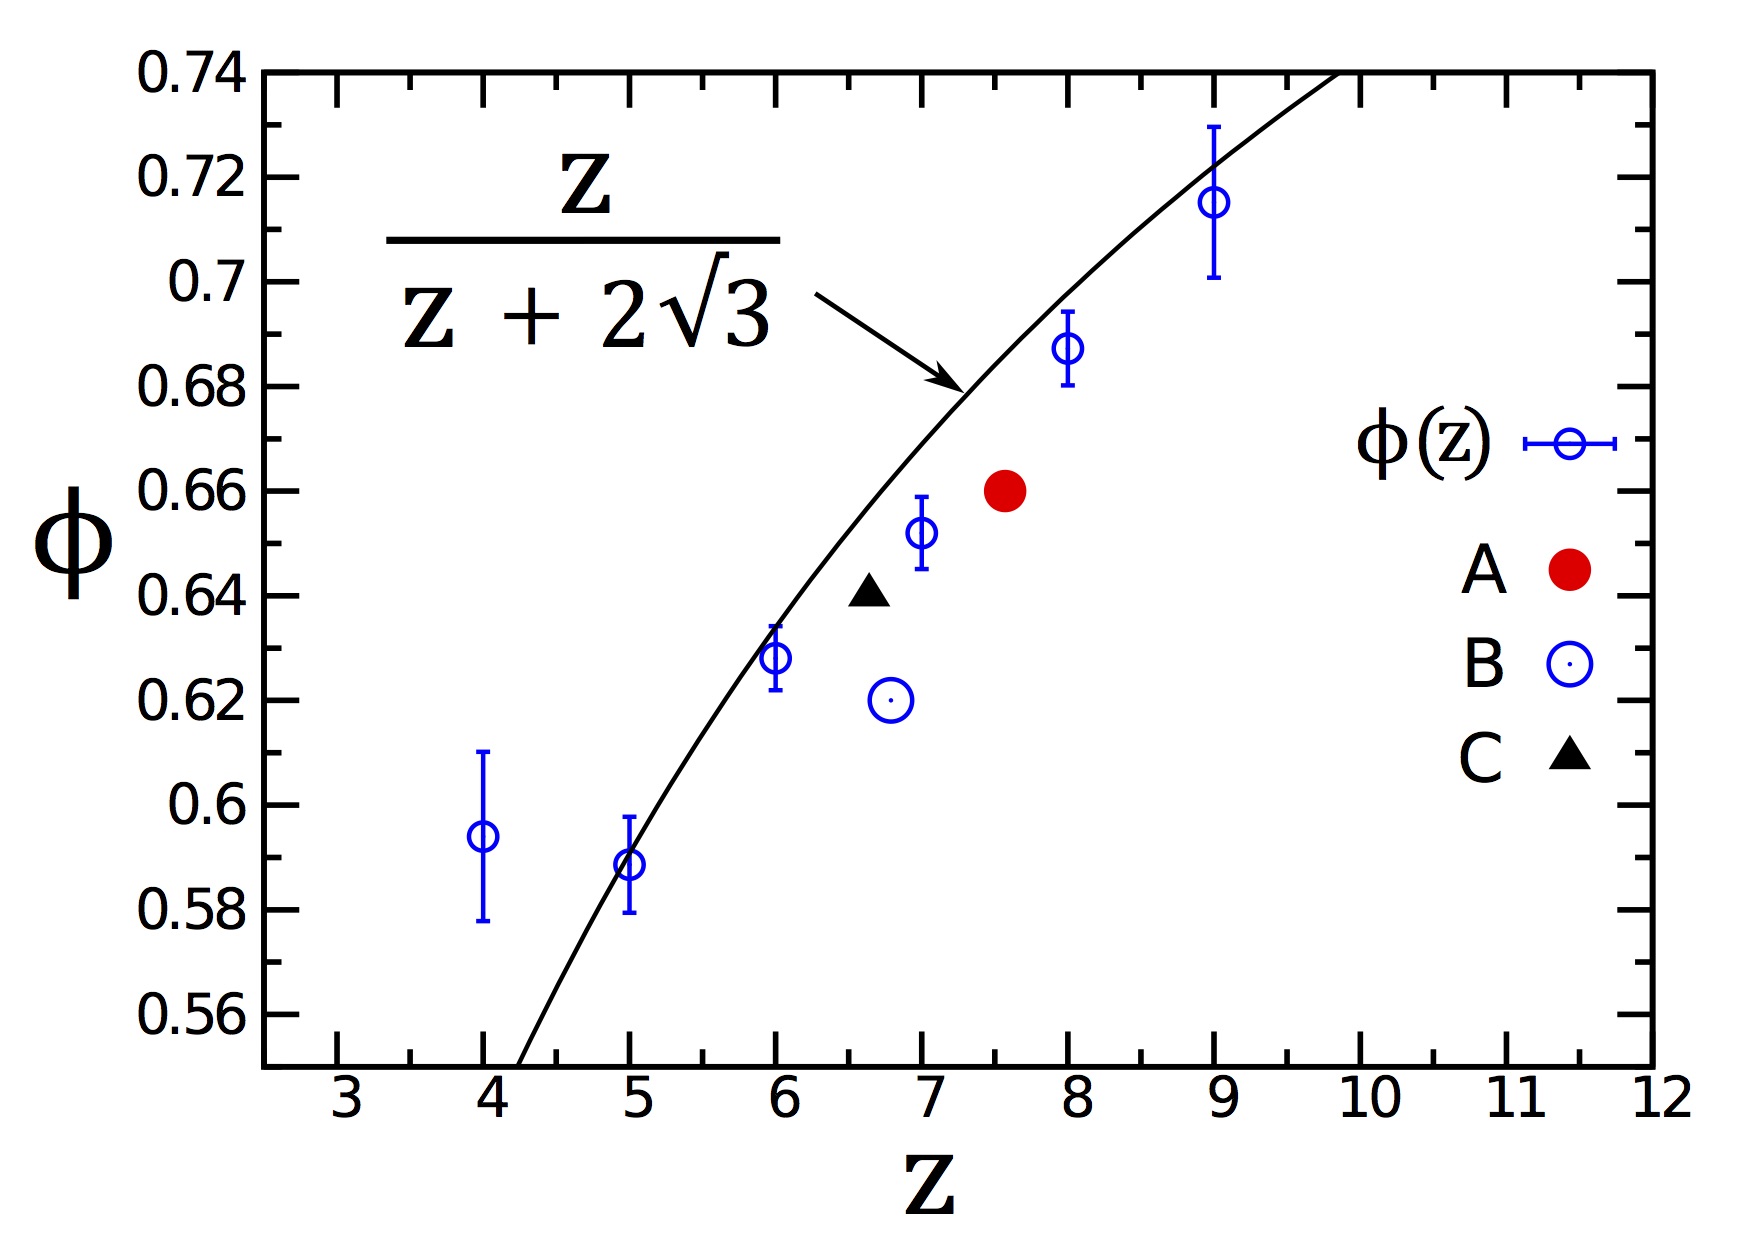
IV Discussion and conclusions
Our results can be interpreted as follows. Ideally, for an isostatic packing of hard spheres 3; 9; 10 in D, the average coordination number is . However, our colloidal particles are not perfectly spherical. There is a small fraction of nonspherical particles some of which are visible in Fig. 1b, c. Because asphericity increases , we expect the average coordination to be larger than six in our jammed colloids. In packings and we find similar values for : and (see Table 1), and an excess of low-frequency modes in Fig. 4. Therefore, and could reasonably be viewed as being close to marginally stable. On the contrary, for we find , which is significantly larger than and . Moreover, the profile in its vibrational density of states shows a drop at low frequencies (see Fig. 4c), which indicates a possible Debye’s deviation. Therefore, packing can be considered as being far from marginally stable. This might be caused by excessive compression of particles that are not perfectly hard due to PEG that is grafted on the surface of the silica particles. In fact, in our experiment, the system is subjected to a uniaxial compression via centrifugation. This may slightly deform the grafted PEG, thereby closing gaps between particles and increasing the number of contacts (in comparison to perfectly hard spheres).
In turn, closing more contacts decreases the amplitude of possible displacements in particles, which in other words, increases the frequency of their vibrations. This causes a depletion of the low-frequency modes with consequent population of the high frequency modes. The effect is visible in Fig. 4c for packing A. Also, the force distribution (see Fig. 4a) shows an excess of large forces and a deficit of small forces compared to and . Again, this may be caused by compression and a surplus of contacts in the packing, since, by closing more contacts, weak forces become more rare, while larger forces become more probable. Finally, the pair correlation function (see Fig. 4b) is slightly shifted towards the left as compared to and , meaning that smaller gaps are found with lower probability in packing . In light of all these findings, we believe that packing is hyperstatic. Incidentally, is the only packing violating the bound , which, in fact, is only valid for isostatic packings.
Overall, our experiments suggest that QD fluorophore signal exclusion proves effective at locating inter-particle contacts in a packing of colloidal particles. This contact detection method highlights the importance of high resolution of inter-particles contacts for testing theoretical predictions close to the marginally stable state because these contacts may be used in rigorous computations of force distribution, yield stress and stability of packings. The fact that fluorescence (not size) of QD is what is being measured implies that any fluorophore probe could be used to resolve the inter-particle space. In particular, smaller probes could be utilized to enhance resolution beyond that considered here. Moreover, the present method could open up a promising experimental field for future studies on packing of non-spherical particles 1; 2; 37; 38; 39.
References
- (1) Jaeger, H. M. Toward jamming by design. Soft Matter 11, 12-27 (2015).
- (2) Glotzer, S. C. and Solomon, M. J. Anisotropy of building blocks and their assembly into complex structures. Nature, 6, 557-562 (2007).
- (3) Baule, A., Morone, F., Herrmann, H. J. and Makse, H. A. Edwards statistical mechanics for jammed granular matter. Rev. Mod. Phys. (submitted) arXiv:1602.04369.
- (4) Edwards, S. F. in Granular Matter: An Interdisciplinary Approach, (ed. Mehta, A.) 121-140 (Springer-Verlag, 1994).
- (5) Snoeijer, J. H., Vlugt, T. J. H., van Hecke, M. and van Saarloos, W. Force network ensemble: a new approach to static granular matter. Phys. Rev. Lett., 92, 054302 (2004).
- (6) Henkes, S. and Chakraborty, B. Jamming as a critical phenomenon: a field theory of zero-Temperature grain packings. Phys. Rev. Lett., 95, 198002 (2005).
- (7) Krzakala, F. and Kurchan, J. Landscape analysis of constraint satisfaction problems. Phys. Rev. E, 76, 021122 (2007).
- (8) Song, C., Wang, P. and Makse, H. A. A phase diagram for jammed matter. Nature, 453, 629 (2008).
- (9) Torquato, S. and Stillinger, F. H. Jammed hard-particle packings: From Kepler to Bernal and beyond. Rev. Mod. Phys., 82, 2633 (2010).
- (10) Parisi, G. and Zamponi, F. Mean field theory of hard sphere glasses and jamming. Rev. Mod. Phys., 82, 789 (2010).
- (11) Wyart, M. Marginal stability constrains pair and force distributions at random close packing. Phys. Rev. Lett., 109, 125502 (2012).
- (12) Lerner, E., Düring, G. and Wyart, M. Low-energy non-linear excitations in sphere packings. Soft Matter, 9, 8252-8263 (2013).
- (13) Charbonneau, P., Kurchan, J., Parisi, G., Urbani, P. and Zamponi, F. Fractal free energy landscapes in structural glasses. Nature Comm., 5, 3725 (2014).
- (14) Aste, T., Saadatfar, M. and Senden, T. J. Geometrical structure of disordered sphere packings. Phys. Rev. E, 71, 061302 (2005).
- (15) Schaller, F. M., Neudecker, M., Saadatfar, M., Delaney, G., Mecke, K., Schröeder-Turk, G. E. and Schröter, M. Tomographic analysis of jammed ellipsoid packings. AIP Conf. Proc., 1542, 377 (2013).
- (16) Weeks, E. R., Crocker, J. C., Levitt, A.C. and Schofield, A. Three-dimensional direct imaging of structural relaxation near the colloidal glass transition. Science, 28, 627 (2000).
- (17) Brujić, J., Edwards, S. F., Grinev, D. V., Hopkinson, I., Brujić, D. and Makse, H. A. 3D bulk measurements of the force distribution in a compressed emulsion system. Faraday Discuss., 123, 207 (2003).
- (18) Jorjadze, I., Pontani, L-L., Newhall, A., and Brujić, J. Attractive emulsion droplets probe the phase diagram of jammed granular matter. Proc. Nat. Acad. Sci. U.S.A., 108, 4286 (2011).
- (19) Zhou, J., Long, S., Wang, Q. and Dinsmore, A. D. Measurement of forces inside a three-dimensional pile of frictionless droplets. Science, 312, 1631 (2006).
- (20) Brujić, J., Song, C., Wang, P., Briscoe, C., Marty, G. and Makse, H. A. Measuring the Coordination Number and Entropy of a 3D jammed emulsion packing by confocal microscopy. Phys. Rev.Lett., 98, 248001 (2007).
- (21) Clusel, M., Corwin, E. I., Siemens, A. O. N. and Brujić, J. A ‘granocentric’ model for random packing of jammed emulsions. Nature, 460, 611 (2009).
- (22) Kyeyune-Nyombi, E. Experimental Studies of Jamming in Colloidal Systems using Fluorescence Microscopy, Ph. D. thesis (City College of New York, 2016).
- (23) Hermanson, G. T. Bioconjugation Techniques, 2nd ed. (Elsevier Inc., 2008).
- (24) Israelachvilli, J. N. Intermolecular and Surface Forces, 3rd ed. (Elsevier Inc., 2011).
- (25) Drobek, T. and Spencer, N. Nanotirbology of surface-grafted PEG layers in an aqueous environment. Langmuir, 24, (2008).
- (26) Giepmans, B. N., Deerinck, T. J., Smarr, B. L., Jones, Y. Z. and Ellisman, M. H. Correlated light and electron microscopic imaging of multiple endogenous proteins using quantum dots. Nature, 2, 743 (2005).
- (27) Asakura, S. and Oosawa, F. On interaction between two Bodies immersed in a solution of macromolecules. J. of Chem. Phys., 22, 1255 (1954).
- (28) Hell, S. W. and Wichman, J. Breaking the diffraction resolution limit by stimulated emission: stimulated-emission-depletion fluorescence microscopy. Opt. Lett., 19, 780 (1994).
- (29) Betzig, E., Patterson, G. H., Sougrat, R., Lindwasser, O. W., Olenych, S., Bonifacino, J. S., Davidson, M. W., Lippincott-Schwartz, J. and Hess, H. F. Imaging intracellular fluorescent proteins at nanometer resolution. Science, 313, 1642 (2006).
- (30) Mari, R., Krzakala, F. and Kurchan, J. Jamming versus glass transitions. Phys. Rev. Lett., 103, 025701 (2009).
- (31) DeGiuli, E., Lerner, E. and Wyart, M. Force distribution affects vibrational properties in hard-sphere glasses. Proc. Nat. Acad. Sci. U.S.A., 111, 17054 (2014).
- (32) Bo, L., Mari, R., Song, C. and Makse, H. A. Cavity method for force transmission in jammed disordered packings of hard particles. Soft Matter, 10, 7379-7392 (2014).
- (33) Lin, J., Jorjadze, I., Pontani, L-L., Wyart, M., and Brujić, J. Evidence for marginal stability in emulsions. Phys. Rev. Lett., 117, 208001 (2016).
- (34) Charbonneau, P., Corwin, E. I., Parisi, G. and Zamponi, F. Jamming criticality revealed by removing localized buckling excitations. Phys. Rev. Lett., 114, 125504 (2015).
- (35) Donev, A., Torquato, S. and Stilinger, F. H. Pair correlation function characteristics of nearly jammed disordered and ordered hard-sphere packings. Phys. Rev. E, 71, 011105 (2005).
- (36) Silbert, L. E., Liu, A. J. and Nagel, S. R. Vibrations and diverging length scales near the unjamming Transition. Phys. Rev. Lett., 95, 098301 (2005).
- (37) Makse, H. A., Brujić, J. and Edwards, S. F. Statistical Mechanics of Jammed Matter, in The Physics of Granular Media (edited by Hinrichsen H. and Wolf, D. E.) (Wiley-VCH, Weinheim, 2004).
- (38) Baule, A., Mari, R., Bo, L., Portal, and Makse, H. A. Mean-field theory for random close packings of axisymmetric particles. Nature Comm. 4, 2194 (2013).
- (39) Baule, A. and Makse, H. A. Fundamental challenges in packing problems: from spherical to non-spherical particles. Soft Matter 10, 4423-4429 (2014).
Acknowledgements
We acknowledge the support from NSF CMMT (Grant No. DMR-1308235) and DOE Geosciences Division (Grant No. DE-FG02-03ER15458). We thank M. Shattuck and W. Rossow for assistance in developing the particle tracking algorithm, and S. Mukhopadhyay and C. Maldarelli for help with the experiments.
Author contributions
E. K-N. and H. A. M. wrote the manuscript. E. K-N. and M. L. G. prepared figures 1a-c. E. K-N., W. L., and S. L. prepared figures 2a-c and figure 3. F. M. prepared figures 4a and 4c. E. K-N. prepared figure 4b. E. K-N. and F. M. prepared figure 4d. E. K-N. prepared the video file accompanying the manuscript.
All authors reviewed the manuscript.
Additional Information
Competing financial interests: The authors declare no competing financial interests.