Seeds of Life in Space (SOLIS) III. Formamide in protostellar shocks: evidence for gas-phase formation
Abstract
Context. Modern versions of the Miller-Urey experiment claim that formamide (NH2CHO) could be the starting point for the formation of metabolic and genetic macromolecules. Intriguingly, formamide is indeed observed in regions forming Solar-type stars as well as in external galaxies.
Aims. How NH2CHO is formed has been a puzzle for decades: our goal is to contribute to the hotly debated question of whether formamide is mostly formed via gas-phase or grain surface chemistry.
Methods. We used the NOEMA interferometer to image NH2CHO towards the L1157-B1 blue-shifted shock, a well known interstellar laboratory, to study how the components of dust mantles and cores released into the gas phase triggers the formation of formamide.
Results. We report the first spatially resolved image (size 9, 2300 AU) of formamide emission in a shocked region around a Sun-like protostar: the line profiles are blueshifted and have a FWHM 5 km s-1. A column density of = 8 1012 cm-1, and an abundance (with respect to H-nuclei) of 4 10-9 are derived. We show a spatial segregation of formamide with respect to other organic species. Our observations, coupled with a chemical modelling analysis, indicate that the formamide observed in L1157-B1 is formed by gas-phase chemical process, and not on grain surfaces as previously suggested.
Conclusions. The SOLIS interferometric observations of formamide provide direct evidence that this potentially crucial brick of life is efficiently formed in the gas-phase around Sun-like protostars.
Key Words.:
Stars: formation – ISM: jets and outflows – ISM: molecules – ISM: individual objects: L1157-B11 Introduction
One of the main open questions in astrochemistry regards the mechanisms leading to the formation of the so-called interstellar complex organic molecules (iCOMs: molecules with at least 6 atoms), which can be considered as the building blocks of more complex pre-biotic compounds (see e.g. Caselli & Ceccarelli 2012). This topic is even more important in regions around Sun-like protostars which will produce future Solar-like systems. In particular, modern versions of the Urey-Miller experiment suggest that formamide (NH2CHO) might be the starting point of metabolic and genetic species (Saladino et al. 2012). Intriguingly, formamide is detected in both Galactic high- and low-mass star forming regions (e.g. Turner 1991; Nummelin et al. 1998; Halfen et al. 2011; Kahane et al. 2013; Mendoza et al. 2014; López-Sepuclre et al. 2015) as well as in external galaxies (Müller et al. 2013). Despite being so easily found, it is still hotly debated how this species and other iCOMs are formed (e.g. Herbst & van Dishoeck 2009).
The two current theories predict formation by reactions in the gas phase (e.g. Vasyunin & Herbst 2013; Balucani et al. 2015; Vasyunin et al. 2017) or on interstellar dust grains (e.g. Garrod & Herbst 2008; Garrod et al. 2008), the latter through surface reactions or induced by energetic processing. Focusing on formamide, the gas-phase theory proposes that it is synthesised by the reaction of formaldehyde (H2CO) and amidogen (NH2), as suggested by Barone et al. (2015) and Vazart et al. (2016). Various mechanisms have been advanced for the formation of formamide on the grain surfaces including the combination of amidogen and formyl radical (HCO; Garrod et al. 2008; Jones et al. 2011), the hydrogenation of isocyanic acid (HNCO; Mendoza et al. 2014), the latter being most likely an inefficient reaction (Noble et al. 2015; Song et al. 2016), and particle/UV photon irradiation of ice mixtures (e.g. Kaňuchová et al. 2016; Fedoseev et al. 2016).
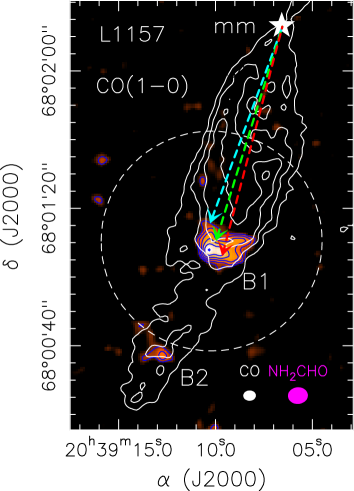
From the observational point of view, it is challenging to safely assess which formation mechanism is dominating for formamide. The chemically rich molecular outflow driven by the L1157-mm Class 0 protostar ( = 250 pc) is a unique region which can be used to tackle this question. A precessing, episodic jet of matter at supersonic velocity emerges from L1157-mm (Gueth et al. 1996; Podio et al. 2016). The jet has excavated two main cavities, with apices called B1 and B2 (see Fig. 1). In particular, B1 consists of a series of shocks (see Sect. 3) caused by different episodes of ejection impacting against the cavity wall (Podio et al. 2016), the oldest of which (kinematical age 1100 yr) is also the farthest away from the source.
Previous observations revealed that in B1 the jet impacts caused erosion of the grain cores and ices, producing large quantities of gaseous SiO ( 10-7; Gueth et al. 1998), H2O ( 10-4; Busquet et al. 2014), and HCOOCH3 ( 10-8; Arce et al. 2008) among other species (see also Lefloch et al. 2017). Hence, L1157-B1 provides us with a perfect place to study the reactions occurring when previously frozen species are injected into the gas, as their relative abundance evolution depends on the relative efficiency of the various reactions. Previous studies have shown that any variation on the 1000 AU scale, as the one probed by our work, is due to the passage of shocks, rather than to differences in the composition of pre-existing, pre-shocked dust and gas (Benedettini et al. 2012; Busquet et al. 2014). To conclude, within the context of the study of iCOMs, the advantages of the L1157-B1 laboratory are twofold: (i) the source is not directly heated by the protostar, which is 0.08 pc away, and (ii) solid species in dusty icy mantles have been injected into the gas phase due to a jet-induced shock and consequently sputtering (e.g. Bachiller et al. 2001).
L1157-B1 is one of the targets of the SOLIS111http://solis.osug.fr/ (Seeds Of Life In Space; Ceccarelli et al. submitted, hereafter Paper I) IRAM NOEMA (NOrthern Extended Millimeter Array) large program to investigate iCOM formation during the early stages of the star forming process. In this Letter we report the first high spatial resolution NH2CHO image and comparison with the acetaldehyde (CH3CHO), which allow us to constrain how gas phase chemistry matters for the formation of NH2CHO.
2 Observations
The L1157-B1 shock was observed at 3 mm with the IRAM NOEMA seven-element array during several tracks in July, October, and November 2015 using both the C and D configurations. The shortest and longest baselines are 19 m and 237 m, respectively, allowing us to recover emission at scales up to 17. The NH2CHO (41,4–31,3) line ( = 13 K, = 49 D2, = 3.7 10-5 s-1) at 81693.45 MHz222Spectroscopic parameters have been extracted from the Cologne Database for Molecular Spectroscopy (Müller et al. 2005). was observed using 80 MHz backends with a spectral resolution of 156 kHz ( 0.57 km s-1). We recover about 60%–70% of the emission observed by Mendoza et al. (2014) using the IRAM-30m (see Appendix A, Fig. A.1 for the 30-m and NOEMA spectra). Calibration was carried out following standard procedures, using GILDAS-CLIC333http://www.iram.fr/IRAMFR/GILDAS. The bandpass was calibrated on 3C454.3, while the absolute flux was fixed by observing MWC349 and 0524+034, the latter being used also to set the gains in phase and amplitude. The phase rms was 50, the typical precipitable water vapor (PWV) was from 10 mm to 40 mm, and the system temperatures 80–100 K (D) and 150–250 K (C). The final uncertainty on the absolute flux scale is 15%. The rms noise in the 156-kHz channels was 2 mJy beam-1. Images were produced using natural weighting, and restored with a clean beam of 579 481 (PA = –94).
3 Results and discussion
3.1 NH2CHO spectra and maps
Formamide emission has been detected towards L1157–B1 with a S/N 8, confirming the NH2CHO identification done by Mendoza et al. (2014) in the context of the ASAI IRAM 30-m spectral survey. Figure 1 shows the map of the NH2CHO (41,4–31,3) integrated emission on top of the CO (1–0) image (Gueth et al. 1996), which well outlines the B1 and B2 cavities opened by the precessing jet driven by the L1157-mm protostar, located (in Fig. 1) at = –25 and = +635. Formamide is emitted from an extended region with a beam deconvolved size of 9 ( 2300 AU) which is clearly associated with the apex of the B1 cavity. In addition, weaker (S/N 4) emission appears in correspondence with the older B2 peak, which, however, being more than 30 from B1 is affected by primary-beam attenuation. For that reason, the further analysis will be focused on the B1 region. The line at the peak emission (see Fig. A.1) has a linewidth with a Full Width Half Maximum (FWHM) of 4.60.6 km s-1 and peaks close to 0 km s-1, thus being blueshifted ( = +2.6 km s-1; e.g. Bachiller et al. 2001). Using the emitting size and assuming optically thin conditions and an excitation temperature of 10 K (as derived by several formamide lines observed with the IRAM 30-m antenna; Mendoza et al. 2014), the average formamide column density is = 8 1012 cm-1. This corresponds to an estimated average abundance (with respect to H-nuclei) of about 4 10-9, assuming a H column density of 2 1021 cm-2 derived for the cavity by Lefloch et al. (2012).
3.2 Formamide and acetaldehyde spatial anticorrelation
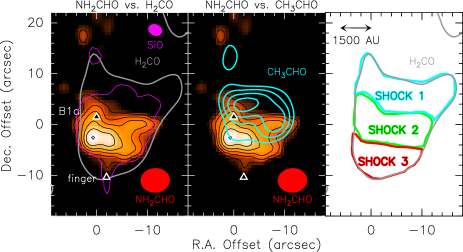
In Figure 2, we report a zoom-in of the B1 structure, as traced by the line emission from formaldehyde and SiO (Gueth et al. 1998; Benedettini et al. 2013). The figure clearly shows the first important result of these observations: the formamide emission does not coincide with that from H2CO and SiO, but only covers the southern portion of the B1 structure. Also, Fig. 2 reports the emission from another iCOM, acetaldehyde (CH3CHO; Codella et al. 2015). Surprisingly, unlike formamide, it is mostly associated with the northern portion of B1. When the difference between these two species is considered, one can identify three zones as follows: SHOCK 1: the northern and youngest one, where only acetaldehyde emits ((CH3CHO)/(NH2CHO) abundance ratio 8; see Fig. 3); SHOCK 2: an intermediate zone, where both formamide and acetaldehyde are present ((CH3CHO)/(NH2CHO) = 2–8); SHOCK 3: the southern and oldest region, where only formamide emits ((CH3CHO)/(NH2CHO) 2).
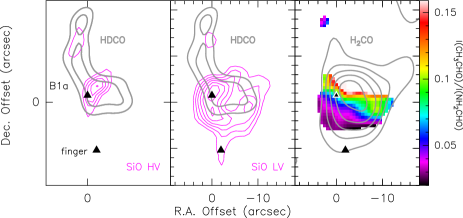
The analysis of the SiO and HDCO distribution (Figure A.2) confirms that B1 is composed by at least two different shocks and is not a single bow-like shock. Specifically: (A) The northern part, SHOCK 1, is associated with the youngest shock (within the B1 structure) at B1a, which is characterised by (i) the emission of HDCO, a selective tracer of dust mantle release (Fontani et al. 2014), and (ii) extremely high-velocity SiO emission, tracing the current sputtering of the dust refractory cores. (B) The southern region, SHOCK 3 is associated with the oldest shock (within B1), because (i) no HDCO is observed, and (ii) SiO emission is only observed at low-velocity and shows a “finger” pointing South (Gueth et al. 1998). This implies that either SiO molecules have been slowed down with time with respect to the high-velocities (needed to produce gaseous Si) or that the shock incident angle has changed, so that the projected velocity is lower. In both cases this indicates that a unique shock structure for L1157-B1 is ruled out. (C) The central region, between SHOCK 1 and SHOCK 3, is characterised by the occurrence of the bulk of the low-velocity SiO molecules, which, once produced at high-velocities, have plausibly slowed down with time. It is then reasonable to assume that this region is associated with a third, intermediate in time, shock event. Note however, that the results and conclusions of the present paper are based on the occurrence of at least two shocks of different age (SHOCKs 1 and 3).
We notice that the difference in the three zones cannot be attributed to excitation effects, as the mapped formamide and acetaldehyde lines have similar upper level energies (11 K and 26 K), similar Einstein coefficients ( 10-5 s-1), and the derived excitation temperatures are also similar (10 K against 15 K, for formamide and acetaldehyde respectively, Mendoza et al. 2014; Codella et al. 2015). Besides, there is no evidence of a monotonic volume density gradient across the B1 region from North to South (Benedettini et al. 2013; Gómez-Ruiz et al. 2015), as in the case of CH3CHO/NH2CHO line intensity ratio (see Fig. A.2). Therefore, the difference between the three zones must be due to a difference in the chemical composition, thus indicating a clear evolutionary effect.
4 Chemical modelling
To understand what the observed chemical differentiation implies, we ran an astrochemical model (a modified version of Nahoon, Loison et al. (2014), see Appendix B) considering three possibilities: (i) formamide and acetaldehyde are grain-surface chemistry products, (ii) formamide and acetaldehyde are gas-phase chemistry products, (iii) one of the two species is a grain-surface and the other one a gas-phase chemistry product. Briefly, we use a time-dependent gas-phase code that follows the chemical evolution of the gas. It starts with the chemical composition of a molecular cloud and then simulates the passage of the shock by suddenly increasing the gas density and temperature (to 105 cm-3 and 60 K, respectively, i.e. typical values measured for the B1 cavities: 20–80 K, Lefloch et al. 2012; 0.5–10 105 cm-3; Gómez-Ruiz et al. 2015), and the gaseous abundance of grain mantle molecules. The abundances of the mantle molecules are assumed to be similar to those measured by IR observations of the dust ices (Boogert et al. 2005) or specifically constrained by previous studies on L1157-B1 (see Table B.1). The chemical network is described in Appendix B. The results of the modelling are discussed for the three cases mentioned above.
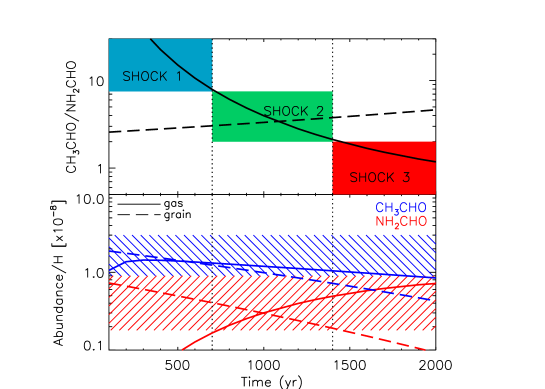
1. Grain-surface formation of CH3CHO and NH2CHO: First, we assume that both formamide and acetaldehyde are synthesised on the grain surfaces and that the passage of the shock injects these two species into the gas phase in quantities such that the measured abundances are roughly reproduced. The predicted abundances as a function of time are shown in Figure 3. They decrease by approximately the same factor in a 2000 yr interval. Actually, the predicted [CH3CHO]/[NH2CHO] abundance ratio slightly increases with time, which is in contrast with the observations that show exactly the opposite trend. Therefore, the pure grain-surface hypothesis cannot explain the observed formamide/acetaldehyde segregation. In other words, our observations rule out the hypothesis that the bulk of the observed acetaldehyde and formamide in L1157-B1 are both directly injected from the grain mantles into the gas phase.
2. Gas-phase formation of CH3CHO and NH2CHO: We then assumed that both acetaldehyde and formamide are formed in the gas phase from species previously on the grain mantles and injected into the gas-phase during the shock passage. Acetaldehyde is assumed to be formed by the reaction of ethyl radical (CH3CH2) with atomic oxygen (Charnley et al. 2004): CH3CH2 + O CH3CHO + H. Formamide is assumed to be formed by the reaction of amidogen with formaldehyde (Barone et al. 2015; Vazart et al. 2016): NH2 + H2CO NH2CHO + H. We run various models with different values of ethyl radical, ammonia (mother of NH2), and formaldehyde, to reproduce the observed abundances. We also run alternative tests injecting ethane (CH3CH3), the fully hydrogenated “cousin” of ethyl radical, and amidogen, a partially hydrogenated “cousin” of ammonia, into the gas. The best agreement with observations is obtained by injecting into the gas phase 4 10-8 of ethyl radical, 2 10-5 of ammonia and 1 10-6 of formaldehyde (see Appendix B for details). This model not only reproduces fairly well the observed abundances (see Fig. 3), it also fits the behaviour of the [CH3CHO]/[NH2CHO] abundance ratio, with acetaldehyde being more abundant in the younger northern SHOCK 1 and formamide being more abundant in the older southern SHOCK 3. Note that the evolution timescale is sensitive to the cosmic ray ionisation rate . We find that the best agreement with the observations is obtained when is 6 10-16 s-1, which is very close to that previously found (Podio et al. 2014), based on the analysis of the molecular ions in L1157-B1. Finally, a larger shocked gas density would result in speeding up the chemical evolution. As a consequence, the CH3CHO/NH2CHO abundance ratio curve would be shifted towards earlier times. For example, if the density were ten times larger, namely cm-3, the curve would be shifted earlier by about 1000 yr. This just means that a substantial difference, by a factor ten, in the gas density at SHOCKs 1 and 3 would not change our major conclusions, but would just imply a slightly smaller cosmic ray ionisation rate.
3. Either acetaldehyde or formamide is a grain-surface and the other a gas-phase chemistry product: We checked the possibility that acetaldehyde is synthesised on the grain surfaces and formamide in the gas and we obtained results similar to the case (2). Hence, the gaseous CH3CHO abundance evolution is rather independent on the formation route (surface chemistry or gas-phase chemistry). We finally checked the possibility that the gas-phase reaction NH2 + H2CO is not efficient (Song & Kästner 2016). In this case, no model can reproduce the observations (both the abundance and the evolution).
In summary, the new SOLIS observations indicate that the formation of observed formamide in L1157-B1 is dominated by gas-phase reactions involving species previously hydrogenated on the grain surfaces, although we cannot exclude a minor contribution from mechanisms such as energetic processing of ices. The formamide abundance needs to peak when the acetaldehyde abundance has already started to decrease. This is only possible if formamide is mostly formed in the gas phase and the reaction between amidogen and formaldehyde (Barone et al. 2015; Vazart et al. 2016) successfully reproduces the observations. Although simple, our model catches the essential aspects of the chemical behaviour of formamide and acetaldehyde, namely their abundance as a function of time once the shock has passed. Indeed, the major uncertainties lie in the used chemical network more than the detailed physical processes or the detailed gas-grain interactions (see Appendix B for more). In this context, it is encouraging that the age difference between SHOCK 1 and SHOCK 3 derived by our simple astrochemical model ( 700 yr) is the same order of magnitude of the one ( 2000 yr) independently derived by dynamical studies of L1157-B1 (Podio et al. 2016). A more detailed modelling including a more complex and realistic treatment of the shock will be necessary to confirm that this is not just a coincidence and to refine the present predictions.
5 Conclusions
The present work demonstrates that the formamide observed in L1157-B1 is dominated by gas-phase chemistry and that the reaction NH2 + H2CO NH2CHO + H explains the observations. Although we are unable to place constraints on the acetaldehyde formation route, we note that quantum chemistry computations have shown that the simple combination of the methyl radical (CH3) and formyl radical (HCO) is an inefficient channel on water ice surfaces (Enrique-Romero et al. 2016), so that it is possible that CH3CHO is also a gas-phase product. The recent detection of iCOMs in cold objects (e.g. Vastel et al. 2014) has already challenged a pure grain-surface chemistry paradigm for their formation (e.g. Vasyunin & Herbst 2013, and references therein). These new observations add evidence that gas-phase chemistry plays an important role in the game of iCOM formation.
Acknowledgements.
We are very grateful to all the IRAM staff, whose dedication allowed us to carry out the SOLIS project. We also thank the anonymous referee for useful suggestions. This work was supported by (i) the French program “Physique et Chimie du Milieu Interstellaire” (PCMI) funded by the Conseil National de la Recherche Scientifique (CNRS) and Centre National d’Etudes Spatiales (CNES), (ii) by the Italian Ministero dell’Istruzione, Università e Ricerca through the grant Progetti Premiali 2012 - iALMA (CUP C52I13000140001), (iii) by the program PRIN-MIUR 2015 STARS in the CAOS - Simulation Tools for Astrochemical Reactivity and Spectroscopy in the Cyberinfrastructure for Astrochemical Organic Species (2015F59J3R, MIUR Ministero dell’Istruzione, dell’Università della Ricerca e della Scuola Normale Superiore), and (iv) by the French Agence Nationale de la Recherche (ANR), under reference ANR-12-JS05-0005. PC, ACT, JEP, and APu acknowledge support from the European Research Council (ERC; project PALs 320620). APo acknowledges the financial support provided by a Canadian Institute for Theoretical Astrophysics (CITA) National Fellowship. I.J.-S. and D.Q. acknowledges the financial support received from the STFC though an Ernest Rutherford Fellowship (proposal number ST/L004801) and Grant (ST/M004139).References
- Arce et al. (2008) Arce, H.G., Santiago-García, J., Jørgensen, J.K., Tafalla, M., & Bachiller, R. 2008, ApJ 681, L21
- (2) Bachiller R., Peréz Gutiérrez M., Kumar M.S.N., & Tafalla M. 2001, A&A 372, 899
- (3) Balucani N., Ceccarelli C., & Taquet V. 2015, MNRAS 449, L16
- (4) Barone V., Latouche C., Skouteri D., et al. 2015, MNRAS 453, L31
- (5) Benedettini M., Busquet G., Lefloch B., et al. 2012, A&A 539, L3
- (6) Benedettini M., Viti S., Codella C., et al. 2013, MNRAS 436, 179
- 201r (54) Boogert A.C.A., Gerakines P.A., & Whittet, D.C.B. 2015, ARA&A 53, 541
- (8) Busquet G., Lefloch B., Benedettini M., et al. 2014, A&A 561, 120
- (9) Caselli P. & Ceccarelli C. 2012, A&ARv 20, 56
- (10) Charnley S.B., Tielens A.G.G.M., & Millar T.J. 1992, ApJ 399, L71
- (11) Codella C., Benedettini M., Beltrán M.T., et al. 2009, A&A 507, L25
- (12) Codella C., Fontani F., Ceccarelli C., et al. 2015, MNRAS 449, L11
- (13) Enrique-Romero J., Rimola A., Ceccarelli C., & Balucani N. 2016, MNRAS 459, L8
- (14) Fedoseev G., Chuang K.-J., van Dishoeck E.F., Ioppolo S., & Linnartz H. 2016, MNRAS 460, 4297
- (15) Fontani F., Codella C., Ceccarelli C., et al. 2014, ApJ 788, L43
- (16) Garrod R.T., & Herbst E. 2006, A&A 457, 927
- (17) Garrod R.T., Widicus Weaver S.L., & Herbst E. 2008, ApJ 682, 283
- (18) Gómez-Ruiz A.I., Codella C., Lefloch B., et al. 2015, MNRAS 446, 3346
- (19) Gueth F., Guilloteau S., & Bachiller R. 1996, A&A 307, 891
- (20) Gueth F., Guilloteau S., & Bachiller R. 1998, A&A 333, 287
- (21) Hamberg M., Zhaunerchyk V., Vigren E. et al. 2010, A&A 522, 90
- (22) Halfen D.T., Ilyushin V., & Ziurys L.M. 2011, ApJ 743, 60
- (23) Harding L.B., Klippenstein S.J., & Georgievskii Y. 2005, Proc. Combust. Inst. 30, 985
- (24) Herbst E., & van Dishoeck E.F. 2009, ARA&A 47, 427
- (25) Jones B.M., Bennett C.J., & Kaiser R.I. 2011, ApJ 734, 78
- (26) Kahane C., Ceccarelli C., Faure A., & Caux E. 2013, ApJ 763, L38
- (27) Kaňuchová Z., Urso R.G., Baratta G.A., et al. 2016, A&A 585, 155
- (28) Lefloch B., Cabrit S., Busquet G., et al. 2012, ApJ 757, L25
- (29) Lefloch B., Ceccarelli C., Codella C., et al. 2017, MNRAS 469, L73
- (30) Loison J.-C., Wakelam V., Hickson K.M., Bergeat A., & Mereau R. 2014, MNRAS 437, L930:w
- (31) López-Sepulcre A., Jaber A.A., Mendoza E., et al. 2015, MNRAS 449, 2438
- (32) Mendoza E., Lefloch B., López-Sepulcre A., et al. 2014, MNRAS 445, 151
- (33) Müller H.S.P., Schöier F.L., Stutzki J., & Winnewisser G. 2005, J.Mol.Struct. 742, 215
- (34) Müller S., Beelen A., Black J.H., et al. 2013, A&A 551, 109
- (35) Noble J.A., Theule P., Congiu E., et al. 2015, A&A 576, 91
- (36) Nummelin A., Bergman P., Hjalmarson A., et al. 1998, ApJS 117, 427
- (37) Podio L., Lefloch B., Ceccarelli C., Codella C., & Bachiller R. 2014, A&A 565, 64
- (38) Podio L., Codella C., Gueth F., et al. 2016, A&A 593, L4
- (39) Saladino R., Botta G., Pino S., Costanzo G., & Di Mauro E., 2012, Chem Soc Rev 41, 5526
- (40) Skouteris D., Vazart F., Ceccarelli C., Balucani N., Puzzarini C., & Barone V. 2017, MNRAS 468, L1
- (41) Song L., & Kästner J. 2016 . J. Phys. Chem. Chem. Phys. 18(42), 29278
- (42) Tafalla, M., & Bachiller, R. 1995, ApJ 443, L37
- (43) Turner B.E. 1991, ApJS 76, 617
- (44) Vastel C., Ceccarelli C., Lefloch B., & Bachiller, R., 2014, MNRAS 795, L2
- (45) Vasyunin A.I., & Herbst E. 2013, ApJ 762, 86
- (46) Vasyunin A.I., Caselli P., Dulieu F., & Jiménez-Serra I. 2017, ApJ 842, 33
- (47) Vazart F., Calderini D., Puzzarini C., Skouteris D., & Barone V. 2016, J. Chem. Theory Comput. 12(11), 5385
- (48) Yang Y., Zhang W.J., Gao X.M., Pei S.X., Shao J., Huang W., Qu J. 2005, Chin. J. Chem. Phys. 18, 515
Appendix A Additional line spectra and maps
Figure A.1 (Upper panel) shows the comparison in flux density scale between the NH2CHO (41,4–31,3) spectrum as observed using the IRAM 30-m antenna (Mendoza et al. 2014) and that extracted from the present NOEMA map from a circular region equal to the IRAM 30-m Half Power Beam Width (HPBW) of 30. The lines are blue-shifted ( = +2.6 km s-1; Bachiller et al. 2001). Between 60% and 70% of the emission observed using the IRAM single-dish is recovered by the NOEMA interferometer, which filters out emission structures larger than 17. Figure A.1 (Bottom panel) also shows the NH2CHO (41,4–31,3) emission line (in brightness temperature scale, TB) observed at the peak of the formamide spatial distribution (Figs. 1, 2).

Figure A.2 shows how different shocks are present within the L1157-B1 structure. The northern part (see the B1a position) is associated with both SiO emitting very high velocities (up to –18 km s-1 with respect to ), as well as with HDCO, a selective tracer of dust mantle release. On the other hand, the sourhern region is characterised by no HDCO, and by low-velocity SiO emission producing the so-called “finger” pointing towards South (Gueth et al. 1998).
Appendix B Sensitivity to the model parameters
In order to understand the origin of the observed spatial segregation between the acetaldehyde and formamide emission, we ran a chemical model with the aim to simulate the passage of the shock. To this end, we used a modified (to make it more flexible) version of Nahoon (Loison et al. 2014), and a chemical network consisting of 511 species and 7792 reactions. The base of the chemical network is KIDA.2014 (http://kida.obs.u-bordeaux1.fr), which has been augmented and corrected with updated reactions (Loison et al. 2014; Balucani et al. 2015; Barone et al. 2015). To simulate the passage of the shock, we followed the strategy used in previous works (Podio et al. 2014; Codella et al. 2015), namely a 2-step modelling. In the first step, we ran a model assuming the conditions of the gas before the passage of the shock, namely a gas cloud of 2 104 H-nuclei cm-3 and a temperature of 10 K. The cosmic-ray ionisation rate was previously constrained to be 3 10-16 s-1 (Podio et al. 2014). The steady state abundances are then used as initial abundances for modelling the second step, with exceptions of the species that are injected into the gas phase because of the shock passage. In this second step, the density is set at 2 105 H-nuclei cm-3 and the temperature at 60 K (Lefloch et al. 2012; Gómez-Ruiz et al. 2015). The shock passage is accompanied by the sputtering of several species from the grain mantles into the gas phase, which corresponds to a sudden increase of their abundance. Again, following previous works, we increased the abundances of these gaseous species to simulate the sputtering. Table B.1 lists the species injected into the gas and their assumed abundances. The injected species have abundances similar to those measured by IR observations of the interstellar dust ices (Boogert et al. 2015). Specifically, they were constrained in order to match the abundances derived through direct observations of the 1100 years old L1157-B1a shock (Tafalla et al. 1995; Benedettini et al. 2013; Busquet et al. 2014). For some injected species, we choose the values derived by comparison of observations with model predictions. In addition, we slightly changed the values to fit the observed acetaldehyde and formamide abundances. Please note that the final model also reproduces the observed abundances of the species reported in Table B.1. When possible, we report the observed gas-phase abundances towards L1157-B1a, i.e. the youngest (1100 yr) shocked region within the B1 structure. Finally, we note that we use a pure gas-phase model with no freeze-out included, since the involved timescale is too short for freeze-out to have any impact on the results. In the following, we give details on the first two cases (the third one is a combination of both) discussed in the main text:
| Species | Injected (/H) | Observed (/H) | Reference | |
| Ices | L1157-B1 | |||
| CO2 | 3 10-5 | 3 10-4 | – | 1 |
| H2O | 2 10-4 | 1.2 10-4 | 1–3 10-4 | 1,2 |
| OCS | 2 10-6 | – | 10-6a | 3 |
| CH3OH | 4 10-6 | – | 5.5 10-6a | 4 |
| H2CO | 1 10-6 | – | 1.5 10-6 | 4 |
| NH3 | 2 10-5 | – | 10-6 | 5 |
| CH3CH2 | 4 10-8 | – | 2 10-7a | 6 |
1. Boogert et al. (2015); 2. Busquet et al. (2014); 3. Podio et al. (2014); 4. Benedettini et al. (2013);
5. Tafalla & Bachiller (1995); 6. Codella et al. (2015).
a Note that these values have been indirectly derived by comparison of observations and model predictions.
(1) Acetaldehyde and formamide are grain-surface chemistry products: the hypothesis is that both species are injected into the gas phase directly from the grain mantles, regardless of the mechanism that form them there. Once in the gas, the two species undergo reactions that destroy them (Fig. 3). Specifically, both acetaldehyde and formamide are attacked by the most abundant gaseous ions, namely H3O+, H3+ and HCO+, which produce protonated acetaldehyde and protonated formamide, respectively. Protonated formamide rapidly recombines with electrons and forms back formamide in only 20% of cases, according to the KIDA database (formamide is not present in the UMIST database). Similarly, the recombination of protonated acetaldehyde produces acetaldehyde in only 9% of electron recombinations. While the rate and products of the protonated formamide recombination are guessed, those of acetaldehyde, from the UMIST database, are measured (Hamberg et al. 2010). However, since the two species are destroyed by the same ions, even if the branching ratios of the formamide recombination in the KIDA database are wrong, what matters is the percentage of electron recombinations that give back formamide, which is certainly not unity. In this respect, therefore, the result that formamide and acetaldehyde are not both grain-surface chemistry products is robust. (2) Acetaldehyde and formamide are gas-phase chemistry products: the hypothesis is that both species are produced by gas-phase reactions after the injection into the gas of species previously frozen on the grain mantles. Only one reaction is known for the gas-phase formation of formamide, NH2 + H2CO NH2CHO + H (Barone et al. 2015; Vazart et al. 2016; Skouteris et al. 2017). The two mother species injected from the grain mantles to synthesise formamide are formaldehyde and ammonia. Both species have been detected in the solid state (Boogert et al. 2015) and are thought to be the result of hydrogenation on the grain surfaces of CO and N, respectively. NH2 is then produced from ammonia via the reactions of NH3 with H3O+ and H3+, which both give protonated ammonia NH4+. The electron recombination of NH4+ then produces amidogen.
For acetaldehyde, a dozen reactions are listed in the KIDA and UMIST databases. Among them, the reaction O + CH3CH2 CH3CHO + H (Charnley et al. 1992; Harding et al. 2005; Yang et al. 2005) is the most efficient in the conditions appropriate for the L1157-B1 gas. Therefore, the two gaseous species necessary to synthesise acetaldehyde are atomic oxygen and ethyl radical. According to the astrochemical models, less than 20% of gaseous oxygen is in the form of atomic oxygen. In L1157-B1, the O abundance is predicted to be 5 10-6, in agreement with the bright [OI]-63 m line observed (Benedettini et al. 2012) by Herschel in L1157-B1. The case of ethyl radical is a bit more complicated. It may be the result of the partial hydrogenation of C2H2 or C2H4 on the grain surfaces (to be noted that no observations exist about the abundance of this species in the solid form and no computations have been carried out) and be directly sputtered from the grain mantles as such. On the other hand, the ethyl radical can be produced starting from ethane, which, in turn, is formed by the total hydrogenation of C2H2 or C2H4 on the ice before sputtering. We run, therefore, a case where only ethane is liberated into the gas-phase: even assuming an injection of 4 10-6 ethane, namely 10% of CO, the predicted acetaldehyde abundance remains ten times lower than the observed one. Therefore, ethyl radical needs to be directly injected into the gas phase from the grain mantles. As discussed in the main text, an abundance of 4 10-8 is necessary to reproduce the L1157-B1 observations. Assuming an ethane abundance of 4 10-6, this would imply that about 1% of it is liberated from the grain mantles as the partially hydrogenated “cousin” ethyl radical. Alternatively, it is possible that the full hydrogenation leading to ethane is not very efficient on the grain surfaces.
In order to test the robustness of the results showed in Fig. 3 and discussed in the main text, we also run a case where 1% of ammonia is directly injected as amidogen (namely 2 10-7), in (possible) analogy to the ethyl radical. In this case, we obtain almost exactly the same results shown in Fig. 3, with differences of a few % within the first 2000 yr, confirming that the important mother species in the formamide formation is indeed ammonia. To summarise, the comparison between the observations and the model predictions leads to ammonia and ethyl radical as being the two needed previously frozen mother species of acetaldehyde and formamide respectively, with frozen-and-injected amidogen and ethane being minor actors.
Finally, it is possible that before equilibrating at 60 K, the shocked gas passed through a high-temperature period. In order to verify whether this period would affect the results reported in Fig. 3 and our conclusions, we run two models with the gas temperature equal to 1000 K, in the case (1) and the case (2). We found: (1) Acetaldehyde and formamide are grain-surface chemistry products: during the first 2000 yr of a possible high-temperature period the predicted abundance ratio of acetaldehyde and formamide remains practically the same, as they are destroyed by the same molecular ions (H3O+, H3+, and HCO+), so that it does not affect the output of Fig. 3 and our conclusion that this case does not reproduce the observed behaviour. (2) Acetaldehyde and formamide are gas-phase chemistry products: at 1000 K, the formamide rate of formation in the gas is very low, as it decreases with a power of 2.56 in temperature (Vazart et al. 2016), so that no formamide is appreciably synthesised during the high-temperature period. On the contrary, the predicted acetaldehyde abundance is almost the same as the one at 60 K during the first 2000 yr. Therefore, a high-temperature period preceding the 60 K one would go towards the same direction of our conclusions: the region with only acetaldehyde is younger (and possibly also warmer), while the region with formamide identifies an older shocked region and formamide is synthesised via the gas-phase reaction NH2 + H2CO. In summary, even if a high-temperature period, not included in our simple model, preceded the present 60 K equilibrated gas temperature, the effects would not change our main conclusion, namely that formamide has to be a gas chemistry product.