Massive quenched galaxies at z 0.7 retain large molecular gas reservoirs
Abstract
The physical mechanisms that quench star formation, turning blue star-forming galaxies into red quiescent galaxies, remain unclear. In this Letter, we investigate the role of gas supply in suppressing star formation by studying the molecular gas content of post-starburst galaxies. Leveraging the wide area of the SDSS, we identify a sample of massive intermediate-redshift galaxies that have just ended their primary epoch of star formation. We present ALMA CO(2-1) observations of two of these post-starburst galaxies at with . Their molecular gas reservoirs of and are an order of magnitude larger than comparable-mass galaxies in the local universe. Our observations suggest that quenching does not require the total removal or depletion of molecular gas, as many quenching models suggest. However, further observations are required both to determine if these apparently quiescent objects host highly obscured star formation and to investigate the intrinsic variation in the molecular gas properties of post-starburst galaxies.
Subject headings:
galaxies: evolution — galaxies: formation1. Introduction
Galaxies at low and intermediate redshifts broadly fall into two categories: disky, blue star-forming galaxies and ‘quenched’ red elliptical galaxies without ongoing star formation (e.g., Kauffmann et al. 2003). To create these observed galaxy populations, blue galaxies must somehow cease forming stars. Because stars form out of cold molecular gas, many quenching models attempt to explain the cessation of star formation through mechanisms that remove, deplete, or heat molecular gas reservoirs. For example, strong feedback from quasars could stop star formation by removing gas from the galaxy (e.g., Di Matteo et al. 2005; Hopkins et al. 2006), possibly induced by a major merger (e.g., Wellons et al. 2015). Massive molecular outflows, such as those observed locally by Alatalo (2015) and Leroy et al. (2015), could play a role in this process. Alternately, virial shocks could reduce the accretion of cool gas onto massive halos (e.g., Kereš et al. 2005; Dekel & Birnboim 2006) and prevent new stars from forming. Feldmann & Mayer (2015) suggest that star formation suppression is initiated by the decline of cool gas accretion onto the galaxy once the parent dark matter halo switches from a fast collapsing mode to a slow accretion mode.
To test these models, it is vital to investigate the molecular gas properties of galaxies just after they quench. post-starburst galaxies– whose spectra resemble A-type stars, indicating a burst of star formation that ended Gyr ago (e.g., Le Borgne et al. 2006)– represent the direct and unpolluted products of the quenching process. Low-redshift post-starburst galaxies (‘E+A’ or ‘K+A’ galaxies, e.g. Dressler & Gunn 1983; Couch & Sharples 1987; Zabludoff et al. 1996) have been shown to have larger molecular gas reservoirs than expected given their low star formation rates (SFRs; French et al. 2015). These low-mass galaxies are shutting off a small burst of late-time star formation, as opposed to quenching their major star-forming episode. Only by moving to higher stellar masses and redshifts can we study galaxies that have just finished their primary epoch of star formation (e.g., Whitaker et al. 2012a); however, we must select galaxies at low enough redshifts that observations of low-J CO transitions are feasible.
In this Letter, we leverage the wide area of the Sloan Digital Sky Survey (SDSS, York et al. 2000) to identify post-starburst galaxies at . We present ALMA CO(2-1) observations of two post-starburst galaxies, which reveal large reservoirs of molecular gas.
We assume a cosmology of , and .
2. Sample Selection
To identify a sample of massive post-starburst galaxies bright enough for follow-up study, we select galaxies from the SDSS DR12 (Alam et al. 2015) spectroscopic catalog with , , and median spectral signal-to-noise ratio . We identify galaxies dominated by A-type stars following the method introduced in Kriek et al. (2010), which selects post-starburst galaxies by their strong Balmer breaks and their blue slopes redward of the break. The final selection was checked by eye to remove stars and brown dwarfs, and consists of 50 post-starburst galaxies at with a median redshift of .
To derive the stellar masses of the post-starburst galaxy sample, we fit the SDSS spectra with the stellar population synthesis fitting code FAST (Kriek et al. 2009) using the Bruzual & Charlot (2003) stellar population library, a Chabrier (2003) initial mass function (IMF), a delayed exponential star formation history, and the Kriek & Conroy (2013) dust attenuation law. The mass was aperture corrected using the difference between the photometric magnitude in the SDSS , , and filters and the same magnitudes as measured from the optical spectra; this correction increased the adopted stellar mass by a mean factor of 1.5.
We measured SFRs using the aperture-corrected line flux of the [O ii] 3727 doublet and the SFR conversion in Kennicutt (1998a), adjusted to a Chabrier IMF. To measure the [O ii] flux, we modeled the region around the doublet as a single Gaussian centered at the mean wavelength of [O ii] plus a straight-line continuum with a free slope and intercept. The width of the Gaussian line was held equal to the stellar velocity dispersion, given in the MPA-JHU catalogs (Aihara et al. 2011). In all cases, the velocity dispersion resulted in a single Gaussian wider than the separation between the two lines in the [O ii] doublet. Uncertainties in the SFR were bootstrapped from 1,000 realizations of the [O ii] line flux fit. We corrected the SFR for dust attenuation using the best-fit dust attenuation value from the stellar population fit (median A=0.8 mag).
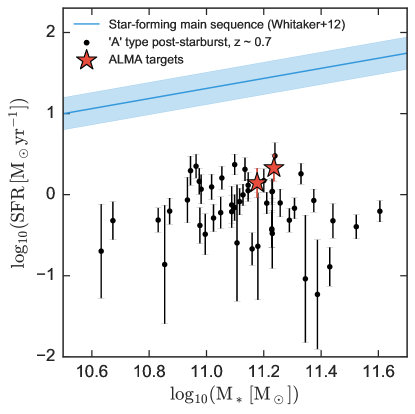
Figure 1 shows the SFR as a function of stellar mass for the full post-starburst galaxy sample. All galaxies lie significantly below the star-forming main sequence at this redshift (Whitaker et al. 2012b).
3. ALMA Observations
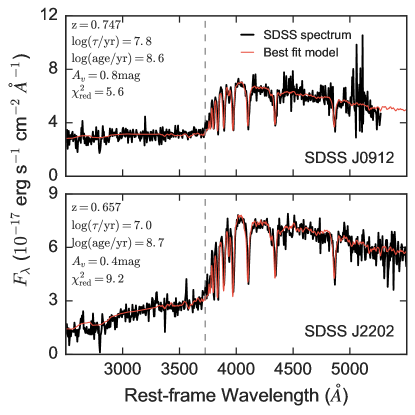
We selected two of the highest-redshift, brightest galaxies– SDSS J0912+1523 and SDSS J2202-0033– from the full sample for follow-up observations with ALMA. The SDSS discovery spectra of these two galaxies are shown in Figure 2, and basic parameters are listed in Table 1. The ALMA observations were carried out in program 2016.1.01126.S (PI: R. Bezanson) in January and March 2017 using the ALMA Band 4 receivers (Asayama et al. 2014). Observations were made in 80 min blocks, with two blocks dedicated to each target. The total on-source integration time for each target was 100 min. The data were reduced using the standard ALMA pipeline, which produced good results for both SDSS J0912+1523 observing blocks and one SDSS J2202-0033 block. In the second observation of SDSS J2202-0033, many antennas were shadowed by other antennas during observations of the bandpass calibrator due to the compact array configuration. This caused the automatic pipeline to flag the shadowed antennas for the remainder of the observing block. We instead derived the frequency-dependent response of the affected antennas using the repeated observations of the complex gain calibrator carried out during the remainder of the track. While the gain calibrator is not as bright as the bandpass calibrator, we verified that the bandpass solutions derived in this way are consistent with those using the bandpass calibrator for the antennas which were not shadowed.
| ID | z | [] | SFR [/yr] | Aperture Correction | [K km s-1 pc2] | |
|---|---|---|---|---|---|---|
| SDSS J0912+1523 | 0.747 | (1.7 0.3) | 2.1 0.8 | 1.130.01 | 8.5 0.4 | (34.01.6) |
| SDSS J2202-0033 | 0.657 | (1.5 0.2) | 1.4 0.6 | 1.110.01 | 1.6 0.2 | (6.40.8) |
Note. — Errors in are dominated by systematics, which we estimated by varying the model library, star formation history, and dust law in the stellar population fits.
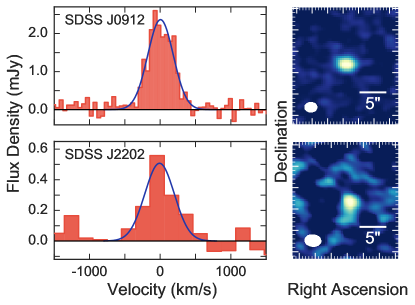
The observations reach a spatial resolution of 2.23.0′′ (1622 kpc) and 1.72.4′′ (1217 kpc) for SDSS J2202-0033 and SDSS J0912+1523, respectively, in images inverted using natural weighting, which maximizes sensitivity at the expense of slightly lower spatial resolution. No 2 mm continuum emission was detected in either source, with a 3 upper limit Jy.
CO(2–1) is significantly detected in both target galaxies. Inspection of the image cubes and a comparison of the maximum pixel values with the integrated flux density indicate that SDSS J0912+1523 is marginally spatially resolved, with a deconvolved source FWHM of 1.9 0.3′′ (14 2 kpc). SDSS J2202-0033 is not spatially resolved at the depth and resolution of our data. To extract spectra, we fit a point source (SDSS J2202-0033) or a circular Gaussian (SDSS J0912+1523) to the visibility data using the uvmultifit package (Martí-Vidal et al. 2014), averaging 24 (SDSS J2202-0033) or 6 (SDSS J0912+1523) channels, yielding a velocity resolution of 200 and 50 , respectively. These spectra, as well as images integrated over the full linewidths of each target, are shown in Figure 3.
4. Molecular Gas Masses
Both sources are significantly detected in CO(2–1) emission (see Figure 3). We fit simple Gaussian profiles to these spectra, which yield integrated line fluxes of and Jy for SDSS J0912+1523 and SDSS J2202-0033, respectively. At the redshifts of each source, these fluxes correspond to line luminosities and K pc2, respectively.
The CO line luminosity can be converted to a molecular gas mass using the conversion factor . In high metallicity objects, typically varies from /(K pc2) in highly star-forming objects (typically gas-rich merging systems) to /(K pc2) in the Milky Way and other normal star-forming galaxies, principally due to the escape probability in the optically-thick CO line (see Bolatto et al. 2013 for a recent review; hereafter we suppress the units of ).
We estimate the value of using the numerical models of Narayanan et al. (2012). These authors combined hydrodynamical modeling of a variety of isolated and merging galaxies with molecular line radiative transfer to develop a fitting formula for as a function of the CO surface brightness. SDSS J2202-0033 is not spatially resolved at the depth and resolution of our data, which yields a lower limit on the CO surface brightness and an upper limit on the conversion factor of . Our data spatially resolve SDSS J0912+1523; combined with its CO luminosity, this implies . For ease of comparison with the literature, we therefore adopt = 4.0 for both of our targets.
Additionally, is valid and applies only to the CO(1–0) transition, so observations of higher CO lines require a correction factor to the ground state. Based on observations of a wide variety of galaxies at many redshifts, the CO(2–1)/CO(1–0) line ratio likely falls in the range 0.7–1.0 in temperature units, where 1.0 indicates thermalized emission (e.g., Combes et al. 2007; Dannerbauer et al. 2009; Young et al. 2011). We assume thermalized emission in our analysis. This is a conservative assumption, yielding a minimum CO(1–0) line luminosity; the true values may be higher by 30%.
Given these assumptions, we find molecular gas masses of for SDSS J0912+1523 and for SDSS J2202-0033. These uncertainties reflect only the statistical uncertainties on the measured CO luminosities; we stress that there are also factor of two systematic uncertainties associated with the CO excitation and conversion factor.
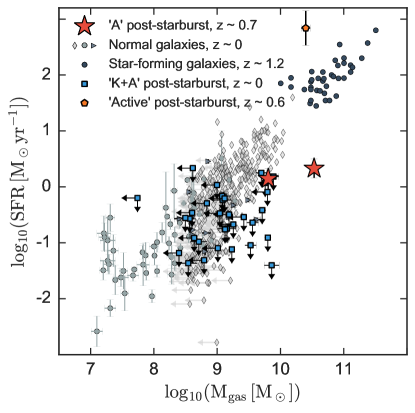
In Figure 4, we show SFR versus molecular gas mass for SDSS J0912+1523 and SDSS J2202-0033. It is clear that our observations, especially SDSS J0912+1523, are significantly offset from measurements of star-forming galaxies at both low and high redshifts. Adopting the CO size, the gas mass surface density of SDSS J0912+1523 is a factor of 11 higher than expected from its SFR surface density (Kennicutt 1998b). SDSS J0912+1523 has a gas mass a factor of two larger than expectations from the empirical scaling relation in Genzel et al. (2015); SDSS J2202-0033 has a gas mass three times lower than expected from the same scaling.
In Figure 4 we show for comparison the low-redshift ‘K+A’ post-starburst galaxies in French et al. (2015), an ‘active’ post-starburst galaxy in the Sell et al. (2014) sample observed in CO by Geach et al. (2013), and star-forming and quiescent galaxies at (COLD GASS, Saintonge et al. 2011; ATLAS-3D, Young et al. 2011; Cappellari et al. 2011, 2013; Davis et al. 2013, 2014; and MASSIVE, Davis et al. 2016) as well as (PHIBSS, Tacconi et al. 2013). Molecular gas fractions () vary significantly both amongst the three post-starburst samples and within in each sample: the K+A post-starbursts have , the active post-starburst has , and SDSS J0912+1523 and SDSS J2202-0033 have respective 20% and 4%.
5. Implications for Galaxy Quenching
Our results imply that star formation can be suppressed in galaxies that still have significant reservoirs of molecular gas. Models that require the complete depletion or ejection of molecular gas to quench star formation are inconsistent with the large gas masses in SDSS J0912+1523 and SDSS J2202-0033. Models that explain star formation suppression without removing the gas– such as morphological quenching (Martig et al. 2009), which suggests that a buildup of stars into a bulge can stabilize some cold molecular gas against collapse– are more consistent with our observations. However, it is not clear that current quenching models can fully explain the observed elevated molecular gas masses, especially for SDSS J0912+1523.
Alternatively, the star formation in SDSS J0912+1523 and SDSS J2202-0033 may only be temporarily suppressed. Simulations of massive z2 galaxies predict a large amount of variability in ISM properties and star formation activity on short (tens of Myr) timescales (Feldmann et al. 2017). These simulations contain a small number of galaxies with molecular gas fractions and SFR/ similar to SDSS J2202-0033. However, they are not able to reproduce a counterpart of the more extreme case of SDSS J0912+1523.
The factor of five difference in gas mass between SDSS J0912+1523 and SDSS J2202-0033 indicates that, unsurprisingly, quenching may proceed differently from galaxy to galaxy. A larger galaxy sample is required to investigate intrinsic variations in the gas properties of post-starburst galaxies and determine whether SDSS J0912+1523 is an intriguing outlier or representative of recently quenched galaxies.
6. Comparison to other studies
Our results are similar to French et al. (2015), who found high molecular gas masses given the SFR of ‘K+A’ post-starburst galaxies at . These authors interpret their observations as evidence for suppressed star-formation efficiency, a low , or a bottom-heavy IMF in these galaxies.
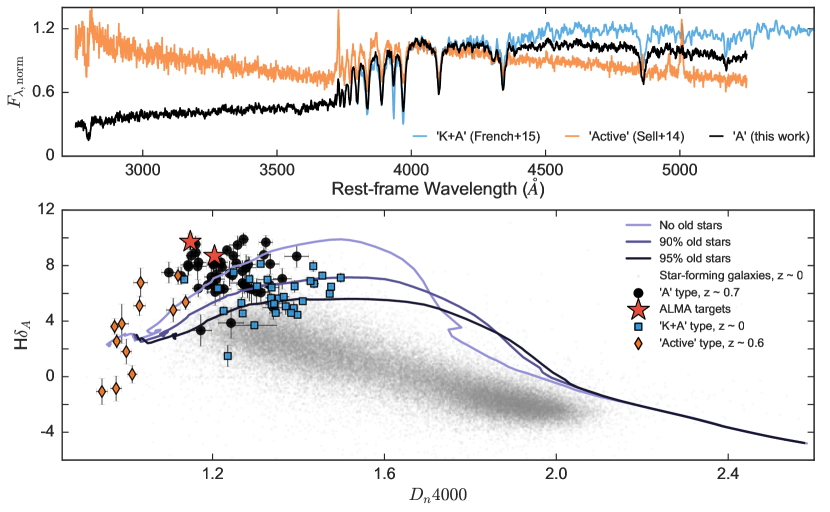
There are, however, significant differences between the French et al. (2015, hereafter ‘K+A sample’) post-starburst galaxies, the post-starburst galaxies in this study, and the post-starburst galaxies in other studies such as Sell et al. (2014, hereafter ‘active sample’). The K+A sample includes , galaxies with strong Balmer lines and low ongoing star formation. The active sample includes , - galaxies with strong Balmer absorption and weak nebular emission. In this study, we select , galaxies with strong Balmer breaks and blue slopes redward of the break. Despite all selections emphasizing ‘post-burst’ criteria, the median stacked optical spectra of the three samples (top panel of Figure 5) are clearly distinct. The active sample shows prominent UV continuum as well as [O ii] and [O iii] emission lines; inferred SFRs are . The K+A sample does not show UV continuum or emission lines, but has excess emission at rest-frame indicating a larger fractional contribution from old stars than the ‘A-type’ post-starburst selection in this Letter.
To further illustrate the differences between the post-starburst samples, we show the H index as a function of for all three samples as well as SDSS DR12 galaxies with and (bottom panel of Figure 5). The H index traces recent star formation, and is sensitive to the age of the stellar population. For all three post-starburst samples we measured H using EZ_Ages (Graves & Schiavon 2008), adopting the Princeton 1D VDISP measurement for the velocity dispersion correction; we measured from the SDSS spectra (Balogh et al. 1999). Purple lines of increasing shade indicate the time evolution of Bruzual & Charlot (2003) single/double-burst models with an increasing contribution from old stars. The first model is a simple stellar population; the second is a model where 90% of the stars were formed in a starburst 4 Gyr before the current star formation epoch; the third is a model where 95% of the stars were formed in a previous starburst.
The active sample lies at low and has a range of H values likely corresponding to emission partially filling in the absorption feature. Given their high inferred SFR, these galaxies are still ‘active’ and have not yet fully quenched their star formation; it is possible that after they quench, these galaxies will resemble A-type post-starburst galaxies. The K+A post-starbursts are consistent with models where only 5-10% of the galaxy’s mass was formed in the most recent burst. This indicates that these galaxies formed the majority of their stars at higher redshift, and have just quenched a small amount of late-time star formation. Their spectra show the signatures of recently formed A-type stars as well as older K-type stars from previous star formation episodes. The A-type post-starbursts selected in this Letter are consistent with a simple stellar population model; i.e., they likely just finished their primary epoch of star formation and thus look like A-type stars.
Given these differences, it is not clear that the same physical mechanisms should quench both the late-time star formation in the K+A galaxies and the primary epoch of star formation in the A-type post-starburst galaxies. It is surprising that both the low-redshift K+A post-starbursts and intermediate-redshift A-type post-starbursts show high gas molecular gas masses for their SFR, indicating quenching in both redshift regimes can occur without exhausing or depleting molecular gas reservoirs.
7. Discussion
In this Letter, we present ALMA CO(2-1) observations of two recently-quenched post-starburst galaxies at . These galaxies were selected from a unique sample of 50 A-type post-starburst galaxies at . Unlike low-redshift K+A post-starburst galaxies, these massive galaxies have just concluded their major star-forming episode. Additionally, this sample lies at low enough redshift that follow-up observations of low-J CO transitions are feasible. The observed molecular gas masses in these galaxies are significantly higher than expected given their low ongoing SFR. This indicates that galaxies may quench their primary epoch of star formation without completely depleting or exhausting their molecular gas.
However, there are several alternative explanations for the high gas masses in SDSS J0912+1523 and SDSS J2202-0033. Short-term SFR variations, seen in some higher-redshift galaxy simulations, could account for the elevated gas mass of SDSS J2202-0033. As in French et al. (2015), a lower value could decrease the inferred gas mass and a bottom-heavy IMF could increase the inferred SFR, alleviating tension between the gas supply and low ongoing SFR. It is also possible that there is significant obscured star formation in SDSS J0912+1523 or SDSS J2202-0033.
We place a constraint on the dust-obscured star formation of each target using the non-detection of the 2mm ALMA continuum. We assume that the dust emission follows a standard modified blackbody function with K (typical of star-forming galaxies; e.g., Magdis et al. 2012). The resulting upper limits on the FIR luminosity imply 3 upper limits on the obscured SFR /yr. We additionally constrain the obscured star formation with WISE 12m data (Mainzer et al. 2011), using the log average of Dale & Helou (2002) templates with to convert the observed 12m luminosity to a total IR luminosity, following Whitaker et al. (2012b); this gives an upper limit of . Just /yr of obscured star formation– well below the current constraints from either WISE or 2mm continuum– would place SDSS J2202-0033 in line with the expected relation. In contrast, /yr of obscured star formation is required to account for the significant gas reservoir in SDSS J0912+1523. Both the radio and IR SFR upper limits are highly uncertain, and deeper rest-frame infrared measurements are required to place stronger constraints on any obscured star formation.
Finally, we note that the sample size of this study is very small; measurements of the molecular gas in a larger sample of post-starburst galaxies are necessary to determine if these galaxies are simply outliers. Thus, moving forward we need to obtain a larger sample of galaxies with gas measurements and tight constraints on the dust-obscured SFR. By studying the intrinsic variation in molecular gas properties of ‘A-type’ post-starburst galaxies, we may be able to constrain the primary mechanisms behind galaxy quenching.
References
- Aihara et al. (2011) Aihara, H., Allende Prieto, C., An, D., et al. 2011, ApJS, 193, 29
- Alam et al. (2015) Alam, S., Albareti, F. D., Allende Prieto, C., et al. 2015, ApJS, 219, 12
- Alatalo (2015) Alatalo, K. 2015, ApJ, 801, L17
- Asayama et al. (2014) Asayama, S., Takahashi, T., Kubo, K., et al. 2014, PASJ, 66, 57
- Balogh et al. (1999) Balogh, M. L., Morris, S. L., Yee, H. K. C., Carlberg, R. G., & Ellingson, E. 1999, ApJ, 527, 54
- Bolatto et al. (2013) Bolatto, A. D., Wolfire, M., & Leroy, A. K. 2013, ARA&A, 51, 207
- Bruzual & Charlot (2003) Bruzual, G., & Charlot, S. 2003, MNRAS, 344, 1000
- Cappellari et al. (2011) Cappellari, M., Emsellem, E., Krajnović, D., et al. 2011, MNRAS, 413, 813
- Cappellari et al. (2013) Cappellari, M., Scott, N., Alatalo, K., et al. 2013, MNRAS, 432, 1709
- Chabrier (2003) Chabrier, G. 2003, PASP, 115, 763
- Combes et al. (2007) Combes, F., Young, L. M., & Bureau, M. 2007, MNRAS, 377, 1795
- Couch & Sharples (1987) Couch, W. J., & Sharples, R. M. 1987, MNRAS, 229, 423
- Dale & Helou (2002) Dale, D. A., & Helou, G. 2002, ApJ, 576, 159
- Dannerbauer et al. (2009) Dannerbauer, H., Daddi, E., Riechers, D. A., et al. 2009, ApJ, 698, L178
- Davis et al. (2016) Davis, T. A., Greene, J., Ma, C.-P., et al. 2016, MNRAS, 455, 214
- Davis et al. (2013) Davis, T. A., Alatalo, K., Bureau, M., et al. 2013, MNRAS, 429, 534
- Davis et al. (2014) Davis, T. A., Young, L. M., Crocker, A. F., et al. 2014, MNRAS, 444, 3427
- Dekel & Birnboim (2006) Dekel, A., & Birnboim, Y. 2006, MNRAS, 368, 2
- Di Matteo et al. (2005) Di Matteo, T., Springel, V., & Hernquist, L. 2005, Nature, 433, 604
- Dressler & Gunn (1983) Dressler, A., & Gunn, J. E. 1983, ApJ, 270, 7
- Feldmann et al. (2017) Feldmann, R., Quataert, E., Hopkins, P. F., Faucher-Giguère, C.-A., & Kereš, D. 2017, MNRAS, 470, 1050.
- Feldmann & Mayer (2015) Feldmann, R., & Mayer, L. 2015, MNRAS, 446, 1939
- French et al. (2015) French, K. D., Yang, Y., Zabludoff, A., et al. 2015, ApJ, 801, 1
- Geach et al. (2013) Geach, J. E., Hickox, R. C., Diamond-Stanic, A. M., et al. 2013, ApJ, 767, L17
- Genzel et al. (2015) Genzel, R., Tacconi, L. J., Lutz, D., et al. 2015, ApJ, 800, 20
- Graves & Schiavon (2008) Graves, G. J., Schiavon, R. P. 2008, ApJS, 177, 446
- Hopkins et al. (2006) Hopkins, P. F., Hernquist, L., Cox, T. J., et al. 2006, ApJS, 163, 1
- Kauffmann et al. (2003) Kauffmann, G., Heckman, T. M., White, S. D. M., et al. 2003, MNRAS, 341, 54
- Kennicutt (1998a) Kennicutt, Jr., R. C. 1998, ARA&A, 36, 189
- Kennicutt (1998b) Kennicutt, Jr., R. C. 1998, ApJ, 498, 541
- Kereš et al. (2005) Kereš, D., Katz, N., Weinberg, D. H., & Davé, R. 2005, MNRAS, 363, 2
- Kriek & Conroy (2013) Kriek, M., & Conroy, C. 2013, ApJ, 775, L16
- Kriek et al. (2009) Kriek, M., van Dokkum, P. G., Labbé, I., et al. 2009, ApJ, 700, 221
- Kriek et al. (2010) Kriek, M., Labbé, I., Conroy, C., et al. 2010, ApJ, 722, L64
- Le Borgne et al. (2006) Le Borgne, D., Abraham, R., Daniel, K., et al. 2006, ApJ, 642, 48
- Leroy et al. (2015) Leroy, A. K., Walter, F., Martini, P., et al. 2015, ApJ, 814, 83
- Magdis et al. (2012) Magdis, G. E., Daddi, E., Béthermin, M., et al. 2012, ApJ, 760, 6
- Mainzer et al. (2011) Mainzer, A., Bauer, J., Grav, T., et al. 2011, ApJ, 731, 53
- Martí-Vidal et al. (2014) Martí-Vidal, I., Vlemmings, W. H. T., Muller, S., & Casey, S. 2014, A&A, 563, A136
- Martig et al. (2009) Martig, M., Bournaud, F., Teyssier, R., & Dekel, A. 2009, ApJ, 707, 250
- Narayanan et al. (2012) Narayanan, D., Krumholz, M. R., Ostriker, E. C., & Hernquist, L. 2012, MNRAS, 421, 3127
- Saintonge et al. (2011) Saintonge, A., Kauffmann, G., Kramer, C., et al. 2011, MNRAS, 415, 32
- Sell et al. (2014) Sell, P. H., Tremonti, C. A., Hickox, R. C., et al. 2014, MNRAS, 441, 3417
- Tacconi et al. (2013) Tacconi, L. J., Neri, R., Genzel, R., et al. 2013, ApJ, 768, 74
- Wellons et al. (2015) Wellons, S., Torrey, P., Ma, C.-P., et al. 2015, MNRAS, 449, 361
- Whitaker et al. (2012a) Whitaker, K. E., Kriek, M., van Dokkum, P. G., et al. 2012a, ApJ, 745, 179
- Whitaker et al. (2012b) Whitaker, K. E., van Dokkum, P. G., Brammer, G., & Franx, M. 2012b, ApJ, 754, L29
- York et al. (2000) York, D. G., Adelman, J., Anderson, Jr., J. E., et al. 2000, AJ, 120, 1579
- Young et al. (2011) Young, L. M., Bureau, M., Davis, T. A., et al. 2011, MNRAS, 414, 940
- Zabludoff et al. (1996) Zabludoff, A. I., Zaritsky, D., Lin, H., et al. 1996, ApJ, 466, 104