Are fibres in molecular cloud filaments real objects?
Abstract
We analyse the morphology and kinematics of dense filamentary structures produced in a numerical simulation of a star–forming cloud of evolving under their own self–gravity in a magnetized media. This study is motivated by recent observations of velocity–coherent substructures (“fibres") in star-forming filaments. We find such “fibres" ubiquitously in our simulated filament. We found that a fibre in one projection is not necessarily a fibre in another projection, and thus, caution should be taken into account when considering them as real objects. We found that only the densest parts of the filament (30% of the densest volume, which contains 70% of the mass) belongs to fibres in 2 projections. Moreover, it is quite common that they are formed by separated density enhancements superposed along the line of sight. Observations of fibres can yield insight into the level of turbulent substructure driven by gravity, but care should be taken in interpreting the results given the problem of line of sight superposition. We also studied the morphology and kinematics of the 3D skeleton (spine), finding that subfilaments accrete structured material mainly along the magnetic field lines, which are preferentially perpendicular to the skeleton. The magnetic field is at the same time dragged by the velocity field due to the gravitational collapse.
keywords:
turbulence, magnetic fields – stars: formation –ISM: clouds –ISM: structure –ISM: kinematics and dynamics – methods: numerical, magnetohydrodynamics, turbulence1 Introduction
Although filamentary structure in star-forming molecular clouds and young stellar populations has long been recognized (e.g., Schneider & Elmegreen, 1979; Hartmann, 2002; Nutter et al., 2008), as well as the possible importance of filamentary geometry on scales of gravitational fragmentation (Larson, 1985, 2005), the subject has attracted increasing attention following the detection of ubiquitous filamentary structure in far-infrared imaging with the Herschel Space Telescope, generally associated with recent and/or ongoing star formation (André et al., 2010; Men’shchikov et al., 2010; Arzoumanian et al., 2011; Hacar & Tafalla, 2011).
Recently, kinematic investigations, most notably of the B211/213 cloud in Taurus, have provided evidence for velocity-coherent substructures within filaments (called “fibres"; Hacar et al., 2013). This led Tafalla & Hacar (2015) to propose the “fray and fragment" scenario for filament and star formation, in which supersonic flows form a filamentary density enhancement. In this scenario, the filament then splits into intertwined velocity-coherent fibres as a result of turbulent motions and gravitational driving (the “fray" step). Finally, some fibres acquire enough mass to gravitationally fragment into cores and stars. Some theoretical support for this idea has been provided by Clarke et al. (2017), who numerically simulated the evolution of a cylinder in a converging, cylindrical flow with additional imposed turbulence. On the other hand, large-scale cloud simulations by Smith et al. (2016) indicated that subfilaments, which they interpret as possible fibres, formed first, and then gather together to form denser main filaments, suggesting a “fray and gather” scenario.
There have been many theoretical investigations of filaments, including analytic studies of idealized filaments, both non-magnetized (Larson, 1985, 2005) and magnetized (Hennebelle, 2003; Tilley & Pudritz, 2003; Seifried & Walch, 2015), as well as accreting filaments (which must occur to form filaments in the first place; Fischera & Martin, 2012; Heitsch, 2013). While these studies have provided important general insights into filament properties, to study the relation of fibres to filaments it is necessary to conduct large-scale simulations of turbulent clouds evolving under self gravity (e.g., Jappsen et al., 2005; Gómez & Vázquez-Semadeni, 2014; Smith et al., 2014; Moeckel & Burkert, 2015), as these simulations produce filaments with substructure that otherwise need to be put in by hand in smaller-scale calculations.
In this contribution we present simulations of an initially turbulent cloud evolving under gravity, similar to those of Smith et al. (2016) but with the inclusion of magnetic fields, which are expected to enhance the formation of filaments perpendicular to the field (Hennebelle, 2013). In order to compare more directly with previous observational work, we map our data into Position–Position–Velocity (PPV) data cubes, and apply a Friends–of–Friends in velocity algorithm (FoFv) similar to the Friends-in-Velocity (FIVe) algorithm used by Hacar et al. (2013) to identify fibres. However, in order to assess the physical coherence of the fibres and to compare with previous numerical work, we apply DisPerSE (Sousbie, 2011; Sousbie et al., 2011), an algorithm that searches for the “skeletons" of the density field.
We find that velocity-coherent fibres as observed by Hacar et al. (2013); Tafalla & Hacar (2015) are ubiquitous in our PPV maps. However, fibres in one PPV projection share little correspondance with fibres in another projection, implying that fibres are the result of superposition, rather than been actual physical, spatially and velocity coherent structures (e.g., Ballesteros-Paredes & Mac Low, 2002; Gammie et al., 2003). We also find that, although the filaments may be moving in different directions as a whole, in the local frame of the skeleton they are accreting mass from their environment.

Our results emphasize the importance of projection in spatially superposing physically-distinct velocity components. Furthermore, our models suggest that fibres in general are not a result of filament splitting. The inflows are the result of gravitational acceleration toward the growing filament. A “hub-spoke" geometry, with subfilaments accreting toward mass concentrations (cores, sinks) within filaments, often occurs.
The plan of the paper is as follows. In §2 and §3 we describe the numerical methods and we present our results in §4. In §5 we compare our findings with those of Smith et al. (2016) and Clarke et al. (2017), and discuss the implications for the “fray and fragment" scenario. Finally, we summarize the results in §6.
2 Numerical Simulations
We use the Eulerian adaptive mesh refinement FLASH (v2.5) code (Fryxell et al., 2000) to perform three-dimensional, self gravitating, magnetohydrodynamic (MHD) simulations of a hierarchically collapsing molecular cloud in an isothermal regime. The ideal MHD equations are solved using the MHD HLL3R solver (see e.g., Waagan et al., 2011), which present a good compromise between accuracy and robustness for highly supersonic astrophysical problems, such as those studied here. We impose periodic boundary conditions for the MHD and isolated ones for gravity.
In order to follow the development of high density regions, we dynamically refine according to the Jeans criterion, which aims to prevent spurious fragmentation, by requiring that the local Jeans length be resolved by at least four grid cells (Truelove et al., 1997). Once the maximum refinement level is reached in a given cell, no further refinement is performed and a sink particle can be formed when the density in this cell exceeds a threshold density, , among other standard tests. The sink particles can then accrete mass from their surroundings, increasing their mass (Federrath et al., 2010).
Our numerical setup is very similar to that of Juárez et al. (2017) and Ballesteros-Paredes et al. (2015, simulation labeled run 22).111Although these works are aimed at simulating compact and massive cores and the latter authors use a different numerical scheme (Lagrangian smoothed particle hydrodynamics) and do not consider magnetic fields. We consider a numerical box of pc per side filled with molecular gas with number density of . Therefore, the box contains (taking a mean molecular weight of ) of molecular gas homogeneously distributed. The initial free-fall time for this configuration is Myr. The simulation is isothermal, with temperature of 10 K. The isothermal sound speed is thus .
The initial velocity field corresponds to a supersonic decaying turbulence, so no forcing at later times is imposed. Following the prescription by Stone et al. (1998), we included pure rotational velocity power spectrum with random phases and amplitudes that peak at wavenumbers of . The resulting initial velocity field is thus a solenoidal supersonic turbulent fluid, with an rms Mach number of .
To properly follow the gravitational fragmentation and collapse of dense gas, we fulfill the Jeans criterion by resolving the local Jeans length for 8 grid cells. We allow the code to refine up to reach a maximum resolution of , and we set the threshold density for sink formation at . We evolve the simulation for roughly one free-fall time.
The magnetic field, of strength , is initially uniform along the -direction, since the initial orientation does not significantly change the results in gravo–turbulent MHD simulations (see, e.g., Hennebelle, 2013). This initial magnetic field strength is within the observational rage in diffuse clouds (0.1-10 G with a mean value of 5-6 G; Crutcher et al., 2010). Note that our box is, thus, magnetically supercritical, with a mass-to-flux ratio of 7.0 times the critical value, (see e.g., Nakano & Nakamura, 1978), and prone to hierarchical gravitational collapse as soon as the initial turbulence is dissipated. It should be noticed that although this intensity of magnetic field seems to be low for a protostellar core, it is only the initial value. As collapse proceeds, gravity is dragging the magnetic field lines, increasing the intensity of the field. As a result, our magnetic field intensities in the subregion we are analyzing after almost one free-fall time have a mean value of G, with a standard deviation of G. These values are in agreement with the values reported by Crutcher et al. (2010).
3 Filament and velocity coherent structure finding
To understand the origin of fibres, we analyse either the PPV cubes, and apply to them a FoFv algorithm (see, e.g., Huchra & Geller, 1982; Hacar et al., 2013), and the PPP cubes, applying to them the DisPerSE method (Sousbie, 2011; Sousbie et al., 2011).
3.1 PPV maps
Although ideally one would post-process the numerical simulations with radiative transfer calculations of the line emission, as in Smith et al. (2016), we note that radiative transfer simulations have their own uncertainties, such as: how much shielding of CO from UV-dissociating radiation is due to local or global gas and dust; whether the heating by protostars is significant; or whether the commonly used Large Velocity Gradient method is applicable to low-velocity or subsonic structures. Therefore, not just as an initial step, but also with the aim to understand what an observer using a really optically thin line is detecting, we simply assume that velocity coherent dense structures will also be seen as velocity coherent structures in line emission, although with some scaling in intensity. We therefore construct PPV cubes as density-weighted velocity histograms along each direction, equivalent to an optically thin line with a constant source function.
As a first step to construct the PPV data, we map the density and velocities in a regular grid at the maximum resolution of the simulation. Then we make a synthetic PPV cubes as density–weighted velocity histograms at every position , in which we store a synthetic intensity, defined as
| (1) |
where and are any pair of cartesian coordinates, and the corresponding 3rd coordinate, perpendicular to the previous ones, over which we will integrate in bins of velocity in that direction. We consider only cells with number density above , from which we expect most of the molecular emission, mimicking the emission of an intermediate density tracer like C18O. We have chosen a velocity channel width of 0.07, as Hacar et al. (2013), in order to allow detailed comparison.
3.2 Friends–of–Friends in velocity
Following (Hacar et al., 2013, hereinafter H13), we used a Friends–of–Friends in velocity (FoFv) algorithm to find coherent structure in the PPV data cubes. This is a similar algorithm to Friends–of–Friends (Huchra & Geller, 1982), but the 3rd coordinate is the velocity in the line of sight. We chose to follow H13 as close as possible, and so, we use the same parameters to build the PPV diagrams and find structure within them. As H13, we followed a 3 step algorithm: we first identify the high intensity points choosing those points having 6 times the root mean square value of the intensity, , in the PPV cube, then using the first selection, we search for friends of friends using twice the spatial resolution in distance, and finally, points with intensities lower than 6, but still larger than , are considered (see section 6 and Fig. 10 in H13).
This method allows us to identify velocity–coherent structures, which we will refer as “fibres", in the filaments of the simulations. Note that, in contrast to observations, we are able to trace fibres in the 3 projections, and store the actual location of every cell in the PPP space.
For consistency, we use the same resolution in PPV space that H13, along with the same FoFv parameters. The only free parameter is the density threshold to find the densest PPV cells, which we chose to 6, although we get roughly the same number of fibres in the range of 5-8. On the other hand, increasing or decreasing the minimum intensity for which we find friends results in thinner or wider fibres in the velocity coordinate.
3.3 3D Filament finding
We use DisPerSE (Discrete Persistent Structures Extractor; Sousbie, 2011; Sousbie et al., 2011) in order to find filamentary structures from the 3D density field based in topological considerations.
DisPerSE is based on the discrete Morse Theory. This algorithm find filaments by locating critical points (where the gradient of the density field is zero) and the skeleton of the filament is building by connecting maxima and saddle points along integral lines (curves tangent to the gradient filed). The important free parameter is the so-called persistence threshold (the absolute difference value between two critical points, e.g. a maximum and a saddle), which we set to . This value is roughly an order of magnitude greater than the mean density of the sub–box containing the studied filament (white squares in Fig. 1), which prevent us of picking up less significant structures from the density noise.
4 Results
4.1 General evolution
The global evolution of our box is described as follows.222A movie of the evolution of the simulation can be seen in the online material. As commented previously, we started with a 13.5 pc size box with constant density field at 100 cm-3, and constant magnetic field parallel to the direction. The initial velocity field fluctuations induce shocks that rapidly dissipate. Since we do not have turbulence forcing, the initial turbulence (with Mach number of 8) dominates only 1/5th of the evolution time. The total evolution of the box is around one free-fall time, equivalent to 3.4 Myr.333Although the free-fall time will be a better reference in order to make scalable the simulation to any regime, in what follows, we will use Myr for a more physical reference, but it should be noticed that since the simulation is isothermal, the time is scalable according to the adopted mean density As soon as most of the turbulent energy is dissipated ( Myr) the turbulent induced filaments start accreting material, producing well–defined filaments which in turn, merge each other to form larger structures by Myr. By Myr ( free-fall times), there are clearly several high column density filaments, and the whole material falls towards the center of the box. At this time, some traces of the boundary conditions (a box) are clearly seen: the collapsed gas exhibits a squared box, with material piling up somehow nearly along the diagonals of the box, due to the gravitational focusing described by Hartmann & Burkert (2007).
In Fig. 1 we show the column density of the central region (of 7.25 pc per side) of our computational box for the three projections of our numerical simulation at Myr (or ), 0.5 Myr after the onset of star formation. Although several filaments are seen in the box, we focused our efforts in a single region (enclosed in white squares in Fig. 1), which exhibits an extended filament in the –projection, but when seen in the other projections, the structure appears to be more complex, with several sub–filaments. This morphology allows us to understand the role of “fibres" compared with the physical structure of the subfilaments.
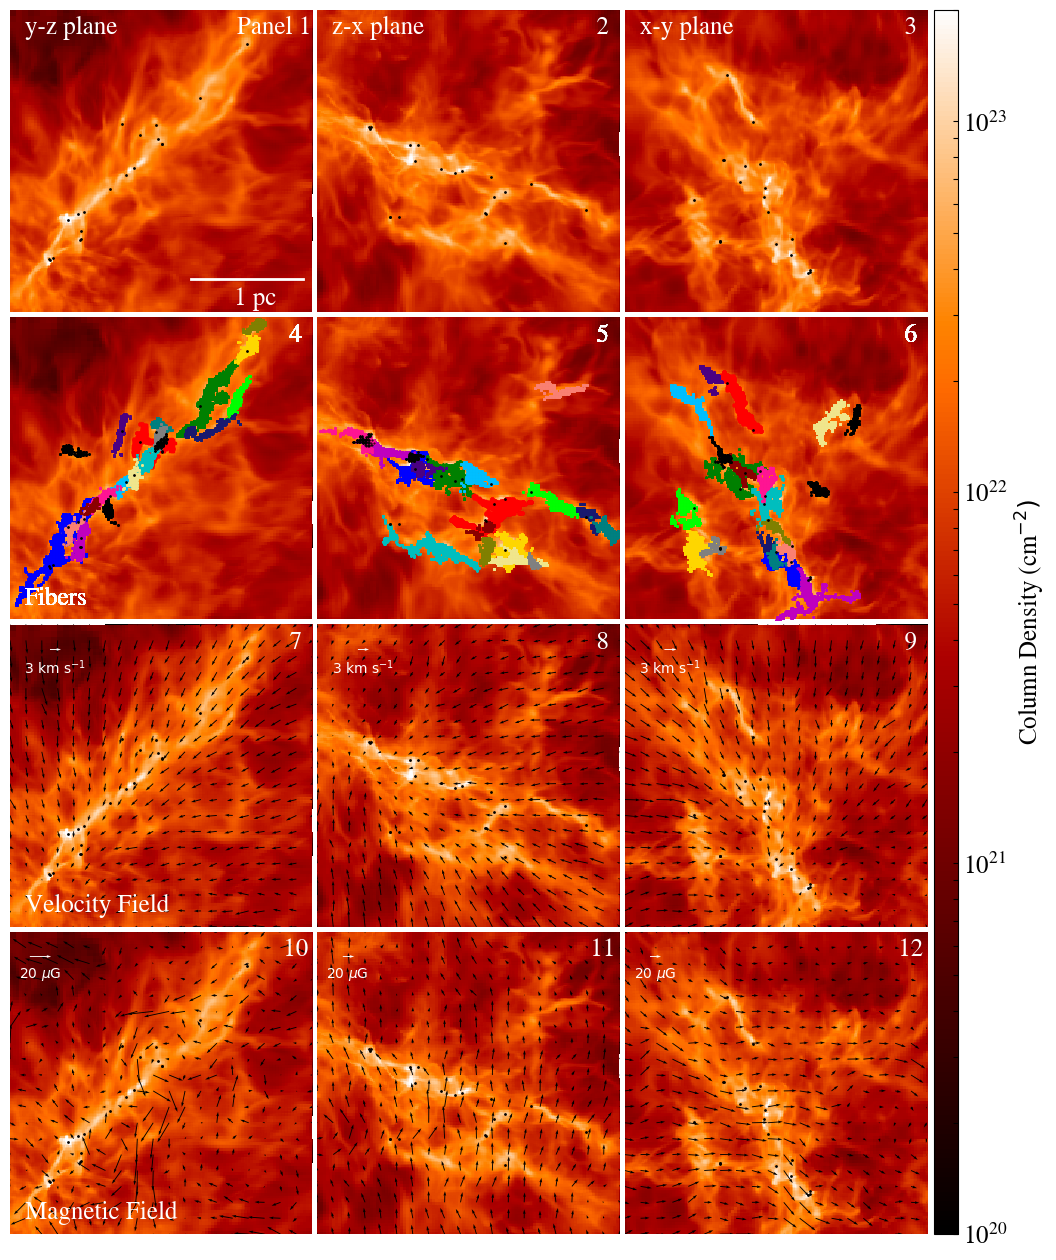
Fig. 2 shows a zoom–in of the region containing the filament. The left, middle and right panels show the , , and projections (in the , and planes, respectively). The upper row is just the column density field, along with the sink particles as black points. The second row shows the fibres found in each projection, as discussed below (§4.2), one color per fibre. The third and four rows show the velocity (panels 7-9) and magnetic (panels 10-12) fields projected in the plane of the corresponding image. In both cases, the projected arrows represent the mean value (volume–weighted) of the vector field along each line of sight. The velocity scale is shown in the upper left corner.
There is a couple of features to note in this figure. As the evolution of the simulation shows, the whole box is collapsing towards the center (see Fig. 1). Thus, although the gas is falling in, it locally does it through the filament, while the filament itself is moving also to the center of the box. In that sense, the filament is not formed by large-scale turbulent streams, but by gravitationally focused flows. Looking at the 3 projections (panels 7, 8 and 9 of Fig. 2), it can be seen that the flows towards the filament, is somehow oblique to it. In the frame of reference moving with the filament, however, it is clear that the gas is falling almost radially into the filament (see §4.3). On the other hand, although the magnetic field is also more or less perpendicular to the filament in the and the planes, in the plane looks substantially more chaotic. This is because the original orientation of the field was along the axis, and as the simulation evolves and the material falls down into the center of the computational domain, it drags the field lines perpendicular to the axis.
4.2 Are fibres real objects?
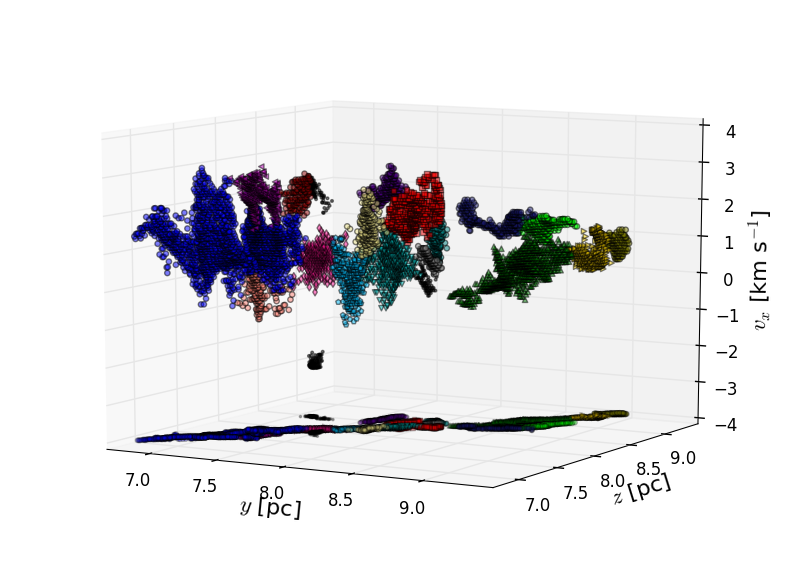
We begin by describing results from a projection along the line–of–sight (LOS; plane; first column in Figure 2). In this projection, the column density exhibits the narrowest filamentary structure. Using our FoFv algorithm, we identify 20 separate velocity-coherent fibres in the left panel of Fig. 3. These fibres are also projected in the column density map of Fig. 2 (Panel 4). The results bear a close qualitative resemblance to the velocity–coherent groups identified in Figure 13 of H13. The velocity range of the observed groups span , comparable to what we find here. Note that in Panels 4–6 of Figure 2 we show the projection of all elements of the fibres, whereas H13 only show the central axis of each fibre in their Fig. 12.
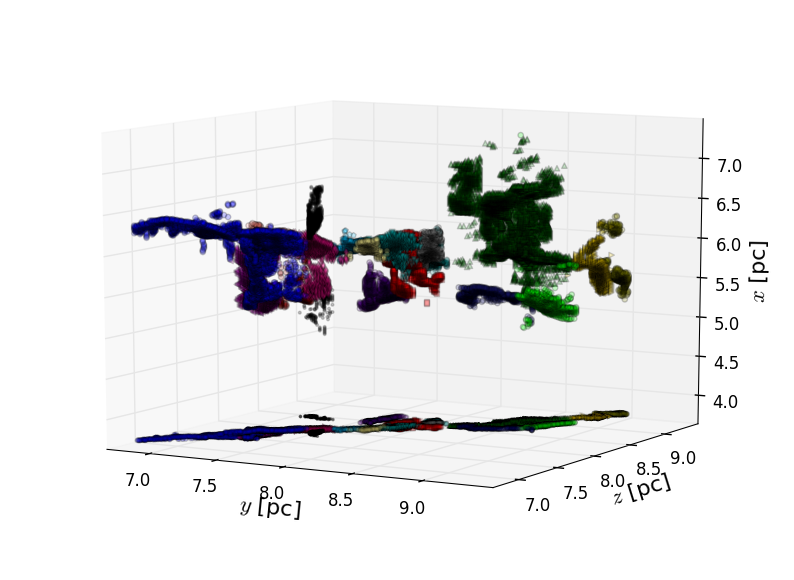
The right-hand panel of Figure 3 identifies the positions of the (color–coded) coherent velocity groups in real (PPP) space. We note that while some of the groups appear to be roughly co-spatial, clearly there are others that are spatially separated but are superposed along the line of sight.
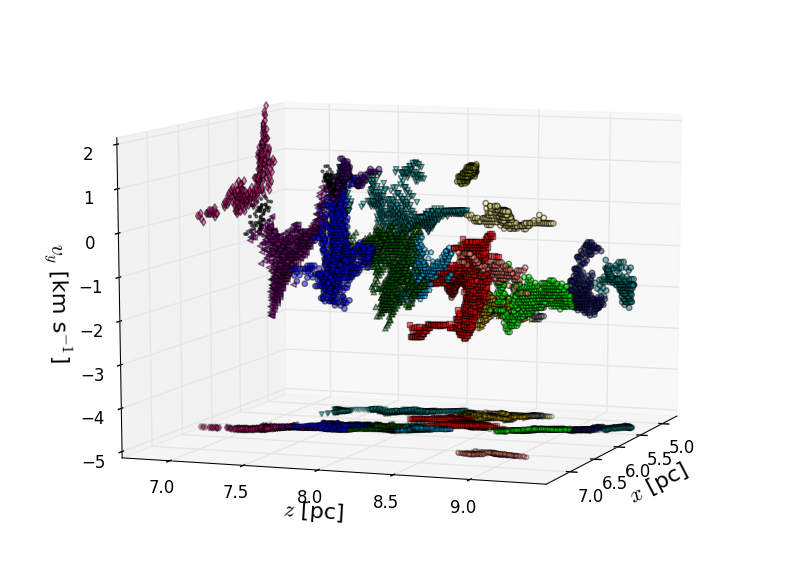
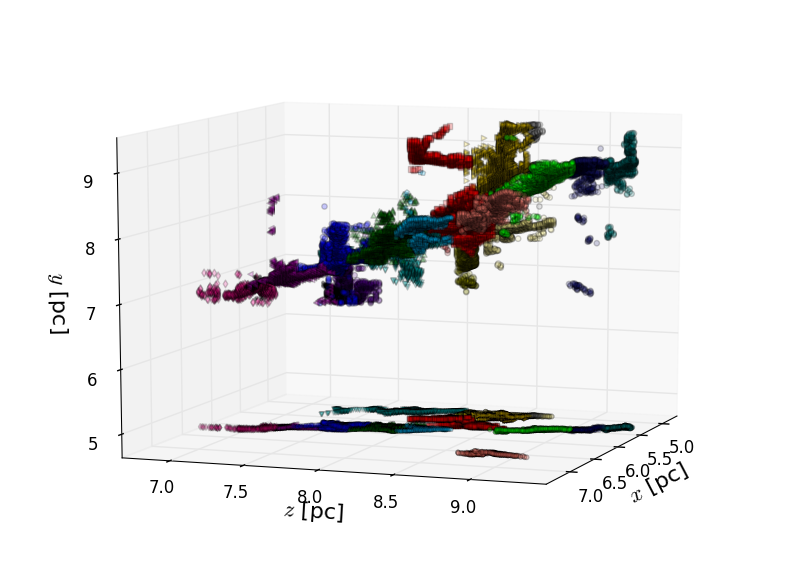
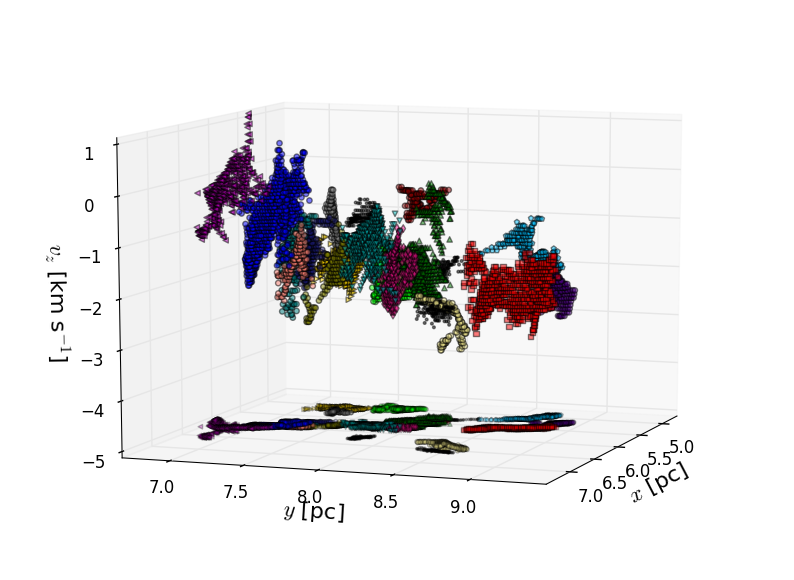
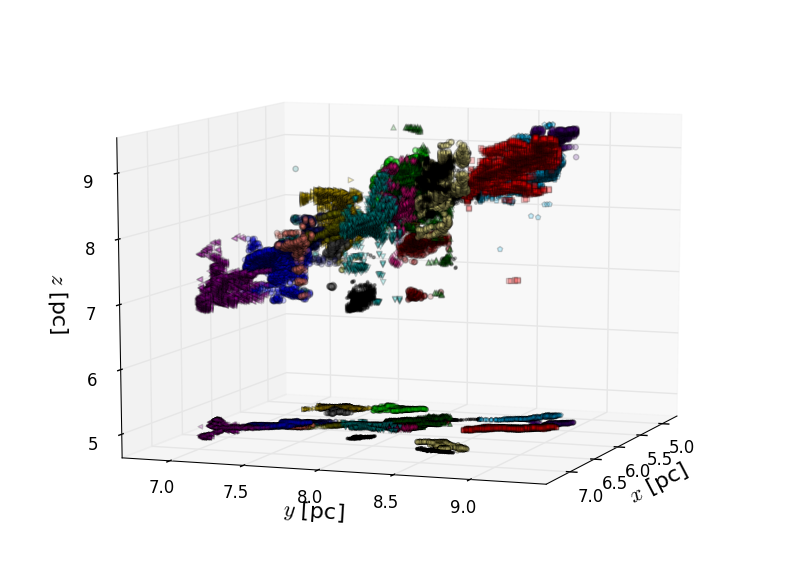
Figures 4 and 5 show the corresponding results for the other two projections (see also their superposition on the column density maps in Panels 5 and 6 of Figure 2). The spatial distinction between the various coherent velocity components is clearer in these projections.
A common feature of the PPV groups is the “sawtooth” structure, with opposing velocity gradients over scales of a few tenths of a pc. Similar sawtooth patterns are also seen in the observations of H13. In several cases we can correlate the positions of the velocity gradients with cores and/or sinks; this suggests that the sawtooth pattern traces gravitational acceleration toward mass concentrations (see, e.g., Kuznetsova et al., 2017).
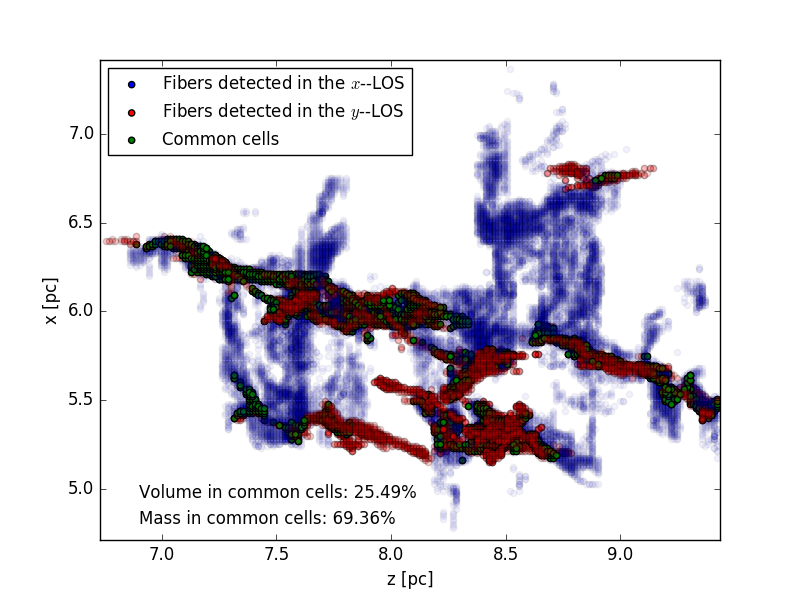
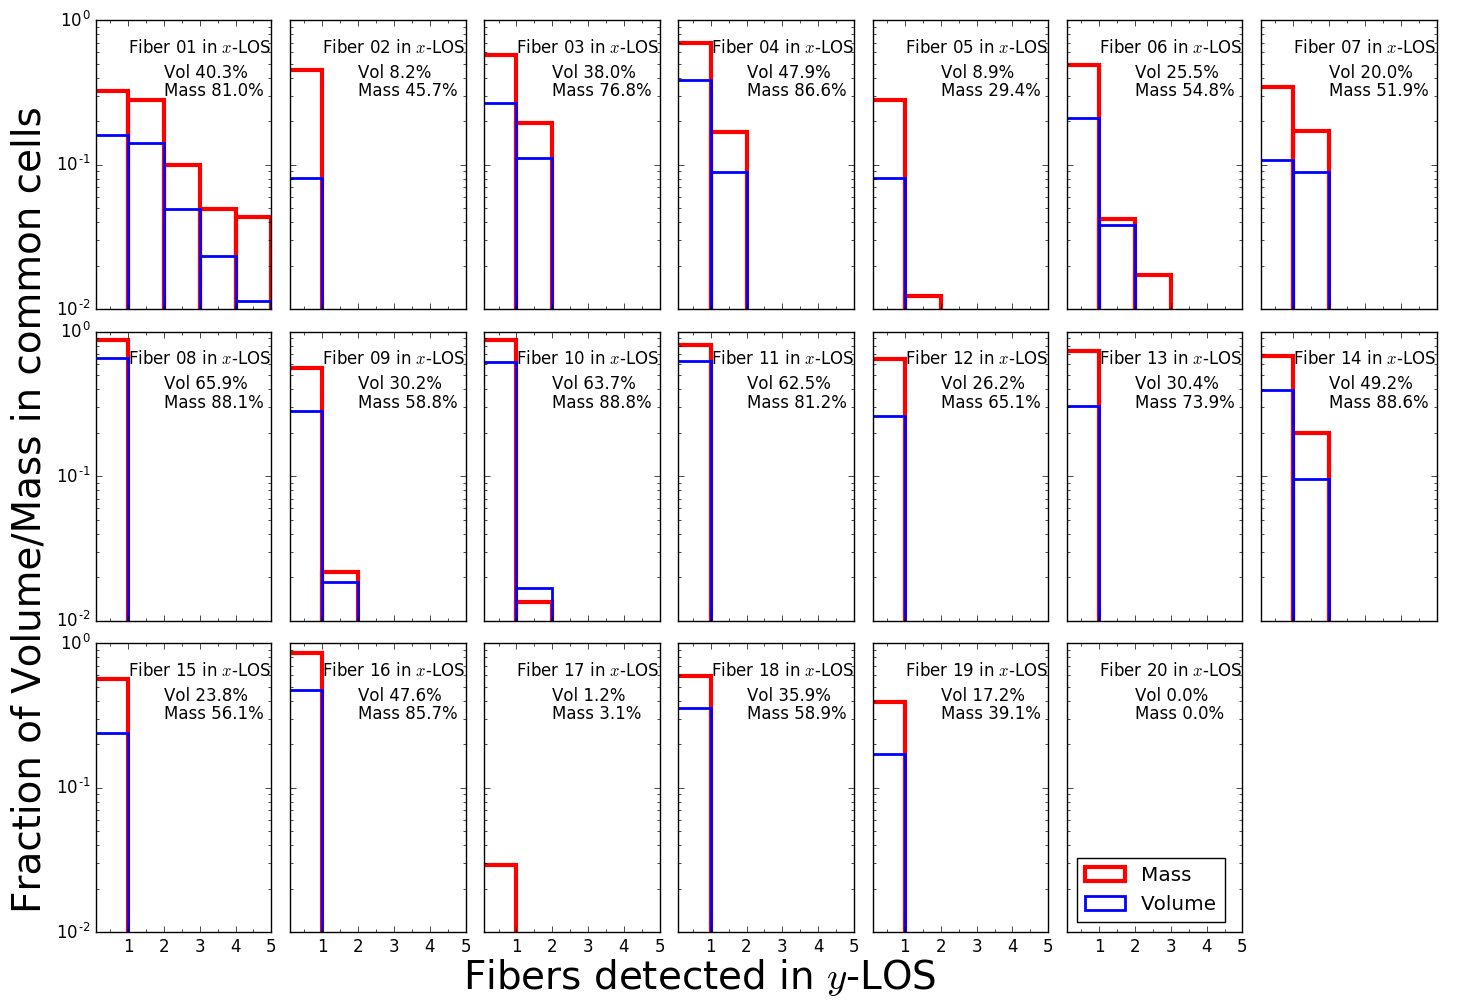
A crucial question is whether the “fibres" are actual coherent three–dimensional objects with subsonic internal velocities. To address this issue, we correlate the pixels or grid cells associated with a fibre in one projection with those of another. The left panel of Figure 6 shows the resulting overlaps (green dots) of fibres found along – and –LOS (blue and red dots, respectively). We find that only 25% of the cell fibres volume are identified in both projections, which contains 69% of the fibres mass. We find similar numbers when comparing fibres in the other projections, which imply that only the densest gas is systematically located in fibres regardless of the LOS.
The right panel of Figure 6 shows the volume and mass fraction (blue and red bars, respectively) that one fibre in the –LOS projection shares with other fibres identified in the –LOS. Thus, bars in a given histogram means that this fibre found in the projection shares material with fibres in the projection.
From this figure, we notice that not all the volume (mass) that generate a fibre in one LOS necessarily participate in the formation of a fibre in another LOS. In fact, most of the fibres share a small fraction of volume with only one or two other fibres found in the other LOS. Furthermore, it is interesting to note that the mass fractions are a bit larger than the volume fractions, since the overlapping regions are the densest parts of the filament. It should be noticed, never the less, that in none of the cases all the volume (mass) of one fibre goes completely into a single other fiber in another projection.
Finally, we notice also that there are few fibres with few common pixels or no counterpart in different LOS (e.g., fibres 17 and 20 in the right panel of Fig. 6). These results suggest that great caution should be applied assessing the reality of “coherent–velocity” structures, i.e., fibers seem not to be single 3D objects.
4.3 The skeleton as a real 3D structure; kinematics of the filaments
Another approach to understand the nature of the filaments is to analyse their actual 3D data. Although this is not possible in observations, it turns out to be quite instructive in the simulations.
The left panel of Figure 7 shows the segments or “subfilaments" found by DisPerSE in our data, and the velocity field vectors, computed now in the frame of reference of the filament, at the position of the skeleton. In the right panel of Figure 7 we furthermore compute the histogram of the angles between the velocity field in the frame of reference of the filament, and the local direction of the skeleton.
Two features arise naturally: first of all, the skeleton (in projection) occupy nearly the same loci of the “fibres" (see panel 4 of Figure 3). Second, as commented in the previous section, in the frame of reference of the filament, the velocity vectors show a tendency to be perpendicular to the filament.
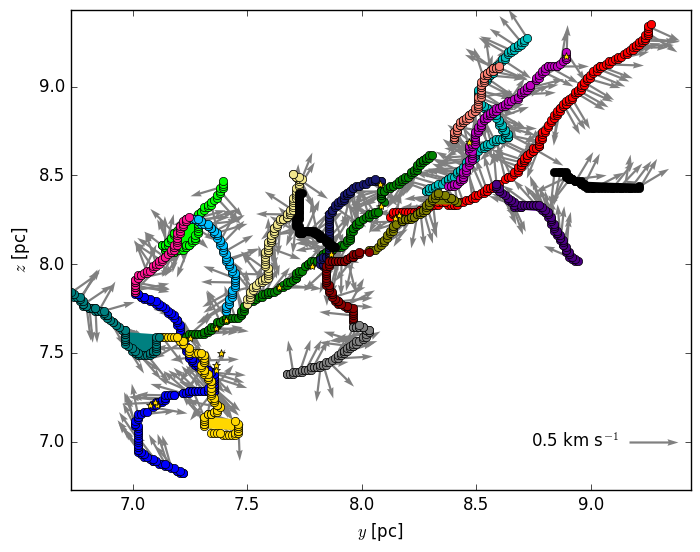
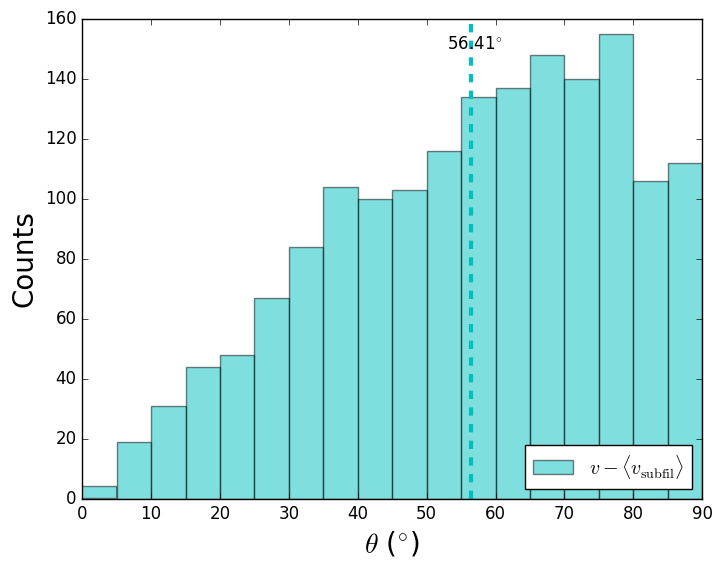
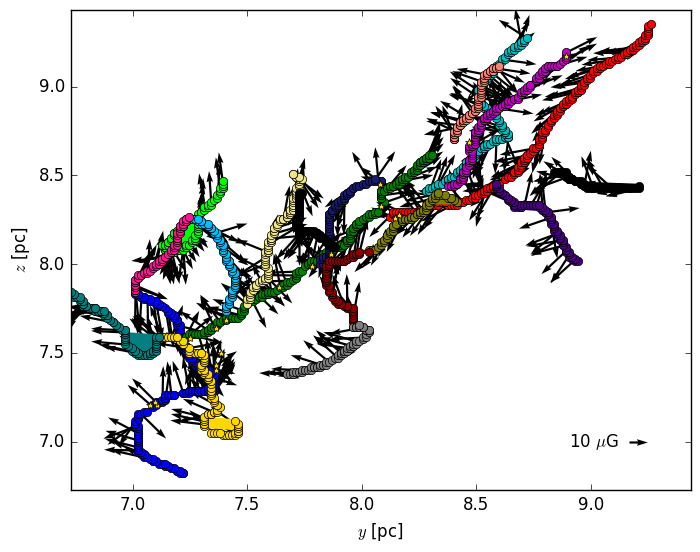
Looking at this figure one may conclude, at first glance, that each subfilament is moving almost perpendicularly to its main axis, and thus, that they should be the result of large-scale turbulent shock fronts. However, as shown in Figure 2 (see also the online material), this is not the case: the filament is falling as a single entity towards the center of the box. Thus, what the velocity arrows in Figures 2 and 7 are showing us is that, in the frame of reference of the filament, the gas is falling into it, almost perpendicularly, while the whole filament falls into the gravitational potential well.
The filament orientation is the result of the boundary conditions: it reflects the overall non-spherical initial geometry of the cloud (e.g., Kuznetsova et al., 2015), such that the density field suffers from gravitational focusing at the corners of the box. As a result of the interplay between the initial turbulence and the geometry, filaments along the diagonals of the box are formed rapidly. In our case, this effect allows the formation of a filament along the large dimension (the diagonal of our cube). At the same time, as it is formed, the filament falls down into the global gravitational potential well at the center of the box. In this process, the filament is constructed or fed from the large scales, mostly perpendicularly, due to self-gravity, while it falls down into the global potential well.
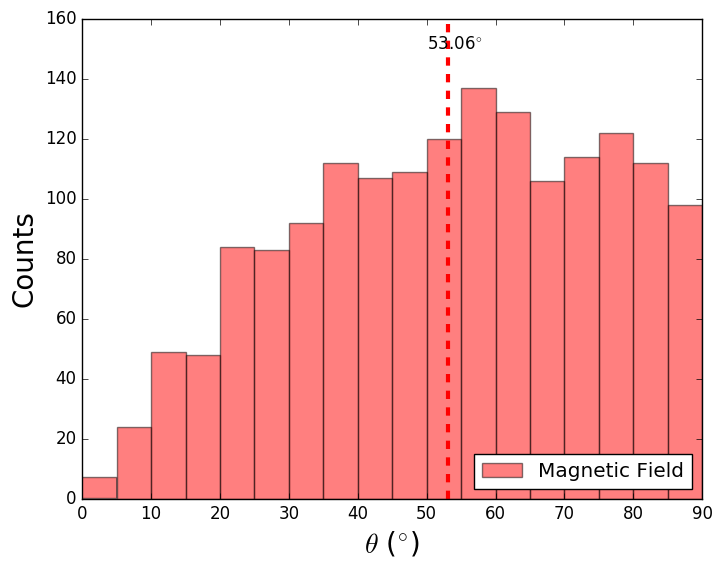
We have also computed the orientations between the magnetic field and the skeleton. In Fig. 8 we show the skeleton but now with the magnetic field vectors, and the corresponding vector–skeleton histogram. In this case, the magnetic field looks slightly less aligned preferentially with the subfilaments, with a wider histogram and a less pronounced peak than the velocity histogram.
Analysing the velocity field along the skeleton, in the local frame of reference, is instructive too. To do so, we have plotted, in Figure 9, from top to bottom panels, the density profile, the velocity field profile component parallel to the skeleton, and the divergence, , of the velocity field along the skeletons of 3 subfilaments found with DisPerSE. The colors of the plots also denote the subfilament in Figure 7 (left panel): the green, the magenta, and the red subfilaments. The first interesting feature to notice is that the divergence of the velocity field along the skeletons is predominantly negative, implying that the skeletons exhibit converging motions towards them as a fundamental characteristic. The negative divergence indicates that the subfilaments are accreting mass from their surroundings.


Another interesting feature of Fig. 9 is that at the positions of the sinks (denoted by vertical solid black lines), the divergence of the velocity field is more strongly negative due to the sink gravity, and the filament itself has a local minimum of the density because the mass has been accreted by sink particles. Finally, the third interesting feature is that the local density maximums do not correlate with sharp shocks in , implying that, along the filaments, local excesses of density are produced mainly by accretion perpendicular to the filament, not by shocks inside and along the filament itself.
5 Discussion
We have shown that simulations of clouds with turbulent–decaying substructure and with evolution driven by gravity, naturally produces both filaments and subfilaments which, when seen along certain lines of sight, resemble the velocity–coherent fibres of H13 and Tafalla & Hacar (2015). Most of these sub-filaments are distinct objects in space where gas has been compressed and/or shocked. The subfilaments arise independently of the main filament, unlike the fray–and–fragment scenario and may exhibit a spoke–like structure as they accelerated toward the filament, especially if there are mass concentrations present (i.e., cores and sinks).
5.1 Comparision with previous works
The previous work closest to ours is that of Smith et al. (2016), who considered turbulent cloud evolution without magnetic fields. We find that the overall morphology is not strongly affected by the inclusion of a modest magnetic field, although the main filament that results is somewhat more linear.
Smith et al. (2016) analysed their results in a qualitatively different manner than in this paper. They applied the DisPerSE algorithm to identify (sub)filaments in volume density space, and then considered the velocity fields of these structures, decomposing the three-dimensional velocity field into flows along and perpendicular to the filament. While they show that there are multiple velocity components along certain lines of sight through the filament region, they do not make the identification of their sub-filaments in PPV space and so the results are not directly comparable to those of H13 (e.g., their Figure 11). We also differ somewhat in our interpretation of the simulations; while Smith et al. talk about collecting sub-filaments due to “large-scale, low-wavenumber modes and gravitational collapse”, we would interpret the motions as predominantly driven by gravitational acceleration an indication of which is the spoke structure seen around “hubs” of mass concentration (cores and sinks).
Clarke et al. (2017), on the other hand, investigated the effects of turbulent velocity fields on a filament. While they found that supersonic turbulence could create elongated structures within the filament, suggestive of the fray and fragment scenario for producing fibres, the initial setup - a cylindrical computational volume of radius 1 pc and length 3 pc, with a centrally peaked initial density distribution and radial inflow - precludes any investigation of fibre production on larger scales independently of or concurrently with filament formation, as we do here. Moreover, the negative divergences shown in Figure 9 indicates that the inflow is not smooth, but structured, which can also affect the development of fragmentation.
We emphasize that some of the “coherent” velocity structures found along one projection are not found to be such in other projections. Thus, few fibres may simply be projection effects enhanced by the complex velocity field. H13 made a distinction between “fertile” (i.e., core-forming) and “sterile” fibres. Our simulations and analysis suggest that some of the sterile fibres might simply be projection effects of structures that are not really coherent in three dimensions. The “fertile” fibres may simply be those which are the densest or have the most mass - which, as we have shown are more likely to be coherent structures in space.
6 Conclusions
We have analysed a numerical simulation of a self-gravitating molecular cloud including sink formation and magnetic fields to attempt to explain the nature and origin of apparent velocity–coherent structures - called fibres - in observations of star-forming filaments by Hacar et al. (2013). We use similar fibre–finding algorithms to identify these structures in three different PPV projections. While we find that fibres identified in this way are ubiquitous, we also show that some fraction of these objects are not coherent physical structures, as shown by our finding that what are identified as fibres in one projection are not the same as in the other projections. Only the densest structures maintain their coherence in space. Overlapping of distinct physical structures seen in projection accounts for the appearance of multiple velocity components in the same region of the main filament.
In our simulation, there is global gravitational collapse because the cloud, especially once the input turbulence decays, is subvirial. The effect of the initial turbulence is mostly to produce density concentrations which result in a complex velocity field due to gravitational acceleration. Filaments (and subfilaments) form by accretion/infall from the surrounding medium, driven by gravity, not by turbulence. Seeded by the turbulent fluctuations, filaments, cores, and sinks form, producing structures – in some cases physically coherent, in others simply the result of projection of independent regions – which, when observed in PPV space, can be interpreted as “fibres” in the sense of H13.
Analysing 3D structures obtained with DisPerSE, we also find that the skeleton is mainly accreting material radially from its surroundings, hierarchically collapsing and forming stars, and falling globally into the gravitational potential well of the simulation, at the same time. The accretion of material is along the magnetic field lines, which are oriented preferentially perpendicular to the skeleton (with a mean angle of 53 degrees), and are being bent and dragged by the velocity field.
Finally, our work has implications for the “fray and fragment" scenario. Velocity–coherent structures naturally appear in our hierarchically and chaotically collapsing simulation, in which the “seeds" giving rise to the fibres were formed some distance away from the main filament by turbulence, and then concentrate spatially mainly by gravity to form the coherent filament (see also Smith et al., 2016; Moeckel & Burkert, 2015). This is the opposite process envisaged in the fray and fragment scenario; thus the presence of velocity–coherent structures does not necessarily demonstrate that the “fray and fragment" scenario is operating.
7 Acknowledgments
We thank the anonymous referee for a helpful and constructive report that improved the clarity of this paper. We thankfully acknowledge Mario Tafalla for stimulating discussions. J.B.P. acknowledges UNAM-PAPIIT grant number IN110816, and to UNAM’s DGAPA-PASPA Sabbatical program. He also is indebted to the Alexander von Humboldt Stiftung for its valuable support. The research of LH was supported in part by NASA grant NNX16AB46G. MZA acknowledges CONACyT for a postdoctoral fellowship at University of Michigan. We acknowledge Christopher Davies, Gilberto Zavala Pérez, Alfonso H. Ginori González, and Miguel Espejel Cruz for their important computational support. The numerical simulation presented here was performed at Mouruka cluster at Instituto de Radioastronomía y Astrofísica (Universidad Nacional Autónoma México), acquired through the CONACYT grant INFR-2015-01-252629 to JBP. The visualization was carried out with the yt software (Turk et al., 2011). The FLASH code used in this work was in part developed by the DOE NNSA-ASC OASCR Flash center at the University of Chicago. This research has made use of NASA’s Astrophysics Data System Abstract Service.
References
- André et al. (2010) André P., et al., 2010, A& A, 518, L102
- Arzoumanian et al. (2011) Arzoumanian D., et al., 2011, A& A, 529, L6
- Ballesteros-Paredes & Mac Low (2002) Ballesteros-Paredes J., Mac Low M.-M., 2002, ApJ, 570, 734
- Ballesteros-Paredes et al. (2015) Ballesteros-Paredes J., Hartmann L. W., Pérez-Goytia N., Kuznetsova A., 2015, MNRAS, 452, 566
- Clarke et al. (2017) Clarke S. D., Whitworth A. P., Duarte-Cabral A., Hubber D. A., 2017, MNRAS, 468, 2489
- Crutcher et al. (2010) Crutcher R. M., Wandelt B., Heiles C., Falgarone E., Troland T. H., 2010, ApJ, 725, 466
- Federrath et al. (2010) Federrath C., Banerjee R., Clark P. C., Klessen R. S., 2010, ApJ, 713, 269
- Fischera & Martin (2012) Fischera J., Martin P. G., 2012, A& A, 542, A77
- Fryxell et al. (2000) Fryxell B., et al., 2000, ApJS, 131, 273
- Gammie et al. (2003) Gammie C. F., Lin Y.-T., Stone J. M., Ostriker E. C., 2003, ApJ, 592, 203
- Gómez & Vázquez-Semadeni (2014) Gómez G. C., Vázquez-Semadeni E., 2014, ApJ, 791, 124
- Hacar & Tafalla (2011) Hacar A., Tafalla M., 2011, A& A, 533, A34
- Hacar et al. (2013) Hacar A., Tafalla M., Kauffmann J., Kovács A., 2013, A& A, 554, A55
- Hartmann (2002) Hartmann L., 2002, ApJ, 578, 914
- Hartmann & Burkert (2007) Hartmann L., Burkert A., 2007, ApJ, 654, 988
- Heitsch (2013) Heitsch F., 2013, ApJ, 776, 62
- Hennebelle (2003) Hennebelle P., 2003, A& A, 397, 381
- Hennebelle (2013) Hennebelle P., 2013, A& A, 556, A153
- Huchra & Geller (1982) Huchra J. P., Geller M. J., 1982, ApJ, 257, 423
- Jappsen et al. (2005) Jappsen A.-K., Klessen R. S., Larson R. B., Li Y., Mac Low M.-M., 2005, A& A, 435, 611
- Juárez et al. (2017) Juárez C., et al., 2017, preprint, (arXiv:1706.03534)
- Kuznetsova et al. (2015) Kuznetsova A., Hartmann L., Ballesteros-Paredes J., 2015, ApJ, 815, 27
- Kuznetsova et al. (2017) Kuznetsova A., Hartmann L., Burkert A., 2017, ApJ, 836, 190
- Larson (1985) Larson R. B., 1985, MNRAS, 214, 379
- Larson (2005) Larson R. B., 2005, MNRAS, 359, 211
- Men’shchikov et al. (2010) Men’shchikov A., et al., 2010, A& A, 518, L103
- Moeckel & Burkert (2015) Moeckel N., Burkert A., 2015, ApJ, 807, 67
- Nakano & Nakamura (1978) Nakano T., Nakamura T., 1978, PASJ, 30, 671
- Nutter et al. (2008) Nutter D., Kirk J. M., Stamatellos D., Ward-Thompson D., 2008, MNRAS, 384, 755
- Schneider & Elmegreen (1979) Schneider S., Elmegreen B. G., 1979, ApJS, 41, 87
- Seifried & Walch (2015) Seifried D., Walch S., 2015, MNRAS, 452, 2410
- Smith et al. (2014) Smith R. J., Glover S. C. O., Klessen R. S., 2014, MNRAS, 445, 2900
- Smith et al. (2016) Smith R. J., Glover S. C. O., Klessen R. S., Fuller G. A., 2016, MNRAS, 455, 3640
- Sousbie (2011) Sousbie T., 2011, MNRAS, 414, 350
- Sousbie et al. (2011) Sousbie T., Pichon C., Kawahara H., 2011, MNRAS, 414, 384
- Stone et al. (1998) Stone J. M., Ostriker E. C., Gammie C. F., 1998, ApJL, 508, L99
- Tafalla & Hacar (2015) Tafalla M., Hacar A., 2015, A& A, 574, A104
- Tilley & Pudritz (2003) Tilley D. A., Pudritz R. E., 2003, ApJ, 593, 426
- Truelove et al. (1997) Truelove J. K., Klein R. I., McKee C. F., Holliman II J. H., Howell L. H., Greenough J. A., 1997, ApJL, 489, L179
- Turk et al. (2011) Turk M. J., Smith B. D., Oishi J. S., Skory S., Skillman S. W., Abel T., Norman M. L., 2011, The Astrophysical Journal Supplement Series, 192, 9
- Waagan et al. (2011) Waagan K., Federrath C., Klingenberg C., 2011, Journal of Computational Physics, 230, 3331