and Nikhef Theory Group Science Park 105, 1098 XG Amsterdam, The Netherlands
The photon PDF from high-mass Drell-Yan data at the LHC
Abstract
I present a determination of the photon PDF from a fit to the recent ATLAS measurements of high-mass Drell-Yan lepton-pair production at TeV. This analysis is based on the xFitter framework interfaced to the APFEL program, that accounts for NLO QED effects, and to the aMCfast code to account for the photon-initiated contributions within MadGraph5_aMC@NLO. The result is compared with other recent determinations of the photon PDF finding a general good agreement. This contribution is based on the results presented in Ref. [1].
keywords:
Photon PDF, NLO electroweak corrections, Drell-Yan data.PHOTON’17 Conference Proceedings, CERN 22 - 27 May 2017, to appear on CERN Report
1 Introduction and motivation
In order to achieve accurate predictions for the LHC phenomenology, QCD corrections, where NNLO is becoming the standard, have to be supplemented with electroweak (EW) effects. One of the direct consequences of these corrections is the introduction of the photon PDF.
An number of determinations of the photon PDF based on a variety of different approaches has been achieved in the past [19, 3, 4, 5, 6, 7, 8]. The aim of this particular work is to obtain a model-independent determination of the photon PDF exploiting the recent high-mass Drell-Yan measurements at TeV from ATLAS [9], that have proven to provide a significant constraint on this distribution.
The constraining power of the Drell-Yan process on the photon PDF can be easily understood in terms of Feynman diagrams. Indeed, in the presence of EW corrections, the partonic channel contributes to the leading order (LO) cross section for lepton-pair production in scattering.
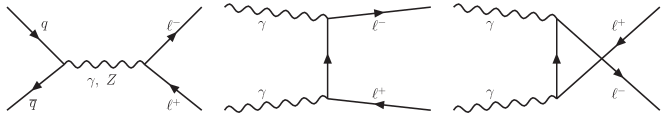
This is illustrated in Fig. 1 where the LO diagrams contributing to this process are shown.
The high invariant-mass distribution of the lepton pair is particularly relevant because this observable is such that the contribution, despite the relatively small size of the photon PDF, becomes comparable to that induced by the channel.
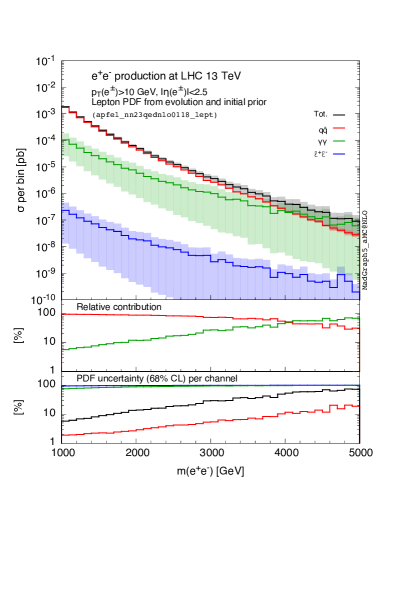
As an illustration, the LO prediction for the lepton-pair invariant mass distribution in production at the 13 TeV LHC is shown in Fig. 2 [14]. This plot indicates that the channel becomes increasingly important at large values of the invariant mass and eventually dominates the distribution. Based on simple kinematic considerations, one can show that the high invariant-mass distribution in lepton-pair production probes the photon PDF at relatively large values of Bjorken-, indicatively .
This observation constitutes a compelling motivation to exploit the precise experimental data produced by the LHC, such as the recent ATLAS data at 8 TeV published in Ref. [9], to constrain the photon PDF in this region.
A crucial aspect of this analysis is the consistent inclusion of the relevant EW corrections. As it was shown in Ref. [15], the Drell-Yan process receives sizeable pure weak corrections that almost balance the corrections induced by the photon-initiated channels. Therefore, the inclusion of the NLO EW corrections to the computation of the Drell-Yan cross sections is extremely important to achieve a reliable determination of the photon PDF.
This study was carried out within the open-source xFitter framework [10] that provides a unique environment to extract PDFs from experimental data.
2 The dataset
As mentioned above, our determination of the photon PDF relies on the recent ATLAS 8 TeV high-mass Drell-Yan data [9]. Measurements are delivered in three different formats:
-
1.
as single-differential cross-section distributions in the lepton-pair invariant mass ,
-
2.
as double-differential cross-section distributions in and the rapidity of the lepton pair ,
-
3.
and as double-differential cross-section distributions in and the difference in pseudo-rapidity between the two leptons .
In our analysis we have chosen to use the second format that counts 48 data points distributed in 5 bins: [116-150], [150-200], [200-300], [300-500], [500-1500] GeV. The first three (last two) bins are divided into 12 (6) bins in extending up to 2.4. The relevant analysis cuts on the data are: GeV, , and GeV (30) GeV for the leading (sub-leading) lepton.
The ATLAS data alone would clearly be insufficient to carry out an analysis aimed at the extraction of a reliable set of PDFs. Therefore, this data is supplemented by the combined inclusive deep-inelastic scattering (DIS) cross-section data from HERA [16], on which we imposed the cut GeV2. While the ATLAS data is directly sensitive to the photon PDF, the HERA data carries detailed information on the quark and gluon content of the proton. The union of these two datasets allows us to perform a solid determination of a the proton PDFs.
3 Electroweak corrections
A central aspect of this analysis is the inclusion of the EW effects. More in particular, we employed predictions accurate to NNLO in QCD and consistently included NLO EW/QED corrections. In the present analysis, this concerns three main sectors which I discuss in turn: the QED corrections to the evolution of PDFs, the QED corrections to the DIS structure functions, and the full EW corrections to the Drell-Yan cross sections.
3.1 Evolution
The evolution of PDFs is governed by the DGLAP equations. The DGLAP splitting functions are known up to , NNLO in QCD, since long [17, 18]. The QED corrections are instead much more recent. The corrections, where is the QED coupling, were derived in Ref. [19], while the and , which represent the NLO QED corrections, where computed in Refs. [20, 21].
The implementation of the full NLO QED corrections to the DGLAP evolution was achieved very recently in the APFEL program [11] following the approach of Ref. [14] and documented in Ref. [1]. A cross-check of the implementation was performed using the independent QEDEVOL code [12] based on the QCDNUM evolution program [13].
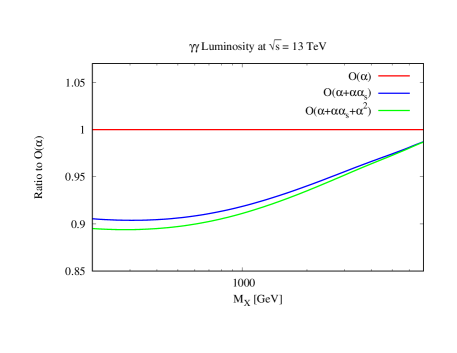
The effect of the NLO QED corrections on the luminosity, relevant to the computation of the Drell-Yan invariant mass distribution, is shown in Fig. 3 as a function of the final state invariant mass . The photon PDF taken from the NNPDF3.0QED set is evolved including in the DGLAP equation the , the , and the complete corrections. Results are shown as ratios to the curve. While the effect of the is very mild, the impact of the at relatively small values of can be as big as 10%. This reduces to around 3-5% at large invariant masses: this is the region of relevance in our study. This is still a significant effect due to the experimental uncertainty of the ATLAS data and thus it is important to take it into account.
In principle, the NLO QED corrections influence also the running of the QCD coupling and the QED coupling . In fact, they introduce additional mixing terms in the respective -functions that couple the evolution of the two couplings. However, it turns out that the impact of the mixing terms is tiny on both couplings and thus we decided not to included them as this would uselessly complicated the implementation.
3.2 DIS structure functions
When considering NLO QED corrections to the DIS structure functions, it is necessary to include into the hard cross sections all the diagrams. The coefficient functions of these diagrams, being of purely QED origin, can be easily derived from the QCD expressions by properly adjusting the colour factors. This correspondence holds irrespective of whether mass effects are included. This allowed for an easy implementation of the QED corrections to the FONLL general-mass scheme [22]. Specifically, in this work we have used the variant C of the FONLL scheme, accurate to NNLO in QCD, supplemented by the NLO QED corrections.
An intereresting feature of the NLO QED corrections to the DIS structure function is that they introduce photon-initiated diagrams providing a direct handle on the photon PDF.
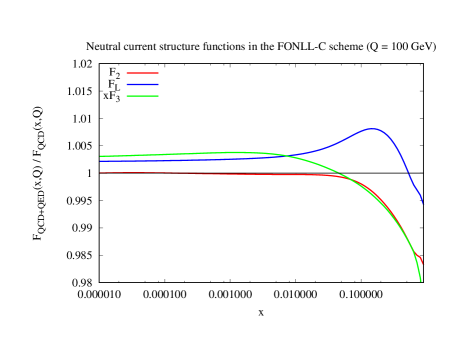
Fig. 4 displays the effect of the NLO QED corrections on the neutral-current structure functions , , and . The predictions have been obtained including the NLO QED corrections also to the DGLAP evolution and are shown normalised to the pure QCD results. The impact of the NLO QED corrections is very moderate especially at low but becomes more significant at large , where it is of the order of 2%. The same behaviour is observed also for the charged-current structure functions
Although the net effect of the NLO QED corrections on the DIS structure functions is small, it is significant when compared to the typical size of the uncertainties of the HERA combined data. This implies that the DIS data, despite very moderately, contributes to constrain the photon PDF in the large- region.
3.3 Drell-Yan cross sections
For the calculation of the Drell-Yan cross sections at NLO in QCD, we have used the MadGraph5_aMC@NLO [23] program interfaced to APPLgrid [24] through aMCfast [25]. The computation also includes the contribution from the photon-initiated diagrams shown in Fig. 1. Finite mass effects of charm and bottom quarks in the matrix elements are neglected, as appropriate for a high-scale process.
The NLO calculations are supplemented by -factors obtained with the FEWZ code [26] to account for the NNLO QCD and the NLO EW corrections. The -factors are defined as:
| (1) |
and computed using the MMHT2014 NNLO [27] PDF set both in the numerator and in the denominator.
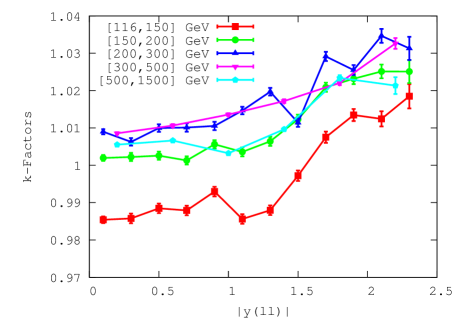
Fig. 5 shows the -factors of Eq. (1) as a function of the lepton-pair rapidity for each bin. The points correspond to the kinematics of double-differential distributions in of the ATLAS high-mass Drell-Yan data included in our analysis.
The -factors vary between 0.98 and 1.04, indicating that higher-order corrections are generally moderate. The trend follows the expectation: the -factors are particularly small at low invariant masses and in the central region, and tend to grow at larger values of and in the forward region where they can be as large ar 4%.
4 Fit settings
Our determination of the photon PDF, along with quark and gluon PDFs, was carried out in the xFitter framework interfaced to the APFEL code. The dataset included in our fit was discussed in Sect. 2 and the theory setup presented in Sect. 3. In this section we discuss the fit settings.
We parametrise the following six independent distributions at the initial scale :
| (2) |
The parameters and are set equal so that the quark sea distributions have the same small- behaviour. Moreover, we assume , with [28], and , such that for .
The numerical values of the heavy-quark masses are taken to be GeV and GeV. The reference values of the QCD and QED couplings are chosen to be and . As for the initial scale, we choose GeV such that it is below the scale of all data points included in our fit. This particular value of the initial scale is peculiar as compared to the typical choice GeV. The reason for choosing a somewhat larger scale is that it helps stabilise the photon PDF. However, in order to still be able to generate the charm PDFs perturbatively without the need to parameterise them, we exploited one of the functionalities of APFEL to set charm threshold [29].
5 Results
| Dataset | / |
|---|---|
| HERA combined DIS data | 1236/1056 |
| ATLAS DY data [116 GeV 150 GeV] | 9/12 |
| ATLAS DY data [150 GeV 200 GeV] | 15/12 |
| ATLAS DY data [200 GeV 300 GeV] | 14/12 |
| ATLAS DY data [300 GeV 500 GeV] | 5/6 |
| ATLAS DY data [500 GeV 1500 GeV] | 4/6 |
| Total ATLAS DY data | 48/48 |
| Combined HERA I+II and high-mass DY | 1284/1083 |
I finally turn to discuss the results of our fit. The partial ’s normalised to the number of data points for the HERA combined data and for the ATLAS high-mass Drell-yan data (bin by bin in and total), as well as the total normalised to the number of degrees of freedom, are reported in Tab. 1.
The overall fit quality is acceptably good. On the one hand, the description of the HERA data is comparable to that achieved in the HERAPDF2.0 analysis [16]. On the other hand, despite the small experimental uncertainties, the ATLAS Drell-Yan data is perfectly fitted with a equal to . Remarkably, the single bins of this dataset have all a good .
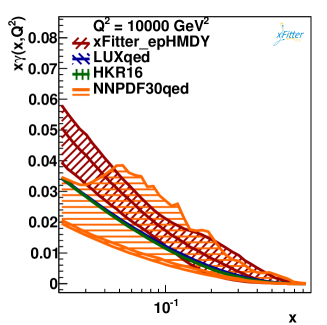
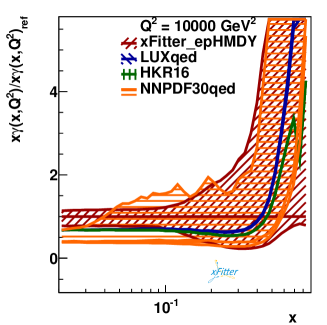
The photon PDF at GeV2 obtained from our analysis, that we dubbed xFitter_epHMDY, is shown in Fig. 6 and compared to the LUXqed [7], the HKR16 [8], and the NNPDF3.0QED [5] results. The absolute distributions are shown in the lef plot, while they are displayed as ratios to the central value of xFitter_epHMDY in the right plot. The uncertainty bands represent the 68% confidence level for all distributions but for HKR16 for which only the central value is made available by the authors. The -range shown Fig. 6 is limited to the region where the ATLAS Drell-Yan data are expected to constrain the photon PDF.
Fig. 6 shows that for the four determinations are consistent within PDF uncertainties. For smaller values of , the photon PDFs from LUXqed and HKR16 are lower than xFitter_epHMDY but the agreement remains at the 2- level. A better agreement with the NNPDF3.0QED photon PDF is observed all over the considered range also due to the larger uncertainties. Interestingly, Fig. 6 also shows that for the present analysis exhibits smaller PDF uncertainties as compared to those of NNPDF3.0QED. We conclude that this is the effect of the constraining power of the ATLAS Drell-Yan data used in this analysis but not in NNPDF3.0QED. We also observe that this dataset has very little impact of the other PDFs.
Finally, in order to assess the robustness of our fit, we have performed a number of variations with respect to the default settings. Specifically, we considered variations of: the values of the input physical parameters, such as , the heavy-quark masses and , and the strangeness fraction ; the PDF parametrisation and the input scale ; the cut on the scale of the data included in the fit. In all cases, the resulting distributions of a given variation were in agreement, typically well within one standard deviation, with the result obtained with the default settings.
The xFitter_epHMDY presented in this work is available in the LHAPDF6 format [30] upon request from the authors.
Acknowledgements
I would like to heartily thank Ringaile Plačakytė and Voica Radescu for their invaluable contribution to this work and for their outstanding dedication as conveners of the HERAFitter-xFitter project from 2012 until May 2017.
References
- [1] F. Giuli et al. [xFitter Developers’ Team], Eur. Phys. J. C 77 (2017) no.6, 400 doi:10.1140/epjc/s10052-017-4931-5 [arXiv:1701.08553 [hep-ph]].
- [2] A. D. Martin, R. G. Roberts, W. J. Stirling and R. S. Thorne, Eur. Phys. J. C 39 (2005) 155 doi:10.1140/epjc/s2004-02088-7 [hep-ph/0411040].
- [3] R. D. Ball et al. [NNPDF Collaboration], Nucl. Phys. B 877 (2013) 290 doi:10.1016/j.nuclphysb.2013.10.010 [arXiv:1308.0598 [hep-ph]].
- [4] C. Schmidt, J. Pumplin, D. Stump and C. P. Yuan, Phys. Rev. D 93 (2016) no.11, 114015 doi:10.1103/PhysRevD.93.114015 [arXiv:1509.02905 [hep-ph]].
- [5] V. Bertone and S. Carrazza, PoS DIS 2016 (2016) 031 [arXiv:1606.07130 [hep-ph]].
- [6] R. D. Ball et al. [NNPDF Collaboration], JHEP 1504 (2015) 040 doi:10.1007/JHEP04(2015)040 [arXiv:1410.8849 [hep-ph]].
- [7] A. Manohar, P. Nason, G. P. Salam and G. Zanderighi, Phys. Rev. Lett. 117 (2016) no.24, 242002 doi:10.1103/PhysRevLett.117.242002 [arXiv:1607.04266 [hep-ph]].
- [8] L. A. Harland-Lang, V. A. Khoze and M. G. Ryskin, Phys. Rev. D 94 (2016) no.7, 074008 doi:10.1103/PhysRevD.94.074008 [arXiv:1607.04635 [hep-ph]].
- [9] G. Aad et al. [ATLAS Collaboration], JHEP 1608 (2016) 009 doi:10.1007/JHEP08(2016)009 [arXiv:1606.01736 [hep-ex]].
- [10] S. Alekhin et al., Eur. Phys. J. C 75 (2015) no.7, 304 doi:10.1140/epjc/s10052-015-3480-z [arXiv:1410.4412 [hep-ph]].
- [11] V. Bertone, S. Carrazza and J. Rojo, Comput. Phys. Commun. 185 (2014) 1647 doi:10.1016/j.cpc.2014.03.007 [arXiv:1310.1394 [hep-ph]].
- [12] R. Sadykov, arXiv:1401.1133 [hep-ph].
- [13] M. Botje, Comput. Phys. Commun. 182 (2011) 490 doi:10.1016/j.cpc.2010.10.020 [arXiv:1005.1481 [hep-ph]].
- [14] V. Bertone, S. Carrazza, D. Pagani and M. Zaro, JHEP 1511 (2015) 194 doi:10.1007/JHEP11(2015)194 [arXiv:1508.07002 [hep-ph]].
- [15] R. Boughezal, Y. Li and F. Petriello, Phys. Rev. D 89 (2014) no.3, 034030 doi:10.1103/PhysRevD.89.034030 [arXiv:1312.3972 [hep-ph]].
- [16] H. Abramowicz et al. [H1 and ZEUS Collaborations], Eur. Phys. J. C 75 (2015) no.12, 580 doi:10.1140/epjc/s10052-015-3710-4 [arXiv:1506.06042 [hep-ex]].
- [17] S. Moch, J. A. M. Vermaseren and A. Vogt, Nucl. Phys. B 688 (2004) 101 doi:10.1016/j.nuclphysb.2004.03.030 [hep-ph/0403192].
- [18] A. Vogt, S. Moch and J. A. M. Vermaseren, Nucl. Phys. B 691 (2004) 129 doi:10.1016/j.nuclphysb.2004.04.024 [hep-ph/0404111].
- [19] A. D. Martin, R. G. Roberts, W. J. Stirling and R. S. Thorne, Eur. Phys. J. C 39 (2005) 155 doi:10.1140/epjc/s2004-02088-7 [hep-ph/0411040].
- [20] D. de Florian, G. F. R. Sborlini and G. Rodrigo, Eur. Phys. J. C 76 (2016) no.5, 282 doi:10.1140/epjc/s10052-016-4131-8 [arXiv:1512.00612 [hep-ph]].
- [21] D. de Florian, G. F. R. Sborlini and G. Rodrigo, JHEP 1610 (2016) 056 doi:10.1007/JHEP10(2016)056 [arXiv:1606.02887 [hep-ph]].
- [22] S. Forte, E. Laenen, P. Nason and J. Rojo, Nucl. Phys. B 834 (2010) 116 doi:10.1016/j.nuclphysb.2010.03.014 [arXiv:1001.2312 [hep-ph]].
- [23] J. Alwall et al., JHEP 1407 (2014) 079 doi:10.1007/JHEP07(2014)079 [arXiv:1405.0301 [hep-ph]].
- [24] T. Carli, D. Clements, A. Cooper-Sarkar, C. Gwenlan, G. P. Salam, F. Siegert, P. Starovoitov and M. Sutton, Eur. Phys. J. C 66 (2010) 503 doi:10.1140/epjc/s10052-010-1255-0 [arXiv:0911.2985 [hep-ph]].
- [25] V. Bertone, R. Frederix, S. Frixione, J. Rojo and M. Sutton, JHEP 1408 (2014) 166 doi:10.1007/JHEP08(2014)166 [arXiv:1406.7693 [hep-ph]].
- [26] R. Gavin, Y. Li, F. Petriello and S. Quackenbush, Comput. Phys. Commun. 184 (2013) 208 doi:10.1016/j.cpc.2012.09.005 [arXiv:1201.5896 [hep-ph]].
- [27] L. A. Harland-Lang, A. D. Martin, P. Motylinski and R. S. Thorne, Eur. Phys. J. C 75 (2015) no.5, 204 doi:10.1140/epjc/s10052-015-3397-6 [arXiv:1412.3989 [hep-ph]].
- [28] M. Aaboud et al. [ATLAS Collaboration], Eur. Phys. J. C 77 (2017) no.6, 367 doi:10.1140/epjc/s10052-017-4911-9 [arXiv:1612.03016 [hep-ex]].
- [29] V. Bertone et al. [xFitter Developers Team], arXiv:1707.05343 [hep-ph].
- [30] A. Buckley, J. Ferrando, S. Lloyd, K. Nordström, B. Page, M. Rüfenacht, M. Schönherr and G. Watt, Eur. Phys. J. C 75 (2015) 132 doi:10.1140/epjc/s10052-015-3318-8 [arXiv:1412.7420 [hep-ph]].