Deep Imaging of the HCG 95 Field. I. Ultra-diffuse Galaxies
Abstract
We present a detection of 89 candidates of ultra-diffuse galaxies (UDGs) in a 4.9 degree2 field centered on the Hickson Compact Group 95 (HCG 95) using deep - and -band images taken with the Chinese Near Object Survey Telescope. This field contains one rich galaxy cluster (Abell 2588 at =0.199) and two poor clusters (Pegasus I at =0.013 and Pegasus II at =0.040). The 89 candidates are likely associated with the two poor clusters, giving about 50 60 true UDGs with a half-light radius kpc and a central surface brightness mag arcsec-2. Deep -band images are available for 84 of the 89 galaxies from the Dark Energy Camera Legacy Survey (DECaLS), confirming that these galaxies have an extremely low central surface brightness. Moreover, our UDG candidates are spread over a wide range in color, and 26% are as blue as normal star-forming galaxies, which is suggestive of young UDGs that are still in formation. Interestingly, we find that one UDG linked with HCG 95 is a gas-rich galaxy with H I mass 1.1 detected by the Very Large Array, and has a stellar mass of . This indicates that UDGs at least partially overlap with the population of nearly dark galaxies found in deep H I surveys. Our results show that the high abundance of blue UDGs in the HCG 95 field is favored by the environment of poor galaxy clusters residing in H I-rich large-scale structures.
1 Introduction
Extremely low surface brightness (LSB) galaxies with unexpectedly large sizes, namely ultra-diffuse galaxies (UDGs), have recently drawn much attention to the understanding of their formation and evolution. Findings of dwarf galaxies with extreme LSB have been reported two decades ago (e.g., Impey et al., 1988; Bothun et al., 1991). UDGs were detected in the Coma cluster using deep low-resolution imaging data obtained with small telescopes (van Dokkum et al., 2015a), and more UDGs were found in nearby galaxy clusters since then (Koda et al., 2015; Mihos et al., 2015; Muñoz et al., 2015; Beasley et al., 2016; van der Burg et al., 2016; Koch et al., 2017; Román & Trujillo, 2017a). Differing from the classical LSB galaxies that usually have a central surface brightness down to mag arcsec-2 (Impey & Bothun, 1997; Impey et al., 2001; Ceccarelli et al., 2012; Geller et al., 2012), UDGs have a much lower central surface brightness ( mag arcsec-2), but their half-light radius kpc is comparable to that of typical galaxies, and their stellar mass ( ) is two orders of magnitude lower (van Dokkum et al., 2015a). They usually appear to be red, relatively round, and morphologically featureless in galaxy clusters, but are blue and irregular in the field (Merritt et al., 2016; Leisman et al., 2017; Román & Trujillo, 2017a, b; Trujillo et al., 2017). The ultra-diffuse nature of UDGs remains little explored.
Increasing effort has been made to understand the formation of UDGs and their connections with other galaxy populations. However, the observations have so far led to diverse conclusions. Measurements of velocity dispersion of some UDGs (e.g., Dragonfly 44 in Coma) suggest that they are likely to be failed galaxies that are overwhelmingly dominated by dark matter, although the reasons for their extremely low star formation efficiency in the past are still unknown (van Dokkum et al., 2016). Recently, van Dokkum et al. (2017) reported that the halo masses of largest Coma UDGs (Dragonfly 44 and Dragonfly X1) are at the level of , lower than the previous estimate. The evidence of a high abundance of globular clusters in UDG Dragonfly 17 supports that it could be a failed galaxy with a halo mass similar to the halo masses of the Large Magellanic Cloud (LMC) or M33 (Beasley & Trujillo, 2016; Peng & Lim, 2016). Additionally, VCC 1287, a UDG that is found in the Virgo cluster and with a halo mass estimated from the kinematics of globular clusters, is thought to belong to the dwarf galaxy population, although it is rather extended ( kpc) (Beasley et al., 2016). More observations for a large sample of UDGs are thus needed to study the properties of UDGs in detail.
From the theoretical perspective, Amorisco et al. (2016) suggested that UDGs are part of the dwarf galaxy population, but with extreme spin properties. Strong outflows are proposed to be responsible for the termination of star formation and gas cooling at early cosmic time and for the formation of UDGs seen today (Janowiecki et al., 2015; Di Cintio et al., 2017). Since UDGs have first been discovered in the Coma cluster, the processes confined to dense environment such as ram pressure and tidal stripping are likely important mechanisms for generating such galaxies. Recent progresses have reported the discovery of UDGs in various environments, not only in clusters. Of these works, Smith Castelli et al. (2016) reported two UDGs in a compact group (HCG 44), which is less dense than massive galaxy clusters. In addition, UDGs are found in even sparser environments, such as the vicinity of M101 (Merritt et al., 2016) and poor galaxy groups (Román & Trujillo, 2017b). These works together demonstrate that UDGs do not exist exclusively in the cluster environments.
Hickson compact groups (HCGs) have a high density that is comparable to the center of clusters, and they have a low velocity dispersion similar to those of loose groups (), providing a unique environment to sustain galaxy evolution (Hickson et al., 1992). Members of HCGs may almost undergo continuous gravitational perturbations and show signs of enhanced activities such as like bluer optical colors or higher radio continuum power in the violently interacting galaxies and close pairs (Verdes-Montenegro et al., 1997). In addition, many HCGs contain a diffuse background light envelope in observations, and these diffuse envelopes may be stripped material from cluster member galaxies (Da Rocha et al., 2005). HCGs are also suggested to be favorable places for searching LSB galaxies and UDGs (Ordenes-Briceño et al., 2016).
We carry out a search for extreme LSB galaxies (including UDGs) in a field centered on HCG 95. Our observations cover a field of 3∘ 3∘. In this paper, we present 89 candidates of extreme LSB galaxies (with 57 plausible UDGs) found in deep - and -band imaging and their spatial distribution in the HCG 95 field. In Section 2 we describe the observation and data processing. UDG candidates are selected and their properties are given in Section 3, and in Section 4 we discuss our findings. Finally, we summarize our results in Section 5. We adopt an HCG 95 distance modulus of 36.05 mag (162.2 Mpc) with the following cosmology: , and km s-1 Mpc-1. We use the AB magnitude system throughout this work.
2 Observation and Data Reduction
Our imaging observations of a 3 field centered on HCG 95 were taken with the Chinese Near Object Survey Telescope (CNEOST) of diameter 1.04/1.20 m in Xuyi Station (Zhang et al., 2013, 2014). The telescope is equipped with a 10k10k STA 1600 CCD with 16 readout channels, providing a field of view (FOV) of 3 and a pixel scale of 1029. At the distance of HCG 95 (162.2 Mpc), this corresponds to a resolution of 0.784 kpc per pixel. The Sloan Digital Sky Survey (SDSS) and filters were chosen for the imaging observations over five nights from 2015 October 10 to 16. Each exposure takes 90 s. The integration time is 16.15 hr and 10.65 hr for and , respectively. Before the starting and after the end of every night, we obtained bias and dark images as well as sky flats throughout each filter.
The raw image data were reduced following standard procedures, including bias and dark subtraction, flat-fielding, and removal of bad/hot pixels. Each exposure image contains 10k10k pixels divided into 16 regions to be read out. The effective gain of the readout channels differs slightly from each other. Sky flat frames are used to determine the effective gains of the readout channels. The raw images were corrected to have the same effective gain before flat-fielding. For the sky flat frames, we normalized each to the median of the central 6k6k region and then divided by the best-fit slant plane to the same region in order to correct for the inhomogeneity within a single frame. Then these flat frames were combined together to generate the final flat. Again, the final flat was divided by the best-fit slant plane determined from the central 6k6k region in order to remove systematic structures. The final flat frame is used for flat-fielding that removes pixel-to-pixel variations. Bad or hot pixels were identified with values below 0.9 or above 1.1 in the final flat frame. Perfect flat-fielding could improve the detection depth for faint structure because the detection limit is constrained by systematic errors, which are dominated by flat-fielding (Abraham & van Dokkum, 2014). The vignetting effect becomes significant at the edges of a wide-field image. This effect can be mostly corrected for through flat-fielding.
A catalog of 12,922 stars in the HCG 95 field from SDSS is used as the reference to determine astrometric distortions and calibration. Source detection and photometry was done using the software SExtractor (Bertin & Arnouts, 1996), and SCAMP (Bertin et al., 2006) was used to compute an astrometric solution for individual science images, giving a typical accuracy of RMS in astrometry. Only bright stars of mag with photometry from SDSS are adopted as the reference sources for photometric calibration. All science images were calibrated to have a constant photometric zero point = 25.0 mag. We fit a slant plane to the background and subtracted it from each image. This helps to reduce systematic errors in image combination. Weight images were generated to mask bad/hot pixels and saturated pixels. Cross-talks caused by saturated stars were removed following Freyhammer et al. (2001).
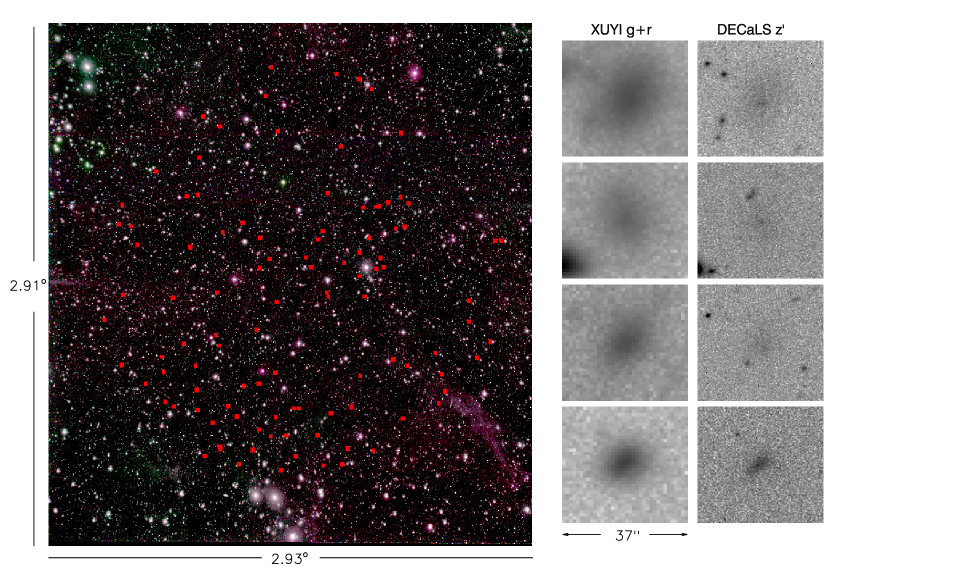
Finally, we selected the good-quality science images and stacked those of the same filter together using the software tool SWARP (Bertin et al., 2002), yielding the final - and -band science images with effective integration times of 13.15 hr and 9.525 hr, respectively. The depth of the two images (in a ″″ box) reaches mag arcsec-2 and mag arcsec-2, respectively. The depths are comparable to those given in Fliri & Trujillo (2016) and Koda et al. (2015). The combined image is shown in the left panel of Figure 1.
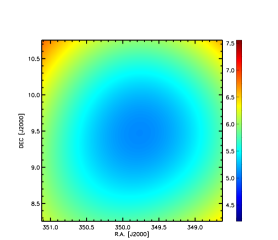
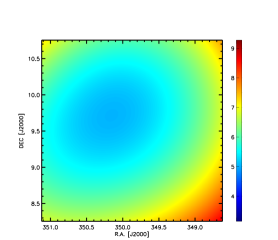
The FWHM of the point spread function (PSF) is typically 4 and 3 in the central region of the - and -band science image, respectively. We note that the PSF of the images obtained with CNEOST slightly increases from the center to the edges of the FOV. We use stars identified from SDSS to trace the PSF variation and build the 2-dimensional map of PSF FWHM through best fitting a third-order polynomial function to the FWHM map of the selected stars. The best-fit PSF FWHM maps in and are shown in the Appendix in Figure A.1.
3 UDG Candidates
Our goal is to search for UDGs that have large sizes and very LSB. We run SExtractor (Bertin & Arnouts, 1996) in dual mode with the configuration optimized for the detection of extended LSB objects and extract source catalogs from the stacked science images. The -band image is used for source detection because it is somewhat deeper and has a slightly better resolution (see Figure A.1). We limit the source detection to the central area of diameter to minimize the edge effects (such as vignetting or comatic aberration). We obtained the - and -band photometric catalogs consisting of 31,230 objects.
The widely used criteria for UDGs selection are kpc and mag arcsec-2 (van Dokkum et al., 2015a). Given that UDGs generally obey a rather flat profile, we average the total magnitude over the area within the PSF-corrected half-light radius as the central surface brightness, following van Dokkum et al. (2015a). We cross correlate our catalog with the photometric catalog of the same field from the SDSS with a tolerance radius of , and exclude stars, bright sources with mag arcsec-2, and compact sources with . Here the cut corresponds to a size of 1.5 kpc at the distance of HCG 95. The objects in our catalog with stellarity parameter CLASS_STAR0.15 are classified as compact/point sources and those with a color out of or are treated as false sources, including noise contaminators and sparks from bright sources. We obtained 464 SDSS-detected galaxies of mag arcsec-2 and , and 1771 sources from our deep and observations without detection in the SDSS. For the preselected 2235 sources, we estimated the intrinsic half-light radii and central surface brightness from our deep -band image to further identify UDGs. The size measurement for galaxies needs to correct the broadening effect by PSF. We extracted the PSF size from the 2D PSF FWHM maps shown in Figure A.1 for the objects of given positions. We roughly estimated the intrinsic effective radius with following Bouché et al. (2015), where is the directly observed half-light radius, and is the half-light radius of the PSF (see Figure A.3 for more details). We estimated that 644 of the 2235 objects satisfy and mag arcsec-2.
We realize that the preselected 644 objects that satisfy the selection criteria for UDGs may still be contaminated by blended sources. In particular, the low resolution of our deep - and -band images together with the source detection configured for extended sources would often mistake blended faint sources as UDG candidates. On the other hand, the degradation of the image quality toward the edges of the images increases the uncertainties in identification of UDGs. We visually inspect the preselected targets with the aid of SDSS DR12 Image List Tool111http://skyserver.sdss.org/dr12/en/tools/chart/listinfo.aspx to examine their morphologies. Removing binary sources and other artifacts of misclassification, we obtained a sample of 105 UDG candidates over an area of 4.9 degree2 in the HCG 95 field.
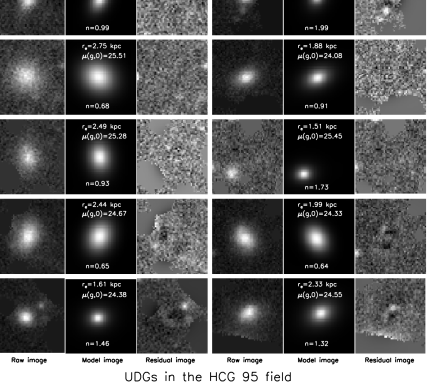
Considering the uncertainties due to the variation of PSF FWHM in our observations, we examine our results by measuring the central surface brightness of UDGs using GALFIT (Peng et al., 2002). The averaged PSF in the central region of our deep -band science image is used. The central surface brightness is then extracted from the model Sérsic profile (Graham & Driver, 2005; Zhong et al., 2008). Finally, we obtain the -band central surface brightness for 89 of the 105 UDGs, as shown in Figure 2.
The HCG 95 field is covered by the Dark Energy Camera Legacy Survey (DECaLS) (Blum et al., 2016), which provides seeing-limited -band images obtained with the 4 m Blanco telescope. Of the 89 UDG candidates, 84 have -band images from Data Release 3 (DR3)222http://legacysurvey.org/dr3/description/. We measured the half-light radius from their -band images and list the results in Table A.1, confirming that they have very LSB. Four examples of UDG candidates are shown in the right panel of Figure 1.
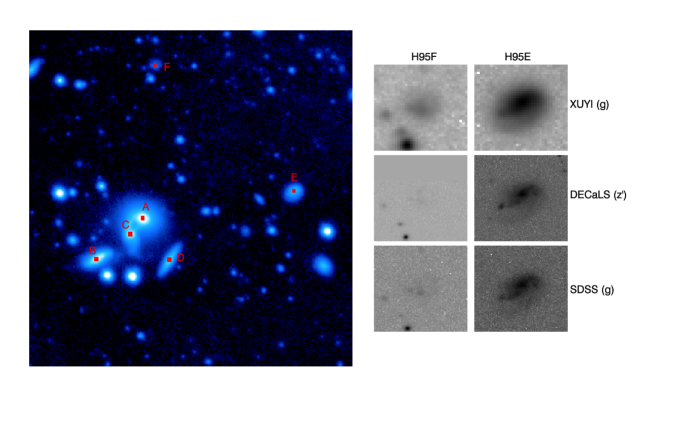
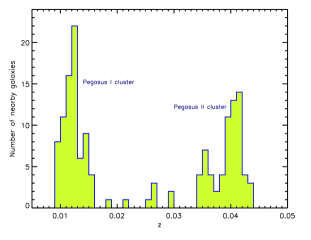
Finally, we identify 89 UDG candidates in the HCG 95 field. Redshift information is required to determine whether they are associated with HCG 95. As shown in Figure 3, HCG 95 is a compact group ( and , redshift ) with four bright galaxies seen in the central region. Of the four galaxies, H95A is a giant elliptical galaxy. H95C appears to contain double nuclei, therefore it is considered to be a merger remnant of two disk galaxies (Iglesias-Páramo & Vílchez, 1997, 1998). H95C has two obvious tidal tails and a bridge connecting it to H95A (Rodrigue et al., 1995). H95B is a foreground galaxy because its line-of-sight velocity significantly differs from the velocity of the other members (Iglesias-Páramo & Vílchez, 1997; Da Rocha et al., 2005). H95D is an edge-on spiral galaxy (Iglesias-Páramo & Vílchez, 1997). Many observations have been made of HCG 95, including H I, H and X-ray (Ponman et al., 1996; Iglesias-Páramo & Vílchez, 1998, 2001; Huchtmeier et al., 2000; Da Rocha et al., 2005). Interestingly, three structures can be found in the HCG 95 field, including the Pegasus I cluster (Chincarini et al., 1976; O’Neil et al., 1997), the Pegasus II cluster (Richter & Huchtmeier, 1982), the Abell 2588 cluster (Richter & Huchtmeier, 1982; Abell et al., 1989). These overdensities provide various environments in which to search for UDGs.
In the 3 3 field centered at HCG 95, there are 96 nearby galaxies with known redshift from the literature, including 29 NGC galaxies and those from the Update Zwicky Catalogue (UZC) catalog (Falco et al., 1999), from the Flat Galaxy Catalog (FGC), the Uppsala Galaxy Catalog (UGC), from the SDSS, and from the Arecibo Legacy Fast ALFA (ALFALFA) (Haynes et al., 2011; Teimoorinia et al., 2017). The 29 NGC galaxies are listed in Table 1. The spatial distributions of these nearby galaxies are shown in Figure 4. We can see that these galaxies are located in two distinct redshift bins and , which are associated with Pegasus I () and Pegasus II (, similar to HCG 95) (Richter & Huchtmeier, 1982; Canizares et al., 1986), as shown in Figure 5. Moreover, the two groups of galaxies are also globally separated from each other; this split is shown by the dotted line in Figure 4. We thus conclude that HCG 95 is a part of the poor galaxy cluster Pegasus II and our UDG candidates are most likely associated with either Pegasus I at or Pegasus II at . Indeed, from Figure 4 one can see that the UDG candidates (red open circles) are also clustered with the two structures, supporting that the UDG candidates reside in the two poor galaxy clusters.
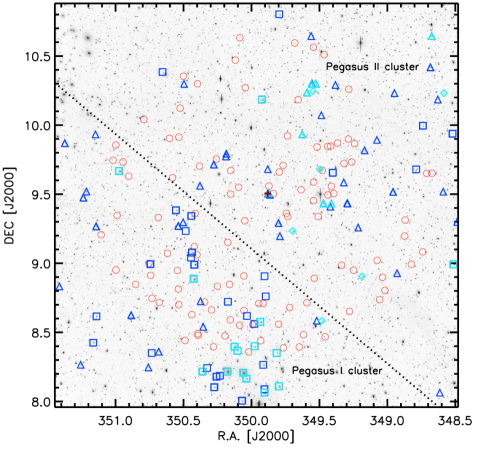
We note that our selection criteria for UDGs are based on the distance of HCG 95 (i.e., the Pegasus II cluster). However, Pegasus I locates is located at a distance closer than Pegasus II. Accordingly, the physical sizes of UDG candidates associated with Pegasus I would be smaller. There are 44/45 UDG candidates located below/above the dotted line in Figure 4, likely associated with Pegasus I/Pegasus II. When the distance of Pegasus I (, 55.2 Mpc, mag) is adopted to calculate the size and luminosity, 12 of the 44 UDG candidates still satisfy the UDG selection criterion 1.5 kpc. The remaining 32 would be very LSB galaxies with sizes smaller than the size of a typical UDG. The 45 candidates above the dotted line would be UDGs if they are located close to Pegasus II. The sum of two parts would mean that 57 UDGs are located in the HCG 95 field. We caution that member galaxies of the two clusters are widely spread over the field and information on the redshift is necessary to decide the real membership and physical size for a given UDG candidate. Still, the estimate of UDG numbers should be reasonable in a statistic manner. For simplification, we assume that all 44 UDG candidates in the Pegasus I region are at a distance of and all 45 UDG candidates in the Pegasus II region at a distance of . Table A.1 lists the measured properties of our sample of 89 targets and denotes them to be either UDGs or very LSB galaxies. In short, we conclude that roughly galaxies are identified to be UDGs associated with the two poor galaxy clusters in the HCG 95 field.
| Name | R.A. | Decl. | ||
|---|---|---|---|---|
| (NGC/IC) | (J2000.0) | (J2000.0) | (mag) | |
| 7612 | 23:19:44.2 | 08:34:35 | 0.0107 | 32.97 |
| 7611 | 23:19:36.7 | 08:03:48 | 0.0108 | 33.00 |
| 7634 | 23:21:41.9 | 08:53:14 | 0.0108 | 32.98 |
| 7626 | 23:20:42.6 | 08:13:01 | 0.0114 | 33.11 |
| 7608 | 23:19:15.3 | 08:21:02 | 0.0117 | 33.18 |
| 7610aaNGC 7610 and NGC 7616 refer to the same object; | 23:19:41.5 | 10:11:05 | 0.0119 | 33.22 |
| 7648bbNGC 7648 = IC 1486; | 23:23:54.1 | 09:40:04 | 0.0119 | 33.22 |
| 7631 | 23:21:26.8 | 08:13:03 | 0.0125 | 33.35 |
| 7623 | 23:20:30.1 | 08:23:46 | 0.0125 | 33.34 |
| 7619 | 23:20:14.6 | 08:12:23 | 0.0125 | 33.35 |
| 7621 | 23:20:24.7 | 08:21:57 | 0.0128 | 33.40 |
| 7617 | 23:20:09.1 | 08:09:56 | 0.0139 | 33.60 |
| 5309 | 23:19:11.8 | 08:06:33 | 0.0140 | 33.62 |
| 7615 | 23:19:54.5 | 08:23:58 | 0.0149 | 33.77 |
| 7529 | 23:14:03.2 | 08:59:32 | 0.0151 | 33.81 |
| 7569 | 23:16:44.5 | 08:54:22 | 0.0217 | 34.66 |
| 5306 | 23:18:11.3 | 10:14:44 | 0.0253 | 35.02 |
| 7586 | 23:17:55.6 | 08:35:04 | 0.0267 | 35.14 |
| 7601 | 23:18:47.1 | 09:14:01 | 0.0268 | 35.15 |
| 7528 | 23:14:20.1 | 10:13:53 | 0.0292 | 35.35 |
| 7587 | 23:17:59.3 | 09:40:49 | 0.0292 | 35.35 |
| 5305 | 23:18:06.3 | 10:17:59 | 0.0350 | 35.77 |
| 7594ccNGC 7594 = IC 1478. | 23:18:14.0 | +10:17:52 | 0.0362 | 35.84 |
| 7542 | 23:14:41.7 | 10:38:35 | 0.0395 | 36.05 |
| 7609 | 23:19:29.9 | 09:30:29 | 0.0396 | 36.05 |
| 7595 | 23:18:30.2 | 09:55:56 | 0.0410 | 36.13 |
| 7579 | 23:17:38.9 | 09:25:59 | 0.0411 | 36.14 |
| 5307 | 23:18:22.0 | 10:14:09 | 0.0413 | 36.17 |
| 7584 | 23:17:53.1 | 09:25:58 | 0.0431 | 36.25 |
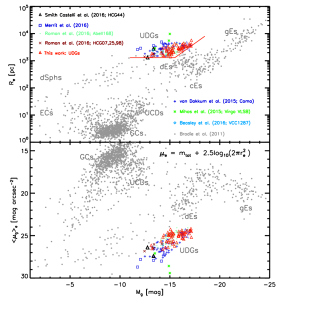
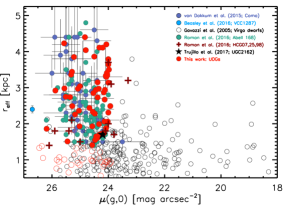
We examine the properties of our sample of UDGs and very LSB galaxies in comparison with other samples of UDGs in the literature. Figure 6 shows the absolute magnitude in relation to the average surface brightness and effective radius . Figure 7 presents the central surface brightness in relation to the effective radius . From Table A.1 we can see that the 32 very LSB galaxies in our sample are characterized by = 24.00 26.45 mag arcsec-2, typical 0.98 kpc, typical 13.24 mag, color , and axis ratio ; while the 12 UDGs have = 24.08 26.19 mag arcsec-2, 1.93 kpc, 14.66 mag, and ; and the 45 UDGs in Pegasus II have = 24.00 25.88 mag arcsec-2, 2.98 kpc, 15.90 mag, and . The comparisons in Figures 6 and 7 confirm that the selected UDGs in the HCG 95 field are distinct from normal galaxies in terms of these parameters and comparable to those found in previous studies (e.g., van der Burg et al., 2016). The consistence indicates that UDGs can be found in different environments.
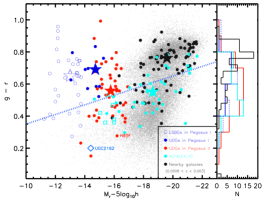
Figure 8 presents the -band absolute magnitude versus for our UDGs in comparison with other galaxy populations, including nearby galaxies from the SDSS and H I gas-rich galaxies from the ALFALFA survey. Our sample UDGs are spread over a wide range in , similar to the spread of member galaxies of the poor galaxy clusters Pegasus I and Pegasus II. A sample of nearby mass-selected galaxies with are also presented for comparison. It is clear from Figure 8 that our sample contains 20 UDGs with colors similar to the colors of star-forming galaxies, although most UDGs are as red as quiescent dwarf galaxies. The UDGs in the Pegasus II cluster appear to be slightly bluer in than the UDGs in the Pegasus I cluster. The diversity of color indicates that UDGs may be formed through different star formation histories, which are to some extent coupled with the environments.
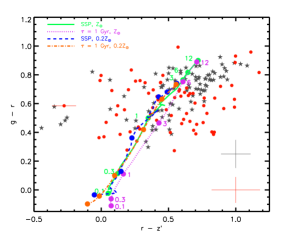
Figure 9 shows the versus diagram for 89 UDG candidates and 96 spectroscopically identified nearby galaxies in the HCG 95 field. We can see that the 89 UDG candidates tend to be fainter and bluer than the nearby galaxies (as shown in Figure 8), although the dispersion in two colors is rather large. We also show the color tracks of galaxy models of different ages from BC03 (Bruzual & Charlot, 2003). The single stellar population (SSP) and an e-folding (=1 Gyr) evolutionary history are adopted to generate the templates. The metallicity is set to be solar and 1/5 solar for comparison. The typical ages of 0.1, 0.3, 1, 3, 6, 12 Gyr are marked with solid circles. We note that the -band photometry has large uncertainties for the faint UDG candidates and the dispersion in color is largely driven by the measurement errors. We note that the model templates are only for stellar emission. The presence of strong emission lines in the band (i.e. H + [NII]) would apparently make galaxies appear bluer in and redder in . It is obvious that a large fraction of UDG candidates have young stellar populations (3 Gyr), and nearly one-third are as blue as blue-cloud galaxies.
We derived the stellar mass from luminosity and color using the mass-to-light ratio versus relation (Bell et al., 2003; Taylor et al., 2011). The typical stellar mass is , and 3.72 for 32 very LSB galaxies, 12 UDGs in Pegasus I, and 45 UDGs in Pegasus II, respectively. The stellar masses of UDGs are consistent with previous studies (van Dokkum et al., 2015a; Román & Trujillo, 2017a, b). Combined together, our results suggest that UDGs not only exist in galaxy clusters such as Coma, Virgo, Fornax, and Abell (Mihos et al., 2015; Muñoz et al., 2015; Koda et al., 2015; van Dokkum et al., 2015a, b; Martínez-Delgado et al., 2016; Janssens et al., 2017), but also live in lower density environments.
Observations of neutral hydrogen gas are available for the galaxy group HCG 95 (Huchtmeier et al., 2000). Two member dwarf galaxies H95E and H95F about 35 offset from the center of HCG 95 (about 164.6 kpc at the distance of HCG 95), as shown in Figure 3, have been detected to have strong H I emission with the Very Large Array (VLA). The line-of-sight velocities of the two galaxies are km s-1 and km s-1, respectively. From the VLA observations, we derive the H I gas mass for H95E and H95F using the formula (Jy km s/Mpc)2 (Levy et al., 2007), where is the 21 cm line flux (in Jy km s-1) and is the distance of HCG 95. The derived H I mass is 2.02 and 1.08 for H95E and H95F, respectively.
Interestingly, H95F is one of our sample UDGs. The properties of H95F are given in Table 2. In addition, H95F is a blue dwarf galaxy with and . We further address the connections between UDGs and gas-rich LSB galaxies. Impey et al. (1996) have compiled a sample of 693 LSB galaxies at . We find that 16 extended LSB galaxies in this sample meet the selection criteria of UDGs, and 15 of them have an H I detection. The physical parameters of the 16 UDGs along with H95F are given in Table 2. They have H I gas masses from to 3.39 and stellar masses over the range of 10 derived from color and luminosity (Fukugita et al., 1996; Bell et al., 2003; Taylor et al., 2011). Recently, Trujillo et al. (2017) have reported one nearest UDG (UGC 2162) with strong H I emission; the properties of this UDG are also listed in Table 2. Leisman et al. (2017) presented 115 UDGs with H I emission from the ALFALFA survey. We include 7 of the 115 UDGs in Table 2 for a comparison. The overlap of UDGs with some extremely LSB galaxies detected by H I surveys in size and central surface brightness reveals an intimate connection between the two populations, providing key insights into the formation of UDGs in the local universe (Bellazzini et al., 2017).
| Name | R.A. | Decl. | |||||||
|---|---|---|---|---|---|---|---|---|---|
| (J2000.0) | (J2000.0) | (mag arcsec-2) | (mag) | (mag) | (km s-1) | () | (kpc) | () | |
| H95FaaH95F is shown in this work. | 23:19:29.0 | 9:33:31 | 24.1 | 19.4 | 16.7 | 11730 | 4.35 | 3.41 | 9.03 |
| UGC 2162bbMeasured in the band, UGC 2162 from Trujillo et al. (2017). | 2:40:23.1 | 01:13:45 | 24.4 | 16.1 | 15.0 | 1172 | 28 | 1.7 | 8.28 |
| 322019ccMeasured in the band from Leisman et al. (2017). | 22:58:26.9 | 01:50:58.9 | 24.6 | 18.5 | 15.8 | 4819 | 11.9 | 3.9 | 8.81 |
| 103796ccMeasured in the band from Leisman et al. (2017). | 00:20:39.6 | 06:57:56.8 | 24.2 | 18.3 | 16.2 | 5647 | 9.2 | 3.5 | 8.86 |
| 113790ccMeasured in the band from Leisman et al. (2017). | 01:13:02.1 | 27:38:12.8 | 24.3 | 18.8 | 15.4 | 4952 | 7.1 | 2.4 | 8.57 |
| 114905ccMeasured in the band from Leisman et al. (2017). | 01:25:18.5 | 07:21:37 | 24.9 | 18.2 | 16.2 | 5435 | 12.8 | 4.7 | 9.11 |
| 114943ccMeasured in the band from Leisman et al. (2017). | 01:47:06.6 | 07:19:51.9 | 24.5 | 18.9 | 16.4 | 8416 | 8.0 | 4.5 | 9.10 |
| 113949ccMeasured in the band from Leisman et al. (2017). | 01:49:38.6 | 30:40:50.8 | 24.3 | 19.2 | 15.8 | 7380 | 5.0 | 2.5 | 9.03 |
| 122966ccMeasured in the band from Leisman et al. (2017). | 02:09:29.0 | 31:51:10 | 25.4 | 18.4 | 16.4 | 6518 | 11.6 | 5.1 | 9.00 |
| 0139+0240 | 1:39:58.9 | 2:40:40 | 24.4 | 16.9 | 14.3 | 1765 | 26.0 | 3.15 | 8.60 |
| 0221+0034 | 2:21:49.8 | 0:34:41 | 24.7 | 17.3 | 17.5 | 8996 | 18.9 | 11.35 | 9.25 |
| 02250049 | 2:25:45.6 | 0:49:50 | 25.0 | 18.0 | 12.8 | 1464 | 13.2 | 1.33 | 7.71 |
| 0227+0040 | 2:27:01.1 | 0:40:56 | 24.8 | 18.1 | 16.6 | 8503 | 13.7 | 7.79 | 9.53 |
| 0249+0146 | 2:49:45.0 | 1:46:16 | 24.5 | 16.5 | 16.7 | 4293 | 21.2 | 6.19 | 8.87 |
| 0319+0015 | 3:19:14.2 | 0:15:00 | 24.4 | 18.4 | 15.7 | 6548 | 8.3 | 3.66 | 9.24 |
| 0955+0155 | 9:55:54.5 | 1:55:58 | 24.9 | 17.2 | 14.1 | 1815 | 18.3 | 2.28 | 8.54 |
| 1101+0211 | 11:01:45.4 | 2:11:24 | 24.1 | 18.2 | 16.2 | 7578 | 10.9 | 5.54 | 9.17 |
| 11100017 | 11:10:14.1 | 0:17:47 | 24.8 | 17.8 | 16.9 | 8472 | 11.6 | 6.57 | 9.37 |
| 1154+0203 | 11:54:48.6 | 2 03:35 | 24.5 | 17.7 | 13.8 | 1980 | 12.1 | 1.64 | 8.15 |
| 1228+0116 | 12:28:43.1 | 1:16:13 | 25.1 | 18.3 | 13.5 | 2289 | 11.1 | 1.74 | 8.20 |
| 12300015 | 12:30:34.2 | 0:15:28 | 24.1 | 16.5 | 16.1 | 3279 | 25.0 | 5.60 | 8.66 |
| 1249+0233 | 12:49:49.9 | 2:33:34 | 25.0 | 19.1 | 15.1 | 6971 | 10.4 | 4.84 | 8.91 |
| 1350+0230 | 13:50:59.7 | 2:30:20 | 24.8 | 18.5 | 14.8 | 4507 | 11.4 | 3.49 | 8.62 |
| 1431+0142 | 14:31:20.5 | 1:42:25 | 25.8 | 17.4 | 14.0 | 1829 | 24.2 | 3.04 | 8.30 |
| 1307+0112 | 13:07:31.2 | 1:12:53 | 24.2 | 18.2 | 15.6 | 5842 | 9.7 | 3.83 |
Motivated by the finding that H95F is an H I gas-rich galaxy, we cross-correlated our sample of 89 UDG candidates with the H I galaxy catalog from the ALFALFA survey (Giovanelli et al., 2005; Haynes et al., 2011; Teimoorinia et al., 2017). Although 49 nearby galaxies with in the HCG 95 field are found to have an H I detection by ALFALFA, none of our sample UDGs is detected in ALFALFA. Deeper H I surveys will probably detect more UDGs with H I gas.
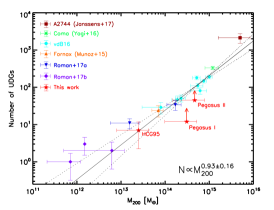
We compare the abundances of UDGs of three galaxy structures in the HCG 95 field with those of other groups and clusters from the literature. Figure 10 shows the abundance of UDGs as a function of halo mass adopted from Janssens et al. (2017) and van der Burg et al. (2016), following a relation of . It is clear that more massive halos host more numerous UDGs. We use the velocity dispersion to estimate the halo masses of the three structures in the HCG 95 field. The halo masses of galaxy group HCG 95 and the two poor galaxy clusters Pegasus I and II are 2 , 3 , and 5 , respectively (Chincarini et al., 1976; Girardi et al., 1998; Barnes et al., 1999; Randall et al., 2009; Valtchanov et al., 1999; Da Rocha et al., 2005). The abundance of UDGs in HCG 95 is consistent with the overall correlation. However, the clusters Pegasus I cluster and Pegasus II cluster are located below the correlation. We point out that our observations cover only part of the sky area of the two clusters, and the estimated abundance of UDGs is therefore only the lower limit for the abundance of UDGs. The red arrows in Figure 10 denote the lower limits for the two poor clusters. We thus argue that the three galaxy structures in the HCG 95 field follow the same correlation between the abundance of UDGs and halo mass as other galaxy groups and clusters.
4 Discussion
One uncertainty in our analysis is the distance for the selection of UDGs. We identified 89 UDG candidates over a sky area of 4.9 degree2 assuming that they are located at the distance of HCG 95, which resides in the galaxy cluster Pegasus II (Rood & Struble, 1994). Given that another poor galaxy cluster, Pegasus I, also exists in this field, some candidates may probably be linked with Pegasus I at a distance closer than Pegasus II. Then the actual physical size of these objects would be smaller. The extremely LSB of these candidates makes the measurement of their distance from spectroscopic observations very difficult even with current 10 m class telescopes. In terms of the spatial distribution of bright nearby galaxies with known redshift, the UDG candidates are crudely divided and assigned to the two poor clusters. We estimated that roughly 50 60 UDGs are present in the HCG 95 field. This confirms that UDGs exist in environments with a density that is lower than the density of rich galaxy clusters such as Coma.
The Pegasus I cluster is embedded in the filamentary structures connecting the Pisces-Perseus supercluster (PPS) and the local supercluster (Richter & Huchtmeier, 1982; Levy et al., 2007). The velocity dispersion of the Pegasus I cluster is km s-1, which is one of the lowest velocities among galaxy clusters (Noonan, 1981; Richter & Huchtmeier, 1982). We note that there are far fewer UDGs in the Pegasus I region than in the Pegasus II (HCG 95) region. One reason for this is that the Pegasus I cluster is closer, so that the area covered in our observations is smaller, although the angular diameter of the Pegasus I cluster is much larger than the angle of the Pegasus II cluster (Chincarini et al., 1976). However, we cannot deny that the intrinsic abundance of UDGs in the two clusters may differ from each other given their different halo structures. The Pegasus I and Pegasus II clusters both provide a low-density environment. Galaxies in such low-density environments are systematically younger than those in dense environments and their formation timescale is longer (Thomas et al., 2005). The newly formed disk galaxies of the same stellar masses are systematically larger than their analogs at high- (van der Wel et al., 2014). These suggest that later-type galaxies in low-density environments tend to be formed with larger sizes, compared with those in dense environments. If UDGs are a tail of the high-spin population of galaxies, one could expect that they are more numerous in the low-density environments. On the other hand, UDGs might barely survive in the overdense regions because of strong tidal disruption, leading to a decrease of UDGs.
The detection rate of UDGs in the HCG 95 field is higher than that in the Coma cluster, where 47 UDGs were reported over an area of 8.3 degree2 by van Dokkum et al. (2015a). We point out that the depth of survey images affects the detection rate of UDGs. Our images are as deep as those presented by Fliri & Trujillo (2016) and Koda et al. (2015), and deeper than the images by van Dokkum et al. (2015a). Indeed, Koda et al. (2015) claimed that a larger number of UDGs are found in the Coma cluster with deeper imaging data (Yagi et al., 2016). In addition, the detection rate of UDGs is a strong function of the host environment (van der Burg et al., 2016; Román & Trujillo, 2017b). As shown in Figure 10, the halo mass of the Coma cluster is higher than the mass of the HCG 95 group, and the abundance of UDGs in HCG 95 is consistent with the halo mass-abundance correlation. Moreover, van Dokkum et al. (2017) pointed out that their estimate of the UDG abundance is incomplete because the UDGs detected in the SDSS survey were removed from their analysis (e.g., Dragonfly X1).
We find that UDGs in the HCG 95 field span over a wide color range, as shown in Figure 8. The majority of UDGs in our sample have a color comparable to that of red-sequence galaxies of the same stellar masses, consistent with the findings from previous studies (van Dokkum et al., 2015a; van der Burg et al., 2016). Still, a number of UDGs exhibit a color as blue as typical blue-cloud galaxies and H I-selected galaxies. There is no doubt that these blue UDGs are still forming stars. No dependence of color is found on the separation distance from the cluster center. We note that UDGs in the Pegasus II cluster tend to be slightly bluer than those in the Pegasus I cluster. However, this may be due to biases in sample selection as the two subsamples of UDGs show a systematic offset in luminosity.
The presence of blue UDGs indicates that environmental processes quenching star formation in galaxy clusters play a less important role in the Pegasus clusters compared to Coma. Martínez-Delgado et al. (2016) reported DGSAT I to be a UDG in PPS and argued that tidal heating effects in combination with ram-pressure stripping remove its gas content and quench star formation in DGSAT 1. Indeed, the lower velocity dispersion of the Pegasus I cluster together with the lack of dense hot intracluster medium (ICM) suggest that ram pressure from hot ICM is no longer a major process for stripping gas in galaxies, and the role of interstellar medium (ISM)-ICM interactions in low-density and low-velocity dispersion environments is a possible explanation (Levy et al., 2007). The proposed mechanisms for the formation of UDGs in dense environments (e.g., rich clusters), including galaxy harassment, ram-pressure stripping and galaxy starvation, do not work for UDGs formed in low-density environments (such as poor clusters and galaxy groups). However, in poor clusters and galaxy groups, the formation of UDGs may be mainly affected by ISM-ICM interactions given their low-velocity dispersions.
Interestingly, we find the UDG H95F in our sample to be a gas-rich galaxy. This UDG has a blue color and strong H I emission detected by VLA. The blue color of H95F suggests that it is dominated by young stellar populations. H95F shows that UDGs partially overlay with H I-selected LSB galaxies. The H I-rich LSB galaxies often have a high spin and low star formation efficiency (Amorisco & Loeb et al., 2016). Our finding reveals that at least part of the UDGs originate from the same parent population as H I-rich LSB galaxies but appear to be extremely low in surface brightness, which might be coupled with the tail of spin at the high end. This is consistent with the theoretical interpretation by Amorisco & Loeb et al. (2016). In such cases, star formation would not be at a sufficiently high rate to generate the strong outflows that are responsible for the termination of star formation and gas cooling at early time, which is required by the formation mechanism for UDGs seen today (Janowiecki et al., 2015; Trujillo et al., 2017). Feedback from SNe and massive stars driven gas outflows is suggested to inject energy into H I gas, resulting in the expansion of stellar disks and dark matter halos, and the formation of UDGs in the field that mimic LSB galaxies (Di Cintio et al., 2017). We argue that a tidal origin for H95F is unlikely. Although tidal features are clearly seen in the two central galaxies of HCG 95, we do not find apparent tidal structures around H95F from our deep -band image. It is worth noting that PPS seems to contain about 50% H I-rich galaxies (Richter & Huchtmeier, 1982). The Pegasus I cluster (and HCG 95) appears to host more H I gas-rich galaxies. We expect that more UDGs in our sample could be detected with H I in future surveys of higher sensitivities. The gas-rich environment implies that the evolution of galaxies around the Pegasus clusters is still undergoing gas accretion, and the build-up of disks tends to take a longer time compared to other regions. Again, this is consistent with the idea that (at least) some of the UDGs belong to the tail of the high-spin galaxy population formed at a relatively late time.
Owing to the complexity of environmental effects, UDGs may have multiple pathways of formation and evolution. Previous studies suggested that some UDGs could be “failed” galaxies that are overwhelmingly dominated by dark matter (van Dokkum et al., 2015a, 2016, 2017). The high abundance of globular clusters found in one UDG indicates that it may be a failed galaxy with a halo mass similar to the masses of the LMC or M33 (Beasley & Trujillo, 2016; Peng & Lim, 2016). Other studies revealed that UDGs are part of a dwarf galaxy population (Yozin & Bekki, 2015; Amorisco & Loeb et al., 2016; Amorisco et al., 2016; Beasley et al., 2016; Beasley & Trujillo, 2016; Di Cintio et al., 2017). Recently, Román & Trujillo (2017b) pointed out that UDGs may be born in the field, further grow in groups, and ultimately fall into galaxy clusters by group accretion, leading to the decrease in UDG density toward dense environments.
In addition, our results show that 26% blue UDGs are detected in our observations. This high abundance of blue UDGs is likely associated with the environment of poor galaxy clusters residing in H I-rich large-scale structures. Taken together, our results indicate that the abundance of blue UDGs tends to be higher in low-density environments that are still developing, with rich gas available for slowly feeding galaxies to build up LSB disks.
5 Summary
We obtained deep - and images of the HCG 95 field with the 1 m CNEOST. Over an area of 4.9 degree2, we detected a sample of 89 UDG candidates that are expected to be linked with the two poor galaxy clusters Pegasus I at and Pegasus II at . We analyzed the properties of these UDG candidates using available multiwavelength data. We summarize our results as follows:
-
(1)
There are about 50 60 true UDGs with kpc and mag arcsec-2 in the HCG 95 field. These UDGs are most likely associated with the two poor galaxy clusters. This abundance of UDGs is higher than the abundance of UDGs in the field. It becomes clear that UDGs can be found ubiquitously in different environments, but a large diversity of the abundance of UDGs is seen.
-
(2)
Our UDGs are spread over a wide range in color , covering the color regimes of both red-sequence and blue-cloud galaxies. About 23 of them are as blue as blue-cloud galaxies, suggesting that these UDGs are still forming stars. No correlation is found among UDGs between color and separation distance from the density center. Our result indicates that the environmental processes for quenching galaxy star formation appear not to be weak in the volume around HCG 95.
-
(3)
The morphologies of some UDGs appear to be irregular, the colors of these irregular UDGs are bluer than regular UDGs, like H95F. This indicates that the irregular UDGs may be connected with loose environments and have a different formation mechanism.
-
(4)
Our most striking finding is the discovery that UDG H95F is a gas-rich galaxy. This is the first UDG found with solid H I observations by the VLA. Our finding reveals that at least some UDGs may be gas-rich galaxies and overlap the galaxies with low surface brightness galaxies detected in deep H I surveys. This supports the picture that (at least some of the) UDGs belong to the tail of the high-spin galaxy population formed at a relatively late time.
Taken together, our results imply that the abundance of blue UDGs tends to be higher in low-density environments that are still developing, with rich gas available for slowly feeding galaxies. More efforts are needed to determine the environmental complexity and understand the formation of UDGs and their evolutionary pathways.
References
- Abell et al. (1989) Abell, G. O., Corwin, H. G., Jr., & Olowin, R. P. 1989, ApJS, 70, 1
- Abraham & van Dokkum (2014) Abraham, R. G., & van Dokkum, P. G. 2014, PASP, 126, 55
- Amorisco & Loeb et al. (2016) Amorisco, N. C. & Loeb, A., 2016, MNRAS, 459, L51
- Amorisco et al. (2016) Amorisco, N. C., Monachesi, A., & White, S. D. M. 2016, arXiv:1610.01595
- Barnes et al. (1999) Barnes, D. G., Webster, R. L., Schmidt, R. W., & Hughes, A. 1999, MNRAS, 309, 641
- Beasley et al. (2016) Beasley, M. A., Romanowsky, A. J., Pota, V., et al. 2016, ApJ, 819, L20
- Beasley & Trujillo (2016) Beasley, M. A., & Trujillo, I. 2016, ApJ, 830, 23
- Bell et al. (2003) Bell, E. F., McIntosh, D. H., Katz, N., & Weinberg, M. D. 2003, ApJS, 149, 289
- Bellazzini et al. (2017) Bellazzini, M., Belokurov, V., Magrini, L., et al. 2017, MNRAS, 467, 3751
- Bertin & Arnouts (1996) Bertin, E., & Arnouts, S. 1996, A&AS, 117, 393
- Bertin et al. (2002) Bertin, E., Mellier, Y., Radovich, M., et al. 2002, in ASP Conf. Ser. 281, Astronomical Data Analysis Software and Systems XI, ed. D. A. Bohlender, D. Durand, & T. H. Handley (San Francisco, CA: ASP), 228
- Bertin et al. (2006) Bertin, E. 2006, in ASP Conf. Ser. 351, Astronomical Data Analysis Software and Systems XV, ed. C. Gabriel, C. Arviset, D. Ponz, & E. Solano (San Francisco, CA: ASP), 112
- Blanton et al. (2006) Blanton, M. R., Eisenstein, D., Hogg, D. W., & Zehavi, I. 2006, ApJ, 645, 977
- Blum et al. (2016) Blum, R. D., Burleigh, K., Dey, A., et al. 2016, AAS Meeting, 228, 317.01
- Bothun et al. (1991) Bothun, G. D., Impey, C. D., & Malin, D. F. 1991, ApJ, 376, 404
- Bouché et al. (2015) Bouché, N., Carfantan, H., Schroetter, I., Michel-Dansac, L., & Contini, T. 2015, AJ, 150, 92
- Brodie et al. (2011) Brodie, J. P., Romanowsky, A. J., Strader, J., & Forbes, D. A. 2011, AJ, 142, 199
- Bruzual & Charlot (2003) Bruzual, G., & Charlot, S. 2003, MNRAS, 344, 1000
- Canizares et al. (1986) Canizares, C. R., Donahue, M. E., Trinchieri, G., Stewart, G. C., & McGlynn, T. A. 1986, ApJ, 304, 312
- Ceccarelli et al. (2012) Ceccarelli, L., Herrera-Camus, R., Lambas, D. G., Galaz, G., & Padilla, N. D. 2012, MNRAS, 426, L6
- Chincarini et al. (1976) Chincarini, G., & Rood, H. J. 1976, PASP, 88, 388
- Di Cintio et al. (2017) Di Cintio, A., Brook, C. B., Dutton, A. A., et al. 2017, MNRAS, 466, L1
- Da Rocha et al. (2005) Da Rocha, C. & Mendes de Oliveira, C. 2005, MNRAS, 364, 1069
- Falco et al. (1999) Falco, E. E., Kurtz, M. J., Geller, M. J., et al. 1999, PASP, 111, 438
- Fliri & Trujillo (2016) Fliri, J., & Trujillo, I. 2016, MNRAS, 456, 1359
- Freyhammer et al. (2001) Freyhammer, L. M., Andersen, M. I., Arentoft, T., Sterken, C., & Nørregaard, P. 2001, Experimental Astronomy, 12, 147
- Fukugita et al. (1996) Fukugita, M., Ichikawa, T., Gunn, J. E., et al. 1996, AJ, 111, 1748
- Gavazzi et al. (2005) Gavazzi, G., Donati, A., Cucciati, O., et al. 2005, A&A, 430, 411
- Geller et al. (2012) Geller, M. J., Diaferio, A., Kurtz, M. J., Dell’Antonio, I. P., & Fabricant, D. G. 2012, AJ, 143, 102
- Giovanelli et al. (2005) Giovanelli, R., Haynes, M. P., Kent, B. R., et al. 2005, AJ, 130, 2598
- Girardi et al. (1998) Girardi, M., Giuricin, G., Mardirossian, F., Mezzetti, M., & Boschin, W. 1998, ApJ, 505, 74
- Graham & Driver (2005) Graham, A. W., & Driver, S. P. 2005, PASA, 22, 118
- Haynes et al. (2011) Haynes, M. P., Giovanelli, R., Martin, A. M., et al. 2011, AJ, 142, 170
- Hickson et al. (1992) Hickson, P., Mendes de Oliveira, C., Huchra, J. P., & Palumbo, G. G. 1992, ApJ, 399, 353
- Huchtmeier et al. (2000) Huchtmeier, W. K., Verdes-Montenegro, L., Yun, M., del Olmo, A., & Perea, J. 2000, in IAU Colloq. 174: Small Galaxy Groups, ed.M.J.Valtonen & C.Flynn (San Francisco,CA: ASP),154
- Iglesias-Páramo & Vílchez (1997) Iglesias-Páramo, J., & Vílchez, J. M. 1997, ApJ, 489, L13
- Iglesias-Páramo & Vílchez (1998) Iglesias-Páramo, J., & Vílchez, J. M. 1998, AJ, 115, 1791
- Iglesias-Páramo & Vílchez (2001) Iglesias-Páramo, J., & Vílchez, J. M. 2001, ApJ, 550, 204
- Impey et al. (1988) Impey, C., Bothun, G., & Malin, D. 1988, ApJ, 330, 634
- Impey et al. (1996) Impey, C. D., Sprayberry, D., Irwin, M. J., & Bothun, G. D. 1996, ApJS, 105, 209
- Impey & Bothun (1997) Impey, C., & Bothun, G. 1997, ARA&A, 35, 267
- Impey et al. (2001) Impey, C., Burkholder, V., & Sprayberry, D. 2001, AJ, 122, 2341
- Janowiecki et al. (2015) Janowiecki, S., Leisman, L., Józsa, G., et al. 2015, ApJ, 801, 96
- Janssens et al. (2017) Janssens, S., Abraham, R., Brodie, J., et al. 2017, ApJ, 839, L17
- Koch et al. (2017) Koch, A., Black, C. S., Rich, R. M., et al. 2017, Astronomische Nachrichten, 338, 503
- Koda et al. (2015) Koda, J., Yagi, M., Yamanoi, H., & Komiyama, Y. 2015, ApJ, 807, L2
- Leisman et al. (2017) Leisman, L., Haynes, M. P., Janowiecki, S., et al. 2017, ApJ, 842, 133
- Levy et al. (2007) Levy, L., Rose, J. A., van Gorkom, J. H., & Chaboyer, B. 2007, AJ, 133, 1104
- Martínez-Delgado et al. (2016) Martínez-Delgado, D., Läsker, R., Sharina, M., et al. 2016, AJ, 151, 96
- Merritt et al. (2016) Merritt, A., van Dokkum, P., Danieli, S., et al. 2016, ApJ, 833, 168
- Mihos et al. (2015) Mihos, J. C., Durrell, P. R., Ferrarese, L., et al. 2015, ApJ, 809, L21
- Muñoz et al. (2015) Muñoz, R. P., Eigenthaler, P., Puzia, T. H., et al. 2015, ApJ, 813, L15
- Noonan (1981) Noonan, T. W. 1981, ApJS, 45, 613
- O’Neil et al. (1997) O’Neil, K., Bothun, G. D., & Cornell, M. E. 1997, AJ, 113, 1212
- Ordenes-Briceño et al. (2016) Ordenes-Briceño, Y., Taylor, M. A., Puzia, T. H., et al. 2016, MNRAS, 463, 1284
- Peng et al. (2002) Peng, C. Y., Ho, L. C., Impey, C. D., & Rix, H.-W. 2002, AJ, 124, 266
- Peng & Lim (2016) Peng, E. W., & Lim, S. 2016, ApJ, 822, L31
- Ponman et al. (1996) Ponman, T. J., Bourner, P. D. J., Ebeling, H., et al. 1996, MNRAS, 283, 690
- Randall et al. (2009) Randall, S. W., Jones, C., Kraft, R., Forman, W. R., & O’Sullivan, E. 2009, ApJ, 696, 1431
- Richter & Huchtmeier (1982) Richter, O.-G., & Huchtmeier, W. K. 1982, A&A, 109, 155
- Rodrigue et al. (1995) Rodrigue, M., Schultz, A., Thompson, J., et al. 1995, AJ, 109, 2362
- Román & Trujillo (2017a) Román, J., & Trujillo, I. 2017, MNRAS, 468, 703
- Román & Trujillo (2017b) Román, J., & Trujillo, I. 2017, MNRAS, 468, 4039
- Rood & Struble (1994) Rood, H. J., & Struble, M. F. 1994, PASP, 106, 413
- Smith Castelli et al. (2016) Smith Castelli, A. V., Faifer, F. R., & Escudero, C. G. 2016, A&A, 596, A23
- Taylor et al. (2011) Taylor, E. N., Hopkins, A. M., Baldry, I. K., et al. 2011, MNRAS, 418, 1587
- Teimoorinia et al. (2017) Teimoorinia, H., Ellison, S. L., & Patton, D. R. 2017, MNRAS, 464, 3796
- Thomas et al. (2005) Thomas, D., Maraston, C., Bender, R., & Mendes de Oliveira, C. 2005, ApJ, 621, 673
- Trujillo et al. (2017) Trujillo, I., Roman, J., Filho, M., & Sánchez Almeida, J. 2017, ApJ, 836, 191
- Valtchanov et al. (1999) Valtchanov, I., Kalinkov, M., & Kuneva, I. 1999, in Proc. Int. Conf. on Numerical Astrophysics, ed. S.M. Miyama, K.Tomisaka, & T. Hanawa (Boston, MA: Kluwer Academic),59
- van der Burg et al. (2016) van der Burg, R. F. J., Muzzin, A., & Hoekstra, H. 2016, A&A, 590, A20
- van der Wel et al. (2014) van der Wel, A., Chang, Y.-Y., Bell, E. F., et al. 2014, ApJ, 792, L6
- van Dokkum et al. (2016) van Dokkum, P., Abraham, R., Brodie, J., et al. 2016, ApJ, 828, L6
- van Dokkum et al. (2017) van Dokkum, P., Abraham, R., Romanowsky, A. J., et al. 2017, ApJ, 844, L11
- van Dokkum et al. (2015a) van Dokkum, P. G., Abraham, R., Merritt, A., et al. 2015, ApJ, 798, L45
- van Dokkum et al. (2015b) van Dokkum, P. G., Romanowsky, A. J., Abraham, R., et al. 2015, ApJ, 804, L26
- Verdes-Montenegro et al. (1997) Verdes-Montenegro, L., Yun, M., Perea, J., & del Olmo, A. 1997, in ASP Conf. 117, Dark and Visible Matter in Galaxies and Cosmological Implications, ed. M. Persic & P. Salucci (San Francisco, CA: ASP),530
- Yagi et al. (2016) Yagi, M., Koda, J., Komiyama, Y., & Yamanoi, H. 2016, ApJS, 225, 11
- Yozin & Bekki (2015) Yozin, C., & Bekki, K. 2015, MNRAS, 452, 937
- Zhang et al. (2013) Zhang, H.-H., Liu, X.-W., Yuan, H.-B., et al. 2013, Research in Astronomy and Astrophysics, 13, 490
- Zhang et al. (2014) Zhang, H.-H., Liu, X.-W., Yuan, H.-B., et al. 2014, Research in Astronomy and Astrophysics, 14, 456
- Zhong et al. (2008) Zhong, G. H., Liang, Y. C., Liu, F. S., et al. 2008, MNRAS, 391, 986
Here we present additional technical details of our data analysis.
Figure A.1 shows the PSF FWHM map for the - and -band mosaic science images. It is shown that the PSF varies over our wide-field region in the sense that it increases from the center to the edges. We use point sources to fit a third-order polynomial and build up the maps. The typical PSF FWHM is 4 and 3 at the center region of the - and -band mosaicked image, respectively.
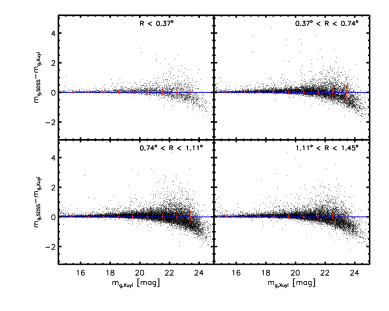
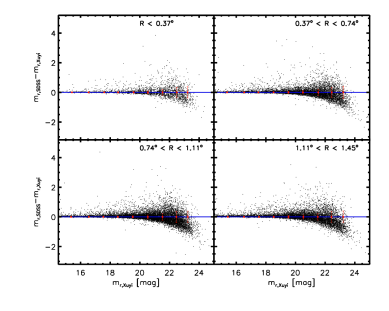
Figure A.2 shows a comparison of our - and -band photometry with the SDSS for bright stars (1418 mag) in different annular regions of the FOV. We divide our area into four annular regions, including , , and . Our photometry is in agreement with the photometric magnitude of the SDSS.
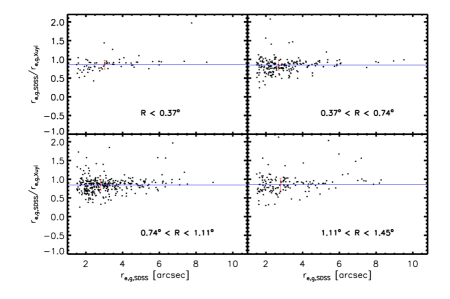
In Figure A.3 we compare the half-light radius of bright galaxies (1519 mag) in the different annular regions from the center to the edges. We also divide our area into four annular regions, including , , and . We use the SDSS half-light radius of bright galaxies (1519 mag) to calibrate our measurements. The top four panels of Figure A.3 show the comparison of the observed half-light radius without PSF correction. It is clearly seen that the PSF effect on the measurement of the half-light radius becomes larger for more compact objects with . Some outliers are mainly affected by the contamination of scattered light and the asterism from saturation stars. The bottom panels show the measurements of the half-light radius corrected for PSF. The median ratio of half-light radius between the SDSS and Xuyi is 0.85, the dispersion is 0.16. This discrepancy is likely caused by the systematic effects related to pixel scale and instrumental effects. The size of the PSF () is about in the -band mosaicked image. We therefore use the PSF-corrected half-light radius to calculate the central surface brightness for selecting UDGs (see Section 3), although the measurement errors are relatively large.
Table A.1 lists the catalog of our selected UDGs in the HCG 95 field. We assume that 89 extremely LSB galaxies are spatially separated members of the clusters Pegasus I and Pegasus II cluster. Finally, we pick out 32 very LSB galaxies (with a size is smaller than 1.5 kpc), 12 plausible UDGs, and 45 UDGs at the distance of the clusters Pegasus I and Pegasus II, respectively. The properties of these candidates are shown in Table A.1. Fortunately, 84 of the 89 very LSB galaxies are detected in deep -band images by DECaLS. The magnitudes and half-light radii of the 84 candidates are listed in Table A.1. We use brackets to represent the lower size limits because some UDGs have very low signal-to-noise at -band image.

| ID | R.A. | Decl. | re | DECaLs() | DECaLs(r) | ||||
|---|---|---|---|---|---|---|---|---|---|
| (J2000.0) | (J2000.0) | (mag arcsec-2) | (kpc) | (mag) | (mag) | (mag) | (kpc) | ||
| PegI-LSBG01 | 23:19:03.6 | 8:23:15 | 26.36 | 1.38 | 12.29 | 0.90 | 0.49 | 21.24 | [0.49] |
| PegI-LSBG02 | 23:18:35.6 | 8:23:39 | 24.58 | 0.97 | 13.61 | 0.94 | 0.65 | 18.93 | 0.78 |
| PegI-LSBG03 | 23:19:43.8 | 8:26:23 | 24.00 | 0.93 | 14.03 | 0.80 | 0.48 | 18.57 | 0.78 |
| PegI-LSBG04 | 23:17:49.9 | 8:28:05 | 25.13 | 1.32 | 13.60 | 0.82 | 0.67 | 19.18 | 0.80 |
| PegI-LSBG05 | 23:20:46.9 | 8:28:29 | 24.88 | 1.32 | 13.69 | 0.72 | 0.75 | 19.46 | 0.72 |
| PegI-LSBG06 | 23:18:28.1 | 8:28:58 | 26.45 | 1.33 | 12.46 | 0.97 | 0.53 | 21.77 | [0.36] |
| PegI-LSBG07 | 23:19:11.9 | 8:33:32 | 25.09 | 0.91 | 12.78 | 0.79 | 0.64 | 20.39 | [0.50] |
| PegI-LSBG08 | 23:20:37.4 | 8:35:26 | 24.29 | 1.21 | 13.80 | 0.55 | 0.53 | 19.04 | 0.64 |
| PegI-LSBG09 | 23:21:45.5 | 8:37:41 | 25.02 | 0.86 | 12.25 | 0.51 | 0.74 | 20.49 | [0.32] |
| PegI-LSBG10 | 23:20:13.1 | 8:39:31 | 24.58 | 1.24 | 13.59 | 0.56 | 0.72 | 18.97 | 0.71 |
| PegI-LSBG11 | 23:21:10.6 | 8:39:45 | 24.10 | 1.06 | 13.52 | 0.46 | 0.60 | 19.11 | 0.63 |
| PegI-LSBG12 | 23:22:08.4 | 8:41:60 | 24.27 | 0.56 | 12.26 | 0.61 | 0.39 | 21.22 | [0.27] |
| PegI-LSBG13 | 23:18:22.2 | 8:42:53 | 25.41 | 0.65 | 11.73 | 0.81 | 0.67 | 21.89 | [0.19] |
| PegI-LSBG14 | 23:19:47.0 | 8:42:33 | 24.62 | 1.01 | 13.55 | 0.84 | 0.67 | 19.00 | 0.74 |
| PegI-LSBG15 | 23:21:22.9 | 8:43:11 | 26.32 | 1.05 | 11.99 | 0.89 | 0.96 | 22.05 | [0.19] |
| PegI-LSBG16 | 23:22:55.7 | 8:44:46 | 25.74 | 1.07 | 11.99 | 0.51 | 0.41 | 21.52 | [0.25] |
| PegI-LSBG17 | 23:22:09.1 | 8:48:49 | 25.56 | 1.01 | 12.01 | 0.49 | 0.93 | 21.15 | [0.36] |
| PegI-LSBG18 | 23:23:24.5 | 8:50:49 | 25.31 | 0.86 | 12.21 | 0.60 | 0.57 | 21.34 | [0.28] |
| PegI-LSBG19 | 23:20:13.5 | 8:54:31 | 24.25 | 0.95 | 13.66 | 0.53 | 0.75 | 18.94 | 0.71 |
| PegI-LSBG20 | 23:22:58.0 | 8:54:43 | 24.00 | 0.89 | 13.88 | 0.78 | 0.64 | 18.79 | 0.69 |
| PegI-LSBG21 | 23:22:10.7 | 8:56:52 | 25.83 | 1.00 | 12.04 | 0.65 | 0.82 | 21.23 | [0.27] |
| PegI-LSBG22 | 23:23:59.3 | 8:57:03 | 25.76 | 0.95 | 12.04 | 0.68 | 0.89 | 20.91 | [0.23] |
| PegI-LSBG23 | 23:23:00.8 | 8:59:56 | 24.92 | 1.01 | 13.11 | 0.75 | 0.67 | 19.87 | 0.74 |
| PegI-LSBG24 | 23:21:36.2 | 9:03:41 | 24.14 | 0.88 | 13.47 | 0.66 | 0.76 | 19.60 | 0.61 |
| PegI-LSBG25 | 23:22:28.3 | 9:04:19 | 24.05 | 0.94 | 13.74 | 0.54 | 0.65 | 19.35 | 0.55 |
| PegI-LSBG26 | 23:20:41.8 | 9:09:02 | 24.55 | 0.97 | 12.92 | 0.50 | 0.75 | 20.37 | [0.45] |
| PegI-LSBG27 | 23:24:25.3 | 9:12:22 | 24.02 | 0.98 | 14.14 | 0.88 | 0.34 | 19.00 | 0.74 |
| PegI-LSBG28 | 23:22:44.7 | 9:19:52 | 24.17 | 0.82 | 13.64 | 0.92 | 0.27 | 19.71 | 0.51 |
| PegI-LSBG29 | 23:21:39.5 | 9:21:36 | 24.33 | 1.04 | 13.92 | 0.86 | 0.42 | 18.98 | 0.75 |
| PegI-LSBG30 | 23:23:36.9 | 9:37:48 | 25.84 | 0.76 | 11.62 | 0.80 | 0.38 | 21.61 | [0.28] |
| PegI-LSBG31 | 23:23:46.8 | 9:43:59 | 24.11 | 0.94 | 13.24 | 0.46 | 0.72 | 19.55 | 0.46 |
| PegI-LSBG32 | 23:24:04.5 | 9:44:43 | 25.20 | 1.15 | 13.32 | 0.90 | 0.41 | 20.31 | [0.43] |
| PegI-UDG01 | 23:20:04.9 | 8:21:29 | 24.43 | 1.65 | 14.31 | 0.53 | 0.70 | 18.21 | 0.88 |
| PegI-UDG02 | 23:21:07.3 | 8:23:44 | 25.02 | 1.93 | 14.11 | 0.56 | 0.69 | 18.93 | 0.89 |
| PegI-UDG03 | 23:21:57.3 | 8:26:27 | 25.51 | 2.75 | 14.85 | 0.85 | 0.69 | 20.15 | [0.49] |
| PegI-UDG04 | 23:21:34.4 | 8:28:39 | 25.28 | 2.49 | 14.66 | 0.71 | 0.83 | 18.72 | 1.16 |
| PegI-UDG05 | 23:21:34.6 | 8:29:26 | 24.67 | 2.44 | 15.29 | 0.77 | 0.76 | 17.40 | 1.68 |
| PegI-UDG06 | 23:20:20.8 | 8:33:05 | 24.38 | 1.61 | 14.80 | 0.85 | 0.71 | 17.99 | 0.97 |
| PegI-UDG07 | 23:19:57.8 | 8:33:19 | 24.47 | 1.55 | 14.39 | 0.68 | 0.57 | 18.64 | 0.80 |
| PegI-UDG08 | 23:18:52.5 | 8:40:47 | 24.08 | 1.88 | 14.96 | 0.55 | 0.58 | 17.93 | 1.17 |
| PegI-UDG09 | 23:19:39.5 | 8:42:32 | 25.45 | 1.51 | 13.13 | 0.69 | 0.80 | 20.40 | [0.61] |
| PegI-UDG10 | 23:21:01.4 | 8:50:02 | 26.19 | 1.86 | 13.20 | 0.75 | 0.63 | 21.09 | [0.53] |
| PegI-UDG11 | 23:21:41.1 | 9:07:12 | 24.33 | 1.99 | 15.21 | 0.77 | 0.52 | 17.51 | 1.51 |
| PegI-UDG12 | 23:23:59.5 | 9:51:18 | 24.55 | 2.33 | 15.19 | 0.67 | 0.58 | 18.36 | 1.02 |
| PegII-UDG01 | 23:17:07.0 | 8:39:06 | 25.88 | 2.92 | 14.27 | 0.59 | 0.23 | 20.25 | [1.20] |
| PegII-UDG02 | 23:16:13.6 | 8:44:13 | 24.31 | 1.70 | 15.19 | 0.94 | 0.73 | 20.12 | [1.44] |
| PegII-UDG03 | 23:16:04.3 | 8:48:15 | 24.57 | 1.93 | 15.04 | 0.79 | 0.15 | 20.93 | [0.91] |
| PegII-UDG04 | 23:16:08.6 | 8:53:56 | 25.29 | 3.44 | 15.28 | 0.66 | 0.63 | 19.88 | 1.92 |
| PegII-UDG05 | 23:18:09.2 | 8:53:30 | 24.02 | 2.06 | 15.34 | 0.43 | 0.58 | 20.42 | [1.11] |
| PegII-UDG06 | 23:17:20.7 | 8:59:08 | 25.18 | 2.26 | 14.67 | 0.78 | 0.40 | 21.24 | [0.66] |
| PegII-UDG07 | 23:15:17.5 | 8:59:35 | 24.00 | 3.14 | 16.29 | 0.56 | 0.40 | 19.14 | 1.90 |
| PegII-UDG08 | 23:16:18.1 | 9:01:14 | 24.07 | 4.20 | 16.94 | 0.60 | 0.47 | 18.85 | 2.47 |
| PegII-UDG09 | 23:14:57.6 | 9:04:59 | 25.57 | 4.23 | 15.47 | 0.54 | 0.74 | 20.40 | [1.11] |
| PegII-UDG10 | 23:20:11.7 | 9:18:27 | 24.0 | 3.64 | 16.95 | 0.76 | 0.40 | 18.50 | 2.59 |
| PegII-UDG11 | 23:15:28.6 | 9:18:45 | 24.83 | 4.40 | 16.38 | 0.71 | 0.57 | ||
| PegII-UDG12 | 23:18:02.2 | 9:20:18 | 24.01 | 1.61 | 15.06 | 0.71 | 0.57 | 20.63 | [1.09] |
| PegII-UDG13 | 23:18:56.0 | 9:20:18 | 25.08 | 2.97 | 15.22 | 0.65 | 0.37 | 21.09 | [1.49] |
| PegII-UDG14 | 23:18:58.2 | 9:21:41 | 24.0 | 2.49 | 16.20 | 0.78 | 0.70 | 19.01 | 1.99 |
| PegII-UDG15 | 23:18:10.2 | 9:27:13 | 24.09 | 3.33 | 16.23 | 0.54 | 0.72 | 19.07 | 1.40 |
| PegII-UDG16 | 23:20:36.8 | 9:30:02 | 25.04 | 2.36 | 14.92 | 0.75 | 0.69 | 20.15 | [1.56] |
| PegII-UDG17 | 23:17:44.9 | 9:29:38 | 24.00 | 3.79 | 17.07 | 0.72 | 0.48 | 18.44 | 3.05 |
| PegII-UDG18 | 23:17:34.4 | 9:30:16 | 25.36 | 2.74 | 15.02 | 0.82 | 0.40 | 20.92 | [1.42] |
| PegII-UDG19 | 23:19:21.5 | 9:30:14 | 24.12 | 2.94 | 16.27 | 0.88 | 0.40 | 19.02 | 2.26 |
| PegII-UDG20 | 23:18:32.5 | 9:31:54 | 24.04 | 3.34 | 16.57 | 0.58 | 0.56 | 19.63 | 1.58 |
| PegII-UDG21 | 23:20:22.6 | 9:32:58 | 24.48 | 2.28 | 15.14 | 0.58 | 0.44 | 20.40 | [1.60] |
| PegII-UDG22 | 23:17:38.8 | 9:33:26 | 24.00 | 2.31 | 15.90 | 0.74 | 0.55 | 19.27 | 2.21 |
| PegII-UDG23aaH95F = PegII-UDG25 | 23:19:29.0 | 9:33:31 | 24.05 | 3.41 | 16.69 | 0.74 | 0.28 | 20.10 | [1.25] |
| PegII-UDG24 | 23:18:10.1 | 9:35:14 | 24.53 | 2.85 | 15.84 | 0.76 | 0.66 | 19.41 | 1.80 |
| PegII-UDG25 | 23:22:19.5 | 9:37:07 | 24.43 | 5.66 | 17.15 | 0.52 | 0.36 | 18.65 | 3.23 |
| PegII-UDG26 | 23:14:41.4 | 9:39:07 | 24.15 | 1.74 | 14.82 | 0.55 | 0.74 | 21.57 | [0.85] |
| PegII-UDG27 | 23:14:50.4 | 9:39:02 | 25.32 | 3.36 | 14.82 | 0.60 | 0.68 | 22.22 | [0.73] |
| PegII-UDG28 | 23:20:36.5 | 9:40:16 | 25.56 | 2.98 | 14.53 | 0.53 | 0.83 | ||
| PegII-UDG29 | 23:21:31.6 | 9:42:09 | 24.32 | 4.11 | 16.56 | 0.58 | 0.70 | 19.06 | 1.84 |
| PegII-UDG30 | 23:21:02.0 | 9:45:17 | 24.34 | 2.97 | 15.86 | 0.58 | 0.76 | 20.35 | [1.58] |
| PegII-UDG31 | 23:18:04.1 | 9:50:29 | 24.38 | 3.15 | 16.39 | 0.89 | 0.56 | 19.28 | 1.87 |
| PegII-UDG32 | 23:17:45.4 | 9:50:43 | 24.22 | 1.73 | 14.86 | 0.65 | 0.99 | 21.18 | [1.10] |
| PegII-UDG33 | 23:17:40.1 | 9:50:51 | 24.16 | 2.87 | 16.12 | 0.68 | 0.80 | 19.22 | 1.79 |
| PegII-UDG34 | 23:17:27.7 | 9:52:12 | 24.13 | 2.67 | 15.92 | 0.64 | 0.52 | 19.69 | 1.77 |
| PegII-UDG35 | 23:17:08.8 | 9:53:55 | 24.00 | 3.50 | 17.11 | 0.98 | 0.58 | ||
| PegII-UDG36 | 23:22:24.7 | 9:54:15 | 24.80 | 4.04 | 16.28 | 0.84 | 0.59 | 19.24 | 1.66 |
| PegII-UDG37 | 23:22:08.2 | 9:54:47 | 24.20 | 4.11 | 17.14 | 0.89 | 0.39 | 18.97 | 2.29 |
| PegII-UDG38 | 23:18:56.3 | 9:55:18 | 24.04 | 3.37 | 16.37 | 0.55 | 0.46 | 19.20 | 1.92 |
| PegII-UDG39 | 23:23:59.5 | 10:11:01 | 24.07 | 3.30 | 16.49 | 0.67 | 0.47 | 18.79 | 1.95 |
| PegII-UDG40 | 23:20:10.9 | 10:16:12 | 25.22 | 3.85 | 15.68 | 0.67 | 0.53 | 20.07 | [1.42] |
| PegII-UDG41 | 23:21:35.6 | 10:17:56 | 24.50 | 3.86 | 16.22 | 0.56 | 0.62 | ||
| PegII-UDG42 | 23:22:00.3 | 10:21:12 | 24.38 | 2.73 | 16.16 | 0.96 | 0.46 | 19.00 | 2.02 |
| PegII-UDG43 | 23:20:28.5 | 10:28:12 | 24.44 | 2.94 | 15.90 | 0.69 | 0.64 | 19.81 | 1.65 |
| PegII-UDG44 | 23:18:10.6 | 10:33:50 | 25.01 | 3.04 | 15.37 | 0.66 | 0.60 | ||
| PegII-UDG45 | 23:18:43.5 | 10:35:40 | 24.14 | 2.06 | 15.38 | 0.65 | 0.39 | 20.32 | [1.56] |