Multiple crossovers and coherent states in a Mott-Peierls insulator
Abstract
We consider the dimer Hubbard model within Dynamical Mean Field Theory to study the interplay and competition between Mott and Peierls physics. We describe the various metal-insulator transition lines of the phase diagram and the break down of the different solutions that occur along them. We focus on the specific issue of the debated Mott-Peierls insulator crossover and describe the systematic evolution of the electronic structure across the phase diagram. We found that at low intra-dimer hopping the emerging local magnetic moments can unbind above a characteristic singlet temperature . Upon increasing the inter-dimer hopping subtle changes occur in the electronic structure. Notably, we find Hubbard bands of a mix character with coherent and incoherent excitations. We argue that this state is relevant for VO2 and its signatures may be observed in spectroscopic studies, and possibly through pump-probe experiments.
I Introduction
Vanadates are fascinating materials that provide a fertile playground to study non-trivial phase transitions driven by the electronic correlation. Their structures follow the Magnéli series VnO2n-1 and most of them exhibit insulator to metal transitions (IMT) upon heating. Significantly, these transitions involve a structural change but are disconnected to magnetic ordering, with the exception of the most famous members of the series, V2O3 and VO2. In the former the magnetic and structural transition occur at the same temperature, while in the latter there is a structural transition but no magnetic ordering at any temperature.
Vanadium dioxide is particularly appealing because its transition occurs close to room temperature, around 340K, so it may enable practical applications in novel electronic devices inoue2008_taming_mott_transition_novel_mott_transistor ; stoliar2017_leaky_integrate_and_fire_neuron . In fact, the study of this material is receiving a great deal of attention. Therefore, a basic understanding of the nature of its electronic state and its insulator to metal transition (IMT) is of great importance.
VO2 may be considered a realization of a Mott system, as it has only one electron per vanadium atom which should lead to a partially filled band. However, since it exhibits a non-magnetic insulating ground state, this classification has often been challenged. In fact, in an influential early paper, Goodenough goodenough1960_direct_cation_interactions_several_oxides argued that the first order IMT occurs concomitant with a structural distortion of the vanadium chains in the crystal, so the gap opening upon cooling should be due to a Peierls lattice instability. Nevertheless, Density Functional Theory (DFT) calculations failed to substantiate Goodenough’s claim wentzcovitch1994_vo ; eyert2002_metal_insulator_transitions_vo2 so the nature of the insulating state in VO2 remained a puzzle. The development of methods that incorporate strong correlation effects in realistic lattice calculations provided new light. Eventually, Biermann et al. showed using Cluster Dynamical Mean Field Theory (CDMFT) with DFT that strong correlations due to local Coulomb repulsion may lead to the opening of a gap biermann2005_dynamical_singlets_correlation_assisted_peierls_transition_invo2 ; tomczak2008_effective_bandstructure_insulating_phase_versus . Hence, the ground state was considered a “Peierls insulator with dynamical correlations”. This theoretical problem continued to attract theoretical attention as the numerical techniques were further improved. Weber et al. weber2012_vanadium_dioxide argued that the mechanism driving the insulator state was better characterized as a “Peierls assisted orbitally selective Mott transition”. They observed that mainly the a1g orbital drives the opening of the gap. A more recent study where the oxygen atoms were explicitly included brito2016_metal_insulator_transition_in_vo enabled a more comprehensive account of the various phases observed in VO2. However, it also led to the reinterpretation of the transition as a “Mott transition in the presence of strong intersite exchange”. We should also mention here the work by Eyert, whose calculations based on hybrid functionals eyert2011_vo2_novel_view may also open a gap in the monoclinic phase.
While the technical improvements of the computational methods of realistic correlated materials made significant steps forward in our understanding of the electronic states, it is also true that their technical complexity represents a challenge. For instance, despite multiple studies dedicated to this material biermann2005_dynamical_singlets_correlation_assisted_peierls_transition_invo2 ; belozerov2012_monoclinic_m_phase_vo ; weber2012_vanadium_dioxide ; brito2016_metal_insulator_transition_in_vo some basic issues remain unaccounted for, such as the existence of a first order thermally driven insulator-metal transition just above room temperature. Finite temperature studies are in principle beyond the applicability of DFT methods although we should point out the recent work of Plašienka et al. plasienka2017_ab_initio_molecular_dynamics_study . We investigated the issue of a first order IMT in VO2 in a recent paper najera2017_resolving_vo2_controversy employing a model Hamiltonian approach within CDMFT. Although the model is rather schematic, namely, a lattice of correlated dimers, it was intended to qualitatively capture the dimerization-delocalization competition in the monoclinic phase of VO2. We showed that adopting model parameters relevant for VO2 there is a thermally driven first order Mott transition that occurs at a temperature range compatible with the experimental observation. Moreover, we have also provided an interpretation to the puzzling presence of a mid-infrared peak in the optical conductivity of metallic nano-size islands observed during the transition qazilbash2007_mott_transition_vo2_revealed_by in terms of a novel correlated “monoclinic” metal najera2017_resolving_vo2_controversy . Model Hamiltonians that capture the key ingredients are also attractive for experimentalist as they provide useful insights within a more intuitive yet non-trivial physical framework for strongly interacting systems.
In the present paper we continue with this strategy and make new inroads into the investigation of the nature of the insulator and metallic states realized in the Dimer Hubbard Model (DHM) within CDMFT. Specifically we address the issue on the physical characterization of the insulator state. A key feature of our approach is to observe that the quantum impurity problem of the DHM has the same form as the respective quantum impurity problem of the DFT+CDMFT method on realistic lattices. In fact, we shall see that our model solution does capture in a simpler context several features already seen in DFT+CDMFT studies tomczak2007_effective_band_structure_correlated_materials ; tomczak2008_effective_bandstructure_insulating_phase_versus , such as the presence of renormalized coherent bands in the insulator.
The model Hamiltonian approach enables the systematic investigation of the whole parameter space, which sheds light on the interplay of physical mechanisms. We shall address the question of the physical crossover from a pure Peierls insulator, which is a band insulator of a lattice of dimers without correlations, to the pure (un-dimerized) correlated Mott insulator. We shall see that the behavior of the system across the crossover regime is non-trivial. One of our main results is that as the system evolves from the Mott to the Peierls insulator there are at least four different regimes, including an unprecedented state where the Hubbard bands have an electronic structure with mixed coherent and incoherent character. Interestingly, VO2 seems to be in this peculiar regime, which might eventually be seen in spectroscopy experiments. On the other hand, we also investigated the correlated “monoclinic” metallic state and show that it can be understood in simple terms as a renormalized two-band heavy metal at low frequencies. Interestingly, indications of a monoclinic metal in VO2 have been reported in several experimental studies kim2006_monoclinic_correlated_metal_phase_invo2as ; arcangeletti2007_evidence_pressure_induced_metallization_process ; qazilbash2011_nanoscale_imaging_electronic_structural_transitions_vanadium_dioxide ; tao2012_decoupling_structural_electronic_phase_transitions_invo2 ; yoshida2014_ultrafast_photoinduced_transition_insulating_vo ; morrison2014_photoinduced_metal_like_phase_monoclinic ; laverock2014_direct_observation_decoupled_structural_electronic ; wegkamp2014_instantaneous_band_gap_collapse_photoexcited .
Consistent with the DFT+CDMFT studies, we find that VO2 should be characterized as a realization of a Mott state in a dimer lattice rather than a renormalized Peierls band insulator. However, in a larger perspective, our systematic investigation of the model parameter space should also shed light for the classification of a variety of monoclinic transition metal oxide systems with the MO2 formula hiroi2015_structural_instability_rutile_compounds and the non-magnetic insulator states of other vanadates.
This paper is organized as follows: In Section II we introduce the DHM and the DMFT equations. We also describe a simple parametrization of a renormalized two band model that will be useful for the discussion of our results. In Section III we present the phase diagram and discuss the various insulator-metal transitions of the model. In particular, we describe the destruction of the correlated metal and the insulator in the Mott regime. In Section IV we present the detailed study of the Mott to Peierls crossover. We characterize the several distinct physical regimes, including one with mixed coherent and incoherent features in the Hubbard bands possibly relevant for VO2. Section V is dedicated to the conclusions of our work.
II The dimer Hubbard model
We focus on the dimer Hubbard Model, which is a basic and natural extension of the single band Hubbard Model.
The DHM reads,
| (1) | ||||
where denotes nearest-neighbor lattice cells, denote the dimer orbitals within a given cell, is the spin, is the lattice (i.e. inter-dimer) hopping and () is the intra-dimer hopping. The parameter is the on-site Coulomb repulsion.
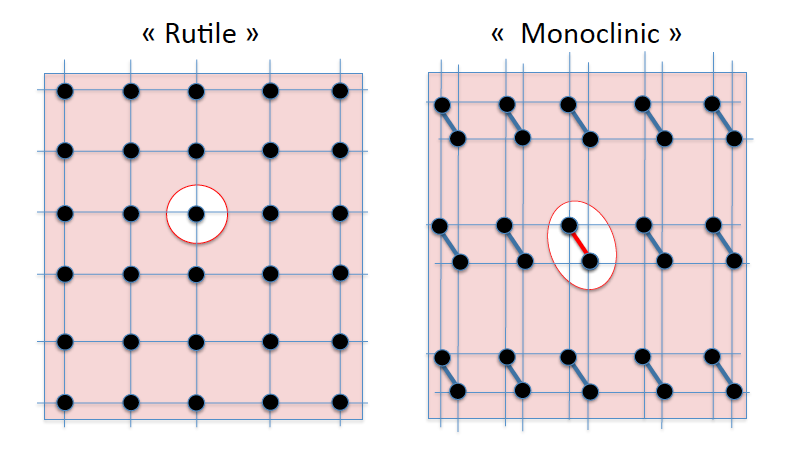
The non-interacting limit of the DHM has two bands which are locally hybridized at every lattice cell site. This leads to the parallel splitting of the two bands by . When this splitting is large enough, the system has a continuous metal insulator transition. We associate this to a Peierls-like mechanism, as it is driven by the increase of the intra-dimer hopping amplitude . It can be ascribed to a schematic representation of the monoclinic distortion in the real material that creates dimers in the unit cell (see Fig. 1). Another way to see this IMT is by starting from the limit, where the local dimers that form a bonding (B) and an anti-bonding (AB) molecular orbital at every 1-2 link. Switching on the inter-dimer hopping, these orbitals lead to an insulating state with two split flat bands. At a large enough (lattice-geometry dependent) value of , the B and AB bands start to overlap and realize a transition into a metal.
Before proceeding, we should avoid any confusion here by noting that the model (1) is fully defined only after its lattice is specified. For instance, if dimers are arranged as a one dimensional system, the model is a “ladder” (the dimer rungs are perpendicular to the direction of the lattice). In two dimensions, as in the schematic Fig. 1, one would get a “bi-layer” model, where the dimer rungs connect at every site two parallel 2D layers. Those systems have qualitatively different behaviors from the one that concerns us here, namely, the physics of the three-dimensional systems such as VO2. In 3D systems that have strong local interactions, one may expect the Dynamical Mean Field Theory (DMFT) to be a reasonable approximation georges1996_dynamical_mean_field_theory_strongly . In fact, DFT+DMFT methods are implicitly based on such an assumption. The DMFT approach to the DHM with a dimer unit cell is, strictly speaking, a cluster-DMFT calculation, possibly the simplest instance of CDMFT. In DMFT and CDMFT it is mathematically convenient and thus customary to adopt a non-interacting semi-circular density of states (DOS), which is realized in a Bethe lattice georges1996_dynamical_mean_field_theory_strongly . In addition, such a DOS qualitatively resembles that of a three-dimensional lattice system. In fact, it has a finite bandwidth given by defined in equation (1). As in previous works, we adopt as unit of energy the half bandwidth . We should emphasize here that the physics of models treated within DMFT in general do not depend on specific geometry of the lattice, but on the nature of the quantum impurity problem. As we mentioned already, the realistic VO2 lattice within DFT+CDMFT has the same type of quantum dimer impurity as in the present case. Our model has the additional simplification of considering one orbital at each site instead of the 3 in the realistic case. We may see in Fig. 1 schematic “rutile” and “monoclinic” lattices. From our previous discussion, the key feature is that in the former case there is a single site in the unit cell, while in the latter case there is a dimer. The “rutile” lattice can be qualitatively associated to a conventional single-band Hubbard model georges1996_dynamical_mean_field_theory_strongly . While the “monoclinic” one can be thought of as two copies of Hubbard models coupled at every unit cell site by the intra-dimer hopping . In the limit of the two copies become independent and one recovers the conventional single site Hubbard model physics georges1996_dynamical_mean_field_theory_strongly ; moeller1999_rkky_interactions_mott_transition ; najera2017_resolving_vo2_controversy . As an additional remark, here we should say that both the single site Hubbard and the Dimer Hubbard models at half filling have anti-ferromagnetic ground-states, which are favored in bipartite lattices. Nevertheless, the study of the MITs within the PM (meta-stable) states is important in its own right as it has been very useful to reveal the physical competition between different correlated states georges1996_dynamical_mean_field_theory_strongly .
II.1 CDMFT equations and the bonding anti-bonding basis
The solution of the CDMFT equations are obtained in terms of the one-particle propagators (with ), which are subject to the self-consistent condition
| (2) |
where is the Pauli matrix and is the local self-energy. The calculation of the local self-energy requires the solution of the so-called local quantum impurity problem, which are often generalizations of the Kondo problem georges1996_dynamical_mean_field_theory_strongly . To solve such a quantum impurity problem requires the numerical implementation of a many-body approach. Following previous work najera2017_resolving_vo2_controversy , here make extensive use of the Iterative Perturbation Theory (IPT) moeller1999_rkky_interactions_mott_transition that allows fast and precise calculations in the whole phase diagram and at all and . Notably, IPT becomes exact in the limits of and or , for all (see Appendix B) and its numerical precision allows for reliable analytic continuation of the data to the real axis. We also benchmarked our IPT calculations with results from other numerical methods such as the continuous time quantum Monte Carlo (CT-QMC) werner2006_hybridization_expansion_impurity_solver ; seth2016_triqs and the exact diagonalization (ED) georges1996_dynamical_mean_field_theory_strongly . The former is a finite calculation and the latter is a one. These methods are both exact up to systematic errors, but are numerically very expensive and have the serious drawback of requiring, in the case of CT-QMC, the analytic continuation of the (noisy) imaginary axis results.
In the present case of half-filling (i.e., one particle per site), particle-hole symmetry holds. We further assume translational invariance and search for a paramagnetic solution. We have then: , and . The self-energies have similar properties. In order to simplify the discussion of the evolution of the electronic structure, it is convenient to consider the B/AB representation that renders the Green’s Functions and Self-energies diagonal.
| (3a) | ||||
| (3b) | ||||
In the B/AB basis the electronic structure of the non-interacting problem is particularly simple. The single particle energies form two parallel bands of bandwidth and are split by , i.e., , where is the single particle energy of the bands for . In the present case, since we employ a semi-circular DOS (realized in a Bethe lattice in infinite dimensions) the lattice single particle energies drop their -dependence georges1996_dynamical_mean_field_theory_strongly and then are simply labeled by georges1996_dynamical_mean_field_theory_strongly . Thus, at finite and , the model DOS is composed of two semicircles split by , .
II.2 The renormalized two band model
In order to better analyze our results in the subsequent sections, it is convenient to introduce here a simple low-energy parametrization of the two-band system. We may think of this as a non-interacting renormalized two-band model (R2B). In a normal (i.e. Fermi liquid) metal the self-energy is well-behaved at low frequencies111The derivation of the R2B formulas and a study of the behavior of the Self-energy in the low frequency regime is presented in appendix A. In the present case we expand around the self-energies of the mean-field equations (2), and introduce a quasiparticle residue :
| (4) |
and a renormalized intra-dimer hopping as:
| (5) |
The DOS of the R2B model then reads,
| (6) |
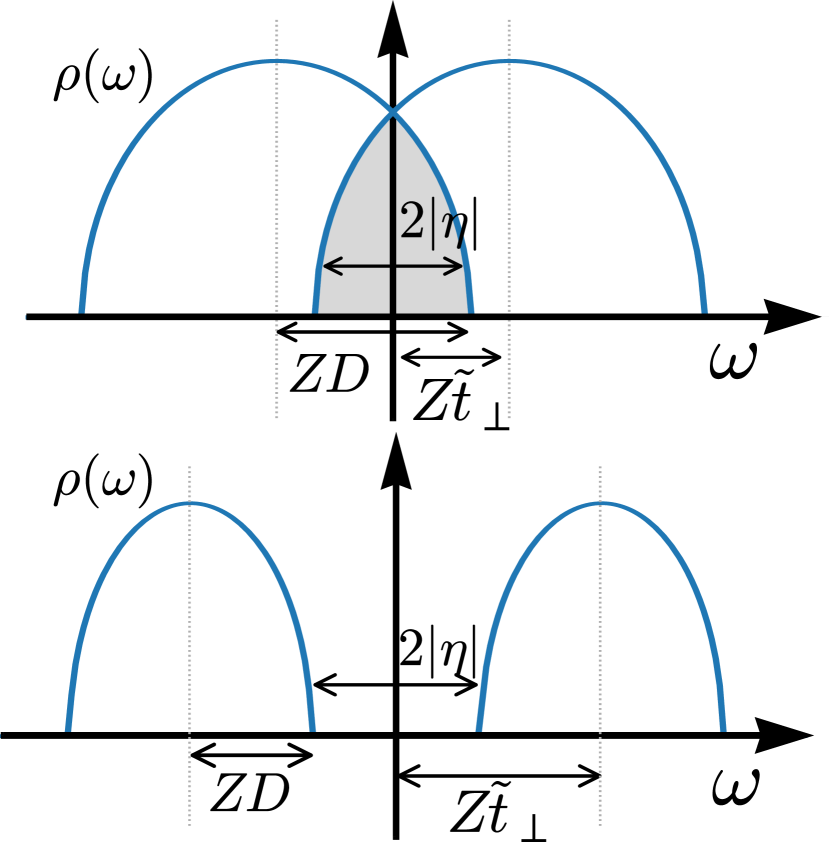
that corresponds to two heavy effective bands with dispersion , where the effective mass renormalization is . The overlap between the two band-edges is given by , where
| (7) |
Thus, for we have a metal state, and for (i.e. splitting dominates) the DOS opens a gap (see Fig. 2). We will use this quantity to describe the metal to insulator transition, in the next section.
The renormalized two-band (R2B) model may describe both metallic and insulating states, so long the remains well-behaved (i.e. linear) according to the parametrization. As it turns out the description will be valid at low frequencies throughout the metallic phase, which is a Fermi liquid. In the insulator, we shall see that it is a good approximation only within the Peierls limit, where the interaction and thus the are small. In the Mott regime this parametrization is not appropriate.
III Phase diagram and insulator-metal transitions
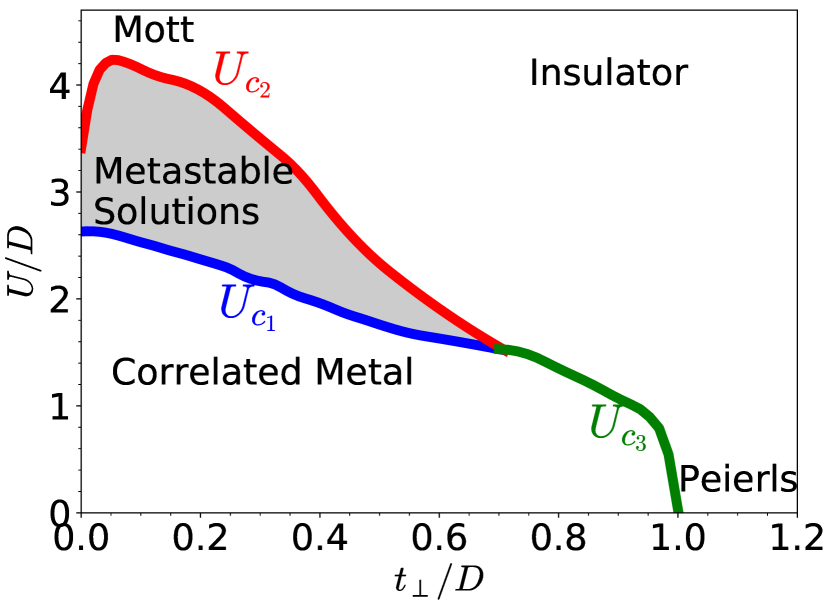
In Fig. 3 we show the phase diagram at , which is well-known from previous studies moeller1999_rkky_interactions_mott_transition ; hafermann2009_metal_insulator_transition_by_suppression_spin_fluctuations ; fuhrmann2006_from_mott_insulator_to_band_insulator ; najera2017_resolving_vo2_controversy . We recall now its main features. There is a metallic phase for , and an insulator phase at high enough . The IMT changes character depending on the value of . At values higher than the transition is continuous (2nd order) along a line indicated in green in Fig. 3. At smaller values of there are two lines and respectively indicated in blue and red in the figure. These are two spinodal lines of the mean field theory self-consistent solution. The metal state is destabilized for whereas the insulator state is destabilized along . Thus, in between the two spinodal lines there are two different solutions of the CDMFT equations, one metallic and one insulating. At finite temperature this coexistence region shrinks, until it disappears at a critical temperature. At higher there is a crossover behavior and bad metal states najera2017_resolving_vo2_controversy . This phase diagram is obtained with IPT but we have validated all its main features by extensive CT-QMC calculations najera2017_resolving_vo2_controversy .
The description of how these transitions take place in this basic model of strongly correlated systems has (rather surprisingly) not been investigated in detail. As we discussed before, this type of impurity model is at the core of calculations of realistic material with a dimer in the unit cell. We shall therefore describe the transitions in detail in the next subsections.
III.1 Metal to insulator transitions across and
The metal to insulator transition by increasing dramatically changes its character as a function of . In Fig. 4 we illustrate this by showing the evolution of the frequency-dependent DOS with increasing , for two representative values and 0.8, that respectively cross the and the lines.
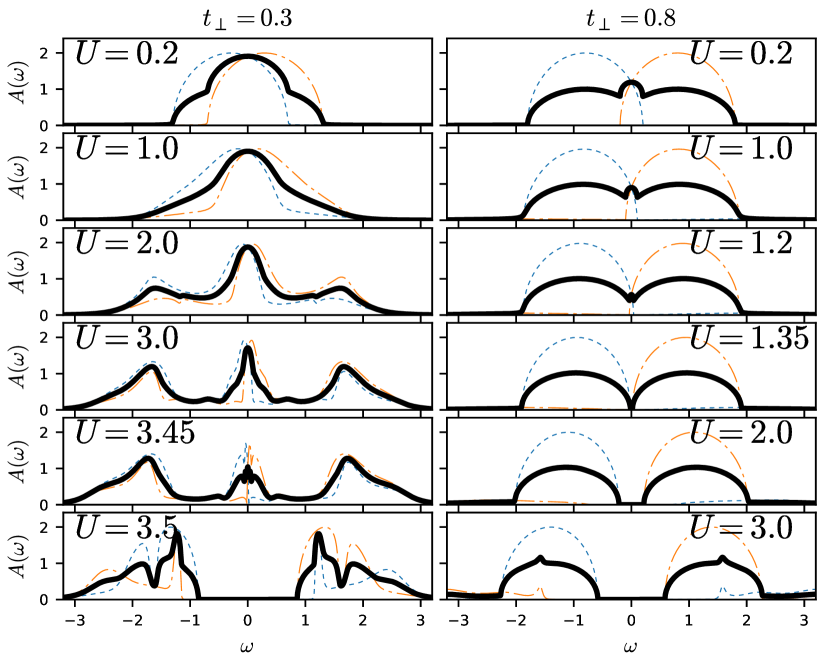
The behavior of the DOS at higher displays a rather simple evolution. As shown by the data in the B/AB basis (dotted blue and dot-dashed orange) we observe that the total DOS (thick black) is the average of the two semicircular contributions of the B and AB bands. The gap opens continuously and the effective masses or, equivalently, the bandwidth of the two bands remains essentially un-renormalized. The insulator at is clearly a band insulator state. As we mentioned before, we identify this state with the Peierls insulator, since it is realized at large and relatively low . We may also note that at the highest values of the interaction this simple description begins to fail as the B and AB DOS begin to develop a second contribution to the spectral weight for > 0 and < 0, respectively. We shall discuss this feature in more detail latter on.
In contrast, the transition at lower values of is significantly different. The evolution of the DOS is more complex and has various contributions. We can immediately observe the strongly correlated (Mott-Hubbard) character by noticing a characteristic 3-peak structure at intermediate values of the interaction. The central peak, which gives the metallic character becomes narrower as it losses spectral weight that is transferred to build the high energy Hubbard bands at energy of order . Interestingly and contrary to the single band Hubbard model case, there is no pinning condition for the central quasiparticle peak moeller1999_rkky_interactions_mott_transition and this quasiparticle develops a non-trivial structure in the DOS at low frequencies as the critical value is approached. We shall come back to this point also later on. Unlike the higher case, the decomposition of the DOS in the B/AB contributions do not seem to provide any simpler picture of the evolution.
We can gain further insight on this transition by tracking the behavior of the self-energy through the two parameters that we defined above for the R2B model, and , that we show in Fig. 5.
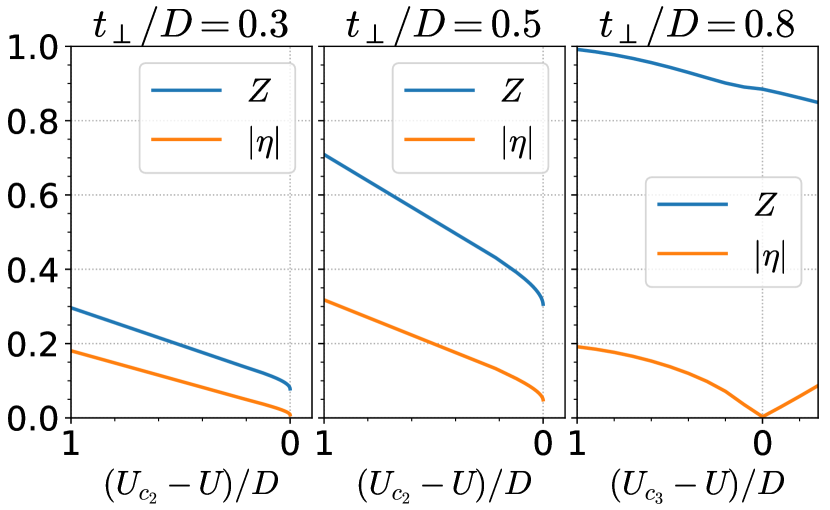
Consistent with our previous discussion, in the case we see the parameter continuously and linearly going to zero at both sides of the transition ( in the metal). The parameter remains close to one, which indicates an almost negligible mass enhancement. As one lowers the value of to 0.5, we observe that the parameter begins to experience a bigger renormalization. Further down, for the mass renormalization () is very large. Thus the metal state is strongly correlated with heavy quasiparticles. We can think of such a state at low energies as resulting from two “Kondo” states at each one of the atomic impurity sites. Each one of the sites is independently screened by conduction electrons, and also by each other. This leads to renormalized bonding and anti-bonding heavy bands as was already discussed in our previous paper najera2017_resolving_vo2_controversy . Here we shall be concerned with the question of how this heavy metallic state breaks down as is increased.
A heavy metal with a (single) band and divergent mass is a hallmark of the metal-insulator transition in the single band Hubbard model within DMFT georges1996_dynamical_mean_field_theory_strongly . That transition is a realization of the well-known Brinkman-Rice scenario, where the effective mass diverges at the metal-insulator transition. In the present dimer model we shall see that, despite a large renormalization of the effective mass, it does not diverge and the transition is qualitatively different.
Motivated by the previous discussion and by Eqs.5 and 6 of the renormalized two band model, we close-up on the low frequency peak of the spectra of Fig. 4 and we replot the DOS in Fig. 6 as a function of the rescaled frequency . We see that a clear picture emerges, where the central peak can be understood as two bands whose splitting is renormalized down but whose width is also renormalized down. The R2B model parametrization (in dashed red line in the figure) provides a good representation of the lowest frequency part of the spectra, made by the low energy edges of the B and AB peaks. Otherwise, is not very accurate.
Unlike in the Brinkman-Rice scenario, where , here the transition occurs at a finite effective mass. The opening of the gap results from the combined effect of the renormalization of the bandwidth and of the splitting. Both decrease as , but the quantity that becomes zero is not but the renormalized B/AB band overlap . This means that the low-energy B and AB contributions to the quasi-particle peak separate. This behavior is similar to the MIT reported in a correlated two orbital model mazza2016_field_driven_mott_gap_collapse . Despite the lack of a mass divergence, the transition does share a similarity with the MIT in the single band case, namely, that as the DOS() becomes zero the Kondo effect can no longer be sustained and the impurities lose their respective Kondo screening clouds. In the single band (single-site) case, in the Mott insulator state one is left with almost free local moments. However, in the present situation a strong RKKY-like magnetic interaction between the two sites takes over and one has intra-dimer magnetic screening. This dramatic enhancement of the intra-dimer magnetic interaction translates into the sharp increase of the intra-dimer effective hopping , which drives the opening of the gap (see Fig. 4) najera2017_resolving_vo2_controversy . Interestingly this sharp increase of the was also observed in DFT+CDMFT calculations in VO2 by Brito et al. brito2016_metal_insulator_transition_in_vo . They related this effect to the gap-opening by the B/AB band splitting of the a1g orbital in VO2. It is interesting to see that our present model Hamiltonian does capture the same basic physical mechanism, albeit in a simplified scenario that makes its physical interpretation transparent. Thus, we see how the renormalization of the intra-dimer hopping that drives the MIT originates in the loss of lattice Kondo screening and the concomitant boost of the local intra-dimer magnetic interaction. These competing mechanisms are well known in strongly correlated systems tracing back to Doniach’s Kondo lattice doniach1977_kondo_lattice_weak_antiferromagnetism . Not surprisingly, the R2B model is unable to provide a proper description of the system beyond the transition in the Mott insulator state (see Fig. 4). We shall come back to this point later on.
We should mention here that, within the IPT approximation and our numerical precision, does not seem to vanish completely at intermediate values of () as clearly as it does for smaller and larger values (see Fig. 5). We have also used CT-QMC at the lowest possible temperatures but the results were inconclusive due to the very small energy scale being in competition with the low temperature. This issue might be eventually fully resolved by better adapted methods such as NRG-DMFT bulla1998_numerical_renormalization_group_calculations_self or DMRG-DMFT garcia2004_dynamical_mean_field_theory_with .
III.2 Insulator to metal transition across
An interesting feature of the solution of the DHM is the existence of a first order transition driven by temperature najera2017_resolving_vo2_controversy . This transition emerges as a consequence of two coexistent solutions found in a region of the phase diagram of the model moeller1999_rkky_interactions_mott_transition as we show in Fig. 7.
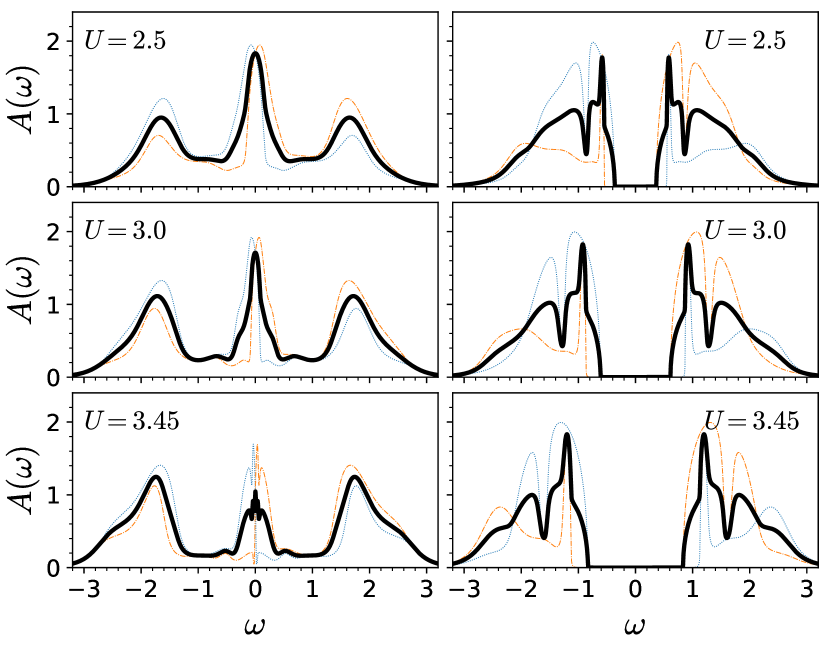
We have described above how the metallic solution collapses discontinuously as one increases the interaction . Here we shall consider the collapse of the insulator one as we come down from high towards . The systematic behavior of the DOS is shown in Fig. 8 for two representative values of . A smaller value where the system crosses the line and, for comparison, a larger value which is closer to the continuous transition line .
At the lower value of we observe that the DOS does not seem to close the gap at the transition. Notice the choice of values of very close to the critical point. The transition is clearly discontinuous, since just below for the DOS changes abruptly, displaying a metallic state that has a large quasiparticle peak. The line-shape of the Hubbard bands is quite peculiar and we shall consider that feature later on. At the larger value of the system is still crossing the line. However, and in contrast to the previous case and within our numerical precision, the gap seems to close continuously. Nevertheless, and different to the behavior across the line that we described before (cf Fig. 4), the character of the transition from insulator to metal remains discontinuous in regard of the DOS line-shape. Indeed, as the results show, it changes quite significantly with only a tiny variation of (lower two panels on the r.h.s. of Fig. 8). Also in contrast to the lower case, we see that the line-shape of the DOS in the insulator has significantly less structure. This is due to the proximity of the parameters to those of the continuous transition, therefore the first order character becomes weaker as one approaches the tri-critical transition point where the , and lines meet.
IV Mott-Peierls insulator-insulator crossover
We now turn to the central part of our study, namely, the characterization of the multiple crossovers regimes in the DHM.

As we discussed already in the Introduction, the physical characterization of the VO2 as Mott, Peierls or “in-between” has been a tricky issue. As we shall see in this section, this can be explained by the rich physics and subtle behavior changes that the DHM exhibits as it crosses-over from pure Mott to pure Peierls. We may define the former with respect to the prototypical Mott insulator that is realized in the one band Hubbard model. As we already discussed in Section II, the DHM in the limit becomes in fact two independent copies of the single-band Hubbard model. In such a regime, the electrons become localized because of the strong on-site Coulomb repulsion. This creates “free local moments” at every site, and the electronic structure is, accordingly, very incoherent Hubbard bands split by a large energy scale georges1996_dynamical_mean_field_theory_strongly . The other extreme case, the pure Peierls, is identified in the DHM as the limit with the B/AB bands having a split, larger that the bandwidth . Hence, a gap in the DOS spectra opens by virtue of the momentum-independent strong dimerization hopping amplitude. This is a pure “band-structure” effect as the interaction is set to zero. In this insulator state, the bonding and anti-bonding bands are separated and the former is fully filled with two electrons per dimer site. The system is a “band-insulator”, which is non-magnetic and its electronic structure shows two parallel coherent Bloch bands. We shall explore in this section how the system transmutes from one regime to the other.
In Fig. 9 we show the various regimes that the systems exhibits as it crosses-over from the Mott to the Peierls limit. There are four different zones, which can be well characterized. The understanding of Zone I is key to this study. Its important feature is an interesting thermal crossover where spin degrees of freedom are active. These magnetic moments are due to the Coulomb interaction and emerge as the result of Mott localization above the line at low . Zone IV is characterized by the insulating Peierls state. As we shall see, we can think of that state as “orbitally polarized” in the B/AB basis, with correlations playing a relatively minor role. The Zones II and III have a mix character and the evolution of the electronic structure is quite subtle. We have therefore explored the evolution of the system across the different zones by following the black lines that are indicated in Fig. 9. We consider two parallel lines at fixed values of and varying . The relatively smaller line traces the systematic evolution from within the Mott coexistence region towards the Peierls one. At a larger value of we shall see that the system remains within a Mott state even for relatively large values of . The main feature in this case is an interesting evolution of the electronic structure, going from incoherent Hubbard bands (Zone I) to coherent ones (Zone III) and passing through a mixed state with the coexistence of coherent and incoherent contributions (Zone II). We shall describe these various crossovers in detail in the following subsections.
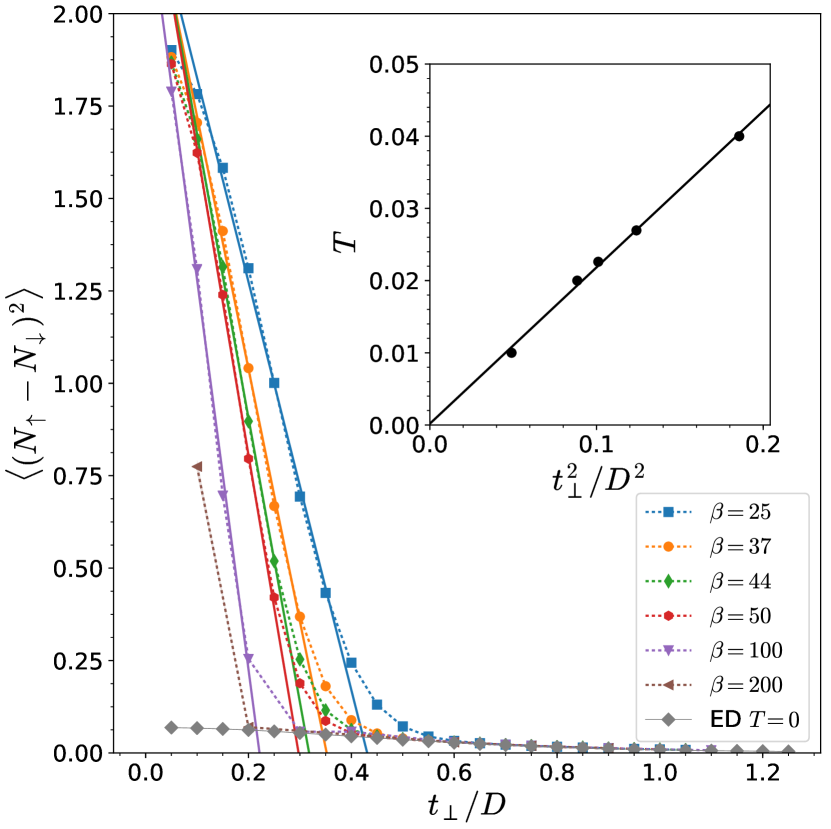
IV.1 Zone I: the singlet to free-moment crossover in the Mott state
This regime at and small is crucial to understand the physical behavior of the present model. The large value of the on-site Coulomb repulsion creates a local magnetic moment at each site of the dimer. Then, the interaction between these moments undergoes a thermal crossover from a singlet ground state at to a free-moment regime above a low temperature scale . This temperature is a low energy scale of the model, which indicates the singlet pair formation and is two orders of magnitude smaller than the bare parameters. In the Fig. 10 we show the behavior of the total magnetic moment formation = as a function of at different fixed temperatures. At any given temperature, we observe that the moment formation goes from a very small value at large and suddenly has a dramatic increase upon lowering that parameter. The reason is that the magnetic coupling between the local moments at the two sites of the dimer is large at bigger so they lock into a singlet state which is non-magnetic. When this magnetic interaction is reduced by decreasing the magnetic binding energy falls below the thermal energy and the singlet state breaks down. The two local moments unbind and behave as local free spins analogous to the Mott insulator state of the single band Hubbard model.
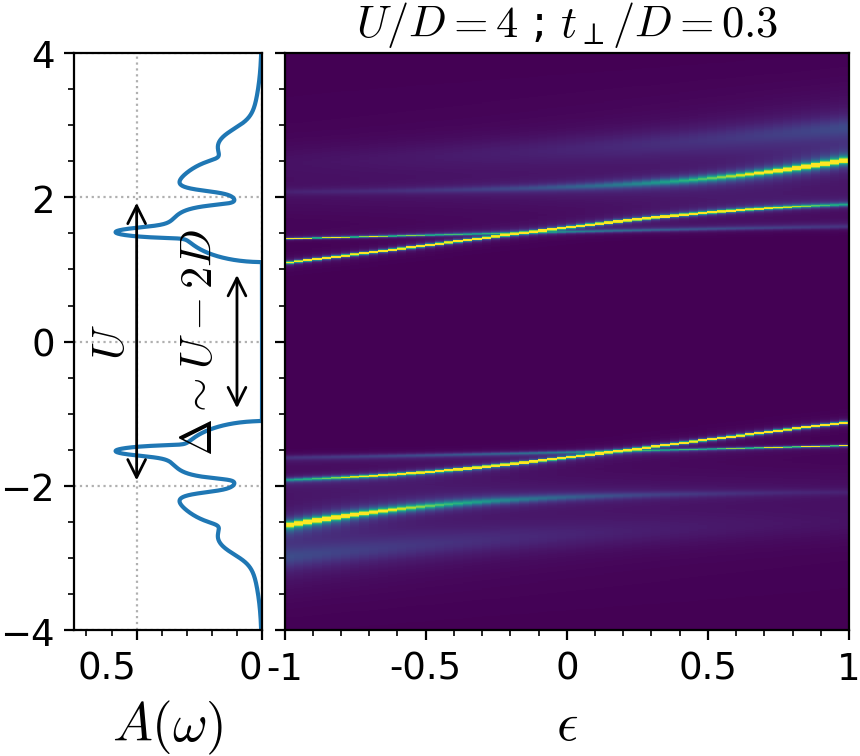
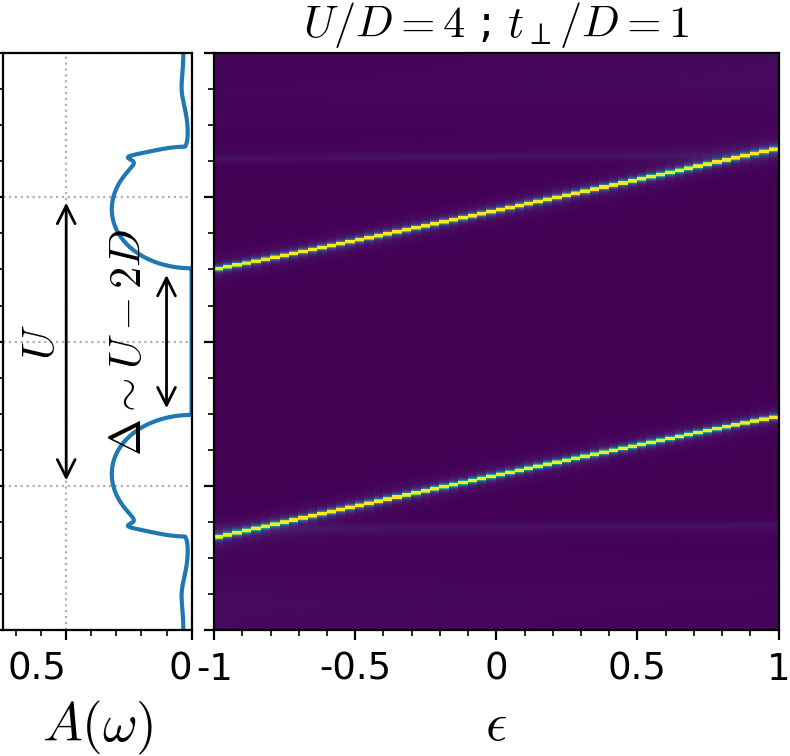
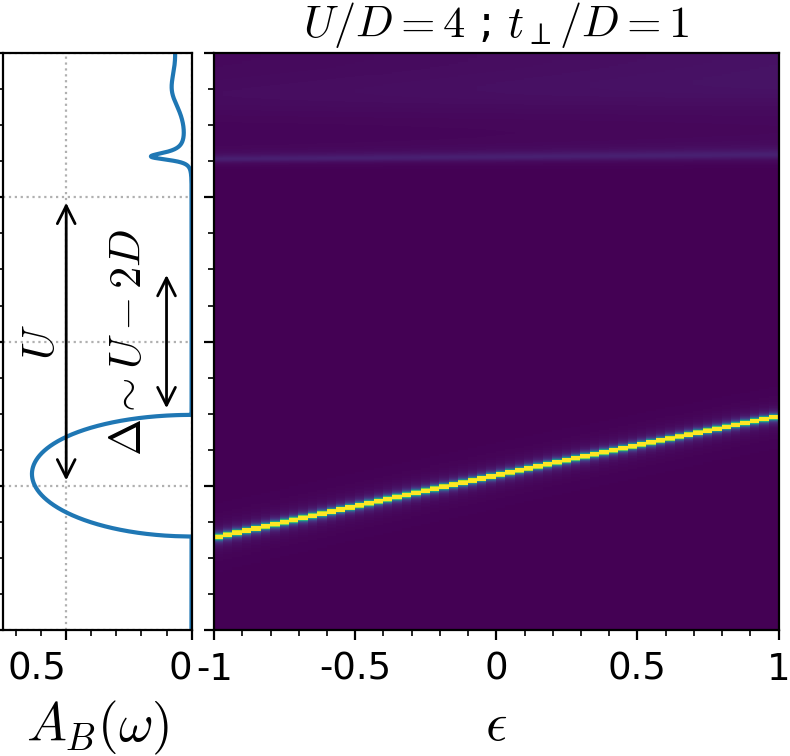
This behavior can also be clearly seen by its dramatic effect on the electronic structure. In Fig. 11 we show in a color intensity plot the bonding spectral function dispersion for the system at a fixed and two values of . One larger with the two moments locked into the singlet and a smaller one with two unbound free-moments.
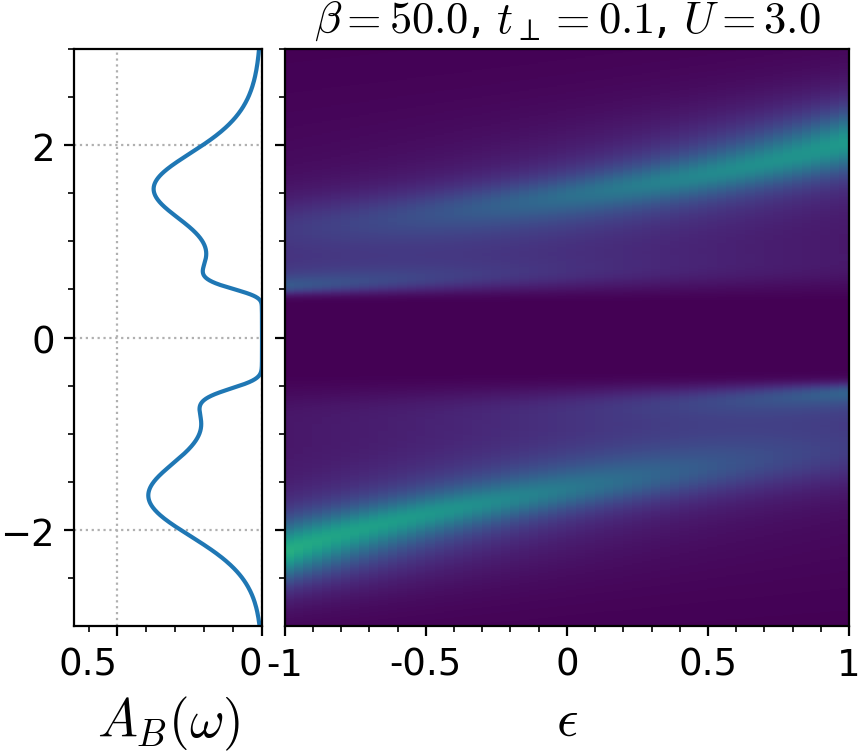
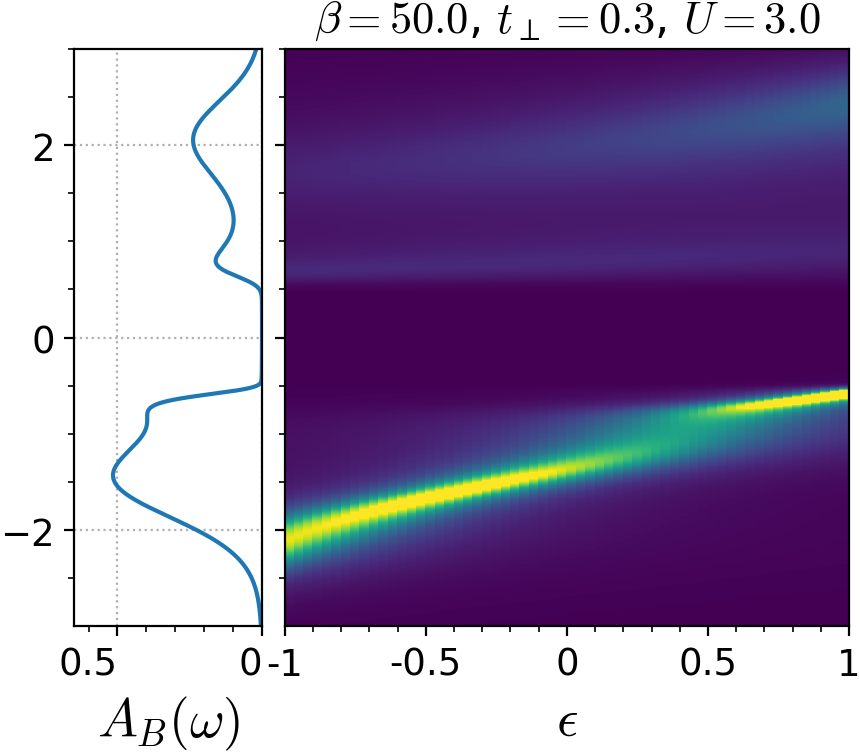
The change in the spectral function is very significant and consistent with the magnetic state. To make the effect more explicit we focus on the bonding spectral function. We recall that the anti-bonding is obtained by reflection around , and the site-basis one is the average of the two. At the higher value of the spectra is not symmetric, we see that the low energy band has most of the spectral weight. This signals that the system is locked in the singlet bound state, with the bonding band almost fully occupied. In contrast, at lower the state is not magnetically bound and correspondingly we obtain a symmetric spectrum. The AB state is virtually identical to the B one, so both have a similar occupation, which indicates that the magnetic states are decoupled and free to fluctuate as in the Mott insulator in the single band case. In fact, the spectral function of the low case that is above is very similar to the incoherent Hubbard bands of the single band Mott-Hubbard insulator georges1996_dynamical_mean_field_theory_strongly , which is nothing but the case.
This physical insight is a key reference to guide the discussion of the various and dependent crossovers that we shall describe next. In fact, we shall see that the emerging magnetic moments, characteristic of the Mott localization phenomenon will show up in different contributions to the electronic structure.
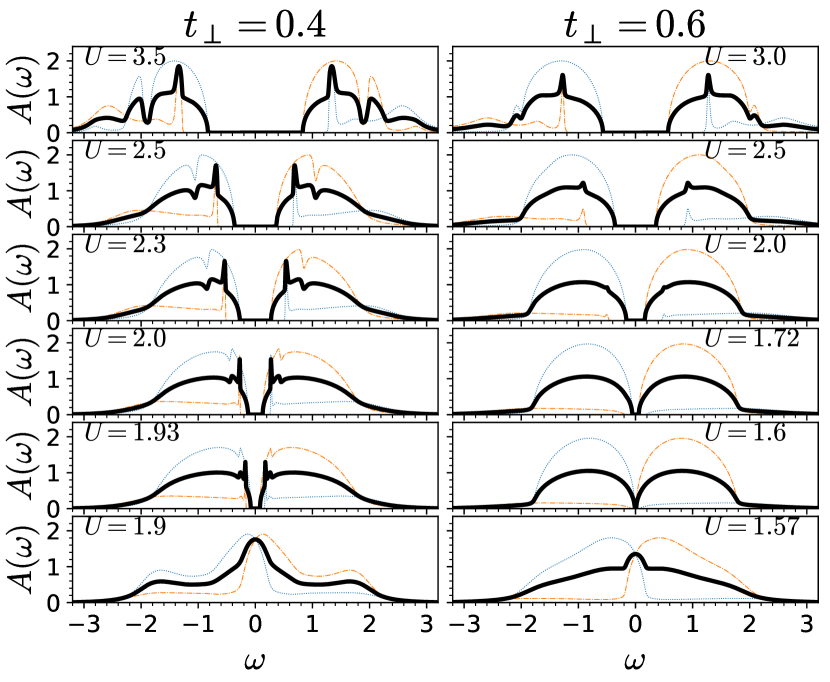
IV.2 Zone IV-III and IV-I crossovers: building correlations on the Peierls state
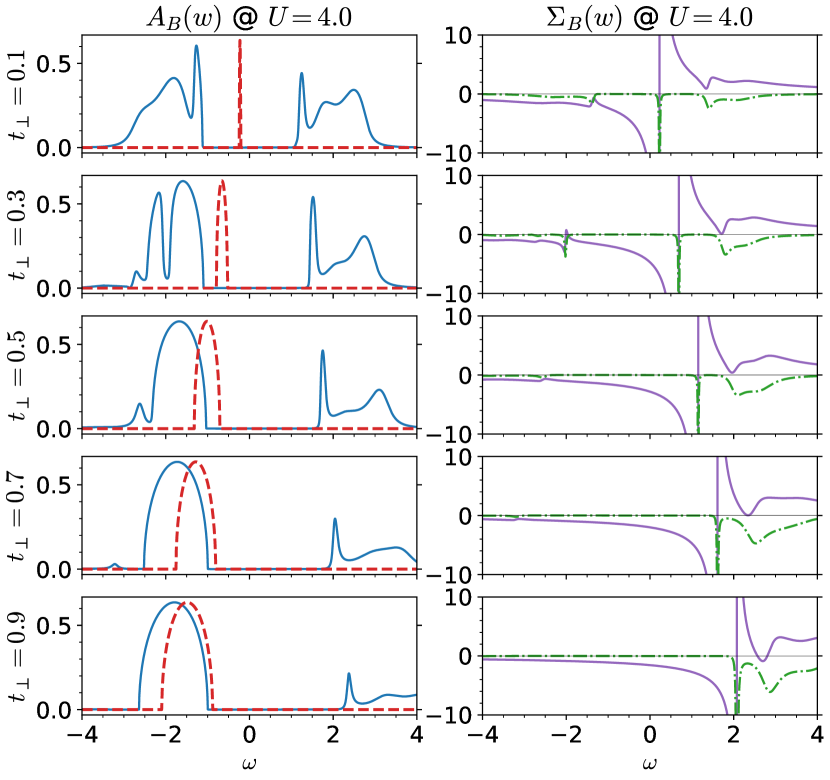
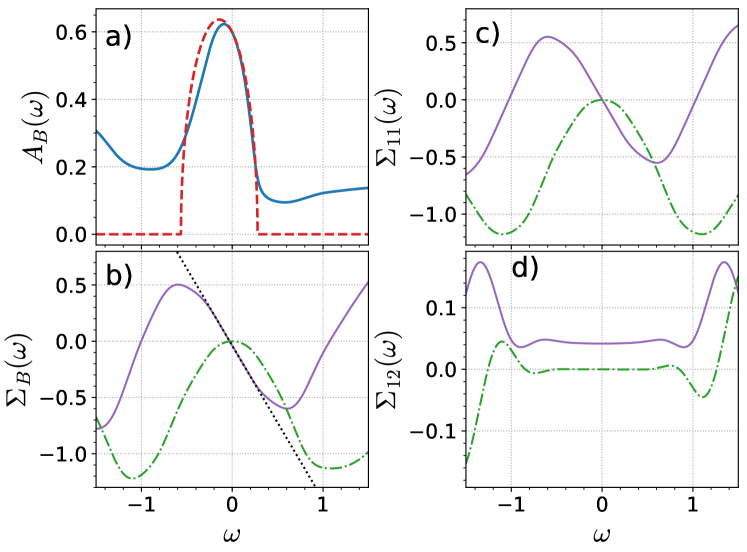
We have just discussed how the local moment degrees of freedom that are present in Zone I due to Mott localization may bind or unbind. Now we will discuss how in the Peierls non-magnetic state (large and ), the magnetic moments gradually emerge as the correlations are increased. To illustrate that, we plot in Fig. 12 the evolution of the bonding orbital DOS, i.e. the spectral function for increasing , along with its corresponding self-energy . At weak correlations, for and , the system is still within the Peierls insulating state in Zone IV. We observe that the R2B model parametrization (red dashed line) provides a rather good description. The occupation of the B state is almost complete, so we may consider this state as fully orbitally polarized in the B/AB basis. Accordingly, the self-energy remains smooth and small.
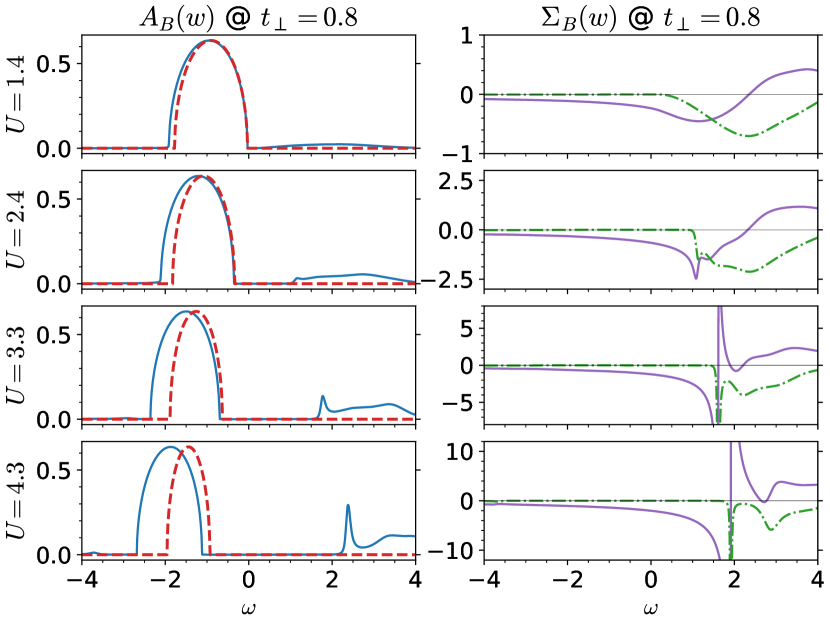
Increasing the system crosses-over from Zone IV to III and we observe qualitative changes in both, the DOS and . For we already see an incipiently structured spectral weight developing at . Accordingly, the self-energy begins to develop a rapidly varying wiggle. These developing structures become apparent at a higher interaction strength . We clearly observe the emergence of a quasiparticle-like resonance in the DOS, with a concomitant pole in the self-energy. This signals the onset of a well-defined excitation and the narrowness of the peak indicates that is essentially a localized state. This excitation is in fact due to local moments building up at each of the dimer sites najera2017_resolving_vo2_controversy . Unlike in the Mott state at low , where the local moments produce a broad incoherent contribution to the spectral function, here the moments are strongly coupled by the large . Therefore, they remain Mott-localized within the dimer but establish a local coherent (singlet) state. Upon further increasing the interaction the resonance gains more spectral weight and the strength of the pole also grows. The “Mottness” character of the state increases as we see that the simple renormalized two band parametrization fully breaks down. Notice, however, that in contrast to the pure Mott insulator with incoherent Hubbard bands, here the lower Hubbard band in remains fully coherent as in the Peierls insulator case. This is evident from the imaginary part of the self-energy (bottom right panel of Fig. 14), which is negligible on the full frequency range. We thus begin to observe the coexistence of incoherent and coherent features in the electronic structure, which are respectively connected to Mott and Peierls physics.
We now turn to the crossover behavior from zone IV to zone I (cf Fig. 9). The systematic behavior is shown for and in Fig. 13.
We observe that all the features that we described before in the zone IV to III crossover as a function of are also present here as the system evolves as a function of the model parameter . It crosses-over from the Peierls insulator in zone IV towards the Mott state in zone I. Similarly as before, we observe the emergence of a narrow resonance in the part of the spectra. However, a difference with the previous crossover is that the evolution now ends close to the pure Mott state and we see that the is non negligible at . One may notice that this second crossover path traverses the zone II. The clear characterization of that regime requires the discussion of the spectral function , which we shall consider in the next subsection.
V The evolution of the dimer Mott insulator: coexistent incoherent and coherent contributions
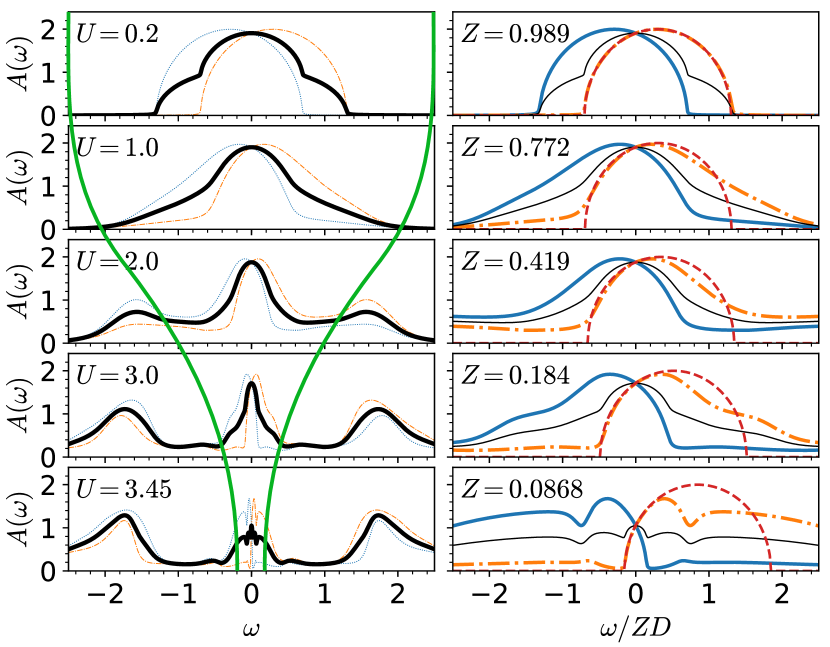
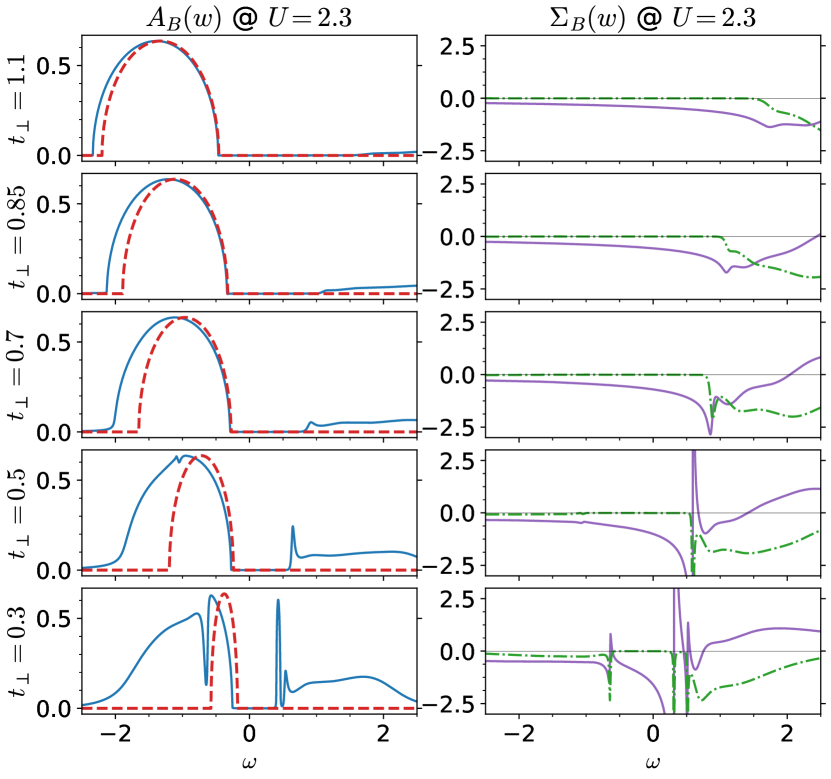
We now finally consider the strongly correlated regime set by a relatively large value of the interaction . We shall discuss the systematic changes of the insulator state as it evolves as a function of increasing intra-dimer hopping . As we did before, we begin considering the bonding DOS and the corresponding self-energy , which unveils details of its mathematical structure. The data are shown in Fig. 14. We recall that the same quantities on the AB orbital are obtained by reflection around , and that the total DOS corresponds to the average of the B and AB. The main feature is that there is always a large gap with two main contributions at . Thus for all we have a large insulating gap controlled by , which is an indication of Mott physics having a dominant role. We also see, consistent with this observation and with our discussion in previous sections, that the unoccupied part of always has a sharp resonance that we associated to emergent magnetic moments. Moreover, in we always observe the presence of a strong pole. Interestingly, we see that the position of the pole is almost at the center of the gap at lower . In fact, it must reach in the limit of as system the becomes two independent copies of a single-band Mott insulator georges1996_dynamical_mean_field_theory_strongly . Thus, this strong pole is a hallmark of the opening of a Mott gap. As we increase we see that the pole remains strong but evolves towards the upper edge of the gap. This has the effect of strongly affecting the part of the spectrum while we observe that the , in contrast, evolves towards the semi-circular density of states. This apparent weakening of correlations in the lower Hubbard band can be also understood by the fact that this band is further filled up, hence effectively moving away from the half-filled situation. However, it would be a mistake to simply consider this a weakly correlated state since, as we already emphasized, the gap is large and set by the Coulomb interaction . In fact, we observe that the R2B model parametrization (red dashes line in the Fig. 14) is poor in all cases.
Another interesting feature revealed by the is that the imaginary part, which is related to the inverse life-time is always relatively large on the side of the spectra while is much smaller, or even negligible for larger on the side. This indicates that the positive frequency excitations have incoherent character (save for the sharp resonance state that we discussed in previous sections) while the negative frequency ones are coherent. One additional interesting feature that we would like to point out is the complex evolution of the line shape of at small , where is still non-negligible. This regime corresponds to the crossover zone II (cf. Fig. 9). In order to gain further insight into these issues we shall consider the “momentum” resolved spectral function along with the local DOS, .
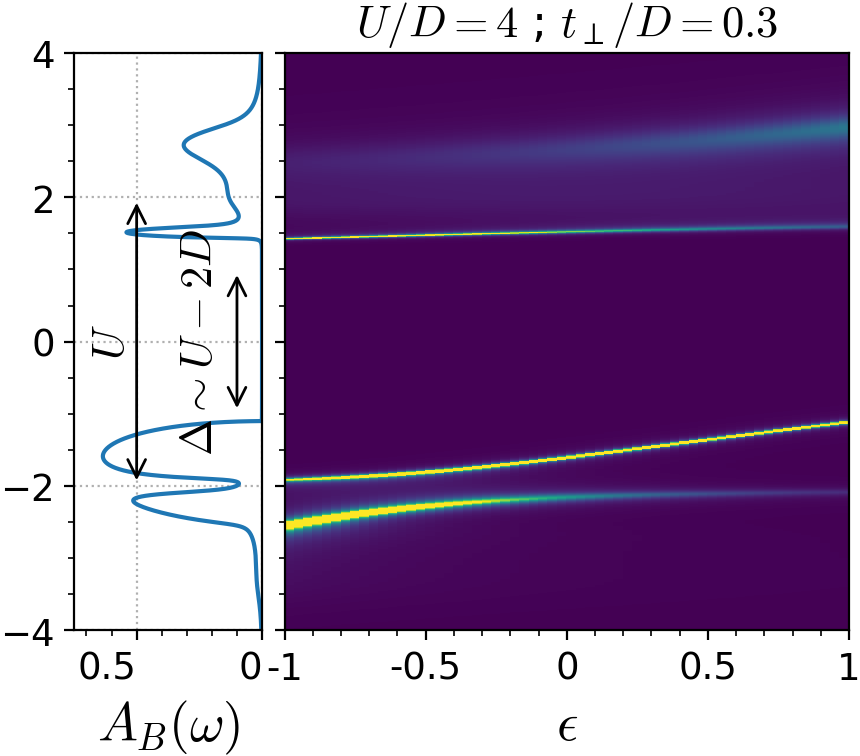
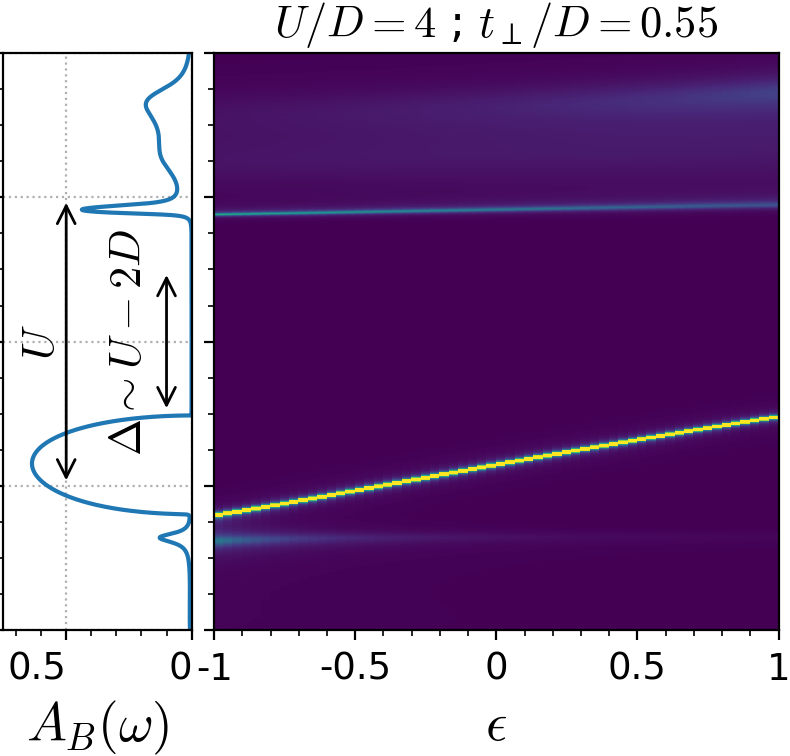
For the sake of clarity we consider, both, the total (i.e. site basis) and bonding orbital spectral functions. Their evolution is shown, respectively, in Figs. 15 and 16. We should actually begin with the spectra already shown in Fig. 11, which illustrated the very low regime (zone I) where the system is deep in the Mott phase with decoupled magnetic moments (at finite ). Consequently, the displays a very incoherent electronic structure, similar to the single band Mott state.
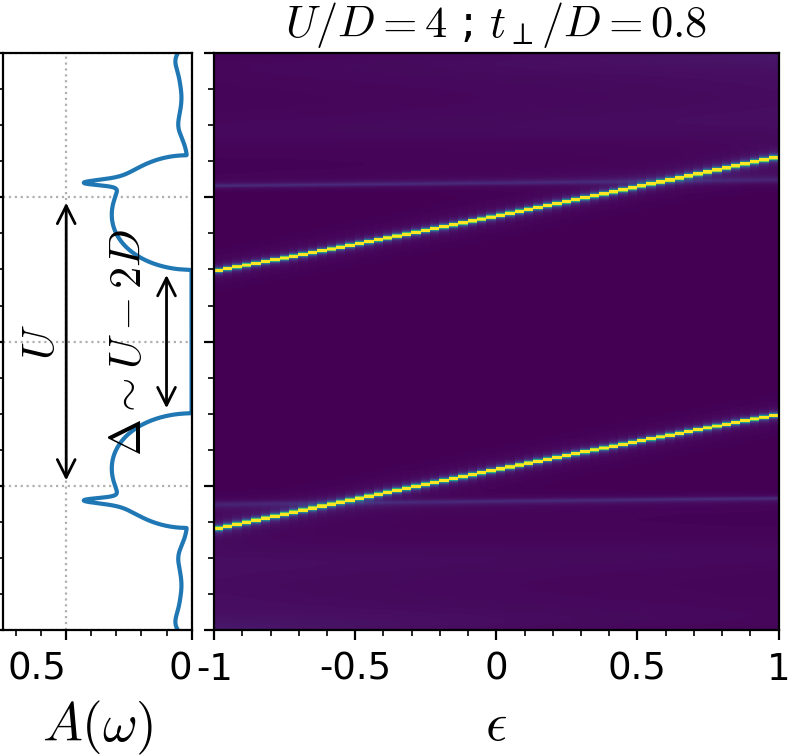
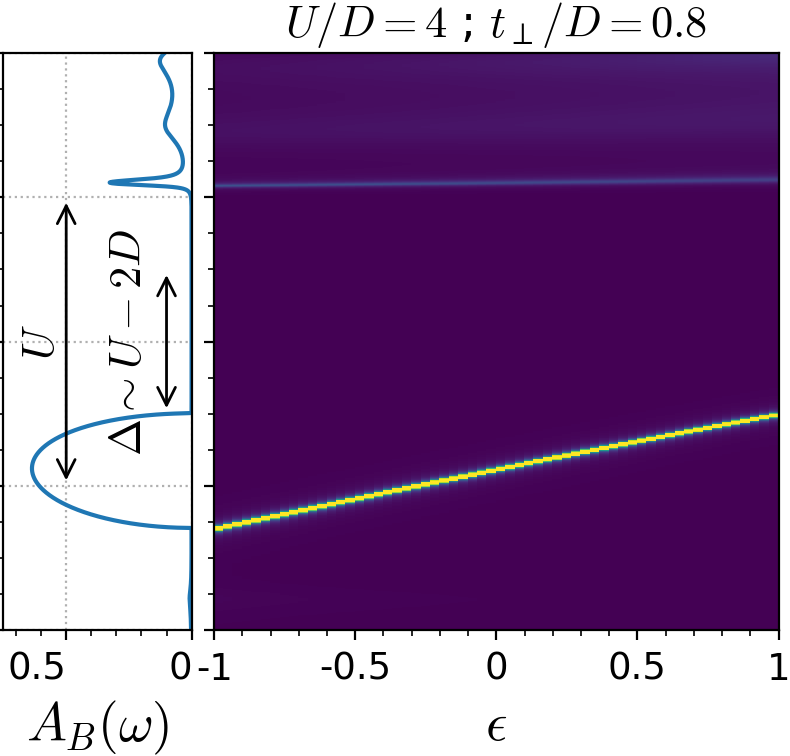
As we increase the in Figs. 15 and 16 we observe the systematic evolution of the electronic structure. It always shows two roughly parallel lower and upper Hubbard bands split by . These bands gain in coherence as is increased. At the end state, i.e., higher , two well-defined and coherent contributions dominate the electronic structure. As can be seen in the last panel of Fig. 16 the main contribution comes from the bonding state for the lower Hubbard band, and correspondingly from the anti-bonding for the upper Hubbard one. However, some incoherent weak intensity and weakly dispersive states can still be observed. This state resembles the Hubbard I solution, with 2 coherent bands, that are split by . This can be rationalized noting that in the B/AB basis the system is strongly orbitally polarized.
More interesting are the states at lower values of . As displayed in the first two panels we observe that the Hubbard bands develop a unique characteristic, which is their mixed character. In fact, we observe sharper and more coherent quasiparticle-like contributions to the electronic structure in the inner edges of the Hubbard bands, which upon integration lead to a peculiar line-shape for the local DOS(). The outer part of the Hubbard bands, in contrast, is strongly incoherent. The physical interpretation of the quasiparticle states stems from the intra-dimer magnetic coupling of the emergent moments. Within the dimer they develop a coherent singlet state, thus remain localized and their effective mass is heavy. The propagation of higher energy states through the lattice remains very incoherent, as signaled by the diffuse spectral intensity which is broad on a scale of . These states with a mixed character in the propagation of the Hubbard bands are an original feature of the DHM and they are absent in the single band model case. Interestingly, this regime has been signaled as the relevant for VO2 najera2017_resolving_vo2_controversy and would be interesting to see if some of its signatures may be experimentally observed in spectroscopic studies.

VI Conclusions
We have studied in detail the solution of a basic strongly correlated model, the dimer Hubbard model, which is relevant for VO2 najera2017_resolving_vo2_controversy , monoclinic transition metal oxides MO2 hiroi2015_structural_instability_rutile_compounds and more generally structures with a dominating bond between a pair of correlated metallic ions.
This model is also interesting as it is arguably the simplest realization of a cluster DMFT problem and has a quantum impurity model that is analogous to that of realistic DFT+DMFT calculations of VO2. Indeed, we have seen that the solution of the DHM does exhibit the same physical mechanism for the insulator gap opening as was reported in DFT+DMFT studies, namely, the strong enhancement of the intra-dimer self energy.
We provided a detailed description of the solutions in the “coexistent region” where two (meta)stable states of the CDMFT equations are found, one a metal and the other an insulator. Moreover, we described in detail how these states break down at their respective critical lines. We have clarified the key role played by the intra-dimer correlation, which here acts in addition to the familiar onsite Coulomb correlations (Mott-Hubbard) that were already present in the one-band case. Their interplay (i.e. Kondo screening vs RKKY) determines the physics of the metal-to-insulator transition line as the instance where the renormalized low-energy B/AB bands separate. This was described in terms of our R2B model parametrization, which turned out to be always applicable in metallic side on the full phase diagram at low enough frequencies, but not in the Mott insulator state.
The simplicity of the DHM provides new and detailed physical insight and allows us to clarify the important issue of the Mott-Peierls crossover. This question has remained a matter of debate in DFT+CDMFT studies for VO2. A reason may be found in the surprisingly subtle evolution of the electronic structure with the systematic change of model parameters. In fact, the crossover from the Mott to the Peierls limit is non-trivial and we characterized a variety of physical regimes. Interestingly, we found that in the Hubbard bands evolve from purely incoherent (Mott) to purely coherent (Peierls) through a state with unexpected mixed character. This feature can be understood as follows: in the Mott limit, at low intra-dimer hopping , one has emergent magnetic degrees of freedom that remain freely fluctuating above a rather small spin singlet pairing temperature . Increasing the intra-dimer hopping the moments bind into a spin singlet state and they acquire coherence (i.e. a well-defined quantum state) within the dimer. However, the excitations of such a state still lack coherence through the lattice. We may think of this state as Mott-localized singlet-dimers. This state has a mix character and is likely relevant for VO2. Upon further increase of the intra-dimer hopping the bonding orbital becomes fully occupied as one may think of as an effective crystal field. Hence, the system becomes orbitally polarized in the bonding/anti-bonding basis, which renders the electronic structure coherent as quantum fluctuations are frozen out. Nevertheless, even in this large limit the gap remains controlled by the interaction . Therefore, the state remains a Mott insulator one at strong enough (zone III on Fig. 9), and although is in a B/AB polarized state, it can be seen that a Hartree-Fock description fails.
Our work has uncovered a new paradigm of a non-magnetic Mott insulator, which may be realized in structures with two strongly coupled correlated atoms, with VO2 as a prototypical example. This Mott state has a surprising coexistence of coherent and incoherent excitations. An open question is whether this feature may be seen in spectroscopic studies, or if it may be put in evidence by pump-probe experiments that may selectively excite particles to the coherent or incoherent states.
Finally, the intra-dimer magnetic coupling provides binding of the two electrons into a singlet state below a characteristic temperature . It is an interesting open question to study the fate of such a state upon doping the system. This situation is rather reminiscent of the magnetic pseudo-gap state discussed in the context of the doped Mott state of curate superconductors.
References
- [1] Isao H. Inoue and Marcelo J. Rozenberg. Taming the Mott transition for a novel Mott transistor. Advanced Functional Materials, 18(16):2289–2292, 2008.
- [2] Pablo Stoliar, Julien Tranchant, Benoit Corraze, Etienne Janod, Marie-Paule Besland, Federico Tesler, Marcelo Rozenberg, and Laurent Cario. A leaky-integrate-and-fire neuron analog realized with a Mott insulator. Advanced Functional Materials, 27(11):1604740, 2017.
- [3] John B. Goodenough. Direct cation- -cation interactions in several oxides. Physical Review, 117(6):1442–1451, 1960.
- [4] Renata M. Wentzcovitch, Werner W. Schulz, and Philip B. Allen. VO2: Peierls or Mott-Hubbard? a view from band theory. Phys. Rev. Lett., 72(21):3389–3392, 1994.
- [5] V. Eyert. The metal-insulator transitions of VO2: A band theoretical approach. Annalen der Physik, 11(9):650–704, 2002.
- [6] S. Biermann, A. Poteryaev, A. I. Lichtenstein, and A. Georges. Dynamical singlets and correlation-assisted peierls transition in VO2. Physical Review Letters, 94(2):26404, 2005.
- [7] Jan M. Tomczak, Ferdi Aryasetiawan, and Silke Biermann. Effective bandstructure in the insulating phase versus strong dynamical correlations in metallic VO2. Physical Review B, 78(11):115103, 2008.
- [8] Cédric Weber, David D. O’Regan, Nicholas D. M. Hine, Mike C. Payne, Gabriel Kotliar, and Peter B. Littlewood. Vanadium dioxide: A Peierls-Mott insulator stable against disorder. Physical Review Letters, 108(25):256402, jun 2012.
- [9] W. H. Brito, M. C. O. Aguiar, K. Haule, and G. Kotliar. Metal-insulator transition in VO2: A DFT+DMFT perspective. Phys. Rev. Lett., 117(5), July 2016.
- [10] V. Eyert. VO2 : A novel view from band theory. Physical Review Letters, 107(1):016401, 2011.
- [11] A. S. Belozerov, M. A. Korotin, V. I. Anisimov, and A. I. Poteryaev. Monoclinic M1 phase of VO2 : Mott-Hubbard versus band insulator. Phys. Rev. B, 85(4):045109, 2012.
- [12] Dušan Plašienka, Roman Martoňák, and Marcus C. Newton. Ab initio molecular dynamics study of the structural and electronic transition in VO2. Physical Review B, 96(5):054111, 2017.
- [13] O. Nájera, M. Civelli, V. Dobrosavljević, and M. J. Rozenberg. Resolving the VO2 controversy: Mott mechanism dominates the insulator-to-metal transition. Physical Review B, 95(3):035113, 2017.
- [14] M. M. Qazilbash, M. Brehm, B.-G. Chae, P.-C. Ho, G. O. Andreev, B.-J. Kim, S. J. Yun, A. V. Balatsky, M. B. Maple, F. Keilmann, H.-T. Kim, and D. N. Basov. Mott transition in VO2 revealed by infrared spectroscopy and nano-imaging. Science, 318(5857):1750–1753, 2007.
- [15] Jan M Tomczak and Silke Biermann. Effective band structure of correlated materials: the case of VO2. Journal of Physics: Condensed Matter, 19(36):365206, 2007.
- [16] Hyun-Tak Kim, Yong Wook Lee, Bong-Jun Kim, Byung-Gyu Chae, Sun Jin Yun, Kwang-Yong Kang, Kang-Jeon Han, Ki-Ju Yee, and Yong-Sik Lim. Monoclinic and correlated metal phase in VO2 as evidence of the Mott transition: Coherent phonon analysis. Physical Review Letters, 97(26):266401, 2006.
- [17] E. Arcangeletti, L. Baldassarre, D. Di Castro, S. Lupi, L. Malavasi, C. Marini, A. Perucchi, and P. Postorino. Evidence of a pressure-induced metallization process in monoclinic VO2. Phys. Rev. Lett., 98(19), May 2007.
- [18] M. M. Qazilbash, A. Tripathi, A. A. Schafgans, Bong-Jun Kim, Hyun-Tak Kim, Zhonghou Cai, M. V. Holt, J. M. Maser, F. Keilmann, O. G. Shpyrko, and D. N. Basov. Nanoscale imaging of the electronic and structural transitions in vanadium dioxide. Phys. Rev. B, 83(16):165108, 2011.
- [19] Zhensheng Tao, Tzong-Ru T. Han, Subhendra D. Mahanti, Phillip M. Duxbury, Fei Yuan, Chong-Yu Ruan, Kevin Wang, and Junqiao Wu. Decoupling of structural and electronic phase transitions in VO2. Physical Review Letters, 109(16):166406, 2012.
- [20] Rikiya Yoshida, Takashi Yamamoto, Yukiaki Ishida, Hiroki Nagao, Tsubasa Otsuka, Kuninari Saeki, Yuji Muraoka, Ritsuko Eguchi, Kyoko Ishizaka, Takayuki Kiss, Shuntaro Watanabe, Teruto Kanai, Jiro Itatani, and Shik Shin. Ultrafast photoinduced transition of an insulating VO2 thin film into a nonrutile metallic state. Physical Review B, 89(20):205114, 2014.
- [21] Vance R. Morrison, Robert P. Chatelain, Kunal L. Tiwari, Ali Hendaoui, Andrew Bruhács, Mohamed Chaker, and Bradley J. Siwick. A photoinduced metal-like phase of monoclinic VO2 revealed by ultrafast electron diffraction. Science, 346(6208):445–448, 2014.
- [22] J. Laverock, S. Kittiwatanakul, A. A. Zakharov, Y. R. Niu, B. Chen, S. A. Wolf, J. W. Lu, and K. E. Smith. Direct observation of decoupled structural and electronic transitions and an ambient pressure monocliniclike metallic phase of VO2. Phys. Rev. Lett., 113(21), November 2014.
- [23] Daniel Wegkamp, Marc Herzog, Lede Xian, Matteo Gatti, Pierluigi Cudazzo, Christina L. McGahan, Robert E. Marvel, Richard F. Haglund, Angel Rubio, Martin Wolf, and Julia Stähler. Instantaneous band gap collapse in photoexcited monoclinic VO2 due to photocarrier doping. Physical Review Letters, 113(21), 2014.
- [24] Zenji Hiroi. Structural instability of the rutile compounds and its relevance to the metal-insulator transition of VO2. Progress in Solid State Chemistry, 43(1-2):47–69, 2015.
- [25] Antoine Georges, Gabriel Kotliar, Werner Krauth, and Marcelo J. Rozenberg. Dynamical mean-field theory of strongly correlated fermion systems and the limit of infinite dimensions. Reviews of Modern Physics, 68(1):13–125, 1996.
- [26] G. Moeller, V. Dobrosavljević, and A. E. Ruckenstein. RKKY interactions and the Mott transition. Physical Review B, 59(10):6846–6854, mar 1999.
- [27] Philipp Werner and Andrew J. Millis. Hybridization expansion impurity solver: General formulation and application to Kondo lattice and two-orbital models. Physical Review B, 74(15):1–13, oct 2006.
- [28] Priyanka Seth, Igor Krivenko, Michel Ferrero, and Olivier Parcollet. TRIQS/CTHYB: A continuous-time quantum monte carlo hybridisation expansion solver for quantum impurity problems. Computer Physics Communications, 200:274–284, mar 2016.
- [29] The derivation of the R2B formulas and a study of the behavior of the Self-energy in the low frequency regime is presented in appendix A.
- [30] H. Hafermann, M. I. Katsnelson, and A. I. Lichtenstein. Metal-insulator transition by suppression of spin fluctuations. EPL (Europhysics Letters), 85(3):37006, 2009.
- [31] Andreas Fuhrmann, David Heilmann, and Hartmut Monien. From Mott insulator to band insulator: A dynamical mean-field theory study. Physical Review B, 73(24):245118, 2006.
- [32] G. Mazza, A. Amaricci, M. Capone, and M. Fabrizio. Field-driven Mott gap collapse and resistive switch in correlated insulators. Physical Review Letters, 117(17):176401, 2016.
- [33] S. Doniach. The Kondo lattice and weak antiferromagnetism. Physica B+C, 91(nil):231–234, 1977.
- [34] R Bulla, A C Hewson, and Th Pruschke. Numerical renormalization group calculations for the self-energy of the impurity Anderson model. Journal of Physics: Condensed Matter, 10(37):8365–8380, 1998.
- [35] Daniel J. García, Karen Hallberg, and Marcelo J. Rozenberg. Dynamical mean field theory with the density matrix renormalization group. Physical Review Letters, 93(24):246403, 2004.
- [36] M. J. Rozenberg, G. Kotliar, and X. Y. Zhang. Mott-Hubbard transition in infinite dimensions. II. Physical Review B, 49(15):10181–10193, 1994.
Appendix A Details of the two renormalized band approximation at low frequencies
In order to derive a simple description of the low frequency electronic structure in a large region of parameter space, it is useful to expand the mean field equations (2) at low energies once they are in diagonal from.
| (8) |
From this equation one approximates the Self-energy assuming it has a well-behaved Taylor expansion up to linear order in the interval , i.e., we can write.
| (9) |
and call this the quasiparticle interval where this approximation holds. The quasiparticles are long-lived provided . In such way, we may then represent the low energy Green’s function as:
| (10) |
defining as in the main text the quasiparticle residue by:
| (11) |
and the renormalized intra-dimer hopping:
| (12) |
where the last equivalences are due to and as can be verified in figure 17. Thus, we obtain a renormalized two-band (R2B) representation of the electronic structure at low in terms of two quasiparticle bands. Their corresponding DOS is composed of two narrowed semicircles of width and split by ,
| (13) |
Under this approximation the total spectral weight of this renormalized bands is not one any more but and the rest of the spectral function outside the quasiparticle regime has totally vanished. However, this renormalized two band system is well capable of representing the low energy states of the system especially the band edges of the quasiparticle peaks through which we are able to quantify the metal to insulator transition, as described in the main text. This simple low frequency description in terms of two bands is accurate enough in a large region of the phase diagram, where the is well-behaved as mentioned above. These regions include the weakly correlated limit but also the strongly correlated metal.
It is important to recognize that the quasiparticle residue defined in eq. (11) does not follow the standard definition of a Landau-Fermi quasiparticle. In such case one would first find quasiparticles by finding the poles of the spectral function given by the solution of the equation
| (14) |
In that case one finds the quasiparticle residue for each Landau quasiparticle at every instance of the spectral dispersion, for each of the composing bands of the system.
| (15) |
This treatment is unnecessary for our current specific purposes since we are working with an energy averaged spectral function and in our particle-hole symmetric half-filled case the simple expansion around provides and excellent description of the low energy features of the spectral function in particular the band edges, which we use to quantify the transition.
Appendix B Proof that the IPT solution is exact at for the isolated dimer (atomic limit of the DHM)
At the heart of the dimer lattice problem is a Hydrogen molecule motive (the dimer) which repeats in the lattice. Isolating this molecule in the limit the governing Hamiltonian is reduced to:
| (16) |
where annihilates and electron from the dimer orbital and with spin . is the on-site repulsive Hubbard interaction and the dimer hybridization. The chemical potential is fixed to ensure half-filling at .
In this work the fermionic arrangement convention is to order states by their spin projection. Thus, the full occupation is described by the many-body state vector:
| (17) |
The single particle sector has only 4 states, as one has 4 particles. After diagonalizing this block, we only find 2 distinct energy levels since up and down spin are degenerate. We call this 2 levels the bonding(B) and anti-bonding(AB) levels.
| (18a) | |||||
| (18b) | |||||
The ground-state is in the sector and it is non-degenerate and . Its energy eigenvalue and eigenvector are:
| (19a) | ||||
| (19b) | ||||
where and . It becomes clear from this, that as the local Coulomb interaction is raised, the double occupation is reduced in the system. The zero temperature Green’s function of the dimer can be obtained through the Lehmann representation by:
| (20) |
which reduces for the local () and inter-site () Green’s functions into:
| (21a) | ||||
| (21b) | ||||
The Self-Energy is obtained by solving Dyson’s equation, which is a Matrix equation of the form
| (22) |
and results in:
| (23a) | ||||
| (23b) | ||||
The IPT scheme is drastically simplified in the isolated molecule case as it becomes a single iteration procedure. The Self-Energy is directly approximated by the second order diagram:
| (24) |
In this case one does not include the Hartree term as for the particle-hole symmetric case it is exactly canceled by the chemical potential. The IPT equation (24) can be conveniently reformulated into real frequencies by the analytical continuation and we can focus only on the imaginary part only needing the spectral functions [36]:
| (25) |
Where
| (26a) | |||||
| (26b) | |||||
here is the Heaviside step function. Replacing into equation (25)
| (27) |
The real part can be obtained by the Kramers-Kronig relation. A similar procedure is followed to find , after which one recovers the exact expressions as presented in (23). Thus, one can assert that the IPT approximation is exact in the zero temperature and limit.