A review of elliptic flow of light nuclei in heavy-ion collisions at RHIC and LHC energies
Abstract
We present a review of the measurements of elliptic flow () of light nuclei (, , , and ) from the RHIC and LHC experiments. Light (anti-)nuclei have been compared with that of (anti-)proton. We observed similar trend in light nuclei as in identified hadron with respect to the general observations such as dependence, low mass ordering and centrality dependence. We also compared the difference of nuclei and anti-nuclei with the corresponding difference between of proton and anti-proton at various collision energies. Qualitatively they depict similar behavior. We also compare the data on light nuclei to various theoretical models such as blast-wave and coalescence. We then present a prediction of for and using coalescence and blast-wave models.
pacs:
25.75.LdI Introduction
The main goals of high energy heavy-ion collision experiments have primarily been to study the properties of Quark Gluon Plasma (QGP) and the other phase structures in the QCD phase diagram QCD_theo ; whitepapers ; QCD_theo2 ; QCD_expt3 . The energy densities created in these high energy collisions are similar to that found in the universe, microseconds after the Big Bang whitepapers ; ALICEPerformace ; Early_Univ . Subsequently, the universe cooled down to form nuclei. It is expected that high energy heavy-ion collisions will allow to study the production of light nuclei such as , , and their corresponding anti-nuclei. There are two possible production mechanisms for light (anti-)nuclei. The first mechanism is thermal production of nucleus-antinucleus pairs in elementary nucleon-nucleon or parton-parton interactions Ratio_nucl2 ; Ratio_nucl ; CFO_nucl . However, due to their small (few MeV) binding energies, the directly produced nuclei or anti-nuclei are likely to break-up in the medium before escaping. The second mechanism is via final state coalescence of produced (anti-)nucleons or from transported nucleons nucl_prod1 ; nucl_prod2 ; nucl_prod3 ; nucl_prod4 ; nucl_prod5 ; nucl_prod6 ; nucl_prod7 ; nucl_prod8 . The quark coalescence as a mechanism of hadron production at intermediate transverse momentum has been well established by studying the number of constituent quark (NCQ) scaling for of identified hadrons measured at RHIC part_coll1 ; part_coll2 ; part_coll3 ; v2_BES_PID ; v2_200_QM ; PID_v2_PHENIX ; PID_pT_PHENIX . Light nuclei may also be produced via coalescence of quarks similar to the hadrons. But the nuclei formed via quark coalescence is highly unlikely to survive in the high temperature environment due to their small binding energies. In case of hadron formation by quark coalescence, the momentum space distribution of quarks are not directly measurable in experiments. However, in case of nucleon coalescence, momentum space distributions of both the constituents (nucleons) and the products (nuclei) are measurable in heavy-ion collision experiments. Therefore, measurements of of light nuclei provides a tool to understand the production mechanism of light nuclei and freeze-out properties at a later stage of the evolution. It also provides an excellent opportunity to understand the mechanism of coalescence at work in high energy heavy-ion collisions.
The production of light (anti-)nuclei has been studied extensively at lower energies in Bevelac at LBNL bevalac1 ; bevalac2 , AGS at RHIC ags1 ; ags2 and SPS at CERN sps1 ; sps2 . In the AGS experiments, it was found that the coalescence parameter () is of similar magnitude for both and indicating similar freeze-out hypersurface of nucleons and anti-nucleons. Furthermore, the dependence of on collision energy and indicated that light nuclei production is strongly influenced by the source volume and transverse expansion profile of the system sps2 ; polleri . In this paper, we review the results of elliptic flow of light nuclei measured at RHIC and LHC and discuss the possible mechanisms for the light nuclei production.
The paper is organized as follows. Sec. II briefly describes the definition of , identification of light (anti-)nuclei in the experiments and measurement of of light (anti-)nuclei. In Sec. III, we present the results for minimum bias collisions from various experiments. We also discuss the centrality dependence, difference between nuclei and anti-nuclei as well as the energy dependence of deuteron . In the same section, we present the atomic mass number scaling and also compare the experimental results with various theoretical models. Finally in Sec. IV, we summarize our observations and discuss the main conclusions of this review.
| Experiment | Nuclei | (GeV) | Centrality |
|---|---|---|---|
| STAR v2_BES_nucl | |||
| PHENIX nucl_PHENIX | + | 200 | 0-20%, 20-60% |
| ALICE (Preliminary) v2_nucl_ALICE | + | 2760 | 0-5%, 5-10%, 10-20%, 20-30%, 30-40%, 40-50% |
II Experimental Method
II.1 Elliptic flow ()
The azimuthal distribution of produced particles in heavy-ion collision can be expressed in terms of a Fourier series,
| (1) |
where is the azimuthal angle of produced particle, is called the reaction plane angle and the Fourier co-efficients , and so on are called flow co-efficients voloshin1 . is defined as the angle between the impact parameter vector and the x-axis of the reference detector in the laboratory frame. Since it is impossible to measure the direction of impact parameter in heavy-ion collisions, a proxy of namely the event plane angle is used for the flow analysis in heavy-ion collisions art1 . The is measured with respect to the 2nd order event plane angle art1 . is calculated using the azimuthal distribution of the produced particles. In an event with particles, the event plane angle is defined as art1 :
| (2) |
and are defined as
| (3a) | |||
| (3b) | |||
where are weights given to each particle to optimise the event plane resolution art1 ; ptweight . Usually the magnitude of particle transverse momentum is used as weights as the increases with . Special techniques are followed while calculating the event plane angle so that it does not contain the particle of interest whose is to be calculated (self-correlation) and also the non-flow effects (e.g., jets and short range correlations) are removed as much as possible art1 ; v2_BES_PID ; v2_BES_nucl . Heavy-ion experiments use the -sub event plane method to calculate the elliptic flow of identified hadrons as well as for light nuclei. In this method, each event is divided into two sub-events in two different -windows ( positive and negative ). Then two sub-event plane angles are calculated with the particles in each sub-event. Each particle with a particular is then correlated with the sub event plane of the opposite . This ensures that the particle of interest is not included in the calculation of event plane angle. A finite gap is applied between the two sub-events to reduce short range correlations which does not originate from flow.
The distribution of the event plane angles should be isotropic in the laboratory frame for a azimuthally isotropic detector. If the distribution of the event plane angles is not flat in the laboratory frame (due to detector acceptance and/or detector inefficiency) then special techniques are applied to make the distribution uniform. The popular methods to make the distribution uniform is the -weight and recentering AGS1 ; AGS2 . In the -weight method, one takes the actual azimuthal distribution of the produced particle, averaged over large sample of events, and then uses inverse of this distribution as weights while calculating the correlation of the particles with the event plane angle AGS1 ; AGS2 . In the recentering method, one subtracts and from the event-by-event and , respectively, where and denotes the average of and over a large sample of similar events. The main disadvantage of applying one of these methods is that it does not remove the contribution from higher flow harmonics. Therefore, another correction method known as the shift correction is used to remove the effects coming from higher flow harmonics. In this method, one fits the distribution (after applying -weight and/or recentering method) averaged over all events, with a Fourier function. The Fourier co-efficients from this fit (obtained as fit parameters) are used to shift the of each event, to make the distribution uniform in the laboratory frame AGS1 ; AGS2 .
Since the number of particles produced in heavy-ion collisions are finite, the calculated event plane angle may not coincide with . For this reason, the measured with respect to is corrected with the event plane resolution factor , where
| (4) |
In order to calculate the event plane resolution, one calculates two sub-event plane angles and , where and corresponds to two independent sub-events. If the multiplicities of each sub-event are approximately half of the full event plane, then the resolution of each of sub-event plane can be calculated as voloshin1 ; art1 ,
| (5) |
However, the full event plane resolution can be expressed as,
| (6) |
where, = and , are modified Bessel functions voloshin1 ; art1 . The parameter is inversely proportional to the square-root of , the number of particles used to determine the event plane voloshin1 ; art1 . To calculate the resolution for full event plane (), one has to solve the Eq. (6) iteratively for the value of using the subevent plane resolution () which is calculated experimentally using Eq. (5). The value is then multiplied with as is propotional to , and re-used in Eq. (6) to calculate the resolution of the full event plane. In a case of very low magnitudes, the full event plane resolution can be approximately given as voloshin1 ; art1 ,
| (7) |
The procedure for calculating full and sub-event plane resolutions using sub-event plane angles and various approximations are discussed in detail in voloshin1 ; art1 .
II.2 Data on light nuclei
For this review, we have collected light nuclei data from the STAR v2_BES_nucl and PHENIX nucl_PHENIX experiments at RHIC and ALICE experiment at LHC v2_nucl_ALICE . The table 1 summarises the measurement of light nuclei available till date.
II.3 Extraction of light nuclei
In heavy-ion collisions, light nuclei are primarily identified by comparing the mean ionization energy loss per unit length () in the Time Projection Chamber (TPC) with that from the theoretical predictions () v2_BES_PID ; v2_BES_nucl ; STAR_TPC ; STAR_dAu ; ALICE_TPC ; nucl_ALICE ; v2_nucl_ALICE . Light nuclei are also identified via the time of flight measurement techniques using the Time-of-Flight (TOF) detector nucl_PHENIX ; STAR_TOF ; ALICE_TOF ; nucl_ALICE ; v2_nucl_ALICE .
In the STAR experiment, to identify light nuclei using TPC, a variable v2_BES_nucl is defined as
| (8) |
Then the light nuclei yields are extracted from these -distributions in differential and bins for either minimum bias collisions or in selected centrality classes. The distribution is then fitted with a 2nd order Fourier function namely,
| (9) |
The Fourier co-efficient is called elliptic flow and is extracted from the fit. As we discussed in the previous subsection this measured is then corrected with the event plane resolution factor () v2_BES_PID ; v2_BES_nucl .
In the ALICE experiment, light nuclei in the low region ( 1.0 GeV for , ) are identified by comparing the variance () of the measured in the TPC with the corresponding theoretical estimate () nucl_ALICE ; v2_nucl_ALICE . Light nuclei are considered identified if the measured lies within of the . On the other hand, the light nuclei yield are extracted from the mass squared () distribution using the TOF detector. The mass of each particle is calculated using the time-of-flight () from the TOF detector and the momentum () information from the TPC nucl_PHENIX ; nucl_ALICE ; v2_nucl_ALICE . Both the ALICE and PHENIX experiments use the TOF detector to identify light nuclei at high ( 1.0 GeV). The mass of a particle can be calculated using the TOF detector as,
| (10) |
where the track length and momentum are determined with the tracking detectors placed inside magnetic field nucl_ALICE ; v2_nucl_ALICE ; nucl_PHENIX ; PID_v2_PHENIX . After getting the for each particle, a selection cut is implemented to reject tracks which have their several away from the true value of the light nuclei, as done in the STAR experiment v2_BES_nucl . The ALICE experiment, on the other hand defines a quantity such that, , where is the mass of the light nuclei under study. The distribution of is then fitted with an Gaussian exponential function for signal and an exponential function for the background v2_nucl_ALICE . Then of light nuclei is calculated by fitting the () with the weighted function,
| (11) |
where the total measured is the weighted sum of that from the signal () and background (). The of the candidate particles are calculated using the scalar product method and corrected for the event plane resolution v2_nucl_ALICE .
The PHENIX experiment calculates charged average of (anti)-deuterons as,
| (12) |
The quantity = can readily be identified as the resolution of the event plane angle nucl_PHENIX . The resolution of full event plane is calculated with sub-event planes (, ) estimated using two Beam Beam Counter (BBC) detectors PID_v2_PHENIX ; nucl_PHENIX . The detailed procedure of calculating the full event plane resolution from sub-events are already menioned in the previous subsection. The large gap between the central TOF and the BBCs ( 2.75) reduces the effects of non-flow significantly PID_v2_PHENIX ; nucl_PHENIX . The nuclei calculated in PHENIX is also corrected for the contribution coming from backgrounds, mainly consisting of mis-identification of other particles (, protons) as nuclei. A dependent correction factor was applied on the total (referred as ) such that,
| (13) |
where is the measured for background at a given , is the corrected of and is the ratio of Signal and Signal+Background.
III Results and discussion
III.1 General aspects of light nuclei
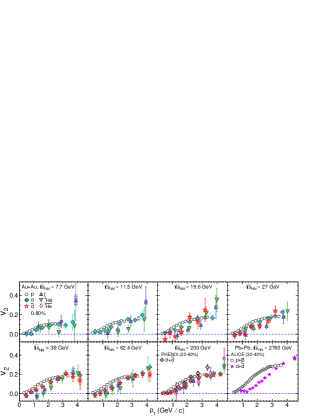
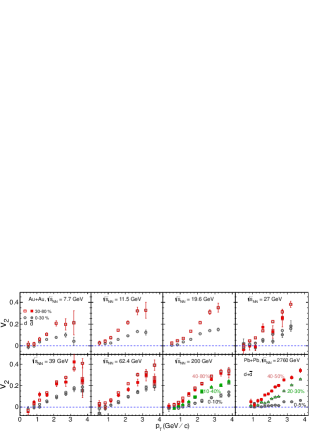
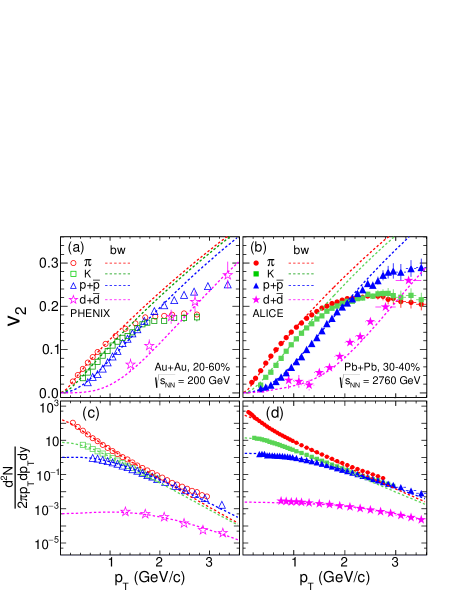
Figure 1 shows the energy dependence of light (anti-)nuclei for = 7.7, 11.5, 19.6, 27, 39, 62.4, 200 and 2760 GeV. The panels are arranged by increasing energy from left to right and top to bottom. The dependence of of , , , and is shown for 0-80% centrality in STAR, 20-60% centrality in PHENIX and 30-40% centrality in ALICE. Since PHENIX and ALICE do not have measurements in the minimum bias collisions, we only show the results for mid-central collisions. The data points of PHENIX and ALICE correspond to inclusive + . The general trend of nuclei of all species is the same it increases with increasing . The slight difference of between STAR and PHENIX is due to the difference in centrality ranges. The centrality range for PHENIX is 20-60% and that for STAR is 0-80%.
From the trend in Fig. 1 it seems that light nuclei shows mass ordering, i.e. heavier particles have smaller value compared to lighter ones, similar to of identified particles v2_BES_PID ; PID_v2_ALICE ; PID_v2_PHENIX . In order to see the mass ordering effect more clearly, we restrict the axis range to 2.5 GeV/c and compare the of with the of identified particles such as , (K in Pb+Pb) and as shown in Fig. 2. We see that at all collision energies is lower than the of the identified hadrons at a fixed value of . Although mass ordering is a theoretical expectation from the hydrodynamical approach to heavy-ion collisions hydro , coalescence formalism for light nuclei can also give rise to this effect. Recent studies using AMPT and VISHNU hybrid model suggest that mass ordering is also expected from transport approach to heavy-ion collisions ampt_order ; urqmd_order . The of light nuclei is negative for some collision energies as shown in Fig. 1. This negative is expected to be the outcome of strong radial flow in heavy-ion collisions art2 .
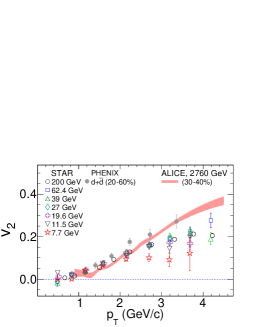
In order to study the energy dependence of light nuclei , we compare the deuteron from collision energy = 7.7 GeV to 2760 GeV as shown in Fig. 3. The deuteron () shows energy dependence prominently for high ( 2.4 GeV/c) where is highest for top collision energy ( = 2760 GeV) and gradually decreases with decreasing collision energy. This energy dependent trend of light nuclei is similar to the energy dependence of identified hadron where () also decreases with decreasing collision energy v2_BES_PID .
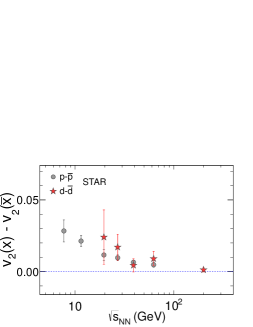
The STAR experiment has measured the difference of nuclei () and anti-nuclei () for collision energies = 19.6, 27, 39, 62.4 and 200 GeV v2_BES_nucl . Figure 4 shows the difference of and as a function of collision energy. For comparison, the difference of proton and anti-proton is also shown v2_BES_PID . We observe that the difference of and remains positive for = 7.7 39 GeV. However, for 62.4 GeV the difference of and is almost zero. The difference of and qualitatively follows the same trend as seen for difference of and v2_BES_PID . It is easy to infer from simple coalescence model that light (anti-)nuclei formed via coalescence of (anti-)nucleons, will also reflect similar difference in as the constituent nucleon and anti-nucleon. The difference in between particles and their antiparticles has been attributed to the chiral magnetic effect in finite baryon-density matter v2_CMW , different of produced and transported particles v2_Prod , different rapidity distributions for quarks and antiquarks v2_qqbar , the conservation of baryon number, strangeness, and isospin v2_conservB , and different mean-field potentials acting on particles and their antiparticles v2_meanfield .
The centrality dependence of light nuclei measured by the STAR and ALICE is shown in Fig. 5. STAR has measured and in two different centrality ranges namely 0-30% and 30-80% for collision energies below = 200 GeV. In case of 200 GeV, the light nuclei is measured in three different centrality ranges namely 0-10% (central), 10-40% (mid-central) and 40-80% (peripheral) as high statistics data were available. ALICE has measured inclusive in 6 different centrality ranges namely, 0-5%, 5-10%, 10-20%, 20-30%, 30-40% and 40-50%. We only present the results from 0-5%, 20-30% and 40-50% centrality from ALICE as shown in Fig. 5. The of shows strong centrality dependence for all collision energies studied in the STAR experiment. We observe that more central events has lower compared to peripheral events. shows the same trend as for collision energies down to = 27 GeV.
The STAR experiment could not study centrality dependence of below = 27 GeV due to limited event statistics v2_BES_nucl . Comparing the centrality dependence of () from STAR and ALICE we can see that both experiments show strong centrality dependence of light nuclei . The centrality dependence of light nuclei is analogous to the centrality dependence observed for identified nucleon (, ) PID_cent_STAR ; PID_cent_ALICE .
III.2 Mass number scaling and model comparison
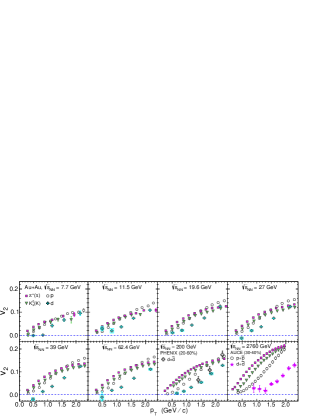
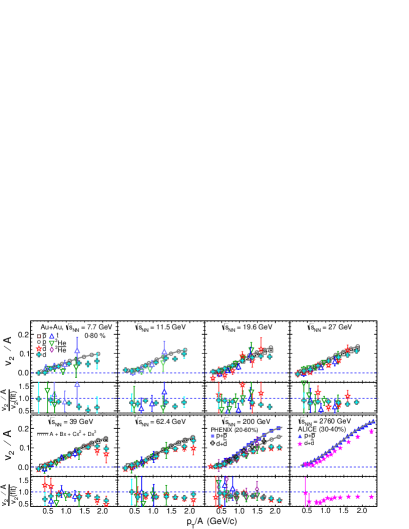
It is expected from the formulations of coalescence model that if light nuclei are formed via the coalescence of nucleons then the elliptic flow of light nuclei, when divided by atomic mass number (), should scale with the elliptic flow of nucleons firstNPcoal . Therefore, we expect that the light (anti-)nuclei divided by , should scale with () . Here, we essentially assume that the of (anti-)proton and (anti-)neutron are same as expected from the observed NCQ scaling of identified particle v2_BES_PID . Figure 6 shows the atomic mass number scaling of light nuclei from STAR, PHENIX and ALICE experiments. Since ALICE does not have results in minimum bias events, so we used both + and + from 30-40% centrality range. We observe that light nuclei from STAR and PHENIX show atomic mass number scaling up to 1.5 GeV/c. However, deviation of the scaling of the order of 20% is obesrved for + from ALICE. The scaling of light (anit-)nuclei with (anti-)proton suggests that light (anit-)nuclei might have formed via coalescence of (anti-)nucleons at a later stage of the evolution at RHIC energies for up to 1.5 GeV/c nucl_prod1 ; nucl_prod2 ; nucl_prod3 ; nucl_prod4 ; nucl_prod5 . However, this simple picture of coalescence may not be holding for ALICE experiment at LHC energies. On the contrary, there is another method to produce light nuclei, for example by thermal production in which it is assumed that light nuclei are produced thermally like any other primary particles Ratio_nucl ; CFO_nucl . Various thermal model studies have successfully reproduced the different ratios of produced particles as well as light nuclei in heavy-ion collisions Ratio_nucl ; CFO_nucl .
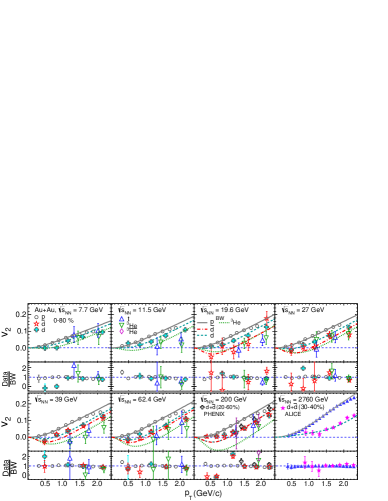
In order to investigate the success of these models, both STAR and ALICE has compared the elliptic flow of light nuclei with the predictions from blast-wave models v2_BES_nucl ; v2_nucl_ALICE . Figure 7 shows the of light nuclei predicted from blast-wave model using the parameters obtained from fits to the identified particles v2_nucl_ALICE ; PID_BW_fit . We observe that blast-wave model reproduces of light nuclei from STAR with moderate success except for low ( 1.0 GeV/c) where of () are under-predicted for all collision energies. However, the blast-wave model seems to successfully reproduce the from ALICE. The low relative production of light nuclei compared to identified nucleons at RHIC collisions energies supports the procedure of light nuclei production via coalescence mechanism nucl_prod1 ; nucl_prod2 ; nucl_prod3 ; nucl_prod4 ; nucl_prod5 . However, the success of blast-wave model in reproducing the nuclei at LHC and moderate success at RHIC suggest that the light nuclei production is also supported by thermal process Ratio_nucl ; CFO_nucl . The light nuclei production in general might be a more complicated coalescence process, , coalescence of nucleons in the local rest frame of the fluid cell. This scenario might give rise to deviations from simple scaling v2_BES_nucl .
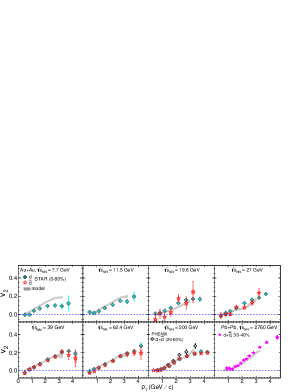
At RHIC energies the light nuclei have been compared with results from a hybrid AMPT+coalescence model v2_BES_nucl . A Multi Phase Transport (AMPT) model is an event generator with Glauber Monte Carlo initial state AMPT . The AMPT model includes Zhang’s Partonic Cascade (ZPC) model for initial partonic interactions and A Relativistic Transport (ART) model for later hadronic interactions AMPT . The nucleon phase-space information from the AMPT model is fed to the coalescence model to generate light nuclei v2_BES_nucl ; rihan_thesis . Figure 8 shows the light nuclei from the coalescence model and compared to the data. The coalescence model prediction for + in Pb+Pb collisions at = 2760 GeV is taken from coal_ALICE . The coalescence model fairly reproduces the measurement from data for all collision energies except for the lowest energy = 7.7 GeV. The AMPT model generates nucleon from both partonic and hadronic interactions for all the collision energies presented. However, increased hadronic interactions compared to partonic, at lowest collision energies, is not implemented in the AMPTcoalescence model. This could be the reason behind the deviation of the data from the model predictions at lowest collision energy v2_BES_PID .
We have performed simultaneous fit to the and spectra of identified hadrons + light nuclei using the same blast-wave model as used in PID_v2_ALICE ; v2_nucl_ALICE . The simultaneous fit of and spectra for measurements from the PHENIX and the ALICE experiment are shown in Fig. 9. We find that the inclusion of light nuclei results to the fit does not change the fit results compared to the blast-wave fit performed only on identified hadron and spectra. This indicates that the light nuclei and spectra is well described by the blast-wave model.
III.3 Model prediction of 3He and 4He
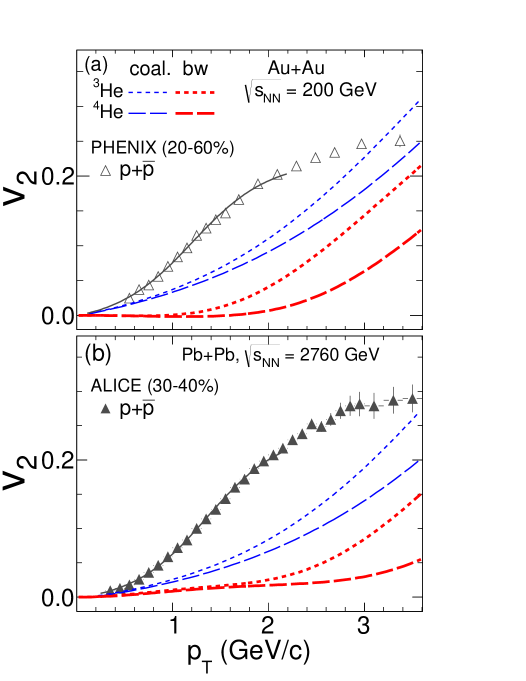
We have predicted the of and using the simple coalescence and blast-wave model. Since protons and neutrons have similar masses and same number of constituent quarks, they should exhibit similar collective behavior and hence, similar magnitude of . Therefore, we parametrize the elliptic flow of using the fit formula v2_fromNCQ ,
| (14) |
where , , , and are fit parameters and is the constituent quark number of the particle v2_fromNCQ . The fit to (solid lines) from the PHENIX and ALICE experiment is shown in Fig. 10(a) and (b), respectively. Assuming similar magnitude of neutron as that of proton, we then predict the of and as,
| (15a) | |||
| (15b) | |||
This simplified coalescence model prediction of and are shown in Fig. 10(a) and (b) as blue (thin-dotted) lines. For comparison, the blast-wave model predicted of and from the fit parameters obtained in Fig. 9 are also shown in red (thick-dotted) lines. We observe characteristic difference is observed in the prediction of 3He and 4He from the coalescence and the blast-wave model. As one expects from the mass ordering effect of blast-wave model, the of and almost zero in the intermediate range (1.0 2.5 GeV/c). On the other hand, the simple coalescence model predicts orders of magnitude higher compared to blast-wave for both and in the same range. Hence, experimental measurements of and in future, would significantly improve our knowledge on the mechanisms of light nuclei formation in heavy-ion collisions nucl_ALICE ; STAR_he4_nature ; STAR_hypt_science ; ALICE_hypt_science .
IV Summary and conclusions
We have presented a review of elliptic flow of light nuclei (, and ) and anti-nuclei ( and) from STAR experiment, and inclusive d+ from PHENIX at RHIC and ALICE at LHC. Similar to identified hadrons, the light nuclei show a monotonic rise with increasing and mass ordering at low for all measured collision energies. The beam energy dependence of is small at intermediate and only prominent at high , which is similar to the the trend as observed for the charged hadron . The of nuclei and anti-nuclei are of similar magnitude for top collision energies at RHIC but at lower collision energies, the difference in between nuclei and anti-nuclei qualitatively follow the difference in proton and anti-proton . The centrality dependence of light (anti-)nuclei is similar to that of identified hadrons .
Light (anti-)nuclei is found to follow the atomic mass number () scaling for almost all collision energies at RHIC suggesting coalescence as the underlying process for the light nuclei production in heavy-ion collisions. However, a deviation from mass number scaling at the level of 20% is observed at LHC. This indicates that a simple coalescence process may not be the only underlying mechanism for light nuclei production. Furthermore, a transport-plus-coalescence model study is found to approximately reproduce the light nuclei measured at RHIC and LHC. The agreement of coalescence model with the data from PHENIX and STAR are imperceptibly better than the blast-wave model. However, at the LHC energy, the light nuclei is better described by blast-wave model rather than the simple coalescence model. The coalescence mehcanism, intuitively, should be the prominent process of light nuclei production. However, the breaking of mass scaling at LHC energy and success of blast-wave model prevent us to draw any definitive conclusion on the light nuclei production mechanism.
We observed orders of magnitude difference in and as predicted by blast-wave and coalescence model. The blast-wave model predicts almost zero for and up to 2.5 GeV/c, whereas the coalescence model predicts significant for and at same range. Hence, the precise measurements of and in future can significantly improve the knowledge of the light nuclei production mechanism in heavy-ion collisions.
Acknowledgements
We thank STAR collaboration, PHENIX collaboration and ALICE collaboration for providing the light nuclei data and the model predictions. This work is supported by DAE-BRNS project grant No. 2010/21/15-BRNS/2026 and Dr. C. Jena is supported by XIIth plan project PIC. No. 12-R&D-NIS-5.11-0300. The authors declare that there is no conflict of interest regarding the publication of this paper.
References
- (1) N. Itoh, Prog. Theor. Phys. 44, 291 (1970); M. A. Stephanov, K. Rajagopal, and E. V. Shuryak, Phys. Rev. Lett. 81, 4816 (1998); M. A. Stephanov, K. Rajagopal, and E. V. Shuryak, Phys. Rev. D 60, 114028, (1999); M. A. Stephanov, PoS LAT2006, 024 (2006), arXiv:hep-lat/0701002; K. Fukushima and T. Hatsuda, Rep. Prog. Phys. 74, 014001 (2010).
- (2) I. Arsene et al. (BRAHMS collaboration), Nucl. Phys. A 757, 1 (2005); B. B. Back et al. (PHOBOS Collaboration), Nucl. Phys. A 757, 28 (2005); J. Adams et al. (STAR Collaboration), Nucl. Phys. A 757, 102 (2005); K. Adcox et al. (PHENIX Collaboration), Nucl. Phys. A 757, 184 (2005).
- (3) S. Gupta, X. Luo, B. Mohanty, H. G. Ritter, N. Xu, Science 332, 1525 (2011).
- (4) L. Adamczyk et al. (STAR Collaboration), Phys. Rev. Lett. 112, 032302 (2014).
- (5) K. Aamodt et al. (ALICE Collaboration), J. Instrum. 3, S08002 (2008); B. B. Abelev et al. (ALICE Collaboration), Int. J. Mod. Phys. A 29, 1430044 (2014).
- (6) G. Lemaître, Annales de la société Scientifique de Bruxelles 47, 49 (1927).
- (7) A. Mekjian, Phys.Rev. C 17, 1051 (1978); P. Siemens and J. I. Kapusta, Phys.Rev.Lett. 43, 1486 (1979).
- (8) P. Braun-Munzinger and J. Stachel, J. Phys. G 21, L17 (1995); P. Braun-Munzinger and J. Stachel, J. Phys. G 28, 1971 (2002); A. Andronic, P. Braun-Munzinger, J. Stachel and H. Stöcker, Phys. Lett. B 697, 203 (2011); J. Stachel, A. Andronic, P. Braun-Munzinger and K. Redlich, J. Phy. Conf. 509, 01201 (2014).
- (9) S. Chatterjee and B. Mohanty, Phys. Rev. C 90, 034908 (2014).
- (10) S. T. Butler and C. A. Pearson, Phys. Rev. 129, 836 (1963); A. Schwarzschild and C. Zupancic, Phys. Rev. 129, 854 (1963).
- (11) H. H. Gutbrod et al., Phys. Rev. Lett. 37, 667 (1976).
- (12) H. Sato and K. Yazaki, Phys. Lett. B 98, 153 (1981); E. Remler, Annals Phys. 136, 293 (1981); M. Gyulassy, K. Frankel, and E. Remler, Nucl. Phys. A 402, 596 (1983). L. Csernai and J. I. Kapusta, Phys. Rept. 131, 223 (1986).
- (13) P. Danielewicz and G. Bertsch, Nucl. Phys. A 533, 712 (1991); C. B. Dover, U. W. Heinz, E. Schnedermann, and J. Zimanyi, Phys. Rev. C 44, 1636 (1991).
- (14) W. J. Llope et al., Phys. Rev. C 52, 2004 (1995); J. Nagle, B. Kumar, D. Kusnezov, H. Sorge, and R. Mattiello, Phys. Rev. C 53, 367 (1996).
- (15) R. Scheibl and U. Heinz, Phys. Rev. C 59, 1585 (1999).
- (16) S. Zhang, J. Chen, H. Crawford, D. Keane, Y. Ma, et al., Phys. Lett. B 684, 224 (2010); J. Steinheimer, K. Gudima, A. Botvina, I. Mishustin, M. Bleicher, et al., Phys.Lett. B 714, 85 (2012).
- (17) St. Mrówczyński, Acta Physica Polonica B 48, 707 (2017).
- (18) S. A. Voloshin, Nucl. Phys. A 715, 379 (2003).
- (19) D. Molnar and S.A. Voloshin, Phys. Rev. Lett. 91, 092301 (2003).
- (20) R. C. Hwa and C. B. Yang, Phys. Rev. C 67, 064902 (2003); R. J. Fries, B. Muller, C. Nonaka, and S. A. Bass, Phys. Rev. Lett. 90, 202303 (2003).
- (21) T. Z. Yan, Y. G. Ma, X. Z. Cai et al., Phys. Lett. B 638, 50 (2006); Y. Oh and C. M. Ko, Phys. Rev. C 76, 054910 (2007).
- (22) L. Adamczyk et al. (STAR Collaboration), Phys. Rev. C 88, 014902 (2013); L. Adamczyk et al. (STAR Collaboration), Phys. Rev. Lett. 110, 142301 (2013).
- (23) L. Adamczyk et al. (STAR Collaboration), Phys. Rev. Lett. 116, 062301 (2016).
- (24) S. S. Adler et al. (PHENIX Collaboration), Phys. Rev. Lett. 91, 182301 (2003).
- (25) S. S. Adler et al. (PHENIX Collaboration), Phys. Rev. C 69, 034909 (2004).
- (26) S. Nagamiya et al., Phys. Rev. C 24, 971 (1981); H. H. Gutbrod et al., Phys. Rev. Lett. 37, 667 (1976); R. L. Auble et al., Phys. Rev. C 28, 1552 (1983).
- (27) S. Wang et al., (EOS Collaboration), Phys. Rev. Lett. 74, 2646 (1995); M. A. Lisa et al., (EOS Collaboration), Phys. Rev. Lett. 75, 2662 (1995).
- (28) M. Aoki et al., Phys. Rev. Lett. 69, 2345 (1992).
- (29) T. A. Armstrong et al. (E864 Collaboration), Phys. Rev. Lett. 85, 2685 (2000); J. Barrette et al. (E877 Collaboration), Phys. Rev. C 61, 044906 (2000); S. Albergo et al., Phys. Rev. C 65, 034907 (2002).
- (30) S. Kabana (for the NA52 collaboration) Nucl. Phys. A 638, 411c (1998); T. Anticic et al. (NA49 Collaboration), Phys. Rev. C 85, 044913 (2012); G. Melkumov (for the NA49 collaboration), PoS CPOD07, 024 (2007); V. I. Kolesnikov (for the NA49 Collaboration), J. Phys. Conf. Ser. 110, 032010 (2008).
- (31) I. G. Bearden et al., Phys. Rev. Lett. 85, 2681 (2000).
- (32) A. Polleri et al., Phys. Lett. B 419, 19 (1998).
- (33) S. Voloshin and Y. Zhang, Z Phys C 70, 665 (1996).
- (34) A. M. Poskanzer and S. A. Voloshin, Phys. Rev. C 58, 1671 (1998).
- (35) P. Danielewicz, Phys. Rev. C 51, 716 (1995).
- (36) E877 Collaboration, J. Barrette et al., Phys. Rev. C 56, 3254 (1997).
- (37) E877 Collaboration, J. Barrette et al., Phys. Rev. C 55, 1420 (1997).
- (38) L. Adamczyk et al. (STAR Collaboration), Phys. Rev. C 94, 034908 (2016).
- (39) S. Afanasiev et al. (PHENIX Collaboration), Phys. Rev. Lett. 99, 052301 (2007).
- (40) S. Acharya et al. (ALICE Collaboration), arXiv:1707.07304 [nucl-ex].
- (41) M. Anderson et al. (STAR Collaboration), Nucl. Instrum. Methods A 499, 659 (2003).
- (42) J. Adams et al. (STAR Collaboration), Physics Letters B 637 161 (2006).
- (43) J. Alme et al., Nucl. Instrum. Meth. A 622, 316 (2010).
- (44) J. Adam et al. (ALICE Collaboration), Phys. Rev. C 93, 024917 (2016).
- (45) W. J. Llope, Nucl. Instrum. Methods B 241, 306 (2005); W. J. Llope, Nucl. Instrum. Methods A 661, S110 (2012).
- (46) A. Akindinov et al., Eur. Phys. J. Plus 128, 44 (2013).
- (47) Francesco Noferini (for the ALICE Collaboration), JHEP 06, 190 (2015).
- (48) S. A. Voloshin, A. M. Poskanzer and R. Snellings, in Landolt-Boernstein, Relativistic Heavy Ion Physics, Vol. 1/23, p 5-54 (Springer-Verlag,2010); arXiv:0809.2949 [nucl-ex].
- (49) P. Huovinen, P. F. Kolb, U. W. Heinz, P. V. Ruuskanen, and S. A. Voloshin, Phys. Lett. B 503, 58 (2001).
- (50) H. Li et al., Phys. Rev. C 93, 051901 (2016), H. Li et al., arXiv:1604.07387.
- (51) H. Xu, Z. Li, H. Song, Phys. Rev. C 93, 064905 (2016).
- (52) S. A. Voloshin, A. M. Poskanzer and R. Snellings, Landolt-Börnstein series, Springer-Verlag, Berlin Germany, Vol. 23, p. 293 (2010), arXiv:0809.2949v2 [nucl-ex].
- (53) Y. Burnier, D. E. Kharzeev, J. Liao, and H.U. Yee, Phys. Rev. Lett 107, 052303 (2011).
- (54) J. C. Dunlop, M. A. Lisa, and P. Sorensen, Phys. Rev. C 84, 044914 (2011).
- (55) V. Greco, M. Mitrovski, and G. Torrieri, Phys. Rev. C 86, 044905 (2012).
- (56) J. Steinheimer, V. Koch, and M. Bleicher Phys. Rev. C 86, 044903 (2012).
- (57) J. Xu, L. W. Chen, C. M. Ko and Z. W. Lin, Phys. Rev. C 85, 041901(R) (2012); J. Xu, T. Song, C. M. Ko, and F. Li, Phys. Rev. Lett. 112, 012301 (2014); T. Song, S. Plumari, V. Greco, C. M. Ko, F. Li, arXiv:1211.5511 [nucl-th]; J. Xu, C.M. Ko, F. Li, T. Song, and H. Liu, arXiv:1407.3882v3 [nucl-th].
- (58) L. Adamczyk et al. (STAR Collaboration), Phys. Rev. C 93, 014907 (2016).
- (59) B. Abelev et al. (ALICE Collaboration), JHEP 06, 190 (2015).
- (60) X. Sun, H. Masui, A. M. Poskanzer, and A. Schmah, Phys. Rev. C 91, 024903 (2015).
- (61) Z. Lin, C. M. Ko, B. A. Li, B. Zhang, and S. Pal, Phys. Rev. C 72, 064901 (2005).
-
(62)
M. R. Haque, Ph.D Thesis, NISER India,
https://drupal.star.bnl.gov/STAR/theses/phd-67 - (63) Lilin Zhu, Che Ming Ko, and Xuejiao Yin Phys. Rev. C 92, 064911 (2015).
- (64) B. Abelev et al. (ALICE Collaboration), Phys. Lett. B 736, 196 (2014).
- (65) X. Dong, S. Esumi, P. Sorensen, N. Xu, and Z. Xu, Phys. Lett. B 597, 328 (2004).
- (66) H. Agakishiev et al. (STAR Collaboration), Nature 473, 353 (2011).
- (67) B. I. Abelev et al. (STAR Collaboration), Science 328, 58 (2010).
- (68) J. Adam et al. (ALICE Collaboration), Physics Letters B 754, 360 (2016).