Bismuth Ferrite Dielectric Nanoparticles Excited at Telecom Wavelengths as Multicolor Sources by Second, Third, and Fourth Harmonic Generation
Abstract
We demonstrate the simultaneous generation of second, third, and fourth harmonic from a single dielectric Bismuth Ferrite nanoparticle excited by a telecom fiber laser at 1560 nm. We first characterize the signals associated with different nonlinear orders in terms of spectrum, excitation intensity dependence, and relative signal strengths. Successively, on the basis of the polarization-resolved emission curves of the three harmonics, we discuss the interplay of susceptibility tensor components at the different orders and we show how polarization can be used as an optical handle to control the relative frequency conversion properties.
Keywords: harmonic generation; harmonic nanoparticles; perovskites; bismuth ferrite; frequency conversion.
Introduction
The generation and control of nonlinear parametric signals at the nanoscale is paving the way to novel applications in imaging, sensing, optoelectronics. To date, most of the research efforts have been concentrated on noble metal nanoparticles and nanostructuresKauranen and Zayats (2012) with a focus on their second ()Dadap et al. (1999); Butet et al. (2010) and third order ()Lippitz et al. (2005); Danckwerts and Novotny (2007) response. Some notable exceptions include the nonlinear harmonic generation by semiconductor nanoparticlesJacobsohn and Banin (2000); Bar-Elli et al. (2015), two dimensional materialsDean and van Driel (2009); Hong et al. (2013); Kumar et al. (2013); Karvonen et al. (2015), and noncentrosymmetric metal oxide nanoparticles (Harmonic NanoParticles, HNPs). Dielectric HNPs are attracting growing interest because of their extremely high nonlinear coefficients,Rogov et al. (2015) and robustness of their nonlinear response which - contrary to noble metal particles - is primarily associated with their bulk properties and negligibly affected by surface phenomena.Staedler et al. (2012); Kim et al. (2013) Moreover, the sub-wavelength dimensions of HNPs lift the spectral limitations imposed by phase-matching conditions in bulk nonlinear crystals, enabling wide tunability of excitation light and emission of multiple signals at once. Some research groups are working on the efficiency enhancement of the optical properties by engineering hybrid systems based on a HNP-core and a plasmonic-shell tailored for specific spectral resonances.Pu et al. (2010); Richter et al. (2014)
Recently, we have demonstrated the simultaneous acquisition of Second and Third Harmonic Generation (SHG, THG) by bare individual perovskite Bismuth Ferrite (BiFeO3, BFO) HNPs.Schmidt et al. (2016) We showed that the coincident acquisition of both harmonics can strongly benefit to imaging selectivity in optically congested environmentsRogov et al. (2015) for applications including cell-tracking over long time in tissues.Dubreil et al. (2017) Besides harmonic generation, one can expect that high values by HNPs can be exploited for disposing of localized sources of long wavelength radiation by optical rectification or for generating nonclassical states of light, in analogy to what has been demonstrated using other kinds of nanostructures.Polyushkin et al. (2011); Grice and Walmsley (1997); Dot et al. (2012); Wu et al. (1986) In this respect, the possibility of working efficiently at telecom wavelengths (1.5 m) undeniably constitutes an asset for a future integration of HNPs as frequency conversion elements and all-optical logic operatorsPuddu et al. (2004) in photonics circuits.
In this work, we demonstrate that second, third, and fourth harmonic (FHG) emitted by an individual BFO HNP upon excitation at 1560 nm by an Erbium-doped fiber oscillator can be efficiently detected. Moreover, we show how the polarization control of excitation light allows tuning the relative intensities of the three harmonics. The simultaneous acquisition of three harmonics from the same individual nanoparticle is - to our best knowledge - a unicum to date and, besides all the applications we mentioned, HNPs might assume the role of model system for the study of the interplay among multiple-harmonics and high harmonic generation in solids.Ghimire et al. (2011); Vampa et al. (2015); Luu and Wörner (2016); Saltiel et al. (2005)
Results and Discussion
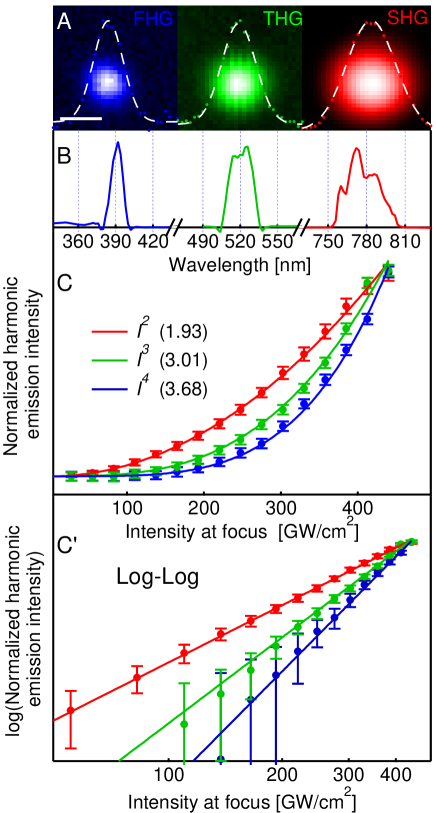
The starting evidence motivating this work is the observation that single BFO HNPs deposited on a substrate in the focus of the laser emit simultaneously at the three harmonics as from the images in Fig. 1A. The heat-maps colors are red for SHG (780 nm), green for THG (520 nm), and blue for FHG (390 nm). In the following, we first present a thorough assessment demonstrating by independent experimental observables [i) image spot size, ii) spectrum, and iii) excitation intensity dependence] that the three emission are genuinely associated with different nonlinear orders. Successively, we discuss the polarization-resolved emissions at the different orders which shed light on the tensorial properties of the nonlinear susceptibilities and could prospectively be exploited for selective frequency up-conversion from short-wave infrared to the visible.
i) The Gaussian fits to the diameters of the particle images in Fig. 1A indicate that the FWHM decreases with increasing nonlinearity, as one expects for a diffraction limited object smaller than the point spread function (PSF) at the highest order. The observed widths of the PSF range from 673 nm for SHG, to 486 nm for THG and 420 nm for FHG. The average dimensions of the HNPs ( 100 nm, Fig. S1) remain therefore out of reach at all orders. In the Supplementary Material, we further comment these results in the context of the imaging properties of the set-up. ii) In Fig. 1B, we provide the normalized harmonic spectra detected in the forward direction. In the wavelength domain, one expects the width of the emission to scale as , with being the nonlinear order. This formula is derived for Gaussian pulses in the time domain.Ehmke et al. (2015) Therefore, to apply this estimation to our traces stemming from a structured spectral profile at the excitation wavelength, we proceeded by visually determining the broadest Gaussian curves supported by the excitation and by each harmonic spectrum (Fig. S2). This way, we obtained widths for the different harmonics within 10% deviation from the theoretical estimation. This procedure, although involving approximations, points to a rather complete upconversion of the frequencies in the fundamental spectrum and it is consistent with the fact that BFO HNPs are smaller than the coherence lengths for each nonlinear order, . By using the optical constants of BFO derived by Kumar et al.Kumar et al. (2008) and applying a calculation including the effect of Gouy phase (see Eq. S1) we obtain values in the forward direction spanning from 1 m for to 0.325 and 0.23 m for and 4, respectively.Cheng and Xie (2002) In our calculations, deem larger than HNPs typical dimensions. This implies that no destructive interference takes place within the particle volume. iii) To complete this preliminary assessment of multiorder response, in Fig. 1C, we present the harmonic signal strength as a function of the laser intensity at the sample, . Note that for this comparison the signals are normalized at the maximal laser intensity of the series, which corresponds to 440 GW/cm2. As discussed in the next section, in absolute terms the THG is by far the most intense under these excitation/detection conditions: roughly 2 orders of magnitude stronger than SHG and 4 orders stronger than FHG. In the image, the nominal fitting curves (i.e., , ) are plotted as continuous lines. One can appreciate their fairly good agreement with the experimental data. In the legend, we report the optimal values for the exponent obtained letting this parameter free to vary in the fitting procedure. The retrieved values are all within 10% deviation from the theoretical values. In Fig. 1C’, the data and fitting curves from panel C are provided in log-log representation. Altogether these results obtained by independent measurements (nonlinear PSF, harmonic spectra, intensity dependence) support the association of the signals from single HNPs with three different harmonics: SHG, THG, and FHG.
Relative intensities of harmonic orders.
A natural question arises concerning the relative intensities of the three emissions, as one would normally expect a major decrease in signal strength with increasing nonlinear rank, provided that the symmetry requirements (i.e., noncentrosymmetricity) are fulfilled for the generation of even orders (SHG, FHG,…). Clearly, one should also take into proper account the different intensity dependence exhibited by signals associated with each : higher excitation intensity is expected to favour higher orders as the ratio of two successive harmonics scales as . Dai et al. (2014) In a previous Hyper Rayleigh Scattering experiment at 1064 nm, we determined that SHG/THG40 for 11 GW/cm2 excitation.Schmidt et al. (2016) Therefore, we could expect this ratio to be here 1 when working at 53-fold larger intensity, viz. 590 GW/cm2 (280 pJ/pulse). However, we observe a surprisingly smaller SHG/THG value, of the order of 10-2-. Sample resonances play an important role in determining the value of harmonic ratios:Kuznetsov et al. (2016) a resonance was reported at 504 nm for BFO 25 nm thin filmsKumar et al. (2008) supporting the efficient generation of THG observed here at 1560 nm excitation (a green spot is visible by naked eyed on small aggregates). This close-to-resonance condition can also help explaining the very high second order susceptibility reported for BFO HNPs excited at 1064 nm, which was estimated to 160 pm/V.Schwung et al. (2014) The FHG/THG ratio is, on the other hand, of the order of 10-4. Being aware that, among all techniques, the values extracted by microscopy present the largest uncertainty because they imply averaging the response of individual particles (10 in the present case, Fig. S3) with different spatial orientations modulating their harmonic ratios, we complemented these measurements with additional ones performed on pellets of compressed BFO HNPs (Fig. S4A). These measurements were carried out at 1 TW/cm2 using a J laser system, averaging the response of a large ensemble of randomly oriented particles over an elliptic area of 60120 m2. By this approach, we obtained SHG/THG20 (Fig. S4B) while the FHG/THG is 10-4. Such a large discrepancy among the outcomes of the two methods, in particular for the SHG/THG ratio, is not fully clear. On one hand, the presence of aggregates in the pellets with dimensions exceeding the coherent length of BFO can affect the signal in an uneven way throughout the spectral domain. Moreover, the comparison can be also undermined by the difficulty to find a meaningful definition of peak intensity encompassing both large particles ensembles and isolated objects substantially smaller than the focal spot size. Finally, the difference observed can be ascribed to the critical dependence of coherent signals generated by individual nanostructures on experimental settings (e.g., N.A. and collection angle). This last aspect has been subject of multiple theoretical studies in the plasmonic community based on different approaches (method of moments,Araújo et al. (2012) finite elements,Poutrina et al. (2013) hydrodynamic modelSipe et al. (1980); Ciraci et al. (2013)). Recently, the hydrodynamic approach has been applied to calculate the SHG and THG angular radiation patterns simultaneously emitted by individual plasmonic nanoparticles, which specifically highlights this sensitivity to detection parameters showing rather different angular emission patterns at the two harmonics.Ginzburg et al. (2014) We believe that only a rigorous extension to higher harmonics of Hyper Rayleigh Scattering on colloidal suspensions can provide reliable values for the material.Joulaud et al. (2013)
The comparatively high conversion efficiencies at the third order we observe by both approaches for a noncentrosymmetric material displaying very high quadratic nonlinearity such as BFO, can also be potentially ascribed to the presence of multi-step (cascading) processes involving a succession of purely phenomena: SHG and sum frequency mixing.Saltiel et al. (2005) In this case, THG would result from and ,Bosshard et al. (2000) whereas FHG from and or, alternatively, from followed by and .Ivanov and Saltiel (2005) It is tempting to attribute the comparatively low emission at to a depletion of this frequency used as intermediate field for generating , however discerning multi-step from direct higher order nonlinear processes is a complex task, in particular for nanoparticles as the absence of macroscopic propagation excludes discrimination methods based on phase-matching criteria.Bosshard et al. (2000) The use of HNPs with controlled size and narrow size distribution or epitaxial thin films of variable thickness could help elucidating this aspect in a future series of experiments.
Polarization properties.
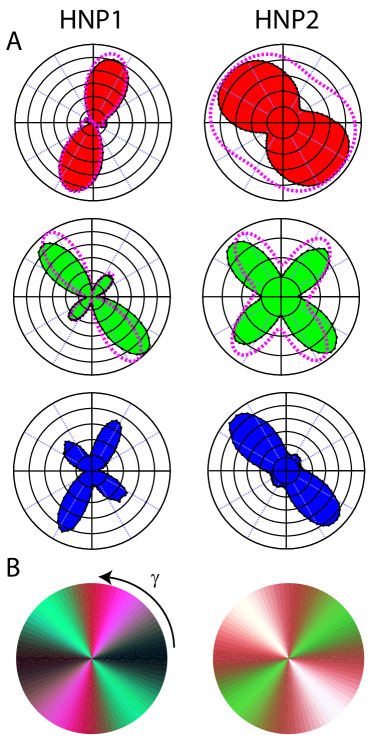
In Fig. 2A, we introduce the results on polarization dependence for two sub-diffraction limited and isolated particles: HNP1 and HNP2. The shaded regions display the intensity of the harmonic emission detected as a function of the polarization angle of the excitation laser, . Note that differently from other works,Brasselet et al. (2004); Bonacina et al. (2007); Schmidt et al. (2016) in this case no polarization analyser was set in the detection arm. The differences between the response of the two HNPs are associated with the different spatial orientations of their crystal axis with respect to the laboratory frame (Euler angles in Fig. 3). The simple inspection of the polarization resolved traces can provide precious information and it deems useful to discard from the analysis eventual polycrystalline aggregates.Brasselet et al. (2004); Bonacina et al. (2007) In general, the SHG traces possess a structure characterized by two dominant lobes in agreement with our previous observations.Schmidt et al. (2016) For THG and FHG the side lobes become more prominent. Interestingly, the orientation of the main lobes is mostly maintained among the even orders (SHG, FHG) while for THG it seems that other tensor elements become predominant with major changes in orientation and symmetry. In our previous study,Schmidt et al. (2016) starting from a known tensor,Kumar et al. (2008) we fitted the orientation of several BFO particles and then used the retrieved Euler angles to determine the unknown tensor elements by simultaneously fitting the THG response of several HNPs. Here, we use these tensor values for and to fit the SHG and THG traces and obtain the Euler angles of each particle. The fits are reported as purple dashed lines on the data and the angle sets for HNP1 and HNP2 provided in the figure caption. Although the fits correctly capture the main features of the polarization curves (main lobes angles, presence of orthogonal lobes), one should be aware that this procedure implies several approximations and the result should be considered qualitative in nature and primarily intended to support the fact that the BFO point group (3m) is compatible with the observed traces. In particular, the tensors we apply are derived at 1064 nm and not at 1560 nm. Note also that we could not readily extend this approach to because the number of independent elements of this tensor prevents the retrieval of a reliable outcome. Finally, we highlight that the possible presence of competing multi-step processes would undermine the general validity of this description, which would remain however an effective tool for predicting the polarization dependent response of BFO HNPs even in presence of concurrent direct and cascaded generation.
Polarization-based control of relative harmonic intensities.
The response of the two randomly oriented HNPs suggests that the choice of the excitation polarization, even in absence of any detection analyser, can be used to modulate the relative intensities of the three emissions for a given laser polarization angle . In Fig. 2B, we graphically emphasize this procedure showing the total emission obtained by adding the normalized polarization dependent harmonic components displayed by HNP1 and HNP2. This alternative representation shows how, for a given HNP orientation, specific values of are associated with strong simultaneous SH, TH, FH emission (white regions), with individual harmonics (red, green, blue in our representation) and combination thereof (purple, pink…) or low emission (dark regions). We speculate that this approach could be adapted to precisely oriented BFO HNPs and thin films with thickness smaller than the shortest coherence length to provide polarization-controlled frequency converters from the telecom region over the visible spectrum. Engineered hybrid structures composed by HNPs with a plasmonic shell of tailored thickness or, alternatively, the choice of materials with tailored resonances,Kuznetsov et al. (2016) could also be a way to mitigate the large conversion efficiency differences at the three harmonic orders for defined applications.Pu et al. (2010); Richter et al. (2014) Alternatively, one could shape the excitation geometry to control to some extent the angular emission pattern at the different orders.Carletti et al. (2016)
Conclusions
In conclusion, we have reported what, to our best knowledge, is the first demonstration of simultaneous acquisition of three harmonic frequencies generated by an isolated nanoparticle. Notably, our experiment is performed using a pJ fiber laser at telecom wavelength, which holds great promise for implementing dielectric nonlinear nanophotonicsSmirnova and Kivshar (2016) in optoelectronic circuitry. Considered the novelty of our observation, we first thoroughly assessed the spectral and imaging properties and the intensity dependence of the emissions to ensure that they are genuinely associated with frequency conversion by () or cascaded processes. The relative intensities of the three harmonics have been critically discussed highlighting the sensitivity of this parameter to the measurement method. All estimations point to high generation efficiency for THG, likely because of the presence of electronic resonances in the spectrum. Finally, we have discussed the excitation-polarization dependence of the particle emission, demonstrating that this approach opens the way to directly investigating the interplay among nonlinear susceptibility tensors elements at different orders and modulating the relative strengths of three color components (red, green, violet) for photonics applications.
Methods
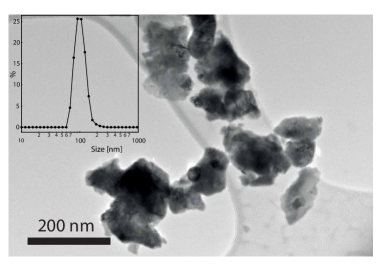
BFO nanoparticles synthesized by the company FEE GmbH (Idar-Oberstein, Germany) were obtained as a water stabilized colloidal suspension from the company TIBIO (Comano, Switzerland) under a research agreement. The average size is estimated to 100 nm by dynamic light scattering (DLS) and transmission electron microscopy (Fig. S1). For imaging, a drop of BFO suspension is cast onto a microscope substrate and the solvent let evaporating.
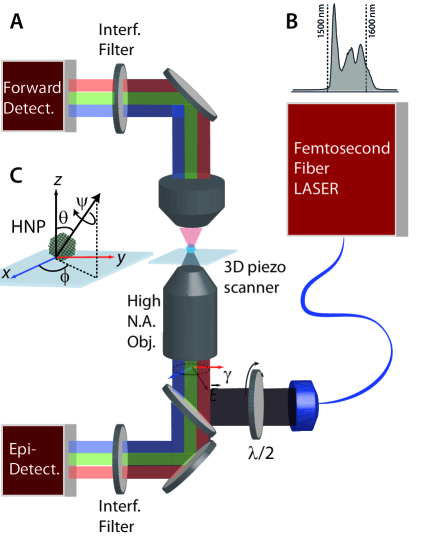
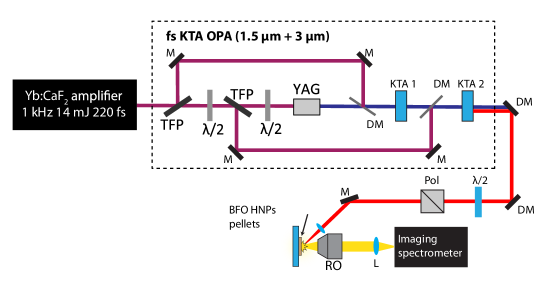
As reported in Fig. 3, the light source of the set-up is a Telecom femtosecond fiber laser at 1560 nm with a repetition rate of 100 MHz and 100 mW average power (T-Light FC, Menlo Systems). Pulses are compressed down to 90 fs by an optical fiber connected to the laser output. At the fiber output, the beam is collimated in the free space and expanded to a diameter of 6 mm. For polarization resolved studies, the linear polarization of the laser is rotated by a plate mounted on a motorized rotation stage. In the case of power dependence measurements, the laser energy is continuously modulated through the succession of a plate and a polarisation analyser. Afterwards, the beam is reflected by a 45 degrees short-pass filter (Chroma) and focused on a single isolated HNP by a 100 microscope oil immersion objective (NA 1.3). The signal generated by the particles can be detected in the backward or forward direction. In the latter case, the collection objective is a 40 N.A. 0.6 air objective. HNPs are selected by scanning a planar ROI of approximately 2020 m2 with a piezo-stage and carefully adjusting the position by maximizing their nonlinear signal. Both for epi- and forward-detection, narrow bandwidth interference filters are used to select the harmonic spectral region (Thorlabs FBH780-10 for SHG, FBH520-40 for THG, FBH400-40 for FHG and Semrock BrightLine Fluorescence Filter 387/11 for FHG). Additionally, a scanning spectrometer (Acton SP2300, Princeton Instruments, 300 g/mm) is placed in the forward detection arm to acquire spectrally resolved traces. The measurements are obtained using two different Hamamatsu detectors, selected according to their spectral response: H7732-01 low noise side-on photomultiplier tube (185 nm to 680 nm), and H7421-50 photon counting head with a GaAs photocatode (380 nm to 890 nm). Alternatively, we use a ultra-low-noise single photon counting module (SPD-A-VISNIR, Aurea Technology, Besançon, France).
I Acknowledgements
We acknowledge the financial support by Swiss SEFRI (project C15.0041, Multi Harmonic Nanoparticles), by the French-Switzerland Interreg programme (project NANOFIMT), and by the NCCR Molecular Ultrafast Science and Technology of the Swiss National Science Foundation. This study was performed in the context of the European COST Action MP1302 Nanospectroscopy.
We are grateful to Dr. Davide Staedler at TIBIO SA (Comano, Switzerland) and Dr. Daniel Rytz at FEE GmbH (Idar-Oberstein, Germany) for synthesizing and providing us colloidally stable BFO HNPs, to Dr. Johann Cussey from Aurea Technology (Besançon, France) for providing us the the single photon counting module and technological support, and Virginie Monnier (Institut des Nanotechnologies, Lyon) for the TEM images of BFO HNPs.
References
- Kauranen and Zayats (2012) M. Kauranen and A. V. Zayats, Nature Photonics, 2012, 6, 737–748.
- Dadap et al. (1999) J. I. Dadap, J. Shan, K. B. Eisenthal and T. F. Heinz, Physical Review Letters, 1999, 83, 4045.
- Butet et al. (2010) J. Butet, J. Duboisset, G. Bachelier, I. Russier-Antoine, E. Benichou, C. Jonin and P.-F. Brevet, Nano Letters, 2010, 10, 1717–1721.
- Lippitz et al. (2005) M. Lippitz, M. A. van Dijk and M. Orrit, Nano Letters, 2005, 5, 799–802.
- Danckwerts and Novotny (2007) M. Danckwerts and L. Novotny, Physical Review Letters, 2007, 98, 026104.
- Jacobsohn and Banin (2000) M. Jacobsohn and U. Banin, The Journal of Physical Chemistry B, 2000, 104, 1–5.
- Bar-Elli et al. (2015) O. Bar-Elli, E. Grinvald, N. Meir, L. Neeman and D. Oron, ACS Nano, 2015, 9, 8064–8069.
- Dean and van Driel (2009) J. J. Dean and H. M. van Driel, Applied Physics Letters, 2009, 95, 261910.
- Hong et al. (2013) S.-Y. Hong, J. I. Dadap, N. Petrone, P.-C. Yeh, J. Hone and R. M. Osgood Jr, Physical Review X, 2013, 3, 021014.
- Kumar et al. (2013) N. Kumar, S. Najmaei, Q. Cui, F. Ceballos, P. M. Ajayan, J. Lou and H. Zhao, Physical Review B, 2013, 87, 161403.
- Karvonen et al. (2015) L. Karvonen, A. Säynätjoki, S. Mehravar, R. D. Rodriguez, S. Hartmann, D. R. Zahn, S. Honkanen, R. A. Norwood, N. Peyghambarian and K. Kieu, Scientific Reports, 2015, 5, 10334.
- Rogov et al. (2015) A. Rogov, Y. Mugnier and L. Bonacina, Journal of Optics, 2015, 17, 033001.
- Staedler et al. (2012) D. Staedler, T. Magouroux, R. Hadji, C. Joulaud, J. Extermann, S. Schwungi, S. Passemard, C. Kasparian, G. Clarke, M. Gerrmann, R. Le Dantec, Y. Mugnier, D. Rytz, D. Ciepielewski, C. Galez, S. Gerber-Lemaire, L. Juillerat-Jeanneret, L. Bonacina and J. P. Wolf, ACS Nano, 2012, 6, 2542–2549.
- Kim et al. (2013) E. Kim, A. Steinbrück, M. T. Buscaglia, V. Buscaglia, T. Pertsch and R. Grange, ACS Nano, 2013, 7, 5343–5349.
- Pu et al. (2010) Y. Pu, R. Grange, C. L. Hsieh and D. Psaltis, Physical Review Letters, 2010, 104, 207402.
- Richter et al. (2014) J. Richter, A. Steinbrück, M. Zilk, A. Sergeyev, T. Pertsch, A. Tünnermann and R. Grange, Nanoscale, 2014, 6, 5200–5207.
- Schmidt et al. (2016) C. Schmidt, J. Riporto, A. Uldry, A. Rogov, Y. Mugnier, R. Le Dantec, J.-P. Wolf and L. Bonacina, Scientific Reports, 2016, 6, 25415.
- Rogov et al. (2015) A. Rogov, M. Irondelle, F. Ramos Gomes, J. Bode, D. Staedler, S. Passemard, S. Courvoisier, Y. Yamamoto, F. Waharte, D. Ciepielewski, P. Rideau, S. Gerber-Lemaire, F. Alves, J. Salamero, L. Bonacina and J.-P. Wolf, ACS Photonics, 2015, 2, 1416–1422.
- Dubreil et al. (2017) L. Dubreil, I. Leroux, M. Ledevin, C. Schleder, L. Lagalice, C. Lovo, R. Fleurisson, S. Passemard, V. Kilin, S. Gerber-Lemaire, M.-A. Colle, L. Bonacina and K. Rouger, ACS Nano, 2017, 11, 6672–6681.
- Polyushkin et al. (2011) D. Polyushkin, E. Hendry, E. Stone and W. Barnes, Nano Letters, 2011, 11, 4718–4724.
- Grice and Walmsley (1997) W. P. Grice and I. A. Walmsley, Physical Review A, 1997, 56, 1627.
- Dot et al. (2012) A. Dot, A. Borne, B. Boulanger, K. Bencheikh and J. Levenson, Physical Review A, 2012, 85, 023809.
- Wu et al. (1986) L.-A. Wu, H. Kimble, J. Hall and H. Wu, Physical Review Letters, 1986, 57, 2520.
- Puddu et al. (2004) E. Puddu, A. Allevi, A. Andreoni and M. Bondani, JOSA B, 2004, 21, 1839–1847.
- Ghimire et al. (2011) S. Ghimire, A. D. DiChiara, E. Sistrunk, P. Agostini, L. F. DiMauro and D. A. Reis, Nature Physics, 2011, 7, 138–141.
- Vampa et al. (2015) G. Vampa, T. Hammond, N. Thiré, B. Schmidt, F. Légaré, C. McDonald, T. Brabec and P. Corkum, Nature, 2015, 522, 462–464.
- Luu and Wörner (2016) T. T. Luu and H. J. Wörner, Physical Review B, 2016, 94, 115164.
- Saltiel et al. (2005) S. M. Saltiel, A. A. Sukhorukov and Y. S. Kivshar, Multistep parametric processes in nonlinear optics in Progress in Optics volume 47, ed. Elsevier, 2005.
- Ehmke et al. (2015) T. Ehmke, A. Knebl, S. Reiss, I. R. Fischinger, T. G. Seiler, O. Stachs and A. Heisterkamp, AIP Advances, 2015, 5, 084903.
- Kumar et al. (2008) A. Kumar, R. C. Rai, N. J. Podraza, S. Denev, M. Ramirez, Y.-H. Chu, L. W. Martin, J. Ihlefeld, T. Heeg and J. Schubert, Applied Physics Letters, 2008, 92, 121915.
- Cheng and Xie (2002) J.-X. Cheng and X. S. Xie, JOSA B, 2002, 19, 1604–1610.
- Dai et al. (2014) J. Dai, M.-H. Yuan, J.-H. Zeng, Q.-F. Dai, S. Lan, C. Xiao and S.-L. Tie, Applied Optics, 2014, 53, 189–194.
- Kuznetsov et al. (2016) A. I. Kuznetsov, A. E. Miroshnichenko, M. L. Brongersma, Y. S. Kivshar and B. Luk’yanchuk, Science, 2016, 354, aag2472.
- Schwung et al. (2014) S. Schwung, A. Rogov, G. Clarke, C. Joulaud, T. Magouroux, D. Staedler, S. Passemard, T. Justel, L. Badie and C. Galez, Journal of Applied Physics, 2014, 116, 114306.
- Araújo et al. (2012) M. Araújo, J. Taboada, J. Rivero, D. Solís, F. Obelleiro and L. Landesa, IEEE Antennas and Propagation Magazine, 2012, 54, 81–91.
- Poutrina et al. (2013) E. Poutrina, A. Rose, D. Brown, A. Urbas and D. R. Smith, Optics Express, 2013, 21, 31138–31154.
- Sipe et al. (1980) J. Sipe, V. So, M. Fukui and G. Stegeman, Physical Review B, 1980, 21, 4389.
- Ciraci et al. (2013) C. Ciraci, J. B. Pendry and D. R. Smith, ChemPhysChem, 2013, 14, 1109–1116.
- Ginzburg et al. (2014) P. Ginzburg, A. V. Krasavin, G. A. Wurtz and A. V. Zayats, ACS Photonics, 2014, 2, 8–13.
- Joulaud et al. (2013) C. Joulaud, Y. Mugnier, G. Djanta, M. Dubled, J. C. Marty, C. Galez, J. P. Wolf, L. Bonacina and R. Le Dantec, Journal of Nanobiotechnology, 2013, 11, S8.
- Bosshard et al. (2000) C. Bosshard, U. Gubler, P. Kaatz, W. Mazerant and U. Meier, Physical Review B, 2000, 61, 10688–10701.
- Ivanov and Saltiel (2005) R. Ivanov and S. Saltiel, JOSA B, 2005, 22, 1691–1698.
- Brasselet et al. (2004) S. Brasselet, V. Le Floc’h, F. Treussart, J. F. Roch, J. Zyss, E. Botzung-Appert and A. Ibanez, Physical Review Letters, 2004, 92, 207401.
- Bonacina et al. (2007) L. Bonacina, Y. Mugnier, F. Courvoisier, R. Le Dantec, J. Extermann, Y. Lambert, V. Boutou, C. Galez and J. P. Wolf, Applied Physics B-Lasers and Optics, 2007, 87, 399–403.
- Carletti et al. (2016) L. Carletti, A. Locatelli, D. Neshev and C. De Angelis, ACS Photonics, 2016, 3, 1500–1507.
- Smirnova and Kivshar (2016) D. Smirnova and Y. S. Kivshar, Optica, 2016, 3, 1241–1255.
I Supplementary Material
II BFO HNPs characterization
III Width of the Point Spread Function (PSF) at the different harmonic orders
Taking into account excitation wavelength and objective numerical aperture, the nominal lateral FWHM of a perfect imaging system under linear excitation should be FWHM=0.51/N.A.=612 nm.Wilson (2011) For the nonlinear case, Zipfel et al. provide the following expression for a two-photon excited fluorescence emitter: FWHM== 391 nm.Zipfel et al. (2003) These values cannot be applied here because the resolution is expected to be severely reduced by the fact that we are using an high N.A. oil immersion objective intended for the visible region and not for an excitation at 1.5 m. Therefore all aberration corrections and optical elements (comprising the matching medium) are far from optimal. Indeed, we observe an energy reduction of 75% upon laser transmission through this objective, indicating a poor compatibility at this wavelength. By considering that the resolution should be proportional to where is the nonlinear order, we can readily compute an actual value of 840 nm for the width of the linear PSF, both by multiplying the FWHMFHG (420 nm) by and FWHMTHG (486 nm) by . Note that this result supports the fact that we are observing a sub-diffraction limited emitter at two harmonic orders. The same calculation applied to the FWHMSHG (673 nm) provides a result 15% higher. In this series, SHG was epi-detected using the H7421-50 photon counting and THG and FHG forward detected by the H7732-01 low noise side-on photomultiplier tube. The 15% discrepancy can very likely be attributed to the deviation from linear response of the former detector in the intensity regime of the measurement.
Note that the FWHM value of 840 nm was used for the microscopy-based intensity ratio calculation.
IV Estimation of the widths of the harmonic spectra
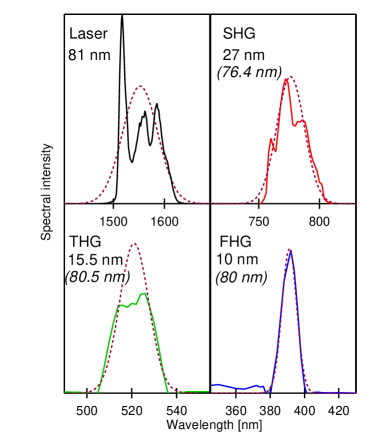
In Fig. 2, we report the normalized spectra of the laser and of the three harmonics generated by a single BFO HNP along with Gaussian curves supported by these spectra and determined by visual inspection. On the figure we provide the Gaussian FWHM and, in parentheses, the product FWHM which should be directly compared with the laser spectrum as discussed in the main text.
V Calculation of coherent lengths at different orders
The coherence length is estimated using
| (1) |
where for SHG, THG, and FHG, respectively. is the wave vector corresponding to the Gouy-phase shift. The numerical value of was estimated at -0.5 by Cheng and Xie for a 1.4 N.A. objective.Cheng and Xie (2002)
VI Intensity ratios
VI.1 Measurements on individual particles
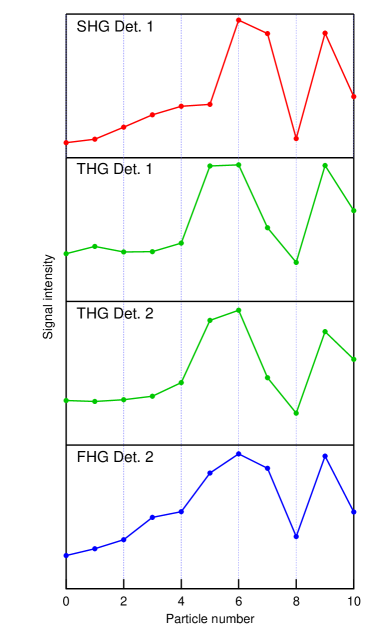
Intensity ratio measurements by individual BFO HNPs were performed using two different detectors to minimize the need of efficiency corrections among different data sets. As reported in Fig. 3, SHG and THG were measured by detector 1 (SPD-A-VISNIR ultra-low-noise single photon counting module, Aurea Technology) and THG and FHG by detector 2 (H7732-01 low noise sideon photomultiplier tube, Hamamtsu). The traces highlight the particle-to-particle signal intensity variations, which come from differences in sizes (all signals are expected to scale as the particle volume squared), orientations, and possibly varying radiation patterns. We further confirmed these results on magnitude estimation among the different nonlinear orders employing a modified set-up with a NA 0.4 reflective Al-coated objective in the forward arm (Newport) and detecting all harmonics by an EM-CCD (Andor, Ixon3) placed at the imaging output of the spectrometer.
VI.2 Ensemble measurements on BFO particle pellets
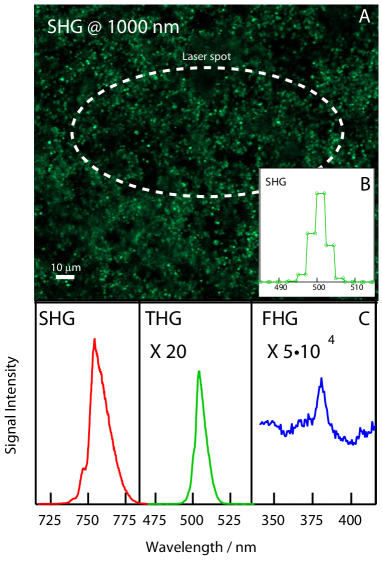
In Fig. 4A, we provide a SHG image of the BFO HNPs pellet surface obtained by a commercial multiphoton microscope (Nikon A1R-MP) coupled with a Ti:sapphire oscillator (Mai Tai Spectra Physics). The epi-collected signal was processed by a Nikon A1 descanned spectrometer. The image scale bar is 10 m. One can see how the SHG intensity of HNPs is modulated by their diverse orientation and that most of the particles appear as bright diffraction limited spots. The emission spectrum averaged over the whole image is reported in Fig. 4B.
For comparing relative intensities of the harmonics on BFO HNPs on dry pellets we relied on the laser set up reported in Fig. 5. This system delivers 80 fs pulses at 1.5 m generated in an OPA pumped by a 1 kHz 14 mJ 200-fs Yb:CaF2 CPA laser. The OPA is based on KTA crystals and seeded by a supercontinuum generated in a bulk YAG plate and delivers 1.5 mJ signal pulses. The signal beam is filtered out at the OPA output using a set of dichroic mirrors, the energy is attenuated using a half-wave plate and a polarizer and then focused onto the sample using =200 mm CaF2 lens at 60∘ incidence. The harmonic signals are collected in reflection geometry using a Schwarzschild objective (ReflX, Edmund Optics), imaged onto the slit of a imaging spectrometer, and detected using an EM-CCD (Andor, Ixon3). In Fig. 3C, we present the spectra of the different harmonic generated by the pellet. The relative intensities are corrected for CCD exposure time and spectral sensitivity and for grating efficiency and can be quantitatively compared.
References
- Schwung et al. (2014) Schwung, S.; Rogov, A.; Clarke, G.; Joulaud, C.; Magouroux, T.; Staedler, D.; Passemard, S.; Justel, T.; Badie, L.; Galez, C. Journal of Applied Physics 2014, 116, 114306.
- Wilson (2011) Wilson, T. Journal of microscopy 2011, 244, 113–121.
- Zipfel et al. (2003) Zipfel, W. R.; Williams, R. M.; Webb, W. W. Nature biotechnology 2003, 21, 1369–1377.
- Cheng and Xie (2002) Cheng, J.-X.; Xie, X. S. JOSA B 2002, 19, 1604–1610.