Atomistic Mechanisms for the Nucleation of Aluminium Oxide Nanoparticles
Abstract
A predictive model for nanoparticle nucleation has not yet been successfully achieved. Classical nucleation theory fails because the atomistic nature of the seed has to be considered since geometrical structure as well as stoichiometry do not always match the bulk values. We present a fully microscopic approach based on a first-principle study of aluminium oxide clusters. We have calculated stable structures of \chemformAl_xO_y and their associated thermodynamic properties. From these data, the chemical composition of a gas composed of aluminium and oxygen atoms can be calculated as a function of temperature, pressure, and aluminium to oxygen ratio. We demonstrate the accuracy of this approach in reproducing experimental results obtained with time resolved spectroscopy of a laser induced plasma from an \chemformAl_2O_3 target. We thus extended the calculation to lower temperatures, i.e. longer time scales, to propose a scenario of composition gas evolution leading to the first alumina seeds.
I Introduction
Although the nucleation of nanoparticles is of crucial interest for a wide range of applications, such as the nanoparticle synthesis or the fight against atmospheric nanoparticles, a predictive model of its mechanisms is not yet achieved. Nucleation consists on the formation of a more stable seed within a metastable phase. This phenomenon can be observed in any first-order phase transition especially with vapour-phase condensation, liquid-to-vapour boiling, solid-state precipitation and binary separations Ford (2004); Clouet (2010); Abraham (1973); Schmelzer (2005). Since the beginning of the 19th century, classical nucleation theory (CNT) has been used for intuitive descriptions Volmer and Weber (1926); Farkas (1927); Becker and Doring (1935). The CNT describes the formation of a spherical particle immersed in a mother phase as a competition between the volume and the surface energies. While the standard Gibbs free energy difference per unit volume between the two phases favors the growth, the surface term, proportional to the surface tension , has an opposite effect. As a result, CNT states the existence of a minimum radius allowing the new phase to grow for radii larger than . is defined by Abraham (1973):
| (1) |
CNT appears to be successful for liquid nucleation in a supersaturated vapour Strey et al. (1994); Diemand et al. (2014). However, this approach remains controversial regarding quantitative results Viisanen et al. (1993); Viisanen and Strey (1994); Hruby et al. (1996); Sen and Mukerji (1999), and its conceptual limitations have been raised by several authors Viisanen et al. (1993); Sen and Mukerji (1999); Lutsko and Duran-Olivencia (2013); Lutsko and Durán-Olivencia (2015). On the one hand, CNT assumes that the seed is homogeneous and isostructural to the bulk crystal. On the other hand, the Otswald rule Ostwald (1897); Threlfall (2003); Zhang and Liu (2009) states that the first growing phase is not always the most stable. During the crystal growth, the geometric structure may indeed reorganise with transient states potentially having a different structure from the bulk analog Baletto et al. (2000, 2001). A second limitation of CNT arises from the capillary approximation which assumes that nucleus and bulk materials have the same thermodynamic properties, and particularly the same surface tension. As an illustration, one may consider the case of \chemformAl_2O_3. For both crystallographic phases ( or ), is almost 1.5 J.m-2 for nanoparticles McHale et al. (1997) and is almost -62 kJ.cm-3 at 298 K Chase et al. (1985). CNT predicts a critical radius of about the Bohr radius. Lastly, the nucleation rate is driven by the probability of a seed reaching by addition of molecules Volmer and Weber (1926); Farkas (1927). This approach involves parameters difficult to quantify Shore et al. (2000). Consequently, the CNT usually fails to predict the nucleation rate, with tens of orders of magnitude discrepancy between theory and experiment Sen and Mukerji (1999).
Over and beyond the CNT’s limitations, the need to explore crystal nucleation becomes increasingly crucial since it may provide a control on the crystal structure and size distribution for nanoparticle synthesis Erdemir et al. (2009). Experimentally, it is challenging to probe nucleation processes since it involves time and length scales that are usually too fast and too small in most experiments.
For computer simulations, two trends can be identified in the literature. On the one hand, molecular dynamics calculations are used with hard-sphere Williams et al. (2008), Lennard-Jones Diemand et al. (2014); Lummen and Kraska (2004); Chakraborty and Patey (2013) or more refined potentials Shen et al. (2013); Desgranges and Delhommelle (2009); Shibuta and Suzuki (2011); Shore et al. (2000) to investigate the nucleation kinetics. On the other hand, first principle calculations are used to study with precision clusters for particular systems such as zinc Al-Sunaidi et al. (2008), silicium Bromley and Illas (2007), and titanium Calatayud et al. (2008); Qu and Kroes (2006) oxides. Apart from the work of Loschen et al. Loschen et al. (2007) who tested different stoichiometries of cerium oxides only the bulk stoichiometry is generally considered in simulations. In addition, very few works compared these computational results with experimental measurements Burnin and BelBruno (2002).
Our work is carried out in the context of laser ablation, including pulsed laser deposition Phipps (2007) or pulsed laser ablation in liquids Barcikowski and Compagnini (2013); Lam et al. (2014a). But it can be generalized to other methods such as cluster sources de Heer (1993) and gas-phase combustion Gardiner (2000). For all these techniques, an atomic vapour or a plasma, is generated at temperatures higher than a thousand Kelvins. Then, the system is quenched down to room temperature, leading to nucleation and growth of the nanoparticles. We investigate nucleation processes through an original use of different tools from quantum chemistry combined with experimental measurements obtained from laser induced plasma spectroscopy Hahn and Omenetto (2010). We choose to work with a model system made of aluminium and oxygen atoms. We first compute the lowest energy structures of \chemformAl_xO_y molecules. Thereafter, we calculate the gas-phase equilibrium composition as a function of the temperature, the pressure and the initial ratio of aluminium to oxygen atoms. For the highest temperatures, the computed composition is compared to experimental measurements obtained from the laser ablation of an alumina target (-\chemformAl_2O_3). Moreover, plasma spectroscopy allows the probing of short time scales, when the plasma is hot and optically active.
II Numerical calculations
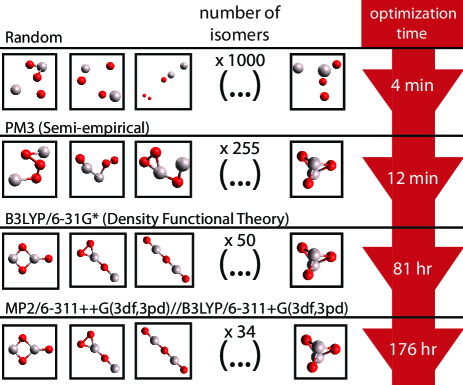
Figure 1 reviews schematically the computational algorithm used for the structural investigation. For each value of x and y, we start from a set of 1000 geometries where atoms are randomly disposed with interatomic distances corresponding to the covalent bond distances. The system is then relaxed via a PM3 semi-empirical method Stewart (1989). The remaining geometries are then optimized using Density Functional Theory (DFT) calculation. Two sets of bases are used successively, B3LYP/6-31G* and B3LYP/6-311+G(3df,3pd). The Gibbs energies were determined using MP2 and B3LYP according to the following steps. The harmonic frequencies were calculated by B3LYP/6-311+G(3df,3pd) using the structures optimized. MP2 thermochemistry was determined by adding B3LYP thermal correction factors to the MP2 single-point energies and is reported as MP2/6-311++G(3df,3pd)//B3LYP/6-311+G(3df,3pd).
The dissociated geometries are removed and only geometries whose energy is at most 2 eV higher than the ground state are kept as the others are not relevant for the temperatures studied . For the biggest clusters \chemform(Al_2O_3)_3 and \chemform(Al_2O_3)_4, the structures published by Sharipov et al. Sharipov et al. (2013) were used as inputs in our optimization process. DFT and MP2 calculations were performed with the Gaussian09 D01 revision.Frisch et al.
We investigated all the molecular formulas following . In addition, two stoichiometric trends were followed, \chemform(AlO)_n and \chemform(Al_2O_3)_n. \chemform(AlO)_n with were chosen because Patzer et al. demonstrated that for clusters with x and y smaller than 4, this stoichiometry is the most stable Patzer et al. (2005). \chemform(Al_2O_3)_n with were investigated because it corresponds to the bulk stoichiometry.
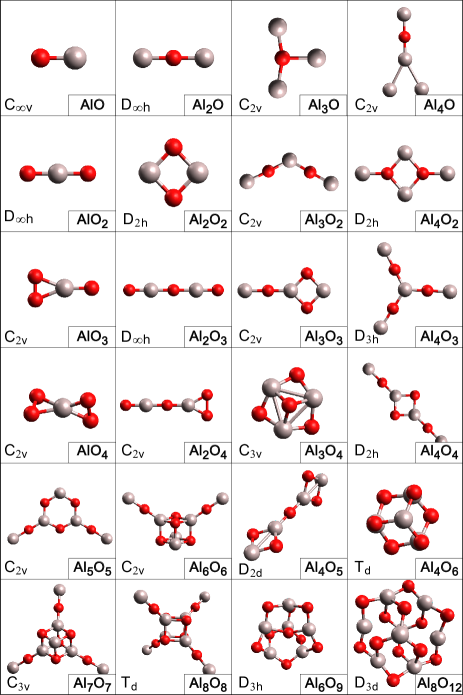
The figure 2 shows the most stable structures we obtained. Point-zero energies and geometrical parameters can be found in the Supporting Information (see SI.1). The method we used provides a systematic procedure to select the different stable chemical structures for a given molecular formula. Indeed, for some of the molecules, the results are consistent with various works published previously Patzer et al. (2005); Li and Cheng (2012); Sharipov et al. (2013). Nevertheless, for others such as \chemformAlO_4 and \chemformAl_2O_3, we were able to find isomers that are more stable than those obtained earlier.
The first principle calculations provide dissociation energy, vibrational and rotational constants for all \chemformAl_x O_y^(i) molecules, where denotes an isomer of the molecular formula \chemformAl_x O_y. The formation Gibbs free energy of each \chemformAl_xO_y^(i) is then computed as a function of the temperature and the pressure . The Gibbs free energy calculation is described in the Supporting Information SI.2. Based on the model proposed by Patzer et al. Patzer et al. (2005), we computed the composition of a gas fed with aluminium and oxygen atoms as a function of the temperature, the initial proportion of elements () and the pressure. We considered the set of reactions which correspond to the formation of the \chemformAl_xO_y^(i) molecules from an atomic gas: {chemeqn} x Al + y O ⇄Al_x O_y^(i) The gibbs free energy of reactions is deduced from the McQuarrie and Simon (1999). We improved the Patzer’s model by taking into account the temperature and pressure dependences of and the contribution of all isomers for each molecules (see Supporting Information SI.2).
III Experimental data
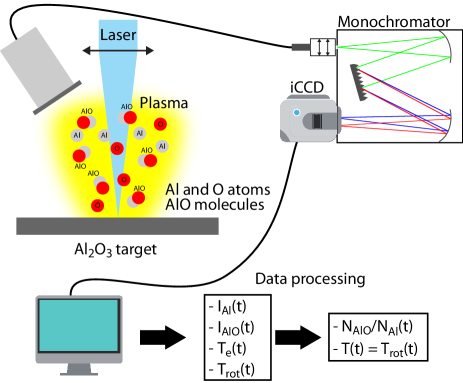
The experimental measurements used for this work have been published previously Lam et al. (2014b) and are sketched in figure 3. To summarize, we performed the spectroscopic characterisation of a plasma induced by the laser ablation of an \chemformAl_2O_3 target in ambient air. The emission intensity of aluminium monoxide molecules and aluminium atoms was measured as a function of time. The electronic temperature was also measured Lam et al. (2014b). Using the formalisms developed in our previous article Lam et al. (2014a), we deduced the density ratio . In the meantime, we measured a temporal evolution of the rotational temperature . This can account for the temperature used in the thermochemistry model because the rotational temperature probes the kinetic temperature of atoms Lam et al. (2014b). is then reported in figure 4(a) as a function of the time (bottom axis), but also as a function of the temperature (top axis). These experimental data will be used to validate the thermochemistry model.
The ratio is expected to be between two extreme values. corresponds to a plasma only composed by the ablated matter. corresponds to the ablated matter combined with the ambient air in the same plasma plume volume. The amount of matter ablated is obtained from the crater shape. The crater depth is measured using Alpha-Step D100 profiler from Tencor. The crater depth measured after 5 pulses is 1.5 m 500 nm. The crater diameter is measured with an optical microscope. The crater diameter is 500 m 100 m. Assuming an -Al203 density of 3.95 g.cm-3, a molar mass of 101.96 g.mol-1, we have obtained 70% atoms ablated per pulse. Considering the size of the plasma, 2 mm in diameter Lam et al. (2014b), and assuming an ideal gas, the number of \chemformO_2 molecules contained in the same volume of air is . The ratio between the number of aluminium atoms provided by the target and the number of oxygen atoms provided by the target and the air leads to a of 0.06 (see Supporting Information SI.3).
IV Discussion
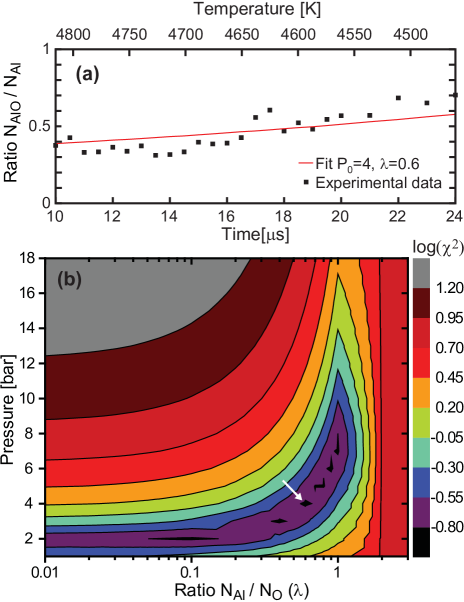
In figure 4(b), the experimental measurements from 10 s to 24 s are compared with our calculations using the Pearson’s cumulative statistic test(). We emphasis the valley of highest likelihood which exhibits a minimum of for bars and . The value is consistent with the expected one. The deduced pressure is also consistent with previous plasma spectroscopy measurements Ma et al. (2010). Assuming these values, the theoretical ratio is computed as a function of the temperature and compared to the experimental data in figure 4(a). The agreement between theoretical calculation and experiment data relies on the idea that the plasma follows a quasi-static cooling in the considered time-range. The cooling rate measured is 25 K.s-1. The known kinetics of the chemical reactions leading to oxide molecules Le Picard et al. (1997) are fast enough to follow this cooling rate. This result is also consistent with the absence of an energy barrier for the reactions Al+OAlO and Al+OAlO+O Pak and Gordon (2003). However, in order to assert equilibrium in the reacting gas, it could be relevant to take into account the homogeneity and the diffusion properties of the gas.
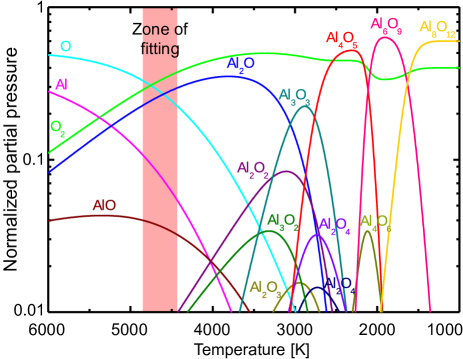
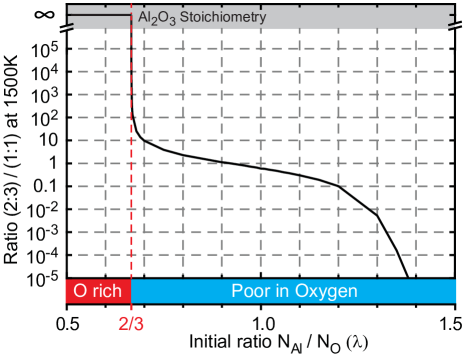
Based on the consistency between experimental and numerical results, we extended the thermochemistry calculation to lower temperature considering bars and =0.6. Figure 5 shows the gas composition as a function of the temperature. Here, the partial pressure for a given molecular formula corresponds to the summation over all isomers partial pressure. As expected, at high temperature () i.e. short times, the gas is mainly composed of the smallest species i.e. \chemformAl, \chemformO, \chemformO_2, \chemformAlO and \chemformAl_2O. Later, the amount of \chemformAl_2O and O simultaneously decrease leading to the two derivatives \chemformAl_2O_2 and \chemformAl_3O_3. We emphasize that \chemformAl_2O_3 never seems to emerge at this stage. The stoichiometry of alumina, corresponding to \chemformAl_6O_9 and \chemformAl_8O_12 molecules, emerges only for temperatures lower than 2000 K. We observe a drastic dependence of the final composition for varying around 2/3. It indicates that a small excess of oxygen is required to favor the (2:3) stoichiometry. This result is consistent with the general idea that to synthesize oxides, it is required to have a gas sursaturated in oxygen. For example, plasma enhanced chemical vapor deposition (PECVD) uses an oxygen plasma to grow layers of oxides Callard et al. (1999); Martinet et al. (1997). Pulsed laser deposition (PLD) of Al2O3 has been performed in an oxygen gas atmosphere to enhance the stoichiometry of the layer Pillonnet et al. (2011). O2 is injected during the growth of ZnO nanoparticles in low energy cluster beam deposition experiment (LECBD) Tainoff et al. (2008).
V Conclusions
In summary, first principle calculations were employed to investigate aluminium oxide clusters at different stoichiometries. A systematic optimization approach was followed to obtain the stable structures. We find more stable isomers than the previously published ones for \chemformAlO_4 and \chemformAl_2O_3 molecules Patzer et al. (2005). Temperature evolution of the composition of a gas made of aluminium and oxygen atoms was also calculated using these molecular properties. Although for high temperature, \chemform(AlO)_n is the most preponderant structure, the bulk aluminium oxide stoichiometry (2:3) starts to exceed the (1:1) stoichiometry for temperature lower than 2000 K. Besides the equilibrium considerations, the question of the kinetic of chemical reactions is not addressed here. Indeed, the occurrence of an equilibrium condition has to be combined with reasonable time scales of reaction kinetics to ensure the molecule formation. Especially, at low temperature, plasma spectroscopy can no longer provide the chemical composition since the system does not emit light. Nevertheless, the theoretical absorption and emission spectra can be deduced from our first-principles calculations. Laser induced fluorescence will be performed to probe the gas. Finally, the high level of theory employed in our calculations prevents addressing bigger clusters. A complementary work could consist on using the clusters we obtained to parametrize a semi-empirical model and perform molecular dynamics simulations. We were nevertheless able to predict the requirements for an oxygen rich gas for synthetizing the desired oxide stoichiometry.
VI Supporting Information
The geometry of each isomer is reported in the Supporting Information file Supplementary-xyz.zip (See SI.1 for content description). SI.2 gives the formulas used to calculate the Gibbs free energy and the gas composition. SI.3 describes calculation. The ratio is computed for different values of and in SI.4. The full curve corresponding to the Figure 6 is shown in SI.5.
VII Acknowledgement
This work was granted access to the HPC resources of the FLMSN, ”Fédération Lyonnaise de Modélisation et Sciences Numériques”, partner of EQUIPEX EQUIP@MESO. The authors are grateful to Nora Abdellaoui for her participation on target crater measurements.
References
- Ford (2004) I. J. Ford, Proc. Inst. Mech. Eng. Part C 218, 883 (2004).
- Clouet (2010) E. Clouet, ArXiv e-prints p. arXiv:1001.4131 (2010).
- Abraham (1973) F. F. Abraham, Homogeneous Nucleation Theory; The Pretransition Theory of Vapor Condensation (Advances in theoretical chemistry. Supplement) (Academic Pr, 1973), ISBN 978-0-12-038361-0.
- Schmelzer (2005) J. W. P. Schmelzer, ed., Nucleation Theory and Applications (Wiley-VCH, 2005), 1st ed., ISBN 978-3-527-40469-8.
- Volmer and Weber (1926) M. Volmer and A. Weber, Z. phys. chem. 119, 277 (1926).
- Farkas (1927) L. Farkas, Z. Phys. Chem. 125, 236 (1927).
- Becker and Doring (1935) R. Becker and W. Doring, Ann. Phys.-Berlin 416, 719 (1935).
- Strey et al. (1994) R. Strey, P. E. Wagner, and Y. Viisanen, J. Phys. Chem. 98, 7748 (1994).
- Diemand et al. (2014) J. Diemand, R. Angelil, K. K. Tanaka, and H. Tanaka, Phys. Rev. E 90, 052407 (2014).
- Viisanen et al. (1993) Y. Viisanen, R. Strey, and H. Reiss, J. Chem. Phys. 99, 4680 (1993).
- Viisanen and Strey (1994) Y. Viisanen and R. Strey, J. Chem. Phys. 101, 7835 (1994).
- Hruby et al. (1996) J. Hruby, Y. Viisanen, and R. Strey, J. Chem. Phys. 104, 5181 (1996).
- Sen and Mukerji (1999) S. Sen and T. Mukerji, J. Non-Cryst. Solids 246, 229 (1999).
- Lutsko and Duran-Olivencia (2013) J. F. Lutsko and M. A. Duran-Olivencia, J. Chem. Phys. 138, 244908 (2013).
- Lutsko and Durán-Olivencia (2015) J. F. Lutsko and M. A. Durán-Olivencia, J. Phys.: Condens. Matter 27, 235101 (2015).
- Ostwald (1897) W. Ostwald, Z. Phys. Chem. 22, 289 (1897).
- Threlfall (2003) T. Threlfall, Org. Process Res. Dev. 7, 1017 (2003).
- Zhang and Liu (2009) T. H. Zhang and X. Y. Liu, Angew. Chem.-Int. Edit. 48, 1308 (2009).
- Baletto et al. (2000) F. Baletto, C. Mottet, and R. Ferrando, Phys. Rev. Lett. 84, 5544 (2000).
- Baletto et al. (2001) F. Baletto, C. Mottet, and R. Ferrando, Phys. Rev. B 63, 155408 (2001).
- McHale et al. (1997) J. M. McHale, A. Auroux, A. J. Perrotta, and A. Navrotsky, Science 277, 788 (1997).
- Chase et al. (1985) M. W. Chase, C. A. Davies, J. R. Downey, D. J. Frurip, R. A. McDonald, and A. N. Syverud, NIST JANAF Thermochemical tables, NIST Standard Reference Database 13 (1985).
- Shore et al. (2000) J. D. Shore, D. Perchak, and Y. Shnidman, J. Chem. Phys. 113, 6276 (2000).
- Erdemir et al. (2009) D. Erdemir, A. Y. Lee, and A. S. Myerson, Accounts Chem. Res. 42, 621 (2009).
- Williams et al. (2008) S. R. Williams, C. P. Royall, and G. Bryant, Phys. Rev. Lett. 100, 225502 (2008).
- Lummen and Kraska (2004) N. Lummen and T. Kraska, Nanotechnology 15, 525 (2004).
- Chakraborty and Patey (2013) D. Chakraborty and G. N. Patey, J. Phys. Chem. Lett. 4, 573 (2013).
- Shen et al. (2013) T. Shen, W. Meng, Y. Wu, and X. Lu, Appl. Surf. Sci. 277, 7 (2013).
- Desgranges and Delhommelle (2009) C. Desgranges and J. Delhommelle, J. Phys. Chem. C 113, 3607 (2009).
- Shibuta and Suzuki (2011) Y. Shibuta and T. Suzuki, Chem. Phys. Lett. 502, 82 (2011).
- Al-Sunaidi et al. (2008) A. A. Al-Sunaidi, A. A. Sokol, C. R. A. Catlow, and S. M. Woodley, J. Phys. Chem. C 112, 18860 (2008).
- Bromley and Illas (2007) S. T. Bromley and F. Illas, Phys. Chem. Chem. Phys. 9, 1078 (2007).
- Calatayud et al. (2008) M. Calatayud, L. Maldonado, and C. Minot, J. Phys. Chem. C 112, 16087 (2008).
- Qu and Kroes (2006) Z. W. Qu and G. J. Kroes, J. Phys. Chem. B 110, 8998 (2006).
- Loschen et al. (2007) C. Loschen, S. T. Bromley, K. M. Neyman, and F. Illas, J. Phys. Chem. C 111, 10142 (2007).
- Burnin and BelBruno (2002) A. Burnin and J. J. BelBruno, Chem. Phys. Lett. 362, 341 (2002).
- Phipps (2007) C. Phipps, Laser Ablation and Its Applications, Springer Series in Optical Sciences (Springer, 2007), ISBN 978-0-387-30452-6.
- Barcikowski and Compagnini (2013) S. Barcikowski and G. Compagnini, Phys. Chem. Chem. Phys. 15, 3022 (2013).
- Lam et al. (2014a) J. Lam, D. Amans, F. Chaput, M. Diouf, G. Ledoux, N. Mary, K. Masenelli-Varlot, V. Motto-Ros, and C. Dujardin, Phys. Chem. Chem. Phys. 16, 963 (2014a).
- de Heer (1993) W. A. de Heer, Rev. Mod. Phys. 65, 611 (1993).
- Gardiner (2000) W. C. Gardiner, Gas-Phase Combustion Chemistry (Springer New York, 2000), ISBN 978-0-387-98861-0.
- Hahn and Omenetto (2010) D. W. Hahn and N. Omenetto, Appl. Spectrosc. 64, 335A (2010).
- Stewart (1989) J. J. P. Stewart, J. Comput. Chemistry 10, 209 (1989).
- Sharipov et al. (2013) A. S. Sharipov, B. I. Loukhovitski, and A. M. Starik, Physica Scripta 88, 058307 (2013).
- (45) M. J. Frisch, G. W. Trucks, H. B. Schlegel, G. E. Scuseria, M. A. Robb, J. R. Cheeseman, G. Scalmani, V. Barone, B. Mennucci, G. A. Petersson, et al., Gaussian 09 Revision A.1, Wallingford CT 2009.
- Patzer et al. (2005) A. B. C. Patzer, C. Chang, E. Sedlmayr, and D. Sulzle, Eur. Phys. J. D 32, 329 (2005).
- Li and Cheng (2012) R. Li and L. Cheng, Comput. Theor. Chem. 996, 125 (2012).
- McQuarrie and Simon (1999) D. A. McQuarrie and J. D. Simon, Molecular Thermodynamics (University Science Books, 1999).
- Lam et al. (2014b) J. Lam, V. Motto-Ros, D. Misiak, C. Dujardin, G. Ledoux, and D. Amans, Spectroc. Acta Pt. B 101, 86 (2014b).
- Ma et al. (2010) Q. L. Ma, V. Motto-Ros, W. Q. Lei, M. Boueri, X. S. Bai, L. J. Zheng, H. P. Zeng, and J. Yu, Spectroc. Acta Pt. B 65, 896 (2010).
- Le Picard et al. (1997) S. D. Le Picard, A. Canosa, D. Travers, D. Chastaing, B. R. Rowe, and T. Stoecklin, J. Phys. Chem. A 101, 9988 (1997).
- Pak and Gordon (2003) M. V. Pak and M. S. Gordon, J. Chem. Phys. 118, 4471 (2003).
- Callard et al. (1999) S. Callard, B. Masenelli, A. Gagnaire, and J. Joseph, Vide-Sci. Tech. Appl. 54, 58 (1999).
- Martinet et al. (1997) C. Martinet, V. Paillard, A. Gagnaire, and J. Joseph, J. Non-Cryst. Solids 216, 77 (1997).
- Pillonnet et al. (2011) A. Pillonnet, A. Pereira, O. Marty, and C. Champeaux, J. Phys. D 44, 375402 (2011).
- Tainoff et al. (2008) D. Tainoff, B. Masenelli, O. Boisron, G. Guiraud, and P. Melinon, J. Phys. Chem. C 112, 12623 (2008).