Morphometric analysis of polygonal cracking patterns in desiccated starch slurries
Abstract
We investigate the geometry of two-dimensional polygonal cracking that forms on the air-exposed surface of dried starch slurries. Two different kinds of starches, made from potato and corn, exhibited distinguished crack evolution, and there were contrasting effects of slurry thickness on the probability distribution of the polygonal cell area. The experimental findings are believed to result from the difference in the shape and size of starch grains, which strongly influence the capillary transport of water and tensile stress field that drives the polygonal cracking.
I Introduction
Desiccation cracks are ubiquitous and exist commonly in everyday life. Examples include those that develop in dried mud Kindle (1917); Goehring et al. (2010); Li and Zhang (2011), old paintings Bucklow (1997); Krzemień et al. (2016), ceramic glaze Bohn et al. (2005a, b), and so on. These cracks usually exhibit a specific network structure, splitting the entire surface of the fractured media into many polygonal cells. Biological analog is found in crocodiles’ head scales Milinkovitch et al. (2013); Qin et al. (2014), in which polygonal patterns are produced by a differential growth of tissue; the leaf venation may further be included in the category Couder et al. (2002); Laguna et al. (2008); Bar-Sinai et al. (2016). Despite the variety of chemical compositions and length scales, the apparent similarity in their topology implies the existence of a common governing mechanism that is responsible for the polygonal pattern formation.
Earlier studies have elucidated the mechanism of desiccation crack formation for various grain-liquid mixtures Groisman and Kaplan (1994); Colina and Roux (2000); Colina and Acker (2000); Shorlin et al. (2000); Lecocq and Vandewalle (2002); Toramaru and Matsumoto (2004); Nakahara and Matsuo (2006); Bisschop (2008); Tang et al. (2011); Nag et al. (2010); Nakayama et al. (2013); Costa et al. (2013); DeCarlo and Shokri (2014); Khatun et al. (2015); Nandakishore and Goehring (2016); Kitsunezaki et al. (2016). The mixtures typically consist of a skeleton of solid grains and pore spaces that are filled with either liquid or air bubbles. Upon drying, liquid content evaporates from an air-exposed surface, which causes shrinkage in the volume of the solidified mixture. As a consequence, cracks occur when the tensile stress induced by shrinkage exceeds the bonding strength of grains. Recent advances in computer simulation techniques and theoretical development have enabled us to reproduce real cracking patterns and to obtain insight into the detailed mechanism. Kitsunezaki (2010); Maurini et al. (2013); Ito and Yukawa (2014); Hirobe and Oguni (2016).
Of the many candidates, corn starch slurry (i.e., a dense mixture of corn starch powder with distilled water) Müller (1998); Mizuguchi et al. (2005); Goehring and Morris (2005); Goehring et al. (2009); Goehring (2009); Crostack et al. (2012) can exhibit heterogeneous crack network characteristics consisting of two distinct types, namely primary cracks and secondary cracks. Primary cracks are long and nearly straight cracks, and they emerge in advance of the appearance of secondary cracks. Primary cracks originate from the mismatch in the ratio of the homogeneous volume shrinkage between the dried slurry and substrate, as well as the adhesion of the bottom surface of the slurry to the substrate. In contrast, secondary cracks are relatively short and sinuous cracks, and are made by spatial inhomogeneity in the local shrinkage of the slurry. Both types of cracks initially appear at the air-exposed surface, and they then penetrate the bulk as evaporation takes place in order to release the internal tensile stress. In particular, full-depth propagation of the second cracks results in a regular array of tiny polygonal prisms, as a reminiscent of columnar joints, a type of impressing geological structure that spontaneously occurs in cooling lava flows Degraff et al. (1989); Goehring and Morris (2008).
The present work focuses on the geometry in the planar random tessellation made by secondary cracks at the surface of desiccated starch slurries. We note the possibility that the geometry will be affected by the degree of the irregularities with respect to the size and shape of the constituent starch grains. This is because the irregularities cause wide structural variations in the pore spaces between adjacent grains; the pores regulate the local transport of water content, and play the roles of a channel and a storage pool, depending on the configuration of grains surrounding the pores Goehring (2009); Shokri et al. (2010). Therefore, from a statistical perspective, it is anticipated that the irregularities are responsible for local volume shrinkage, and thus for the geometric properties of the polygonal cracks. To examine the conjecture, we performed the desiccation-cracking experiments using starches made from two different ingredients, potato and corn, which showed different grain shapes and different-sized distributions Singh et al. (2003). We conducted image analyses and geometric characterization of the resulting polygonal cracking in order to evaluate the effect of the size and shape of grains on the crack geometry, as well as to better understand the underlying mechanism. We also considered the effect of varying the sample thickness of the starch slurries on the geometric properties.
II Materials and Methods
II.1 Slurry sample preparation
In this study, we used two kinds of commercially available starch powders made from cone and potato. Potato starch is known to exhibit a larger grain size and lower sphericity compared with those of corn starch, and we confirmed this by performing optical microscopy measurements (we will revisit this issue later). Our sample preparation method was essentially similar to those reported in Refs. [Müller, 1998; Toramaru and Matsumoto, 2004; Goehring and Morris, 2005], as explained below.
At the initial stage, saturated slurry samples were prepared by mixing the starch ( g in weight) with distilled water ( g) at a gravimetric ratio () of 55.6% and 58.3% for corn and potato starches, respectively. The obtained mixture was stirred by hand, and the desired quantity was then poured into a horizontal container with a circular shape, which was 85 mm in diameter and 12 mm in depth. In the container, starch grains settled out to the bottom and water segregated on the top, resulting in a dense starch phase covered by a water layer. After completion of the settling, the dense starch layer showed thicknesses of either 2 mm, 5 mm, 8 mm, or 11 mm depending on the quantity of the mixture initially poured into the container, while the thickness of the supernatant clear water was nearly equal or less than 1 mm for all samples. The decision on the completion of sedimentation was based on visual examination; though a very small amount of starch grains may be contained in the apparent transparent water, it was confirmed that subsequent precipitation of the residual infinitesimal impurities did not give a feasible contribution to the sedimentation layer thickness.
We then left the samples untouched until the supernatant water dried out naturally. Once all of the supernatant water disappeared and the top surface of the settled slurry was exposed to air, the container was placed under a 36-W lamp and the evaporation time measurement began. The lamp enabled us to secure reproducible drying condition as well as to keep the temperature of the exposed surface at c.a. 27∘C against vaporization cooling. The distance between the top surface of the slurry and the bottom of the lamp bulb was fixed at 7.0 cm. All of the experiments were conducted at room temperature; 26 2 ∘C, 50 5% of moisture humidity.
II.2 Image analysis technique
During the evaporation, we took pictures of the drying surface using a digital camera over a period of time. We also measured the weight of the starch slurry over the same period, and in this way, we were able to evaluate the amount of water contained in the slurry and its time variation. We analyzed the pictures of the polygonal cracks after drying using image-processing software, called ArcGIS ArcGIS for Desktop(2015) (version 10.3.1), which is a geographic information system tool employed to analyze geographic data. In the image analysis, each image was enhanced in contrast, and was then converted to a black-and-white representation. We then erased the image of tiny cracks that were isolated from the main network of the polygonal tessellation as well as those that branched off the network, but which were terminated without connecting to any other cracks. From the results, we obtained a relatively accurate description of the planar random tessellation that formed on the top surface of the desiccated starch slurries. See Appendix A for the details of image processing based on ArcGIS software.
| Potato starch | Corn starch | |
|---|---|---|
| 1.670.15 | 1.540.12 | |
| Num. of samples | 19 | 21 |
II.3 How to distinguish two types of cracks
The two types of cracks can be differentiated in a visual way Mizuguchi et al. (2005); Goehring et al. (2010); Crostack et al. (2012). Primary cracks appear successively and they typically meet at T-shaped junctions, since a later crack will preferentially meet an earlier one in a normal direction. They show rectilinear shape with clear, well-defined edges, and quickly penetrate both in the lateral and vertical directions. In contrast, secondary cracks emerge simultaneously, initiated at both the edge of an existing primary crack and a tiny flaw on the air-exposed surface. They propagate slowly with curvy shape, forming Y-shaped or V-shaped branches on the surface. In the vertical direction, they show prismatic structures with polygonal cross sections.
II.4 Microscopic observation of starch grains
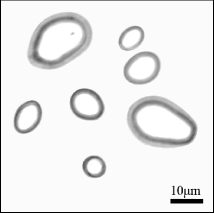
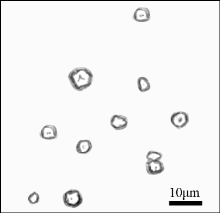
Prior to performing the desiccation crack experiments, we examined the microscopic size and shapes of the starch grains to be used. Figures 1(a) and 1(b) display the optical microscope photographs of starch grains made from potato and corn, respectively, which were obtained using an inverted microscope (CKX31, Olympus) incorporated with a cooling CCD camera (BU-52LN, Bitran). The samples taken by photos were obtained by sufficiently diluting the starch powder with distilled water. It is clear from Fig. 1(a) that the grains of potato starch have smooth round and ellipsoidal shapes with a relatively large variation in their sizes. Meanwhile, the grains of corn starch exhibit slightly angular but nearly spherical shapes, along with some uniformity in their sizes, as seen in Fig. 1(b). These morphological features of starch grains are consistent with earlier observations by scanning electron microscopy (SEM) Singh et al. (2003); Goehring (2009). In particular, a high-resolution SEM image of corn starch grains unveiled the less-smooth and highly porous surfaces, which may account for the strong hydrophilic qualities of corn starch Goehring (2009).
The degree of the grain shape’s deviation from an ideal sphere can be quantified by the elongation factor , which is defined by
| (1) |
Here, is called the maximum Feret’s diameter Merkus (2009), which represents the length of the line segment connecting the two points having the greatest separation on the perimeter of the particle’s cross-section. is the length of the short side of the rectangle that has the same perimeter and area as those of the particle’s cross-section. In other words, the more elongated the shape of a particle, the higher is its elongation factor . Table 1 presents the values of for potato and corn starch that average over c.a. 20 grain samples. Potato starch showed a larger value of than corn starch, and this is attributed to the more elongated grain geometry.
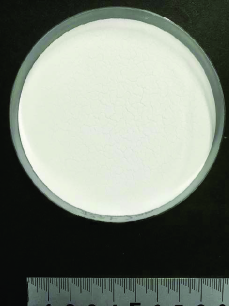
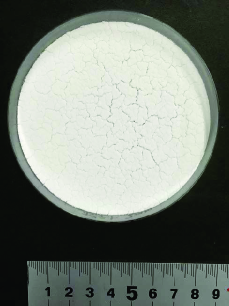
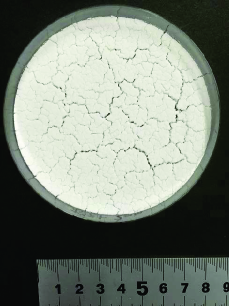
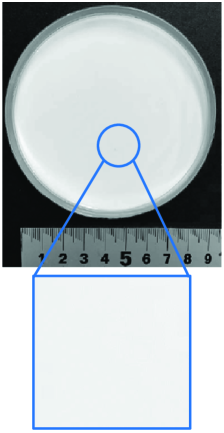
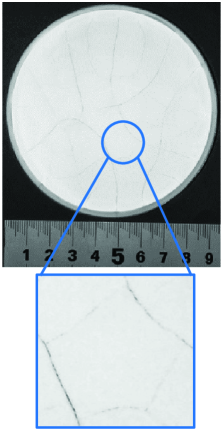
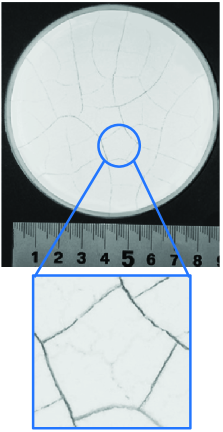
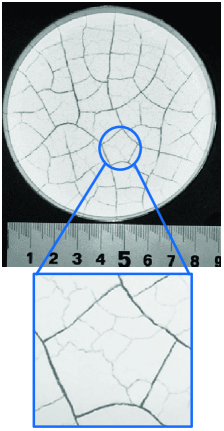
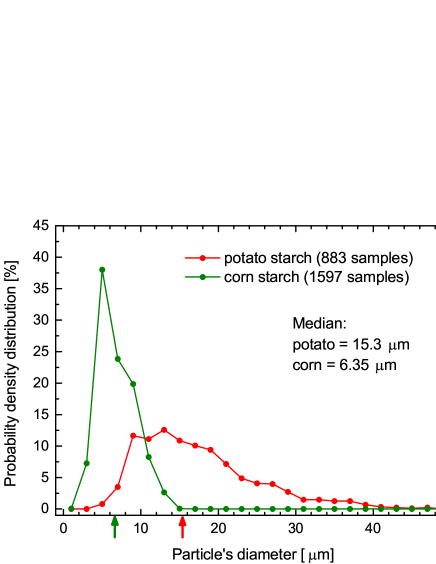
Figure 2 shows the probability distribution of the grain size for the two kinds of starches detected by the image-processing software (NI Vision Assistant 2012, National Instrument). The horizontal axis indicates the equivalent circular diameter of the starch grains, i.e., the diameter of a circular disk having the same area as the cross-sectional area of the grain. The number of grain samples that we measured as well as the median of the equivalent circular diameter that was evaluated (marked by upward arrows) are displayed in the legend of the figure. From Fig. 2, it follows that potato starch shows a wide variation in size ranging from 6 m to 40 m, which is in good agreement with the earlier study Costa et al. (2013), and corn starch exhibits a narrow size distribution ranging from 4 m to 14 m. In addition, the median for the grain size of potato starch ( m) is significantly larger than that of corn starch ( m).
III Results
III.1 Time evolution of crack pattern
Careful observation of the crack development during water evaporation revealed a distinct difference in the crack morphology for potato and corn starches. An important finding is the significant suppression of primary cracks in potato starch slurries. Figure 3 demonstrates the cracking process of a potato starch slurry with a 2-mm-thick starch layer. The slurry surface remained intact until 60 min after the start of drying. Over time, a multitude of secondary cracks (not primary ones) initiated simultaneously on the surface. The number of secondary cracks and their intersections increased gradually as evaporation continued, and the surface was split into many polygonal cells. Once a portion of the slurry surface was split into sufficiently small cells, no additional cracks formed inside the cells because a sufficient amount of tensile stress had already been released. Eventually, the crack pattern saturated after 360 min, at which the slurry thickness was reduced to 95 % of the initial state for all samples.
The absence of primary cracks for the case of potato starch is in contrast with the case of corn starch, where primary cracks dominate the early stage of desiccation crack development. Figure 4 shows the results for a corn starch slurry with a 2-mm-thick layer. At the initial stage (47 min after the start of drying), long primary cracks appeared one-by-one, breaking the slurry surface in a sequential manner into several domains. Every two connected primary cracks showed an almost vertical intersection, as in the agreement with earlier studies on various kinds of water-grain mixtures Costa et al. (2013); DeCarlo and Shokri (2014); Khatun et al. (2015); Nandakishore and Goehring (2016). It is known that the spacing between primary cracks occurring on the dried corn starch surface is several times larger than the starch layer thickness. Afterwards, primary crack formation stopped (e.g., 89 min after the start of drying in Fig. 4); instead, secondary cracks started to appear inside the domains surrounded by the primary cracks. At the final stage (276 min), the dried slurry was finely divided by a combination of primary and secondary cracks; for all samples, we observed the 5% reduction of the slurry thickness as was the case with potato starch.
Our experiments confirmed that the significant suppression of primary crack formation in the potato starch slurries holds true even when we vary the thickness of the slurry layer within the range of 2 mm to 11 mm, or when we replace the container with those having a square shape with linear dimensions of 200 mm or less. The only exception was the potato starch sample, which was poured into a very large square container with an area of 310230 mm2 in area, which had an 80-mm-thick starch layer. In the latter case, one primary crack was initiated from the edge of the container and propagated toward the center, but it stopped without penetrating the full width of the container. These results demonstrated that there is a minor contribution of the homogeneous volume shrinkage, which generally triggers the primary crack formation, to the surface fracture of potato starch slurries.
III.2 Drying curve
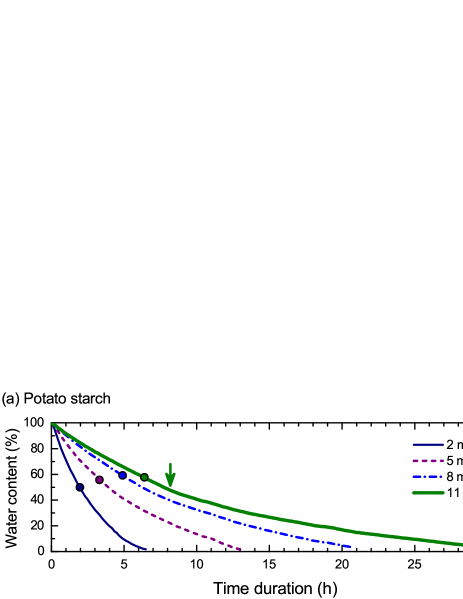
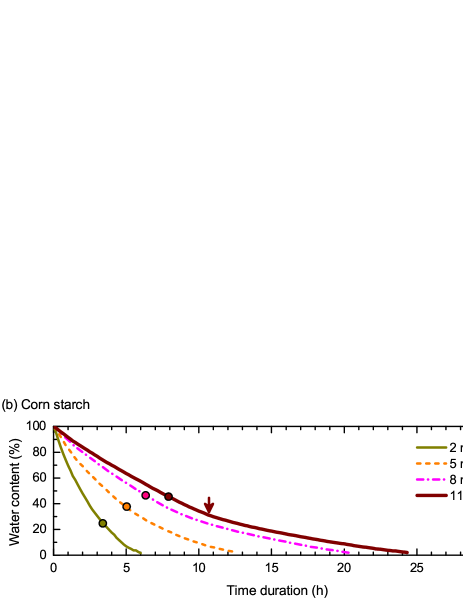
Figure 5 presents the time variation with respect to the water content in the starch slurries. For both potato and corn starches, the slope of the curves at the initial drying stage (e.g., h) was found to decrease with increasing thickness of the slurry samples. In addition, all curves were downward convex with respect to the time duration. More specifically for each sample with a layer thickness of 5-11 mm, there is a shallow turning point on the curve (marked by arrows only for the 11-mm-thick sample) across which the slope of the curve changes significantly. The drying time associated with the turning point serves as an indicator, immediately before which secondary cracks started to form at the top surface of the slurries (marked by solid circles), as was originally suggested by Ref. [Goehring et al., 2006]. After the secondary crack initiation, those cracks penetrate the depth over time, during which the rate of water content evaporation slightly declines, as seen in Figs. 5(a) and 5(b).
III.3 Geometry of crack pattern
The geometry of the random polygonal tessellation that we obtained was characterized from the perspective of the following three quantities: the polygon order (i.e., the number of vertices involved in a given polygonal cell), the polygonal cell’s area , and the joint angle at the crack intersection. For a given slurry layer thickness, we prepared five different samples of completely dried slurries, and examined them to evaluate the probability distribution of the three characteristic quantities listed above. We confirmed that one slurry sample involved several tens or hundreds of polygonal cells.
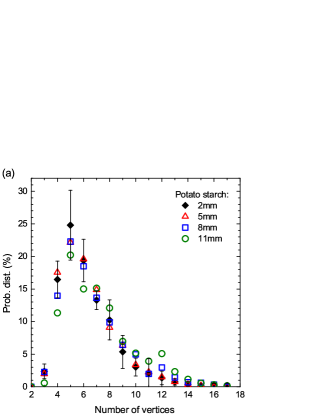
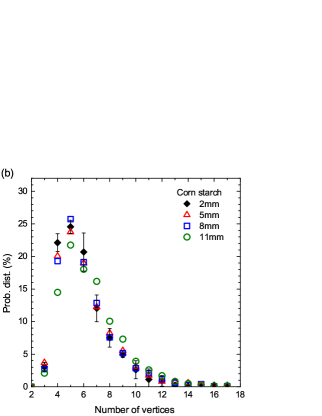

Figures 6(a) and 6(b) show the probability distribution of the polygon order . The two graphs clearly show an overwhelming majority of pentagonal cells (), together with squares () and hexagons (). We found that the distribution curves shift slightly to the right (i.e., to the larger region) as the layer thickness increases from 2 mm to 11 mm, while keeping the peak position at . The dominancy of pentagons agrees in part with the previous result on potato starch samples Toramaru and Matsumoto (2004); yet it seems in contrast with those reported by Ref. [Müller, 1998], which showed that hexagons dominated in corn starch slurries that were much thicker than those we have used. This issue will be revisited in Section IV-B. We also found in Figs. 6(a) and 6(b) the long tail in the distribution curve for large (e.g., ),which reflects the presence of many polygonal cells with kinks along their edges; see Fig. 6(c). The kinks, from which only two cracks branch off, cause the adjacent polygonal cells to be inward convex; thus, they tend to increase the value of for those cells.
Figures 7(a) and 7(b) illustrate the probability distribution of the area of polygonal cells surrounded by secondary cracks using a semi-logarithmic scale. From Fig. 7(a), it follows that a thicker slurry of potato starch tends to provide more polygonal cells over a wide area. In the case of corn starch, we found no such thickness effect on the polygonal cell area, as demonstrated in Fig. 7(b); in the latter case, a thickening of starch slurries caused only a slight shift of the data points in the plot to the right. To quantify the effect of the layer thickness, we fitted the data points onto an exponential curve defined by
| (2) |
and we evaluated the fitting parameter (as well as the coefficient ) as a function of the layer thickness . The parameter characterizes the decay length of internal stress away from a crack in a thin layer Beuth (1992); Xia and Hutchinson (2000). Figure 7(c) shows that for potato starch, increases significantly with increasing in an almost linear manner from mm at mm to mm at mm. For corn starch, the increase rate of is subtle by comparison with the case of potato starch; it varies from mm to mm with increasing .
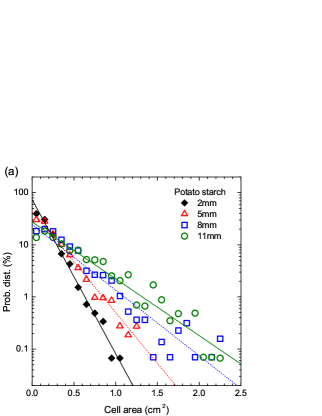
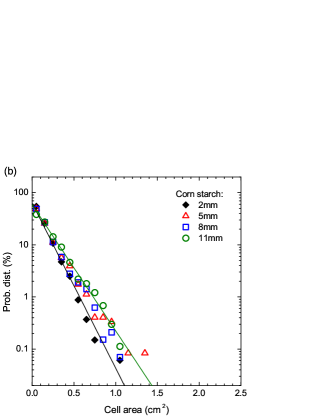

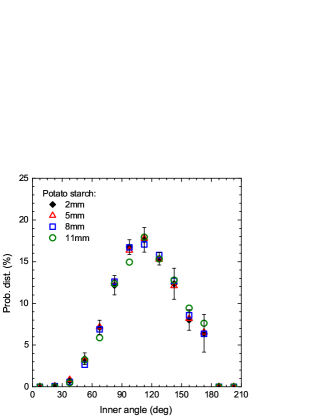
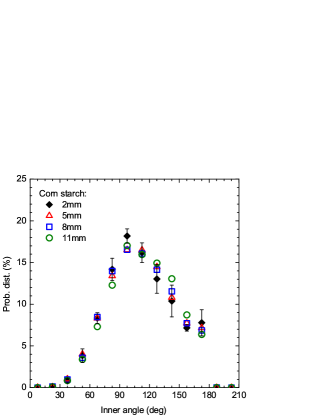
Figure 8 shows the distribution of the intersection angle between cracks. The two plots show that there is no significant difference in the distribution curve between the two starch ingredients, nor is there a dependence on the layer thickness. Nevertheless, the peak position of the distribution curve differs sufficiently between the two starch ingredients. In other words, potato starch shows a peak at the range of 105∘-120∘, while corn starch shows a peak at 90∘-105∘.
It should be remarked that the peak position for corn starch samples does not coincide with that reported earlier; it was shown in Ref. [Mizuguchi et al., 2005] that the peak located at 120∘-130∘ for corn starch and all the measurement data of joint angles fell into the range from 90∘ to 180∘. As well, the standard deviation of the joint angles, , estimated by the present analysis shows a certain deviation from the earlier one; it was reported in Ref. [Goehring and Morris, 2005] that for corn starch samples, which is smaller than our result of . These differences in the probability distribution of joint angles for corn starch may be attributed to the difference either in experimental conditions or the methodology for quantifying joint angles, though the detailed understanding has not yet been reached. Nevertheless, the singleness of the peak in the joint angle distribution was observed in common for all experiments, indicating the presence of a frequently occurring joint angle under a given experimental condition.
IV Discussion
IV.1 Spatio-temporal variation in local water content
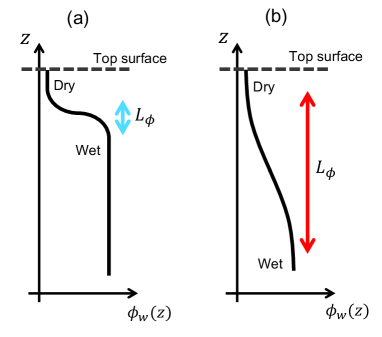
We observed that the potato starch slurries showed a systematic dependence of the cell area distribution on the slurry thickness. In contrast, for corn starch, the thickness of the slurry layers had no significant effect on the curve of . This contrasting behavior can be explained by considering the spatio-temporal variation in the local volume fraction of water, , with being the vertical axis. In the initial case, the starch slurries are saturated by liquid water, and thus is constant, as designated by , over the whole precipitated starch. As evaporation continues, near to the top, air-exposed surface decreases with time, while the corresponding value far below the top surface remains at the initial value. This gives rise to the development of an intermediate zone that is sandwiched by the top drying surface and the far-below fully wet slurry, through which undergoes a gradient with respect to from at the top surface to at the bottom Mizuguchi et al. (2005); Goehring (2009). The vertical limits of the intermediate zone depends on the magnitude of the local diffusivity of the water content in the slurry. It was proposed in Ref. [Goehring, 2009] that both the capillary and vapor transport of water can be described by an effective diffusion equation with a nonlinear diffusivity:
| (3) |
If the value of around the intermediate zone is sufficiently large, the water content that had already evaporated from the top surface will be compensated by water diffusion from the wetter portion of the slurry far below the top (very dried) surface via transportation through capillary bridges. This water supply from bottom to top causes an expansion of the vertical limits of the intermediate zone, reducing the slope of with respect to within the zone, as illustrated in Fig. 9. On the contrary, if the value of around the intermediate zone is sufficiently small, the water content that is evaporated is not compensated from the bottom, so the stepwise profile of as a function of does not change considerably. It is natural to assume that should be large for the slurry consisting of large-sized, irregular-shaped grains, because there is a large available pore space through which water can diffuse. It is thus inferred that for the potato starch slurries, the vertical limits that indicate the gradient becomes enlarged compared to the corresponding values for corn starch slurries.
It is important that the inhomogeneous tensile stresses that cause secondary cracking are concentrated within the intermediate zone in which shows a gradient variation. This is because in the slurry portion far below the air-exposed surface, there exists a sufficient amount of water; therefore, capillary transport smooths out any spatial variation in the local volume fraction of water. This smoothing effect causes the inhomogeneity in the capillary-induced tensile stress to be eliminated. In this context, a potato starch slurry involves a “thick” intermediate zone in which tensile stress is concentrated. In contrast, a corn starch slurry involves a “thin” intermediate zone in the same sense. Below the stress-concentrated intermediate zone having a finite thickness, the interior of the slurry is more moist, so it can be considered as a different medium trying to hold the upper dried layer together and providing adhesion. Under this condition, the intercrack spacing on the two dried surfaces should be proportional to the thickness of the layer under tensile stress Beuth (1992); Xia and Hutchinson (2000), as a direct consequence of the theory of fracture mechanics; the validity of the proportionality relation has been experimentally confirmed for many kinds of desiccated slurries Groisman and Kaplan (1994); Shorlin et al. (2000); Colina and Roux (2000); Bohn et al. (2005b). Eventually, the vertical limits of the stress-concentrated region determine the horizontal spacing between adjacent secondary cracks, or equivalently, they determine the area of the polygonal cells surrounded by secondary cracks
Our experimental results indicate that for the potato starch, the vertical limits of the stress-concentrated region, which is denoted by , is comparable to or exceeds 11 mm, which is the maximum of the slurry thickness that we used in the experiments. Accordingly, was truncated by the slurry thickness for all the samples. As a result, serves effectively as , and determines the crack spacing instead of . This is the reason why the cell area distribution showed a strong dependence on the slurry thickness. The larger leads to the tendency of wider polygonal cell formation in potato starch samples, as characterized by the steep increase in the fitting parameter with increasing [see Fig. 7(c)]. In contrast, for the corn starch is believed to be less than 11 mm, and as a result, did not show significant dependence on . Our speculation of mm for corn starch is consistent with the existing studies based on X-ray tomography Mizuguchi et al. (2005) and destructive sampling Goehring (2009), which unveiled the presence of a sharp dry front with a thickness of a few millimeters.
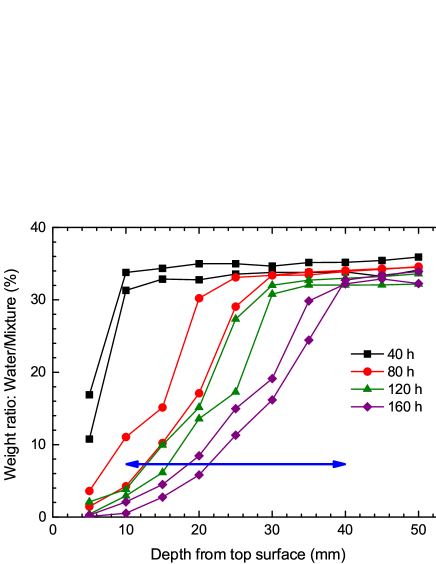
To further examine the validity of the estimation that for potato starch should be larger than that for corn starch, we have measured the spatial distribution of the water content within potato starch samples with 50 mm in slurry thickness; see Appendix B for the method of measurement. Figure 10 demonstrates the drying time dependence of the water distribution within the potato starch slurries; the horizontal arrow indicates the intermediate zone with in thickness. It follows from the figure that for the potato starch is estimated to be ca. 30 mm, which provides an evidence that for potato starch should be larger than 11 mm as described above.
IV.2 Predominance of pentagonal cells
Another important fact that was deduced from the present work is that the peak in the distribution of the polygon order is at both for potato and corn starches. This may appear to be counterintuitive, because it is often said that hexagonally ordered patterns are found dominantly in many settings Goehring (2013). We conjecture that the predominance of pentagons that we observed originates from the relatively high rate of desiccation, compared to the rate under natural drying condition; the relatively high desiccation rate was a consequence of heat supply from the lamp set up above the slurry surface. This conjecture is consistent with the field observation of columnar joints made from the cooling lava flow, as briefly discussed below.
Columnar jointing is a spectacular geological structure, composed of an array of prismatic columns that shows strong regularity in the cross section. The regularity in the polygonal cracking network in the cross section is a result of inward penetration of thermal contraction cracks that form at the surface of cooled lava. Though the surface cracks are not so regular as those in the cross section, interaction of adjacent cracks during inward penetration is believed to lead to changes in the spacing between cracks and in the orientation of crack development, then resulting in the long-range ordered polygonal pattern at the cross section inside the cooled lava Degraff and Aydin (1993); Budkewitsch and Robin (1994); Hofmann et al. (2015). The occurrence frequency of the polygon order in columnar jointed rocks worldwide has been summarized in Ref. [Budkewitsch and Robin, 1994]. Attention should be paid to the fact that the hexagon is not necessarily preferred in columnar joint formation. The predominance of pentagons is exemplified by Burntisland dyke in Scotland Sosman (1916) and Mt. Rodeix basalt in France Beard (1959), whereas Giant’s Causeway in Ireland O’Reilly (1879) exhibits a larger number of hexagons. The difference in the preferred type of polygons is known to be due to the difference in the cooling rate of lava. The cooling starts from the top and bottom surfaces of the pooled lava, generating the variation in the internal temperature at different depths Goehring and Morris (2008); Goehring et al. (2009). This is similar to the case of desiccation cracking, where the drying generates a variation in the water volume fraction. In the cooled lava, thermal shrinkage provides the driving force for the crack propagation at different depths, engendering the highly ordered array of prisms with a polygonal cross section.
It should be noted that for columnar joints, the dominant polygon order depends on the cooling rate Toramaru and Matsumoto (2004). More precisely, it was proposed that a pentagon be preferred as the columnar shape at a higher cooling rate, whereas a hexagon is preferred at a lower cooling rate. From the analogy in the formation mechanism between the columnar joints and dried starch cracking Goehring et al. (2009), it is therefore natural to deduce that a pentagon is preferred in the polygonal cracking of dried starch when the rate of drying is sufficiently large. This conclusion is consistent qualitatively with the starch-water experiment reported by Ref. [Toramaru and Matsumoto, 2004], despite there being differences in the experimental conditions.
IV.3 Distribution of the intersection angles
It is also interesting to note the persistence in the distribution profile of intersection angles, regardless of the starch ingredient and the slurry thickness, as demonstrated in Fig. 8. The peak position for the corn starch is located within the range of 90∘-105∘, which is slightly less than that for potato starch. This decrease is attributed to the presence of primary cracks that propagate linearly through the slurry surface from one side edge of the slurry to the other side edge, or to the other existing primary crack. The intersection angles between a primary crack and a secondary crack, as well as those between two primary cracks, are likely to be perpendicular because of the crack-induced stress-release mechanism. Near an edge of the medium or near an existing primary crack, the stress occurs only in the direction parallel to the edge. Therefore, cracks should propagate normal to the direction along which the stress is highest in order to produce the maximal relief of the stress. This explains the peak of the angle distribution at slightly more than 90∘. In the case of potato starch, no primary crack was formed, so the random polygonal tessellation is totally composed of secondary cracks. Therefore, three-pronged junctions between cracks are dominant, resulting in a majority of intersection angles that are approximately 120∘.
The nucleation of Y-shaped cracks is also responsible for the frequent occurrence of the joint angles larger than 90∘. In real slurry samples, the air-exposed surface of a starch slurry involves a certain number of point-like defects, at which the cohesion between adjacent particles should be weak. These defects often give rise to the nucleation of three (or more) cracks that emanate from the point-like defects. The cracks joint by an angle larger than 90∘ from the beginning; thus, the development of these cracks contribute to the shift in the joint angle distribution toward the larger angle.
V Summary
In this study, we experimentally studied the impact of the microscopic geometry of starch grains on the macroscopic patterns of polygonal cracking that occurs at the air-exposed surface of dried starch slurries. The difference in the size and shape of grains for potato and corn starches was responsible for the contrasting cracking patterns. Specifically, dried potato-starch slurries showed remarkable suppression of primary crack formation and a strong dependence of the cell-area distribution on the slurry thickness, as manifested by the large-sized, oval-shaped geometry of the constituent starch grains. The results can be explained by considering water diffusion around the intermediate zone, which is sandwiched by the dried upper surface and the moist bottom portion of the slurry under desiccation. The water diffusion is controlled by the microscopic size and shape of grains, determining the vertical limits of the stress-concentrated zone that dictates the macroscopic cracking patterns on the slurry. The predominance of pentagonal cells is attributed to the relatively high drying rate of the starch under the present condition, as a reminiscence of pentagon-dominated columnar joints that typically occur in the fast-cooling lava flow.
Acknowledgement
We would like to express great appreciation to Akio Nakahara, So Kitsunezaki, Kenji Oguni, and Sayako Hirobe for the fruitful discussions and valuable suggestions at the initial stage of the present work. We are also indebted to Akio Inoue for use of time lapse cameras as well as helpful comments regarding the image analyses. Our great thanks are also extended to Futaba Kazama and Kei Nishida for use of an incubator and a drying oven, respectively, and Yasutada Suzuki for use of an infrared thermometer. This work was supported by JSPS KAKENHI Grant Number JP25390147.
Appendix A: Image processing workflow
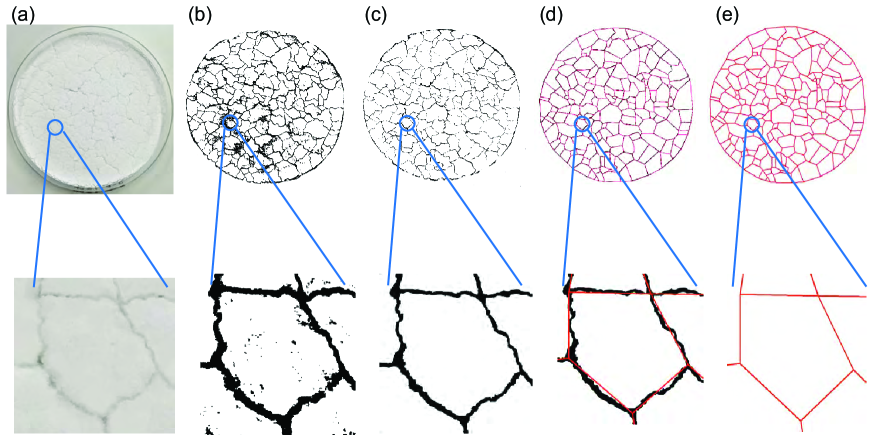
Figure 11 shows the actual step of the image processing. First, we prepared a raw picture of the air-exposed fractured surface obtained by complete drying of, for instance, a 5mm-thick potato starch slurry as shown in the panel (a). Next, we converted the picture into a raster image as shown in the panel (b). The raster image was made up of square pixels that are regularly spaced; it was obtained by enhancing the contrast ratio of the scanned raw picture followed by binary thresholding based on the Otsu algorithm Otsu (1979).
As a next step, we edited the raster image by filling the gaps that are a result of the poor quality of the scanned picture. In addition, we eliminated the unwanted pixels that resulted from contrast enhancement. At this stage, we also erased the following two classes of pixels: i) those corresponding to tiny cracks that were isolated from the main network, and ii) those that branched off the network but were terminated without connecting to any other cracks. Through the editing, we prepared the cleanup raster image as shown in the panel (c).
As the final step, we used ArcGIS software ArcGIS for Desktop(2015) (version 10.3.1) to vectorize the cleanup raster image; the vector image obtained is shown in the panel (d) together with the cleanup raster image prior to vectorization. In the raster-to-vector conversion, we needed to set several control parameters in order to choose the raster data to be vectorized and to determine how the geometry of the output vector data should be constructed. The optimal values of the control parameters for vectorization are not uniquely determined but depend on situations; we thus explored the appropriate settings by hand, and eventually obtained the vector image demonstrated in the panel (e).
Appendix B: Measurement of water content distribution in potato starch
In the measurement, we prepared the 50 mm-thick potato starch slurries with 75 mm in diameter. Eight slurry samples having the same size were prepared and dried beneath the 36-W lamp under the same conditions as described in Section II-A. In order to evaluate the drying time dependence of the water distribution within the slurries, we have assigned different drying time periods (i.e., from 40 hours to 160 hours) to four pairs from the eight samples, as shown in the legend of Fig. 10. After the drying time periods, the dried slurries were cut into 10 round slices with equal thickness of 5 mm, and the weights of the slices were measured. We then put the slices in a drying oven (DX402, Yamato Scientific) with a constant temperature of 45 ∘C and wait more than a whole day to completely remove the amount of water from the slices. By measuring the loss in weight of the slices, we have determined the amount of water that had been contained in the slices immediately after the drying time periods. Eventually, we have obtained the spatial distribution of water content in the original 50 mm-thick potato starch slurries and its dependence on the drying time peiord; see Fig. 10.
References
- Kindle (1917) E. M. Kindle, J. Geol. 25, 135 (1917).
- Goehring et al. (2010) L. Goehring, R. Conroy, A. Akhter, W. J. Clegg, and A. F. Routh, Soft Matter 6, 3562 (2010).
- Li and Zhang (2011) J. H. Li and L. M. Zhang, Eng. Geol. 123, 347 (2011).
- Bucklow (1997) S. Bucklow, Stud. Conserv. 42, 129 (1997).
- Krzemień et al. (2016) L. Krzemień, M. Łukomski, Ł. Bratasz, R. Kozłowski, and M. F. Mecklenburg, Stud. Conserv. 61, 324 (2016).
- Bohn et al. (2005a) S. Bohn, L. Pauchard, and Y. Couder, Phys. Rev. E 71, 046214 (2005a).
- Bohn et al. (2005b) S. Bohn, J. Platkiewicz, B. Andreotti, M. Adda-Bedia, and Y. Couder, Phys. Rev. E 71, 046215 (2005b).
- Milinkovitch et al. (2013) M. C. Milinkovitch, L. Manukyan, A. Debry, N. Di-Poï, S. Martin, D. Singh, D. Lambert, and M. Zwicker, Science 339, 78 (2013).
- Qin et al. (2014) Z. Qin, N. M. Pugno, and M. J. Buehler, Sci. Rep. 4, 4966 (2014).
- Couder et al. (2002) Y. Couder, L. Pauchard, C. Allain, M. Adda-Bedia, and S. Douady, Eur. Phys. J. B 28, 135 (2002).
- Laguna et al. (2008) M. F. Laguna, S. Bohn, and E. A. Jagla, PLoS Comput. Biol. 4, e1000055 (2008).
- Bar-Sinai et al. (2016) Y. Bar-Sinai, J.-D. Julien, E. Sharon, S. Armon, N. Nakayama, M. Adda-Bedia, and A. Boudaoud, PLoS Comput. Biol. 12, e1004819 (2016).
- Groisman and Kaplan (1994) A. Groisman and E. Kaplan, Europhys. Lett. 25, 415 (1994).
- Colina and Roux (2000) H. Colina and S. Roux, Eur. Phys. J. E 1, 189 (2000).
- Colina and Acker (2000) H. Colina and P. Acker, Mat. Struct. 33, 101 (2000).
- Shorlin et al. (2000) K. A. Shorlin, J. R. de Bruyn, M. Graham, and S. W. Morris, Phys. Rev. E 61, 6950 (2000).
- Lecocq and Vandewalle (2002) N. Lecocq and N. Vandewalle, Eur. Phys. J. E 8, 445 (2002).
- Toramaru and Matsumoto (2004) A. Toramaru and T. Matsumoto, J. Geophys. Res. 109, B02205 (2004).
- Nakahara and Matsuo (2006) A. Nakahara and Y. Matsuo, Phys. Rev. E 74, 045102(R) (2006).
- Bisschop (2008) J. Bisschop, Int. J. Fract. 154, 211 (2008).
- Tang et al. (2011) C.-S. Tang, B. Shi, C. Liu, W.-B. Suo, and L. Gao, Appl. Clay. Sci. 52, 69 (2011).
- Nag et al. (2010) S. Nag, S. Sinha, S. Sadhukhan, T. Dutta, and S. Tarafdar, J. Phys. Condens. Matter 22, 015402 (2010).
- Nakayama et al. (2013) H. Nakayama, Y. Matsuo, O. Takeshi, and A. Nakahara, Eur. Phys. J. E 36, 1 (2013).
- Costa et al. (2013) S. Costa, J. Kodikara, and B. Shannon, Geotechnique 63, 18 (2013).
- DeCarlo and Shokri (2014) K. F. DeCarlo and N. Shokri, Water Resour. Res. 50, 3039 (2014).
- Khatun et al. (2015) T. Khatun, T. Dutta, and S. Tarafdar, Eur. Phys. J. E 38, 83 (2015).
- Nandakishore and Goehring (2016) P. Nandakishore and L. Goehring, Soft Matter 12, 2253 (2016).
- Kitsunezaki et al. (2016) S. Kitsunezaki, A. Nakahara, and Y. Matsuo, EPL (Europhysics Letters) 114, 64002 (2016).
- Kitsunezaki (2010) S. Kitsunezaki, J. Phys. Soc. Jpn. 79, 124802 (2010).
- Maurini et al. (2013) C. Maurini, B. Bourdin, G. Gauthier, and V. Lazarus, Int. J. Fract. 184, 75 (2013).
- Ito and Yukawa (2014) S. I. Ito and S. Yukawa, Phys. Rev. E 90, 042909 (2014).
- Hirobe and Oguni (2016) S. Hirobe and K. Oguni, Comput. Methods Appl. Mech. Engrg. 307, 470 (2016).
- Müller (1998) G. Müller, J. Geophys. Res. 103, 15239 (1998).
- Mizuguchi et al. (2005) T. Mizuguchi, A. Nishimoto, S. Kitsunezaki, Y. Yamazaki, and I. Aoki, Phys. Rev. E 71, 056122 (2005).
- Goehring and Morris (2005) L. Goehring and S. W. Morris, Europhys. Lett. 69, 739 (2005).
- Goehring et al. (2009) L. Goehring, L. Mahadevan, and S. W. Morris, Proc. Natl. Acad. Sci. USA 106, 387 (2009).
- Goehring (2009) L. Goehring, Phys. Rev. E 80, 036116 (2009).
- Crostack et al. (2012) H. A. Crostack, J. Nellesen, G. Fischer, M. Hofmann, H. G. Rademacher, and W. Tillmann, Exp. Mech. 52, 917 (2012).
- Degraff et al. (1989) J. M. Degraff, P. E. Long, and A. Aydin, J. Volcan. Geotherm. Res. 38, 309 (1989).
- Goehring and Morris (2008) L. Goehring and S. W. Morris, J. Geophys. Res. 113, B10203 (2008).
- Shokri et al. (2010) N. Shokri, P. Lehmann, and D. Or, Phys. Rev. E 81, 046308 (2010).
- Singh et al. (2003) N. Singh, J. Singh, L. Kaur, N. S. Sodhi, and B. S. Gill, Food Chem. 81, 219 (2003).
- ArcGIS for Desktop(2015) (version 10.3.1) ArcGIS (version 10.3.1) for Desktop, ESRI Inc., Redlands, CA (2015).
- Merkus (2009) H. G. Merkus, Particle Size Measurements - Fundamentals, Practice, Quality (Springer Netherlands, 2009).
- Goehring et al. (2006) L. Goehring, S. W. Morris, and Z. Lin, Phys. Rev. E 74, 036115 (2006).
- Beuth (1992) J. L. Beuth, Jr, Int. J. Solids Struct. 29, 1657 (1992).
- Xia and Hutchinson (2000) Z. C. Xia and J. W. Hutchinson, J. Mech. Phys. Solids 48, 1107 (2000).
- Goehring (2013) L. Goehring, Phil. Trans. R. Soc. A 371, 20120353 (2013).
- Degraff and Aydin (1993) J. M. Degraff and A. Aydin, J. Geophys. Res. 98, 6411 (1993).
- Budkewitsch and Robin (1994) P. Budkewitsch and P. Y. Robin, J. Volcanol. Geotherm. Res. 59, 219 (1994).
- Hofmann et al. (2015) M. Hofmann, R. Anderssohn, H.-A. Bahr, H.-J. Weiß, and J. Nellesen, Phys. Rev. Lett. 115, 154301 (2015).
- Sosman (1916) R. B. Sosman, J. Geol. 24, 215 (1916).
- Beard (1959) C. N. Beard, Geol. Soc. Am. Bull. 70, 379 (1959).
- O’Reilly (1879) J. P. O’Reilly, Trans. R. Irish Acad. 26, 641 (1879).
- Otsu (1979) N. Otsu, IEEE Trans. Syst. Man Cybern. 9, 62 (1979).