Phase locking of a semiconductor double quantum dot single atom maser
Abstract
We experimentally study the phase stabilization of a semiconductor double quantum dot (DQD) single atom maser by injection locking. A voltage-biased DQD serves as an electrically tunable microwave frequency gain medium. The statistics of the maser output field demonstrate that the maser can be phase locked to an external cavity drive, with a resulting phase noise = -99 dBc/Hz at a frequency offset of 1.3 MHz. The injection locking range, and the phase of the maser output relative to the injection locking input tone are in good agreement with Adler’s theory. Furthermore, the electrically tunable DQD energy level structure allows us to rapidly switch the gain medium on and off, resulting in an emission spectrum that resembles a frequency comb. The free running frequency comb linewidth is 8 kHz and can be improved to less than 1 Hz by operating the comb in the injection locked regime.
pacs:
73.21.La, 73.23.Hk, 84.40.lkI Introduction
Narrow linewidth lasers have a wide range of applications in communication technology, industrial manufacturing, and metrology. Kleppner et al. (1962, 1965); Diddams et al. (2000). Unlike in atomic systems, where linewidths can approach 1 mHz Meiser et al. (2009); Kessler et al. (2012); Bohnet et al. (2012), charge noise in semiconductor lasers typically leads to linewidths that are 10–100 times larger than the Schawlow and Townes (ST) prediction Schawlow and Townes (1958); Siegman (1964); Milonni and Eberly (1988); Dick and Wang (1991); Bourgeois et al. (2005); Oxborrow et al. (2012). It is therefore often desirable to stabilize the frequency of solid state masers/lasers using existing narrow linewidth sources via the injection locking effect Stover and Steier (1966); Schünemann et al. (1998). To achieve an injection-locked state, an external cavity drive is applied to the laser, resulting in stimulated emission at the frequency of the injected signal and a corresponding reduction in linewidth Adler (1946). In addition to frequency stabilization, the precisely locked phase can be used as a resource for other metrology applications. For example, the phase of an injection-locked, trapped-ion-phonon laser has been proposed for applications in mass spectrometry and as an atomic-scale force probe Knünz et al. (2010).
In this paper we examine phase locking of a DQD semiconductor single atom maser (SeSAM) Liu et al. (2017). Driven by single electron tunneling events between discrete zero-dimensional electronic states, this device results in microwave frequency photon emission with a free-running emission linewidth of 6 kHz. Due to low frequency charge noise, the linewidth is still 50 times larger than the ST limit Schawlow and Townes (1958); Milonni and Eberly (1988); Liu et al. (2015a, 2017). Here we use injection locking to significantly improve the performance of the SeSAM. In contrast with our previous work, which demonstrated injection locking of a multi-emitter maser, we directly measure the degree of phase stabilization in the injection locked state by examining the photon statistics of the output field Liu et al. (2015b). The locked maser output achieves a phase noise better than = -99 dBc/Hz (1.3 MHz offset). The locking phase and locking range are shown to be in good agreement with Adler’s prediction Adler (1946).
Looking beyond single-tone narrow linewidth sources, the electrically tunable energy level structure of the SeSAM allows the gain medium to be switched on and off. We explore the output of the SeSAM in both free running and injection locked modes while the DQD energy levels are periodically modulated at frequency Cassidy et al. (2017). When the SeSAM is unlocked, it outputs a frequency comb with a mode spacing of and a 8 kHz linewidth. Under injection locking conditions, the linewidth of the modulated SeSAM frequency comb emission peaks is reduced to less than 1 Hz. These measurements demonstrate that a single cavity-coupled DQD may serve as a compact, low temperature microwave source that is suitable for use in quantum computing experiments.
II Double Quantum Dot Micromaser
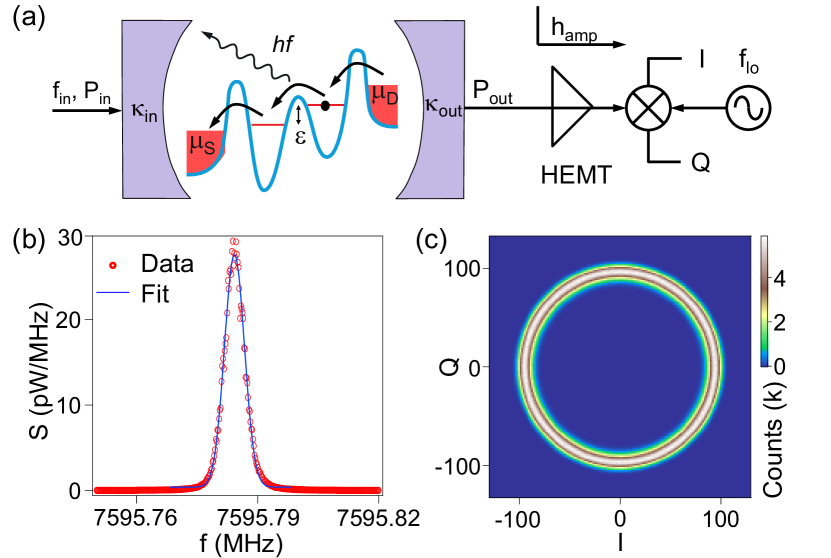
The SeSAM is implemented in the circuit quantum electrodynamics architecture (cQED), where strong coupling has been demonstrated between microwave photons and a variety of mesoscopic devices Wallraff et al. (2004); Mi et al. (2017); Stockklauser et al. (2017); Bruhat et al. (2016). As illustrated in Fig. 1(a), the maser consists of a single semiconductor DQD that is coupled to a microwave cavity Liu et al. (2017). The DQD gain medium is formed from a single InAs nanowire that is bottom gated to create an electrically tunable double-well confinement potential Nadj-Perge et al. (2010); van der Wiel et al. (2002). The DQD energy level detuning is gate-voltage-controlled and a source-drain bias can be applied across the device to result in sequential single electron tunneling. DQD fabrication and characterization details have been described previously Liu et al. (2014, 2015a, 2017).
The cavity consists of a half-wavelength () Nb coplanar waveguide resonator with a resonance frequency = 7596 MHz and quality factor Wallraff et al. (2004); Stehlik et al. (2016); Liu et al. (2017). Cavity input and output ports (with coupling rates MHz and MHz) are used to drive the SeSAM with the injection locking tone and to measure the internal field of the maser. The cavity output field is amplified and then characterized using either a spectrum analyzer (R&S FSV) or heterodyne detection. With heterodyne detection, the output field is demodulated by a local reference tone of frequency to yield the in-phase () and quadrature-phase () components Liu et al. (2015b); Stehlik et al. (2016). When the cavity is driven by an injection locking tone, the local reference is always set to the injection locking tone frequency in order to measure the phase of the maser output field relative to the injection locking input tone.
With mV applied, single electron tunneling is allowed when . In this configuration a single electron tunnels down in energy through the device [see Fig. 1(a)] and the source-drain bias repumps the DQD to generate the population inversion necessary for photon gain in the cavity Liu et al. (2015a, 2017). A trapped charge in the DQD forms an electric dipole moment that interacts with the cavity field with a rate MHz Delbecq et al. (2011); Frey et al. (2012); Petersson et al. (2012); Delbecq et al. (2013); Toida et al. (2013); Stehlik et al. (2016). Inelastic interdot tunneling results in a combination of phonon and photon emission van der Wiel et al. (2002); Fujisawa et al. (1998); Liu et al. (2015a). The gain mechanism of the SeSAM is similar to the single emitter limit of a quantum cascade laser, where a macroscopic number of electrons flow through quantum well layers and lead to cascaded photon emission Faist et al. (1994).
The maser is first characterized in free-running mode with (no injection locking tone applied). Figure 1(b) plots the power spectral density of the output radiation, . The emission peak is nicely fit by a Gaussian with a FWHM kHz that is 300 times narrower than the cavity linewidth MHz. The emission signal, and its narrow linewidth, are suggestive of an above-threshold maser state. Maser action is confirmed by measuring the statistics of the output field Liu et al. (2015a, 2017). Figure 1(c) shows the two-dimensional histogram resulting from individual measurements that were sampled at a rate of 12.3 MHz. Here MHz, where is the emission frequency. The histogram has donut shape that is consistent with an above-threshold maser. However, the histogram clearly shows that the phase of the maser output samples all angles in the plane, which indicates there are large phase fluctuations in free running mode. The randomization of phase is attributed to charge noise, which leads to random fluctuations in Liu et al. (2015b). In this paper we use injection locking to further improve the output characteristics of the SeSAM.
III Injection Locking Results
We now investigate the degree to which the output characteristics of the SeSAM can be improved using injection locking. In Section III.A we present results showing that the maser emission can be phase locked by driving the input port of the cavity with an injection locking tone. In the injection locked state, the maser output field has a phase noise = -99 dBc/Hz at MHz (1.3 MHz offset). In Section III.B, we measure the phase of the maser output field relative to the injection locking input tone as a function of input frequency, and show that it is in good agreement with Adler’s prediction. We then measure the injection locking range as a function of injection locking input tone power in Section III.C. The phase and frequency locking range measurements are consistent with each other, giving further evidence that the frequency locking observed in previous work is due to phase stabilization via the injection locking effect Liu et al. (2015b).
III.1 Phase Locking the SeSAM
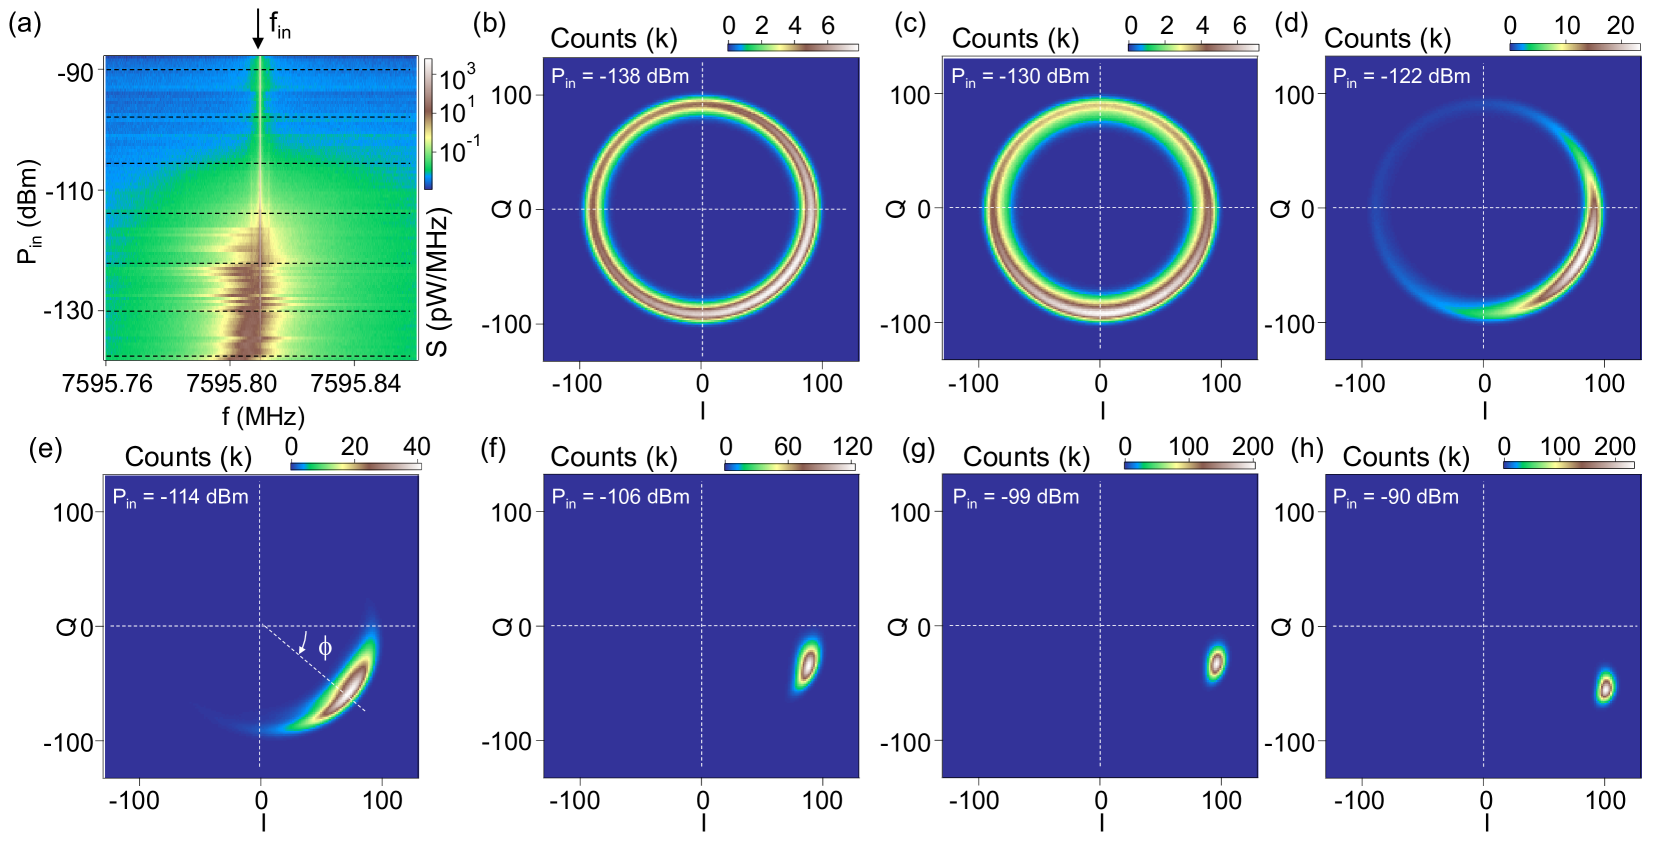
We first demonstrate frequency narrowing of the maser emission relative to the free-running state using injection locking Liu et al. (2015b). Figure 2(a) shows as a function of the injection locking input tone power with = 7595.805 MHz set near the free running emission frequency for this device tuning configuration. For negligible input powers ( dBm) the emission spectrum exhibits a broad peak near MHz with a typical FWHM kHz. Due to low frequency charge noise, the center frequency of the free-running emission peak fluctuates within the range MHz. With -125 dBm, the broad tails of the emission peak are suppressed and the spectrum begins to narrow. The SeSAM eventually locks to the injection locking input tone around -115 dBm. In the injection locked state, the large fluctuations in are suppressed and the measured linewidth is 100 Hz, more than a factor of 50 narrower than the free-running case RBW .
The histograms in Figs. 2(b–h) demonstrate the evolution of the maser output phase relative to the injection locking input tone as is increased (for these data sets ). A movie showing the evolution with is included in the supplemental material SOM . For small dBm, the histograms shown in Fig. 2(b-d) have a ring shape. In contrast to the free-running histogram shown in Fig. 1(c), these histograms have an unequal weighting in the plane. For example, the Fig. 2(d) histogram has a higher count density for phase angles around = -30∘. The ring shape indicates that the relative phase of the injection locking input tone and the maser emission are unlocked, while the increased number of counts near a specific phase angle is due to stimulated emission at . The radius of the rings in the -plane doesn’t significantly change as is increased, which indicates that the total output power of the SeSAM is nearly constant and limited by the DQD photon emission rate. As is further increased, the phase distribution continues to narrow, consistent with the narrowing of the emission peak shown in Fig. 2(a) Liu et al. (2015b).
Around dBm the ring shaped histogram evolves into a distribution that is localized within a relative phase , as demonstrated in Fig. 2(e). Here is the maximumly populated angle and is the measured standard deviation. In this configuration the phase of the maser output is locked to the injection locking input tone. The distribution in phase space is further narrowed with increasing as demonstrated by Figs. 2(f–h), where the relative phase is for dBm. The value at which phase stabilization occurs is in good agreement with the value of where frequency locking occurs, as demonstrated in Fig. 2(a).
The detected phase fluctuations in the histograms have a standard deviation for dBm. These fluctuations have a contribution from the intrinsic maser output fluctuations with a standard deviation and a contribution from amplifier background noise [see Fig. 1(a)], which has Eichler et al. (2012); Liu et al. (2015a); Stehlik et al. (2016). The detected field consists of , where is the cavity output. Given is independent of and , the distribution in the detected phase (in units of rad) has a standard deviation
After subtracting , the maser output phase fluctuations have a standard deviation within our detection resolution bandwidth MHz. The average phase noise of the locked maser output near is then estimated to be or, equivalently, = -99 dBc/Hz at a frequency offset of 1.3 MHz, when dBm. For comparison, the phase noise is 40–50 dBc/Hz larger than a typical precision microwave source such as the Keysight E8267D.
III.2 Phase Evolution Across the Injection Locking Range
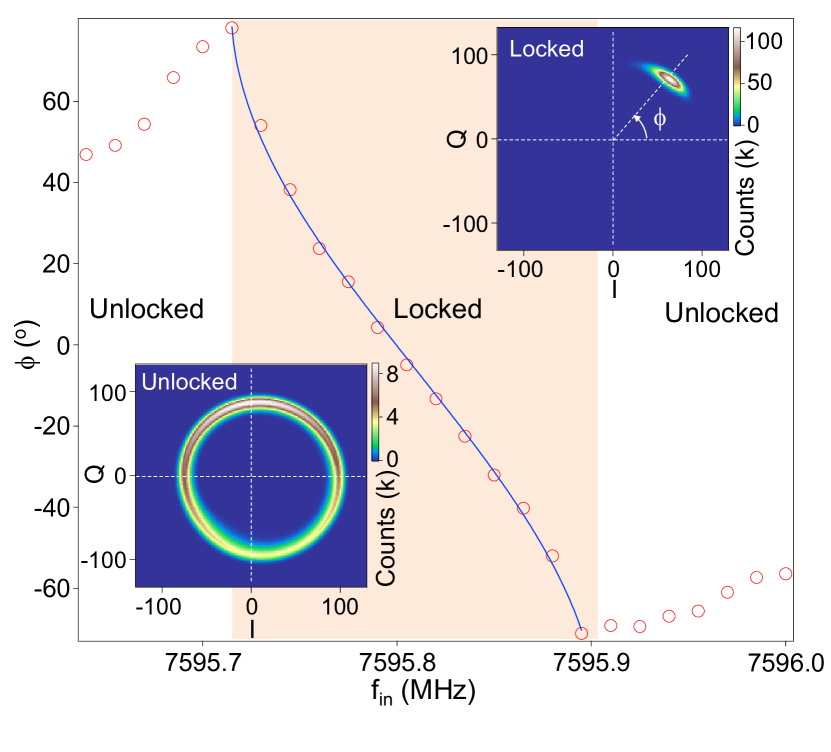
We now investigate the relative phase between the maser output and the injection locking input tone across the full injection locking range. The insets of Fig. 3 show histograms acquired with dBm at MHz (left inset) and MHz (right inset). With MHz, which is detuned by 0.17 MHz from the free running maser frequency , the distribution has a ring-like shape and thus the phase is unlocked. Note that in this regime the output is essentially the sum of two different tones, and this results in a noticeable offset in the ring. When approaches , the phase will be localized within a small range, as demonstrated in the right inset, which shows a distribution that is limited to . Here is detuned from by only 0.08 MHz.
The main panel of Fig. 3 shows as a function of with dBm. Within the indicated frequency range of MHz, the histograms are similar to the right inset and show output phases in the range . The maser output is thus “phase locked” to the input tone when is small.
The measured phase can be compared with predictions from Adler’s theory, which analyzes the maser dynamics when the injection locking tone input power is small compared to the free running emission power Adler (1946). We express the cavity output field in the lab frame as
| (1) |
where is the output power. The relative phase follows the Adler equation:
| (2) |
In the injection locking range , Eq. (2) has a static solution
| (3) |
Fluctuations in can be introduced by fluctuations in and the intrinsic standard deviation diverges near the boundaries of the injection locking range. Outside of this range is unlocked. The phase dependence predicted by the Adler equation is plotted as the blue curve in Fig. 3 and is in good agreement with our data.
III.3 Injection Locking Range
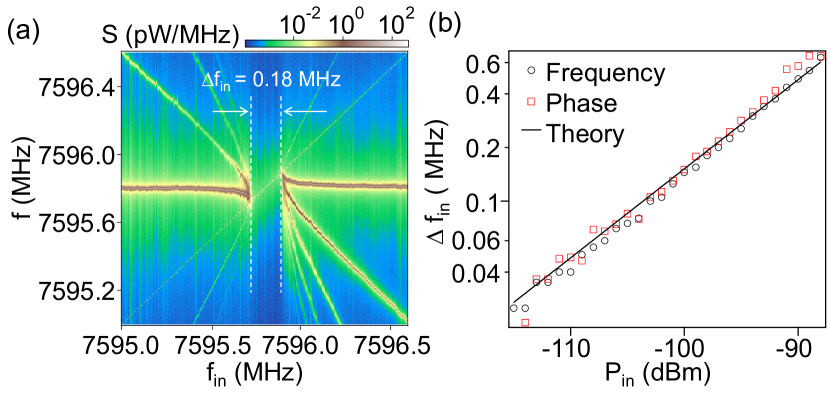
We next determine the frequency locking range from measurements of and compare these data with the phase locking measurements presented in the previous section. Figure 4(a) shows a color-scale plot of as a function of measured with = -98 dBm. Similar to our previous work Liu et al. (2015b), the input tone has little effect on the maser emission when is far-detuned from . As approaches , frequency pulling is visible and emission sidebands appear as a mixing between the injection locking input tone and the free running maser emission Siegman (1986); Armand (1969); Liu et al. (2015b). The maser then abruptly locks to , and remains locked to over a frequency range = 0.18 MHz. The frequency locking range is consistent with the phase locking data shown in Fig. 3, which is measured at the same .
By repeating these measurements at different , we obtain the data shown in Fig. 4(b), where measured by the two methods is plotted as a function of . The measurements are in good agreement, verifying that the frequency locking we observe in measurements of is due to the injection locking effect Liu et al. (2015b). The black line in Fig. 4(b) is a fit to the power law relation = , with the measured prefactor = , where the error bar is due to the uncertainty in the input transmission line losses. From theory, we find:
where the cavity prefactor accounts for internal cavity losses and is obtained using cavity input-output theory Siegman (1986); Liu et al. (2015b). The error bar is due to the uncertainty in and the calibration of . We therefore find reasonable agreement between the data and the predictions from Adler’s theory, considering the uncertainties in the transmission line losses.
IV Microwave Frequency Comb
We have so far examined the output characteristics of the SeSAM in free-running mode and under the influence of an injection locking tone. In this section, we investigate the output characteristics of the SeSAM while a periodic modulation is applied to the DQD energy levels, which modulates the gain medium. With the periodic modulation applied, we observe a comb-like emission spectrum, where the spacing between the emission peaks is set by the modulation frequency. The SeSAM frequency comb can also be operated under injection locking conditions, which leads to a dramatic narrowing of the emission peaks. The data presented in this section were acquired on a different device that has an emission frequency MHz and linewidth kHz.
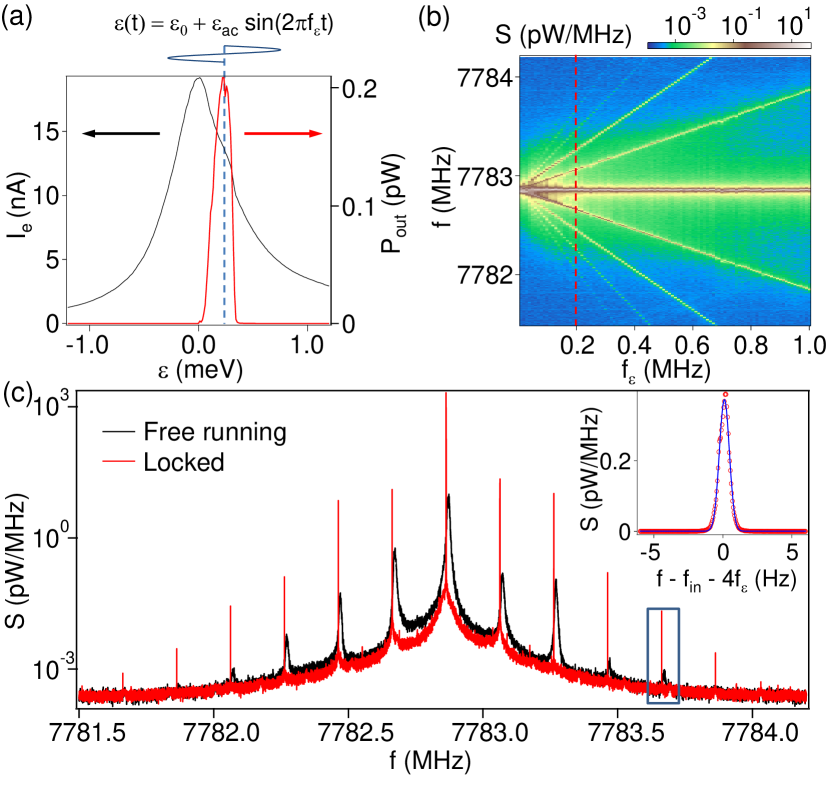
The modulation method is described in Fig. 5(a), which plots the electron current and as a function of . In free-running mode, the maximum output power pW is obtained at an offset detuning meV due to a strong phonon sideband Gullans et al. (2015). We next modulate the gain medium by applying a sine wave to the DQD gates, such that . Here and are the amplitude and frequency of the detuning modulation. As shown in Fig. 5(a), the SeSAM emission power is strongly detuning dependent. Therefore the effective gain rate will be modulated by the sinusoidal gate drive Liu et al. (2015a).
Figure 5(b) plots as a function of with meV. We observe a central emission peak around = 7782.86 MHz that is independent of . In addition to the central emission peak we observe a series of narrow emission peaks that shift away from the central emission peak as is increased. Up to 4 emission sidebands are clearly observed on both the low and high frequency sides of the central emission peak. With such a large modulation amplitude applied, photoemission from the DQD will turn on and off at a beat frequency . The beating in the time domain results in sidebands in the frequency domain, with a sideband spacing set by . The black curve in Fig. 5(c) shows a line cut through the data in Fig. 5(b) at MHz. The sidebands can be fit to a Lorentzian with a linewidth of 8 kHz, similar to the free-running maser linewidth = 3 kHz.
The linewidth of the emission peaks in the frequency comb can be significantly improved using the injection locking effect Diddams et al. (2000). For example, the red curve in Fig. 5(c) shows when the frequency comb is injection locked to an input tone at MHz and dBm. Compared to the free-running frequency comb data, the peak height and linewidth of the injection locked frequency comb have been dramatically improved. In addition, we observe 2 additional sidebands on both the low and high frequency sides of the central emission peak. The inset of Fig. 5(c) shows measured near the fourth sideband on the high frequency side of the central emission peak [near = 7783.65 MHz, see rectangle in main panel of Fig. 5(c)]. The sideband is best fit to a Gaussian of width 0.9 Hz, which is most likely limited by the 1 Hz resolution bandwidth of the microwave frequency spectrum analyzer RBW .
V Conclusion and Outlook
We have presented experimental evidence of phase locking of a semiconductor DQD single atom maser (SeSAM). The statistics of the maser emission in the complex plane demonstrates that the SeSAM can be phase locked to an injection locking input tone resulting in a emission signal with a phase noise = -99 dBc/Hz at a frequency offset of 1.3 MHz. Both phase and frequency locking data are shown to be in good agreement with Adler’s prediction. In addition, we utilize the electrical tunability of the DQD energy level structure to modulate the DQD gain medium. The resulting emission spectrum is a frequency comb, where individual emission peaks in the comb have a linewidth of around 8 kHz. By injection locking the SeSAM, we reach linewidths 1 Hz, an 8000-fold improvement. The SeSAM allows for studies of fundamental light-matter interactions in condensed matter systems. These measurements demonstrate that a single DQD may serve as a compact low temperature microwave source that is suitable for use in quantum computing experiments.
Acknowledgements.
We thank M. J. Gullans and J. M. Taylor for helpful discussions and acknowledge support from the Packard Foundation, the National Science Foundation Grant No. DMR-1409556, and the Gordon and Betty Moore Foundation’s EPiQS Initiative through Grant GBMF4535. Devices were fabricated in the Princeton University Quantum Device Nanofabrication Laboratory.References
- Kleppner et al. (1962) D. Kleppner, H. M. Goldenberg, and N. F. Ramsey, Properties of the Hydrogen Maser, Appl. Opt. 1, 55 (1962).
- Kleppner et al. (1965) D. Kleppner, H. C. Berg, S. B. Crampton, N. F. Ramsey, R. F. C. Vessot, H. E. Peters, and J. Vanier, Hydrogen-Maser Principles and Techniques, Phys. Rev. 138, A972 (1965).
- Diddams et al. (2000) S. A. Diddams, D. J. Jones, J. Ye, S. T. Cundiff, J. L. Hall, J. K. Ranka, R. S. Windeler, R. Holzwarth, T. Udem, and T. W. Hänsch, Direct Link between Microwave and Optical Frequencies with a 300 THz Femtosecond Laser Comb, Phys. Rev. Lett. 84, 5102 (2000).
- Meiser et al. (2009) D. Meiser, J. Ye, D. R. Carlson, and M. J. Holland, Prospects for a Millihertz-Linewidth Laser, Phys. Rev. Lett. 102, 163601 (2009).
- Kessler et al. (2012) T. Kessler, C. Hagemann, C. Grebing, T. Legero, U. Sterr, F. Riehle, M. J. Martin, L. Chen, and J. Ye, A sub-40-mHz-linewidth laser based on a silicon single-crystal optical cavity, Nature Photon. 6, 687 (2012).
- Bohnet et al. (2012) J. G. Bohnet, Z. Chen, J. M. Weiner, D. Meiser, M. J. Holland, and J. K. Thompson, A steady-state superradiant laser with less than one intracavity photon, Nature (London) 484, 78 (2012).
- Schawlow and Townes (1958) A. L. Schawlow and C. H. Townes, Infrared and Optical Masers, Phys. Rev. 112, 1940 (1958).
- Siegman (1964) A. E. Siegman, Microwave Solid-State Masers (McGraw-Hill, New York, 1964).
- Milonni and Eberly (1988) P. W. Milonni and J. H. Eberly, Lasers (Wiley, New York, 1988).
- Dick and Wang (1991) G. Dick and R. Wang, Ultra-Stable Performance of the Superconducting Cavity Maser, IEEE Trans. Instrum. Meas. 40, 174 (1991).
- Bourgeois et al. (2005) P.-Y. Bourgeois, N. Bazin, Y. Kersal, V. Giordano, M. E. Tobar, and M. Oxborrow, Maser oscillation in a whispering-gallery-mode microwave resonator, Appl. Phys. Lett. 87, 224104 (2005).
- Oxborrow et al. (2012) M. Oxborrow, J. D. Breeze, and N. M. Alford, Room-Temperature Solid-State Maser, Nature (London) 488, 353 (2012).
- Stover and Steier (1966) H. L. Stover and W. H. Steier, Locking of Laser Oscillation by Light Injection, Appl. Phys. Lett. 8, 91 (1966).
- Schünemann et al. (1998) U. Schünemann, H. Engler, M. Zielonkowski, M. Weidemüller, and R. Grimm, Magneto-Optic Trapping of Lithium Using Semiconductor Lasers, Opt. Commun. 158, 263 (1998).
- Adler (1946) R. Adler, A Study of Locking Phenomena in Oscillators, Proc. IRE 34, 351 (1946).
- Knünz et al. (2010) S. Knünz, M. Herrmann, V. Batteiger, G. Saathoff, T. W. Hänsch, K. Vahala, and T. Udem, Injection Locking of a Trapped-Ion Phonon Laser, Phys. Rev. Lett. 105, 013004 (2010).
- Liu et al. (2017) Y.-Y. Liu, J. Stehlik, C. Eichler, X. Mi, T. Hartke, M. J. Gullans, J. M. Taylor, and J. R. Petta, Threshold Dynamics of a Semiconductor Single Atom Maser, arxiv: 1704.01961 (2017).
- Liu et al. (2015a) Y.-Y. Liu, J. Stehlik, C. Eichler, M. J. Gullans, J. M. Taylor, and J. R. Petta, Semiconductor Double Quantum Dot Micromaser, Science 347, 285 (2015a).
- Liu et al. (2015b) Y.-Y. Liu, J. Stehlik, M. J. Gullans, J. M. Taylor, and J. R. Petta, Injection Locking of a Semiconductor Double-Quantum-Dot Micromaser, Phys. Rev. A 92, 053802 (2015b).
- Cassidy et al. (2017) M. C. Cassidy, A. Bruno, S. Rubbert, M. Irfan, J. Kammhuber, R. N. Schouten, A. R. Akhmerov, and L. P. Kouwenhoven, Demonstration of an ac Josephson junction laser, Science 355, 939 (2017).
- Wallraff et al. (2004) A. Wallraff, D. I. Schuster, A. Blais, L. Frunzio, R.-S. Huang, J. Majer, S. Kumar, S. M. Girvin, and R. J. Schoelkopf, Strong Coupling of a Single Photon to a Superconducting Qubit Using Circuit Quantum Electrodynamics, Nature (London) 431, 162 (2004).
- Mi et al. (2017) X. Mi, J. V. Cady, D. M. Zajac, P. W. Deelman, and J. R. Petta, Strong Coupling of a Single Electron in Silicon to a Microwave Photon, Science 355, 156 (2017).
- Stockklauser et al. (2017) A. Stockklauser, P. Scarlino, J. V. Koski, S. Gasparinetti, C. K. Andersen, C. Reichl, W. Wegscheider, T. Ihn, K. Ensslin, and A. Wallraff, Strong Coupling Cavity QED with Gate-Defined Double Quantum Dots Enabled by a High Impedance Resonator, Phys. Rev. X 7, 011030 (2017).
- Bruhat et al. (2016) L. E. Bruhat, T. Cubaynes, J. J. Viennot, M. C. Dartiailh, M. M. Desjardins, A. Cottet, and T. Kontos, Strong Coupling Between an Electron in a Quantum Dot Circuit and a Photon in a Cavity, arxiv 1612.05214 (2016).
- Nadj-Perge et al. (2010) S. Nadj-Perge, S. M. Frolov, E. P. A. M. Bakkers, and L. P. Kouwenhoven, Spin-Orbit Qubit in a Semiconductor Nanowire, Nature (London) 468, 1084 (2010).
- van der Wiel et al. (2002) W. G. van der Wiel, S. De Franceschi, J. M. Elzerman, T. Fujisawa, S. Tarucha, and L. P. Kouwenhoven, Electron Transport Through Double Quantum Dots, Rev. Mod. Phys. 75, 1 (2002).
- Liu et al. (2014) Y.-Y. Liu, K. D. Petersson, J. Stehlik, J. M. Taylor, and J. R. Petta, Photon Emission from a Cavity-Coupled Double Quantum Dot, Phys. Rev. Lett. 113, 036801 (2014).
- Stehlik et al. (2016) J. Stehlik, Y.-Y. Liu, C. Eichler, T. R. Hartke, X. Mi, M. J. Gullans, J. M. Taylor, and J. R. Petta, Double Quantum Dot Floquet Gain Medium, Phys. Rev. X 6, 041027 (2016).
- Delbecq et al. (2011) M. R. Delbecq, V. Schmitt, F. D. Parmentier, N. Roch, J. J. Viennot, G. Fève, B. Huard, C. Mora, A. Cottet, and T. Kontos, Coupling a Quantum Dot, Fermionic Leads, and a Microwave Cavity on a Chip, Phys. Rev. Lett. 107, 256804 (2011).
- Frey et al. (2012) T. Frey, P. J. Leek, M. Beck, A. Blais, T. Ihn, K. Ensslin, and A. Wallraff, Dipole Coupling of a Double Quantum Dot to a Microwave Resonator, Phys. Rev. Lett. 108, 046807 (2012).
- Petersson et al. (2012) K. D. Petersson, L. W. McFaul, M. D. Schroer, M. Jung, J. M. Taylor, A. A. Houck, and J. R. Petta, Circuit Quantum Electrodynamics with a Spin Qubit, Nature (London) 490, 380 (2012).
- Delbecq et al. (2013) M. R. Delbecq, L. E. Bruhat, J. J. Viennot, S. Datta, A. Cottet, and T. Kontos, Photon-Mediated Interaction Between Distant Quantum Dot Circuits, Nat. Commun. 4, 1400 (2013).
- Toida et al. (2013) H. Toida, T. Nakajima, and S. Komiyama, Vacuum Rabi Splitting in a Semiconductor Circuit QED System, Phys. Rev. Lett. 110, 066802 (2013).
- Fujisawa et al. (1998) T. Fujisawa, T. H. Oosterkamp, W. G. van der Wiel, B. W. Broer, R. Aguado, S. Tarucha, and L. P. Kouwenhoven, Spontaneous Emission Spectrum in Double Quantum Dot Devices, Science 282, 932 (1998).
- Faist et al. (1994) J. Faist, F. Capasso, D. L. Sivco, C. Sirtori, A. L. Hutchinson, and A. Y. Cho, Quantum Cascade Laser, Science 264, 553 (1994).
- (36) The frequency resolution is limited by the resolution bandwidth of the R&S spectrum analyzer FSV. For Fig. 2 the is set to 0.1 kHz, for Fig. 4 the is set to 1 kHz, for Fig. 5(b) and Fig. 5(c) main panel the is set to 0.1 kHz, and for Fig. 5(c) inset and Fig. 5(d) the is set to 1 Hz.
- (37) See the Supplemental Material at [url will be inserted by publisher] for a movie showing the evolution of emission statistics with increasing input power.
- Eichler et al. (2012) C. Eichler, D. Bozyigit, and A. Wallraff, Characterizing Quantum Microwave Radiation and its Entanglement with Superconducting Qubits Using Linear Detectors, Phys. Rev. A 86, 032106 (2012).
- Siegman (1986) A. E. Siegman, Lasers (University Science Books, Mill Valley, 1986).
- Armand (1969) M. Armand, On the Output Spectrum of Unlocked Driven Oscillators, Proc. IEEE 57, 798 (1969).
- Gullans et al. (2015) M. J. Gullans, Y.-Y. Liu, J. Stehlik, J. R. Petta, and J. M. Taylor, Phonon-Assisted Gain in a Semiconductor Double Quantum Dot Maser, Phys. Rev. Lett. 114, 196802 (2015).