11email: michele.starnini@gmail.com 22institutetext: Universitat de Barcelona Institute of Complex Systems (UBICS), Universitat de Barcelona, Barcelona, Spain 33institutetext: Fondazione Bruno Kessler, via Sommarive 18, I-38123 Trento, Italy
33email: lepri@fbk.eu 44institutetext: Department of Mathematics - City, University of London - Northampton Square, London EC1V 0HB, UK
44email: Andrea.Baronchelli.1@city.ac.uk 55institutetext: ISI Foundation, Torino, Italy
55email: ciro.cattuto@isi.it 66institutetext: Aix Marseille Univ, Université de Toulon, CNRS, CPT, Marseille, France
66email: alain.barrat@cpt.univ-mrs.fr 77institutetext: Departament de Física, Universitat Politècnica de Catalunya, Campus Nord B4, 08034 Barcelona, Spain
77email: romualdo.pastor@upc.edu
Robust modeling of human contact networks across different scales and proximity-sensing techniques
Abstract
The problem of mapping human close-range proximity networks has been tackled using a variety of technical approaches. Wearable electronic devices, in particular, have proven to be particularly successful in a variety of settings relevant for research in social science, complex networks and infectious diseases dynamics. Each device and technology used for proximity sensing (e.g., RFIDs, Bluetooth, low-power radio or infrared communication, etc.) comes with specific biases on the close-range relations it records. Hence it is important to assess which statistical features of the empirical proximity networks are robust across different measurement techniques, and which modeling frameworks generalize well across empirical data. Here we compare time-resolved proximity networks recorded in different experimental settings and show that some important statistical features are robust across all settings considered. The observed universality calls for a simplified modeling approach. We show that one such simple model is indeed able to reproduce the main statistical distributions characterizing the empirical temporal networks.
Keywords:
Social Computing; Computational Social Science; Social Network Analysis; Mobile Sensing; Mathematical Modeling; Wearable Sensors
1 Introduction
Being social animals by nature, most of our daily activities involve face-to-face and proximity interactions with others. Although technological advances have enabled remote forms of communication such as calls, video-conferences, e-mails, etc., several studies [50, 34] and the constant increase in business traveling, provide evidence that co-presence and face-to-face interactions still represent the richest communication channel for informal coordination [29], socialization and creation of social bonds [28, 48], and the exchange of ideas and information [14, 35, 51]. At the same time, close-range physical proximity and face-to-face interactions are known determinants for the transmission of some pathogens such as airborne ones [31, 39]. A quantitative understanding of human dynamics in social gatherings is therefore important not only to understand human behavior, creation of social bonds and flow of ideas, but also to design effective containment strategies and contrast epidemic spreading [44, 40, 21].
Hence, face-to-face and proximity interactions have long been the focus of major attention in social sciences and epidemiology [5, 4, 7, 18] and recently various research groups have developed sensing devices and approaches to automatically measure these interaction networks [16, 10, 39, 32, 1, 30, 47, 49]. Reality Mining (RM) [16], a study conducted in 2004 by the MIT Media Lab, was the first one to collect data from mobile phones to track the dynamics of a community of 100 business school students over a nine-month period. Following this seminal project, the Social Evolution study [32, 33] tracked the everyday life of a whole undergraduate dormitory for almost 8 months using mobile phones (i.e. call logs, location data, and proximity interactions). This study was specifically designed to model the adoption of political opinions, the spreading of epidemics, the effect of social interactions on depression and stress, and the eating and physical exercise habits. More recently, in the Friends and Family study 130 graduate students and their partners, sharing the same dormitory, carried smartphones running a mobile sensing platform for 15 months [1]. Additional data were also collected from Facebook, credit card statements, surveys including questions about personality traits, group affiliations, daily mood states and sleep quality, etc.
Along similar lines, the SocioPatterns (SP) initiative [10, 26] and the Sociometric Badges projects [36, 30, 37] have been studying since several years the proximity patterns of human gatherings, in different social contexts, such as scientific conferences [45], museums [9], schools [46, 20], hospitals [26] and research institutions [30] by endowing participants with active RFID badges (SocioPatterns initiative) or with devices equipped with accelerometers, microphones, Bluetooth and Infrared sensors (Sociometric Badges projects) which capture body movements, prosodic speech features, proximity, and face-to-face interactions respectively.
However, the different technologies (e.g., RFID, Bluetooth, Infrared sensors) employed in these studies might imply potentially relevant differences in measuring contact networks. Interaction range and the angular width for detecting contacts, for instance, vary in a significant way, from less than 1 meter using Infrared sensors to more than 10 meters using Bluetooth sensors, and from 15 degrees using Infrared sensors to 360 degrees using Bluetooth sensors. In many cases, data cleaning and post-processing is based on calibrated power thresholds, temporal smoothing, and other assumptions that introduce their own biases. Finally, experiments themselves are diverse in terms of venue (from conferences to offices), size (from to individuals), duration (from a single day to several months) and temporal resolution. The full extent to which the measured proximity networks depends on experimental and data-processing techniques is challenging to assess, as no studies, to the best of our knowledge, have tackled a systematic comparison of different proximity-sensing techniques based on wearable devices.
Here we tackle this task, showing that empirical proximity networks measured in a variety of social gatherings by means of different measurement systems yield consistent statistical patterns of human dynamics, so we can assume that such regularities capture intrinsic properties of human contact networks. The presence of such apparently universal behavior, independent of the measurement framework and details, calls, within a statistical physics perspective, for an explanatory model, based on simple assumptions on human behavior. Indeed, we show that a simple multi-agent model [41, 43] accurately reproduces the statistical regularities observed across different social contexts.
2 Related Work
The present study takes inspiration from the emerging body of work investigating the possibilities of analyzing proximity and face-to-face interactions using different kinds of wearable sensors. At present, mobile phones allow the collection of data on specific structural and temporal aspects of social interactions, offering ways to approximate social interactions as spatial proximity or as the co-location of mobile devices, e.g., by means of Bluetooth hits [32, 15, 1, 33, 47]. For example, Do and Gatica Perez have proposed several topic models for capturing group interaction patterns from Bluetooth proximity networks [12, 13]. However, this approach does not always yield good proxies to the social interactions occurring between the individuals carrying the devices.
Mobile phone traces suffer a similar problem: They can be used to model human mobility [22, 8] with the great advantage of easily scaling up to millions of individuals; they too, however, offer only coarse localization and therefore provide only rough co-location information, yielding thus only very limited insights into the social interactions of individuals.
An alternative strategy for collecting data on social interactions is to resort to image and video processing based on cameras placed in the environment [11, 2]. This approach provides very rich data sets that are, in turn, computationally very complex: They require line-of-sight access to the monitored spaces and people, specific effort for equipping the relevant physical spaces, and can hardly cope with large scale data.
Since 2010, Cattuto et al. [10] have used a technique for monitoring social interactions that reconciles scalability and resolution by means of proximity-sensing systems based on active RFID devices. These devices are capable of sensing spatial proximity over different length scales and even close face-to-face interactions of individuals (1 to 2m), with tunable temporal resolution. The SocioPatterns initiative has collected and analyzed face-to-face interaction data in many different contexts. These analyses have shown strong heterogeneities in the contact duration of individuals, the robustness of these statistics across contexts, and have revealed highly non-trivial mixing patterns of individuals in schools, hospitals or offices as well as their robustness across various timescales [46, 26, 27, 20, 23]. These data have been used in data-driven simulations of epidemic spreading phenomena, including the design and validation of containment measures [21].
Along a similar line, Olguin Olguin et al. [36] have designed and employed Sociometric Badges, platforms equipped with accelerometers, microphones, Bluetooth and Infrared sensors which capture body movements, prosodic speech features, proximity and face-to-face interactions respectively. Some previous studies based on Sociometric Badges revealed important insights into human dynamics and organizational processes, such as the impact of electronic communications on the business performance of teams [36], the relationship between several behavioral features captured by Sociometric Badges, employee’ self-perceptions (from surveys) and productivity [36], the spreading of personality and emotional states [3].
3 Empirical data
In this section, we describe datasets gathered by five different studies: The “Lyon hospital” and “SFHH” conference datasets from the SocioPatterns (SP) initiative [10], the Trento Sociometric Badges (SB) dataset [30], the Social Evolution (SE) dataset [32, 33], the Friends and Family (FF) [1] dataset, and two datasets (Elem and Mid) collected using wireless ranging enabled nodes (WRENs) [49]. The main statistical properties of datasets under consideration are summarized in Table 1, while the settings of the studies are described in detail in the following subsections.
3.1 SocioPatterns (SP)
The measurement infrastructure set up by the SP initiative is based on wireless devices embedded in badges, worn by the participants on their chests. Devices exchange radio packets and use them to monitor for proximity of individuals (RFID). Information is sent to receivers installed in the environment, logging contact data. They are tuned so that the face-to-face proximity of two individuals wearing the badges are sensed only when they are facing each other at close range (about 1 to 1.5m). The time resolution is set to 20 seconds, meaning that a contact between two individuals is considered established if their badges exchange at least one packet during such interval, and lasts as long as there is at least one packet exchanged over subsequent 20-second time windows. More details on the experimental setup can be found in Ref. [10]
Here we consider the dataset “Hospital”, gathered by the SP initiative at a Lyon Hospital, during 4 workdays, and the dataset “SFHH”, gathered by the SP initiative at the congress of the Société Francaise d’Hygiène Hospitaliére, where the experiment was conducted during the first day of a two-days conference. See Ref. [45] for a detailed description.
3.2 Sociometric Badges (SB)
The Sociometric Badges data [30] has been collected in a research institute for over a six week consecutive period, involving a population of 54 subjects, during their working hours. The Sociometric Badges, employed for this study, are equipped with accelerometers, microphones, Bluetooth and Infrared sensors which capture body movements, prosodic speech features, co-location and face-to-face interactions respectively [36]. For the purposes of our study we have exploited the data provided from the Bluetooth and Infrared sensors.
3.2.1 Infrared Data
Infrared (IR) transmissions are used to detect face-to-face interactions between people. In order for a badge to be detected by an IR sensor, two individuals must have a direct line of sight and the receiving badge’s sensor must be within the transmitting badge’s IR signal cone of height meter and a radius of , where degrees. The infrared transmission rate was set to 1Hz.
3.2.2 Bluetooth Data
Bluetooth (BT) detections can be used as a coarse indicator of proximity between devices. Radio signal strength indicator (RSSI) is a measure of the signal strength between transmitting and receiving devices. The range of RSSI values for the radio transceiver in the badge is (-128 dBm, 127 dBm). The Sociometric Badges broadcast their ID every five seconds using a 2.4 GHz transceiver ( = 12 transmissions per minute).
3.3 Social Evolution (SE)
The Social Evolution dataset was collected as part of a longitudinal study with 74 undergraduate students uniformly distributed among all four academic years (freshmen, sophomores, juniors, seniors). Participants in the study represents 80% of the residents of a dormitory at the campus of a major university in North America. The study participants were equipped with a smartphone (i.e. a Windows Mobile device) incorporating a sensing platform designed for collecting call logs, location and proximity data. Specifically, the software scanned for Bluetooth wireless devices in proximity every six minutes, a compromise between short-term social interactions and battery life [17]. With this approach, the BT log of a given smartphone would contain the list of devices in its proximity, sampled every six minutes.
Participants used the Windows Mobile smartphones as their primary phones, with their existing voice plans. Students had also online data access with these phones due to pervasive Wi-Fi on the university campus and in the metropolitan area. As compensation for their participation, students were allowed to keep the smartphones at the end of the experiment. Although relevant academic and extra-curricular activities might have not been covered either because the mobile phones may not be permanently on (e.g., during classes), or because of contacts with people not taking part to the study, the dormitory may still represent the preferential place where students live, cook, and sleep. Additional information on the SE study is available in Madan et al. [32, 33].
3.4 Friends and Family (FF)
The Friends and Family dataset was collected during a longitudinal study capturing the lives of 117 subjects living in a married graduate student residency of a major US university [1]. The sample of subjects has a large variety in terms of provenance and cultural background. During the study period, each participant was equipped with an Android-based mobile phone incorporating a sensing software explicitly designed for collecting mobile data. Such software runs in a passive manner and does not interfere with the every day usage of the phone.
Proximity interactions were derived from Bluetooth data in a manner similar to previous studies such as [16, 32]. Specifically, the Funf phone sensing platform was used to detect Bluetooth devices in the participant’s proximity. The Bluetooth scan was performed periodically, every five minutes in order to keep from draining the battery while achieving a high enough resolution for social interactions. With this approach, the BT log of a given smartphone would contain the list of devices in its proximity, sampled every 5 minutes. See Ref. [1] for a detailed description of the study.
3.5 Toth et al. datasets (Toth et al.)
The datasets, publicly available, were collected by Toth et al. [49] deploying wireless ranging enabled nodes (WRENs) [19] to students in Utah schools. Each WREN was worn by a student and collected time-stamped data from other WRENs in proximity at intervals of approximately 20 seconds. Each recording included a measure of signal strength, which depends on the distance between and relative orientation of the pair of individuals wearing each WREN. More specifically, Toth et al. [49] have applied signal strength criteria such that each retained data point was most likely to represent a pair of students, with face-to-face orientation, located 1 meter from each other.
In the current paper, we resort to the data collected from two schools in Utah: One middle school (Mid), an urban public school with 679 students (age range ); and one elementary school (Elem), a suburban public school with 476 students, (age range ). The contact data were captured during school hours of two consecutive school days in autumn 2012 from 591 students ( coverage) at Mid and in winter 2013 from 339 students ( coverage) at Elem.
4 Temporal network formalism
Proximity patterns can be naturally analyzed in terms of temporally evolving graphs [24, 25], whose nodes are defined by the individuals, and whose links represent interactions between pairs of individuals. Interactions need to be aggregated over an elementary time interval in order to build a temporal network [38]. This elementary time step represents the temporal resolution of data, and all the interactions established within this time interval are considered as simultaneous. Taken together, these interactions constitute an “instantaneous” network, formed by isolated nodes and small groups of interacting individuals (not necessarily forming cliques). The sequence of such instantaneous networks forms a temporal, or time-varying, network. The elementary time step is set to seconds in the case of SP data, seconds for SMBC data, seconds for SE and FF data, and seconds for Toth et al. datasets. Note that temporal networks are built by including only non-empty instantaneous graphs, i.e. graphs in which at least a pair of nodes are connected.
| Experiment | Dataset | dev | ||||||
|---|---|---|---|---|---|---|---|---|
| SP | hosp | RFID | 20 s | 84 | 20338 | 0.049 | 30.4 | 1146 |
| SP | sfhh | RFID | 20 s | 416 | 3834 | 0.075 | 53.9 | 502 |
| SB | SB | IR | 60 s | 56 | 10238 | 0.064 | 14.2 | 734 |
| SB | SB | BT | 60 s | 53 | 28604 | 0.029 | 44.1 | 20481 |
| SE | SE | BT | 300 s | 70 | 64068 | 0.29 | 66.2 | 48265 |
| FF | FF | BT | 300 s | 82 | 48839 | 0.33 | 56.1 | 26418 |
| Toth et al. | Elem | WREN | 20 s | 339 | 2242 | 0.20 | 46.2 | 634 |
| Toth et al. | Mid | WREN | 20 s | 590 | 2488 | 0.21 | 82.8 | 605 |
Each data set is thus represented by a temporal network with a number of different interacting individuals, and a total duration of elementary time steps. Temporal networks can be described in terms of a characteristic function taking the value 1 when individuals and are connected at time , and zero otherwise [42]. Integrating the information of the time-varying network over a given time window produces an aggregated weighted network, where the weight between nodes and represents the total temporal duration of the contacts between agents and , , and the strength of a node , , represents the cumulated time spent in interactions by individual .
In Table 1 we summarize a number of significant statistical properties, such as the size , the total duration in units of elementary time steps , and the average fraction of individuals interacting at each time step, . We also report the average degree, , defined as the average number of interactions per individual, and average strength, , of the aggregated networks, integrated over the whole sequence. One can note that the data sets under consideration are highly heterogeneous in terms of the reported statistical properties. Aggregated network representations preserve such heteogeneity, even though it is important to remark that aggregated properties are sensitive to the time-aggreagating interval [38] and therefore to the specificity of data collection and preprocessing.
5 Comparison among the different datasets
In this section we perform a comparison of several statistical properties of the temporal networks, as defined above, representing the different datasets under consideration.
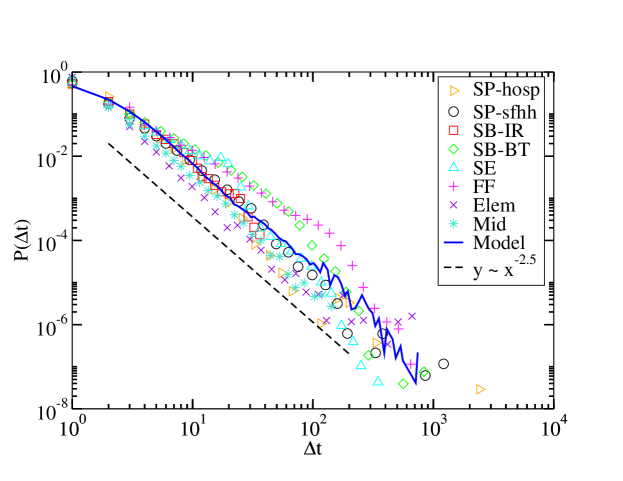
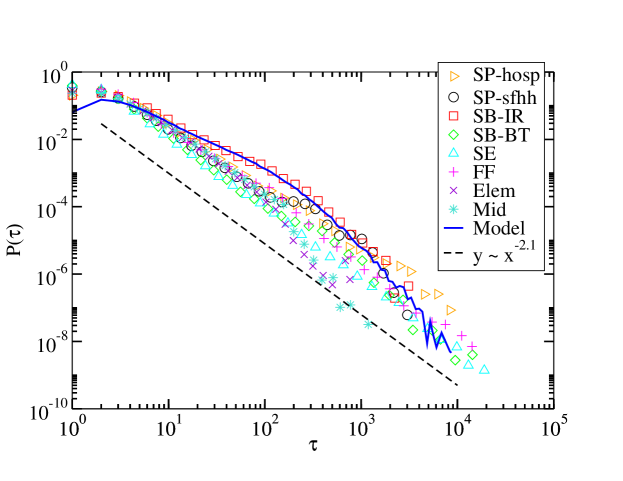
The temporal pattern of the agents’ contacts is probably the most distinctive feature of proximity interaction networks. We therefore start by considering the distribution of the durations of the contacts between pairs of agents, , and the distribution of gap times between two consecutive proximity events involving a given individual, . The bursty dynamics of human interactions [6] is revealed by the long-tailed form of these two distributions, which can be described in terms of a power-law function. Figures 1 and 2 show the distribution of the contacts duration and gap times for the various sets of empirical data. In both cases, all dataset shows a broad-tailed behavior, that can be loosely described by a power law distribution. In Figures 1 and 2 we plot, as a guide for the eye, power-law forms , with exponent , and , with exponent , respectively.
The probability distributions of strength, , and weight, , are a signature of the topological structure of the corresponding aggregated, weighted networks. Since the duration of the datasets under consideration is quite heterogeneous, see Table 1, we do not reconstruct the aggregated networks by integrating over the whole duration , but we integrate each temporal network over a time window of fixed length, elementary time steps. That is, we consider a random starting time (provided that ), and reconstruct an aggregated network by integrating the temporal network from to . We average our results by sampling 100 different starting times. Note that, since the elementary time step is different across different experiments, the real duration of the time window considered is different across different datasets.
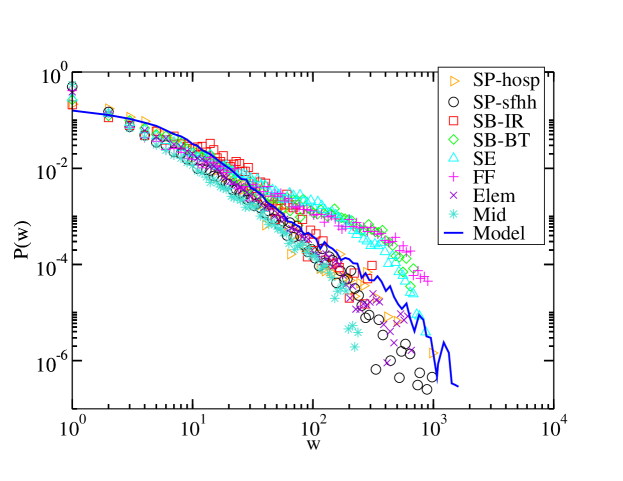
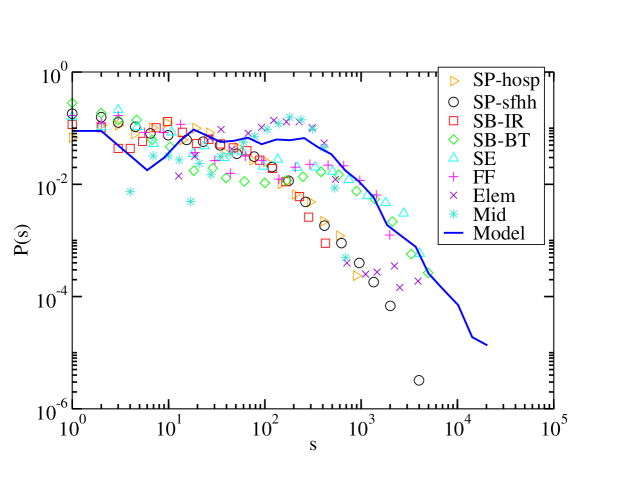
Figs. 3 and 4 show the weight and strength distributions, and , of the aggregated networks over , for the considered datasets. Again, all datasets display a similar heavy tailed weight distribution, roughly compatible with a power-law form, meaning that the heterogeneity shown in the broad-tailed form of the contact duration distribution, , persists also over longer time scales. Data sets SB-BT, SE and FF present deviations with respect to the other data sets. The strength distribution is also broad tailed and quite similar for all data sets considered, but in this case it is not compatible with a power law.
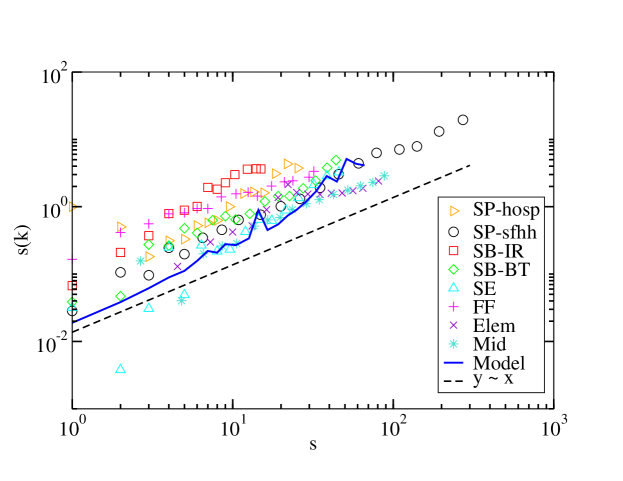
Finally, Fig. 5 shows the average strength as a function of the degree, , in the aggregated networks integrated over an interval . One can see that if the strength is rescaled by the total strength of the network in the considered time window, , the different data sets show a similar correlation between strength and degree. In particular, Fig. 5 shows that all data sets considered present a slightly superlinear correlation between strength and degree, with , as highlighted by the linear correlation plotted as a dashed line.
6 Modeling human contact networks
In the previous Section, we have shown that the temporal networks representing different datasets, highly heterogeneous in terms of size, duration, proximity-sensing techniques, and social contexts, are characterized by very similar statistical properties. Here we show that a simple model, in which individuals are endowed with different social attractiveness, is able to reproduce the empirical distributions.
6.1 Model definition
The social contexts in which the data were collected can be modeled by a set of mobile agents free to move in a closed environment, who interact when they are close enough (within the exchange range of the devices) [41]. The simplifying assumption of the model proposed in [41] is that the agents perform a random walk in a box of linear size with periodic boundary conditions (the average density is ). Whenever two agents are within distance (with ), they start to interact. The key ingredient of the model is that each agent is characterized by an “attractiveness”, , a quenched random number, extracted from a distribution , representing her power to raise interest in the others, which can be thought of as a proxy for social status or the role played in the considered social gathering. Attractiveness rules the interactions between agents in a natural way: Whenever an individual is involved in an interaction with other peers, she will continue to interact with them with a probability proportional to the attractiveness of her most interesting neighbor, or move away otherwise. Finally, the model incorporates the empirical evidence that not all agents are simultaneously present in system: Individuals can be either in an active state, where they can move and establish interactions, or in an inactive one representing absence from the premises. Thus, at each time step, every active individual becomes inactive with a constant probability , while inactive individuals can go back to the active state with the complementary probabillty . See Refs. [41, 43] for a detailed description of the model.
6.2 Model validation
Here we contrast the results obtained by the numerical simulation of the model against empirical data sets. We average our results over 100 runs with parameters , , . The results of numerical experiments are reported in Figs. 1 to 5, for the corresponding quantities considered, represented by a continuous, blue line.
In the case of the contact duration distribution, , Fig. 1, numerical and experimental data show a remarkable match, with some deviations for the SB-BT and FF datasets. Numerical data also show a close behavior to the mentioned power-law distribution with exponent . Also in the case of the gap times distribution, , Fig. 2, the distribution obtained by numerical simulations of the model is very close to the experimental ones, spanning the same orders of magnitude. The weight distribution of the model presents a very good fit to the empirical data, see Fig. 3, with the exception of data sets SB-BT, SE and FF, as mentioned above. The strength distribution , Fig. 4, is, as we have commented above, quite noisy, especially for the datasets of smallest size. It follows however a similar trend across the different datasets that is well matched by numerical simulations of the model. Finally, in the case of the average strength of individuals of degree , , Fig. 5, the most striking feature, namely the superlinear behavior as a function of , is correctly captured by the numerical simulations of the model.
7 Discussion
All datasets under consideration show similar statistical properties of the individuals’ contacts. The distribution of the contact durations, , and the inter-event time distribution, , are heavy tailed and compatible with power law forms, and the attractiveness model is able to quantitavely reproduce such behavior. The weight distribution of the aggregated networks, , is also heavy tailed for all datasets and for the attractiveness model, even though some datasets show deviations. The strength distribution and the correlation between strength and degree, , present a quite noisy behavior, especially for smaller datasets. However, all datasets show a long tailed form of and a superlinear correlation of the , correctly reproduced by the attractiveness model.
Previous work [10, 27, 20] have shown that the functional shapes of contact and inter-contact durations’ distributions were very robust across contexts, for data collected by the SocioPatterns infrastructure as well as by similar RFID sensors. Our results show that this robustness extends in fact to proximity data collected through different types of sensors (e.g., Bluetooth, Infrared, WREN, RFID).
This is of particular relevance in the context of modeling human behavior and building data-driven models depending on human interaction data, such as models for the spread of infectious diseases, from two points of view. On the one hand, the robust broadness of these distributions implies that different contacts might play very different roles in a transmission process: Under the common assumption that the transmission probability between two individuals depends on their time in contact, the longer contacts, which are orders of magnitude longer than average, could play a crucial role in disease dynamics. The heterogeneity of contact patterns is also relevant at the individual level, as revealed by broad distributions of strengths and the superlinear behavior of , and is known to have a strong impact on spreading dynamics. In particular, it highlights the existence of “super-contactors”, i.e. individuals who account for an important proportion of the overall contact durations and may therefore become super-spreaders in the case of an outbreak
On the other hand, the robustness of the distributions found in different contexts represents an important information and asset for modelers: It means that these distributions can be assumed to depend negligibly on the specifics of the situation being modeled and thus directly plugged into the models to create for instance synthetic populations of interacting agents. From another modeling point of view, they also represent a validation benchmark for microscopic models of interactions, which should correctly reproduce such robust features. In fact, as we have shown, a simple model based on mobile agents, and on the concept of social appealing or attractiveness, is able to reproduce most of the main statistical properties of human contact temporal networks. The good fit of this model hints towards the fact that the temporal patterns of human contacts at different time scales can be explained in terms of simple physical processes, without assuming any cognitive processes at work.
It would be of interest to measure and compare several other properties of the contact networks, such as the evolution of the integrated degree distribution and of the aggregated average degree in , or the rate at which the contact neighborhoods of individuals change. Unfortunately, these quantities are difficult to measure in some cases due to the small sizes of the datasets.
8 Acknowledgments
M.S. acknowledges financial support from the James S. McDonnell Foundation. R.P.-S. acknowledges financial support from the Spanish MINECO, under projects FIS2013-47282-C2- 2 and FIS2016-76830-C2-1-P, and additional financial support from ICREA Academia, funded by the Generalitat de Catalunya. C.C. acknowledges support from the Lagrange Laboratory of the ISI Foundation funded by the CRT Foundation.
References
- [1] Aharony, N., Pan, W., Ip, C., Khayal, I., Pentland, A.: Social fmri: Investigating and shaping social mechanisms in the real world. Pervasive and Mobile Computing 7(6), 643–659 (2011)
- [2] Alameda-Pineda, X., Staiano, J., Subramanian, R., Batrinca, L., Ricci, E., Lepri, B., Lanz, O., Sebe, N.: Salsa: A novel dataset for multimodal group behavior analysis. IEEE Transactions on Pattern Analysis and Machine Intelligence 38(8), 1707–1720 (2016)
- [3] Alshamsi, A., Pianesi, F., Lepri, B., Pentland, A., Rahwan, I.: Beyond contagion: Reality mining reveals complex patterns of social influence. Plos One 10(8), e0135740 (2015)
- [4] Arrow, H., McGrath, J., Berdahl, J.: Small groups as complex systems: Formation, coordination, development, and adaptation. Sage-Publications (2000)
- [5] Bales, R.: Interaction process analysis: A method for the study of small groups. Addison-Wesley (1950)
- [6] Barabasi, A.L.: The origin of bursts and heavy tails in human dynamics. Nature 435, 207 (2005)
- [7] Bion, W.: Experiences in groups and other papers. Routledge (2013)
- [8] Blondel, V., Decuyper, A., Krings, G.: A survey of results on mobile phone datasets analysis. EPJ Data Science 4 (2015)
- [9] Van den Broeck, W., Quaggiotto, M., Isella, L., Barrat, A., Cattuto, C.: The making of sixty-nine days of close encounters at the science gallery. Leonardo 45(3), 285–285 (2012)
- [10] Cattuto, C., Van den Broeck, W., Barrat, A., Colizza, V., Pinton, J.F., Vespignani, A.: Dynamics of person-to-person interactions from distributed RFID sensor networks. Plos One 5(7), e11596 (2010)
- [11] Cristani, M., Bazzani, L., Paggetti, G., Fossati, A., Tosato, D., Del Bue, A., Menegaz, G., Murino, V.: Social interaction discovery by statistical analysis of F-formations. In: Proceedings of the British Machine Vision Conference (2011)
- [12] Do, T., Gatica-Perez, D.: Human interaction discovery in smartphone proximity networks. Personal and Ubiquitous Computing 3, 413–431 (2013)
- [13] Do, T., Kalimeri, K., Lepri, B., Pianesi, F., Gatica-Perez, D.: Inferring social activities with mobile sensor networks. In: Proceedings of the International Conference on Multimodal Interaction. pp. 405–3412 (2013)
- [14] Doherty-Sneddon, G., Anderson, A., O’Malley, C., Langton, S., Garrod, S., Bruce, V.: Face-to-face and video-mediated communication: A comparison of dialogue structure and task performance. Journal of Experimental Psychology: Applied 3(2), 105–125 (1997)
- [15] Dong, W., Lepri, B., Pentland, A.: Modeling the co-evolution of behaviors and social relationships using mobile phone data. In: Proceedings of the Mobile and Ubiquitous Multimedia. pp. 134–143 (2011)
- [16] Eagle, N., Pentland, A.: Reality mining: sensing complex social systems. Personal and Ubiquitous Computing 10(4), 255–268 (2006)
- [17] Eagle, N., Pentland, A.S., Lazer, D.: Inferring friendship network structure by using mobile phone data. Proceedings of the National Academy of Sciences 106(36), 15274–15278 (2009)
- [18] Eames, K., Bansal, S., Frost, S., Riley, S.: Six challenges in measuring contact networks for use in modelling. Epidemics 10, 72–77 (2015)
- [19] Forys, A., Min, K., Schmid, T., Pettey, W., Toth, D., Leecaster, M.: Wrenmining: large-scale data collection for human contact network research. In: Proceedings of the 1st International Workshop on Sensing and Big Data Mining. pp. 1–6 (2013)
- [20] Fournet, J., Barrat, A.: Contact patterns among high school students. Plos One 9((9):e107878) (2014)
- [21] Gemmetto, V., Barrat, A., Cattuto, C.: Mitigation of infectious disease at school: targeted class closure vs school closure. BMC Infectious Diseases 14, 695 (2014)
- [22] Gonzaléz, M., Hidalgo, C., Barabasi, A.L.: Understanding individual human mobility patterns. Nature 7196(453), 779–782 (2010)
- [23] Génois, M., Vestergaard, C.L., Fournet, J., Panisson, A., Bonmarin, I., Barrat, A.: Data on face-to-face contacts in an office building suggest a low-cost vaccination strategy based on community linkers. Network Science 3(03), 326–347 (Sep 2015)
- [24] Holme, P., Saramäki, J.: Temporal networks. Phys. Rep. 519, 97–125 (2012)
- [25] Holme, P.: Modern temporal network theory: a colloquium. Eur. Phys. J. B 88(9), 234 (sep 2015)
- [26] Isella, L., Romano, M., Barrat, A., Cattuto, C., Colizza, V., Van den Broeck, W., Gesualdo, F., Pandolfi, E., Ravá, L., Rizzo, C., Tozzi, A.: Close encounters in a pediatric ward: Measuring face-to-face proximity and mixing patterns with wearable sensors. Plos One 6((2):e17144) (2011)
- [27] Isella, L., Stehlé, J., Barrat, A., Cattuto, C., Pinton, J.F., Van den Broeck, W.: What’s in a crowd? Analysis of face-to-face behavioral networks. Journal of Theoretical Biology 271(1), 166–180 (2011)
- [28] Kendon, A., Harris, R., Key, R.: In: Hinds, P., Kiesler, S. (eds.) Organization of Behavior in Face-to-Face Interaction. De Gruyter Mouton (1975)
- [29] Kraut, R., Fish, R., Root, R., Chalfonte, B.: Informal communication in organizations: Form, function, and technology. Groupware and Computer-Supported Cooperative Work pp. 287–314 (1993)
- [30] Lepri, B., Staiano, J., Rigato, G., Kalimeri, K., Finnerty, A., Pianesi, F., Sebe, N., Pentland, A.: The SocioMetric badges corpus: A multilevel behavioral dataset for social behavior in complex organizations. In: IEEE Proceedings of SocialCom/PASSAT. pp. 623–628. IEEE (2012)
- [31] Liljeros, F., Edling, C., Amaral, L., Stanley, H., Aberg, Y.: The web of human sexual contacts. Nature 6840, 907–908 (2001)
- [32] Madan, A., Cebrian, M., Lazer, D., Pentland, A.: Social sensing for epidemiological behavior change. In: Proceedings of the ACM International Conference on Ubiquitous Computing. pp. 291–300 (2010)
- [33] Madan, A., Cebrian, M., Moturu, S., Farrahi, K., Pentland, A.: Sensing the ”health state” of a community. IEEE Pervasive Computing 11(4), 36–45 (2012)
- [34] Nardi, B., Whittaker, S.: The place of face to face communication in distributed work. In: Hinds, P., Kiesler, S. (eds.) Distributed Work. pp. 351–360. Cambridge: MIT Press (2002)
- [35] Nohria, N., Eccles, R.: Face-to-face: Making network organizations work. Technology, organizations and innovation: Critical perspectives on business and management pp. 1659–1681 (2000)
- [36] Olguín Olguín, D., Waber, B., Kim, T., Mohan, A., Ara, K., Pentland, A.: Sensible organizations: Technology and methodology for automatically measuring organizational behavior. IEEE Transactions on Systems, Man, and Cybernetics, Part B (Cybernetics) 39, 43–55 (2009)
- [37] Onnela, J.P., Waber, B.N., Pentland, A., Schnorf, S., Lazer, D.: Using sociometers to quantify social interaction patterns. Scientific Reports (2014)
- [38] Ribeiro, B., Perra, N., Baronchelli, A.: Quantifying the effect of temporal resolution on time-varying networks. Scientific reports 3 (2013)
- [39] Salathé, M., Kazandjieva, M., Lee, J.W., Levis, P., Feldman, M.W., Jones, J.H.: A high-resolution human contact network for infectious disease transmission. Proceedings of the National Academy of Sciences 107(51), 22020–22025 (2010)
- [40] Smieszek, T., Salathé, M.: A low-cost method to assess the epidemiological importance of individuals in controlling infectious disease outbreaks. BMC MEDICINE 11(1), 35 (2013), http://www.biomedcentral.com/1741-7015/11/35, see related commentary article here http://www.biomedcentral.com/1741-7015/11/36
- [41] Starnini, M., Baronchelli, A., Pastor-Satorras, R.: Modeling human dynamics of face-to-face interaction networks. Physical Review Letters 110, 168701–168706 (2013)
- [42] Starnini, M., Baronchelli, A., Barrat, A., Pastor-Satorras, R.: Random walks on temporal networks. Phys. Rev. E 85, 056115 (May 2012)
- [43] Starnini, M., Baronchelli, A., Pastor-Satorras, R.: Model reproduces individual, group and collective dynamics of human contact networks. Social Networks 47, 130–137 (oct 2016)
- [44] Starnini, M., Machens, A., Cattuto, C., Barrat, A., Pastor-Satorras, R.: Immunization strategies for epidemic processes in time-varying contact networks. J. Theor. Biol. 337, 89–100 (nov 2013)
- [45] Stehlé, J., Voirin, N., Barrat, A., Cattuto, C., Colizza, V., Isella, L., Régis, C., Pinton, J.F., Khanafer, N., Van den Broeck, W., Vanhems, P.: Simulation of an SEIR infectious disease model on the dynamic contact network of conference attendees. BMC Medicine 9(87) (2011)
- [46] Stehlé, J., Voirin, N., Barrat, A., Cattuto, C., Isella, L., Pinton, J.F., Quaggiotto, M., Van den Broeck, W., Régis, C., Lina, B., Vanhems, P.: High-resolution measurements of face-to-face contact patterns in a primary school. Plos One 6(8), e23176 (2011)
- [47] Stopczynski, A., Sekara, V., Sapiezynski, P., Cuttone, A., Larsen, J.E., Lehmann, S.: Measuring large-scale social networks with high resolution. PLOS One 9(4), e95978 (2014)
- [48] Storper, M., Venables, A., Pastor-Satorras, R.: Buzz: Face-to-face contact and the urban economy. Journal of Economic Geography (4), 351–360 (2004)
- [49] Toth, D.J.A., Leecaster, M., Pettey, W.B.P., Gundlapalli, A.V., Gao, H., Rainey, J.J., Uzicanin, A., Samore, M.H.: The role of heterogeneity in contact timing and duration in network models of influenza spread in schools. Journal of The Royal Society Interface 12(108), 20150279 (2015)
- [50] Whittaker, S., Frohlich, D., Daly-Jones, O.: Informal workplace communication: What is it like and how might we support it? In: Proceedings of the ACM Conference on Human Factors in Computing Systems CHI’94. pp. 131–137. New York: ACM Press (1994)
- [51] Wright, M., Li, Y.: The associations between young adults’ face-to-face prosocial behaviorsand their online prosocial behaviors. Computers in Human Behavior 27, 1959–1961 (2011)