The circumestellar disk of the B0 protostar powering the HH 80-81 radio jet
Abstract
We present subarcsecond angular resolution observations carried out with the Submillimeter Array (SMA) at 880 m centered at the B0-type protostar GGD27 MM1, the driving source of the parsec scale HH 80-81 jet. We constrain its polarized continuum emission to be at this wavelength. Its submm spectrum is dominated by sulfur-bearing species tracing a rotating disk–like structure (SO and SO2 isotopologues mainly), but also shows HCN-bearing and CH3OH lines, which trace the disk and the outflow cavity walls excavated by the HH 80-81 jet. The presence of many sulfurated lines could indicate the presence of shocked gas at the disk’s centrifugal barrier or that MM1 is a hot core at an evolved stage. The resolved SO2 emission traces very well the disk kinematics and we fit the SMA observations using a thin-disk Keplerian model, which gives the inclination (47), the inner ( AU) and outer ( AU) radii and the disk’s rotation velocity (3.4 km s-1 at a putative radius of 1700 AU). We roughly estimate a protostellar dynamical mass of 4-18 M☉. MM2 and WMC cores show, comparatively, an almost empty spectra suggesting that they are associated with extended emission detected in previous low-angular resolution observations, and therefore indicating youth (MM2) or the presence of a less massive object (WMC).
Subject headings:
stars: formation – ISM: molecules – ISM: individual objects (GGD27, HH 80-81, IRAS 18162-2048) – submillimeter: ISMI. Introduction
It is well stablished that most low-mass stars develop accreting disks in their earliest stages previous to the pre-main sequence phase (Adams et al. 1987; Shu et al. 1987; Butner et al. 1991; for the first HST images of disks see O’dell et al. 1993; O’dell & Wen 1994; Burrows et al. 1996). These disks may be the seed where planets are formed (see recent reviews by Helled et al. 2014 and Baruteau et al. 2014). The properties of the accretion disks are better studied in the T Tauri stage since the surrounding material has already infallen into the disk–protostar system or has been dispersed by the strong outflow activity (e.g., Hogerheijde et al., 1998; André et al., 2004). Still recent works have found disks even in the earliest embedded stages of Class 0 protostars (e.g., Tobin et al., 2012; Murillo & Lai, 2013; Rao et al., 2014). Class 0 disks are, in general, also smaller in size (50 AU; e.g., Tobin et al. 2013; Segura-Cox et al. 2016) than T Tauri disks (200-300 AU; e.g., Takakuwa et al. 2012; Harsono et al. 2014; Piétu et al. 2014). Disks are usually detected using their (sub)mm continuum emission and the emission of major CO isotopes. From the spectral line observations, the kinematical structure of disks around T Tauri protostars is found consistent with Keplerian motions (Guilloteau & Dutrey, 1998; Guilloteau et al., 1999; Brinch et al., 2007; Lommen et al., 2008; Schaefer et al., 2009; Jørgensen et al., 2009; Takakuwa et al., 2012; Piétu et al., 2014), while it is more difficult to disentangle the kinematic signature of rotation and infalling motions in disks/envelopes of Class 0 protostars (Takakuwa et al., 2007; Brinch et al., 2009; Tobin et al., 2012).
Accretion disks around massive stars are a much rarer phenomenon. This can be explained due to an observational bias: massive young stars dynamically evolve much faster and are located at farther distances. However, it is still a matter of debate whether the most massive stars are ever associated with accretion disks. Most of the reported accretion disks around massive stars are mostly associated with early B-type protostars (Cesaroni et al., 2005; Patel et al., 2005; Franco-Hernández et al., 2009; Fernández-López et al., 2011a; Wang et al., 2012; Sanchez-Monge et al., 2013; Beltrán & de Wit, 2016), although there are some evidence of disks around O-type stars (Johnston et al., 2015; Ilee et al., 2016).
The massive star-forming region GGD27 (IRAS 181622048) is located at a distance of 1.7 kpc (Gyulbudaghian et al., 1978). It harbors a cluster of IR, mm and cm sources tracing young stellar objects in different evolutionary stages (Aspin et al., 1991; Aspin & Geballe, 1992; Gomez et al., 1995; Stecklum et al., 1997; Gómez et al., 2003; Qiu et al., 2008; Qiu & Zhang, 2009). Some of these sources are associated with molecular outflows and jets. In particular, Fernández-López et al. (2013) find three molecular outflows powered by protostars embedded in MM2; two of them appear to be monopolar. In addition, the main mm source, MM1, launches the spectacular (14 pc long) and highly collimated radio jet known as HH 80-81-80N, which is powered by a massive early B-type protostar (Martí et al., 1993, 1995, 1998; Masqué et al., 2012; Masqué et al., 2015). The HH 80-81-80N radio jet is the first one where polarized emission due to relativistic electrons has been detected indicating the presence of a magnetic field aligned with the jet (Carrasco-González et al., 2010). This is highly indicative that the jet is launched from an accretion disk (Frank et al., 2014). Indeed, recent (sub)millimeter high-angular resolution interferometric observations show evidence of the presence of an accretion disk surrounding the massive protostar (Fernández-López et al., 2011a, b; Carrasco-González et al., 2012, hereafter FL11a, FL11b and CG12): a hot ( K) and very dense ( cm-3) molecular rotating disk-like structure with a radius of (850 AU), with its rotation axes parallel to the radio jet, and surrounding a dusty disk with a radius of (200 AU; FL11a, CG12). The estimated centrifugal radius, AU (CG12), suggests that within the uncertainties the observed molecular and dusty rotating structure is an accretion disk. From the available observations, a dynamical mass (disk plus protostar) of 11–15 M⊙ and an accretion rate M⊙ yr-1 (FL11b, CG12) have been inferred.
In this paper we present SMA observations carried out at 345 GHz at an angular resolution of . The observations are briefly described in § II and the molecular line and dust continuum maps are presented in § III. An analysis of the kinematic behavior of the rotating disk-like structure from a selected sample of molecular line channel maps is shown in § IV. In § V we discuss the chemical and physical properties of the molecular gas detected with the SMA. Finally, in § VI we draw our main conclusions.
II. Observations
The SMA observations were taken on 2011 July 18 and October 3 in the extended and very extended configurations, respectively. The observations were done using the 345 GHz receivers and the quarter wave plates (QWP). During the observations the QWP are rotated in order to measure the four circular polarization cross correlations for each baseline, LL, RR, RL and RL (R and L stands for right and left circular polarization). Marrone et al. (2006) and Marrone & Rao (2008) describe in detail the SMA polarimeter as well as the polarization calibration strategy. The receiver was tuned to cover the 332.1-336.0 and 344.0-347.9 GHz frequency ranges in the lower (LSB) and upper (USB) sidebands, respectively. The phase center of the telescope was pointing at (J2000.0) and (J2000.0)-. The correlator provided a spectral resolution of about 0.8 MHz (i.e., 0.7 km s-1 at 345 GHz). The gain calibrator was the QSO J1733130. The bandpass and polarization calibrator was 3c454.3, which was observed in a parallactic angle range of . The absolute flux scale was determined from observations of Callisto. The flux uncertainty was estimated to be %. The instrumental polarization was corrected at an accuracy level of 0.1%. The data were reduced using the MIRIAD software package (Wright & Sault, 1993). The continuum and line molecular emission were separated in the visibility space using the MIRIAD task uvlin. An iterative process of phase-only self-calibration was performed using the continuum Stokes data. We started with a time interval of 20 minutes for the gain solutions. Then we decreased the interval in the subsequent steps until we reached an interval of 5 minutes. At the end of the self-calibration the noise decreased by about 30%. The derived gain solutions were applied to the molecular line data.
The continuum emission maps were obtained using the whole available bandwidth by setting a robust weighting of 0.5 and selecting the multi-frequency synthesis option in the MIRIAD task invert. The resulting synthesized beam full width at half maximum (FWHM) was with a position angle of . The achieved noise for the Stokes I continuum map was 3.4 mJy beam-1, and for the Stokes Q and U continuum maps was 1.6 mJy beam-1. The larger noise of the Stokes I is due to the limited dynamic range of the array. For the molecular line emission, channel maps were done using a robust weighting of 2.0 (equivalent to Natural weighting). This yielded synthesized beams sizes (FWHM, PA) between , and , , which are the values for the lines with the highest and lowest frequencies, respectively. Figures were created using the GREG package (from the GILDAS111GILDAS data reduction package is available at http://www.iram.fr/IRAMFR/GILDAS software). The CO 3-2 maps from the observations presented here were already presented in Fernández-López et al. (2013).
| R.A. | DEC. | |||
|---|---|---|---|---|
| Source | 18h19h | (mJy beam-1) | (mJy) | |
| MM1 | 6244 | 7329 | ||
| MM2(E) | 1024 | 35023a | ||
| MM2(W) | 334 | – | ||
| WMCb |
a Total flux of MM2(E) and MM2(W)
b Position from (Qiu & Zhang, 2009)
| Molecular | El | S | ||
| transition | (GHz) | (K) | (Jy km s-1) | |
| SO2 | ||||
| 43,1-32,2 | 332.50524 | 15.34 | 6.92 | 15.560.64 |
| 82,6-71,7 | 334.67335 | 27.08 | 4.95 | 13.910.59 |
| 132,12-121,11b | 345.33854 | 76.41 | 13.41 | 13.820.58 |
| 164,12-163,13b | 346.52388 | 147.83 | 23.10 | 17.371.15 |
| 191,19-180,18 | 346.65217 | 151.50 | 41.98 | 21.030.58 |
| 212,20-211,21 | 332.09143 | 203.59 | 15.20 | 13.000.61 |
| 34SO2 | ||||
| 64,2-63,3 | 345.55309 | 40.66 | 6.34 | 3.240.60 |
| 74,4-73,5a | 345.51966 | 47.09 | 8.09 | 1.440.58 |
| 84,4-83,5 | 345.16866 | 54.46 | 9.77 | 4.430.73 |
| 94,6-93,7 | 345.28562 | 62.72 | 11.41 | 5.200.78 |
| 104,6-103,7 | 344.24535 | 71.97 | 13.06 | 4.820.66 |
| 114,8-113,9 | 344.99816 | 82.05 | 14.67 | 3.220.69 |
| 134,10-133,11 | 344.80791 | 105.06 | 17.92 | 4.050.67 |
| 154,12-153,13 | 344.98758 | 131.76 | 21.20 | 4.920.69 |
| 164,12-163,13 | 332.83623 | 147.14 | 23.23 | 4.550.62 |
| 191,19-180,18 | 344.58104 | 151.10 | 42.24 | 4.910.68 |
| 174,14-173,15 | 345.92935 | 162.14 | 24.49 | 2.280.57 |
| OS17O | ||||
| 154,11-153,12a | 345.93452 | 133.72 | 125.43 | 2.900.53 |
| SO | ||||
| 98-87 b | 346.52848 | 62.14 | 21.52 | 23.031.15 |
| 88-77 | 344.31061 | 70.96 | 18.56 | 15.560.20 |
| 34SO | ||||
| 78-67 | 333.90098 | 63.84 | 16.24 | 10.010.60 |
| CH3OH | ||||
| 22,1-31,2 | 335.13369 | 28.59 | 0.31 | 3.120.40 |
| 71,7-61,6 A | 335.58200 | 62.87 | 5.55 | 11.350.44 |
| 54,2-63,3 | 346.20278 | 98.55 | 0.496 | 2.400.54 |
| 54,1-63,4 | 346.20437 | 98.55 | 0.496 | 2.400.54 |
| 30,3-21,2 vt=1 | 334.42659 | 298.42 | 0.89 | 1.240.44 |
| 161,15-152,14 | 345.90397 | 316.05 | 7.13 | 6.030.70 |
| 182,16-173,14 | 344.10913 | 402.88 | 5.31 | 4.130.49 |
| 191,19-182,16 | 344.44390 | 434.70 | 6.00 | 3.260.75 |
| 18-3,16-17-4,14a | 345.91919 | 442.83 | 5.61 | 2.020.50 |
| CO 3-2c | 345.79599 | 16.60 | 0.036 | |
| HDCO 51,4-41,3a | 335.09679 | 40.17 | 26.05 | 1.640.40 |
| HCN 38-37 | 335.56088 | 297.98 | 526.9 | 2.080.37 |
| HC15N 4-3 | 344.20011 | 24.78 | 35.65 | 4.760.63 |
| H13CN 4-3 | 345.33976 | 24.86 | 35.65 | b |
| H13CO+ 4-3d | 346.99835 | 24.98 | 60.85 | -2.220.51 |
| SiO 8-7 | 347.33082 | 58.35 | 76.79 | 2.580.77 |
a Tentative detection.
b SO2 132,12-121,11 and H13CN 4-3 are blended. The same holds for SO 98-87 and SO2 164,12-163,13. Therefore, their estimated line intensities are possibly not well determined and the quoted uncertainties come just from the fitting procedure.
c Very broad line, the cloud velocities are strongly affected by missing flux.
d Tentative detection seen in absorption.
III. Results
III.1. 880 m continuum emission
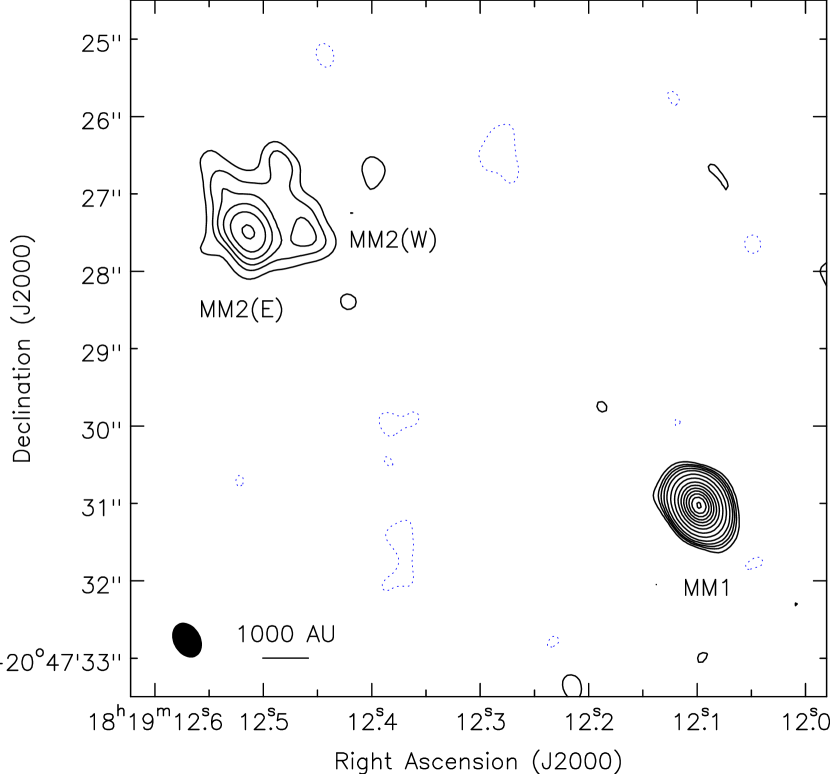
Figure 1 shows the 880 m (340.0 GHz) continuum map toward GGD27 obtained with the SMA. This map is in good agreement with the subarcsecond 1.35 mm continuum maps by FL11a, where the sources were detected. Table 1 shows the position, peak intensity and flux density of the sources. MM1 shows compact emission. A Gaussian fit to this source yielded a deconvolved size of , indicating that the source radius is AU, which is coincident with the upper limit found by FL11a. However, the fit can not constrain whether the source is elongated in a particular direction. MM2(W) and MM2(E) are surrounded by weak emission at a 15 mJy beam-1 level extending (about 1700 AU). No dust continuum emission is detected around the warm molecular core (WMC; Qiu & Zhang, 2009).
No continuum polarization is detected above 3- level in the Stokes Q and U maps. This yields an upper limit (at 3-) of polarization of 0.8% and 4.7% for MM1 and MM2(W), respectively. The MM1 upper limit is significantly lower than the typical values found in millimeter interferometric observations of dense cores around low and high mass star forming regions (2–10%, e.g. Girart et al., 1999; Lai et al., 2003; Girart et al., 2006, 2009; Hull et al., 2014; Zhang et al., 2014), but it is not far from the values found in disks around low–mass young stellar objects (Hughes et al., 2013; Rao et al., 2014; Stephens et al., 2014; Kataoka et al., 2016).
III.2. Molecular emission in MM1
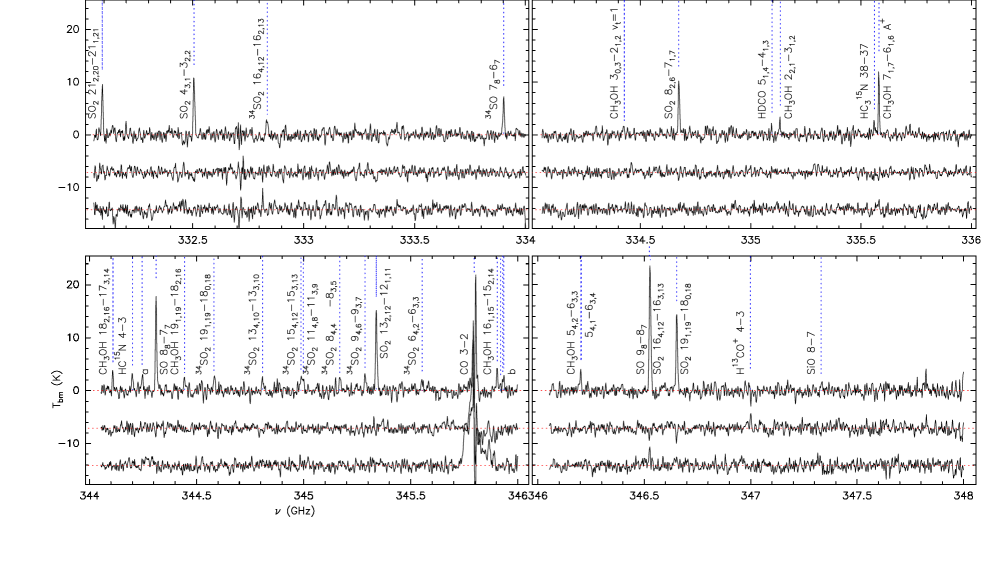
Previous arcsecond observations show that in GGD27 there are three sites with bright molecular emission (e. g., Qiu & Zhang, 2009): two of them are sites of massive star formation, GGD27 MM1 and MM2, and the WMC, which does not have clear signs of star formation. The new subarcsecond angular resolution observations over the whole observed spectra (totaling about 7.8 GHz) show very different molecular characteristics in the three molecular sources (see Fig. 2). MM2 and WMC present an almost empty spectra, showing no emission lines in the whole spectrum except for the CO 3–2 line, and marginal emission of the SO 98-87, CH3OH 71,7-61,6 lines for WMC, and of the H13CO+ 4-3 line for MM 2. This is different to what has been found previously at both lower angular resolution and lower frequencies, specially toward WMC, where several relatively complex molecules were clearly detected, e. g., CH3OH, CH3CN or HNCO (Qiu & Zhang, 2009). MM2 exhibits strong CO emission associated with molecular outflows being powered by embedded protostars (Fernández-López et al., 2013).
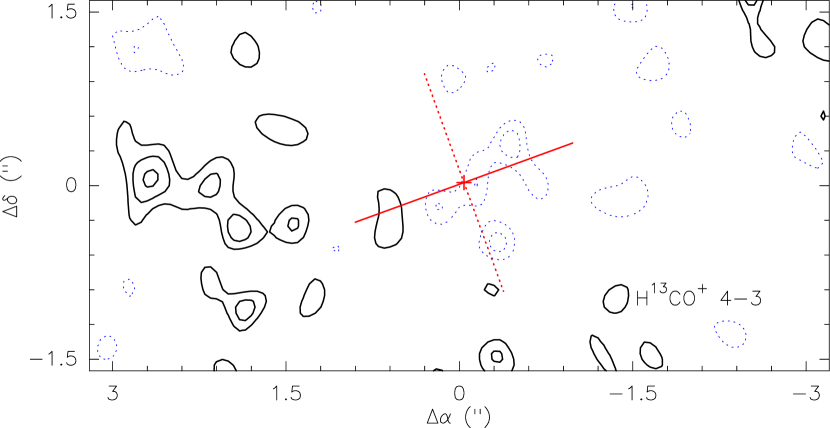
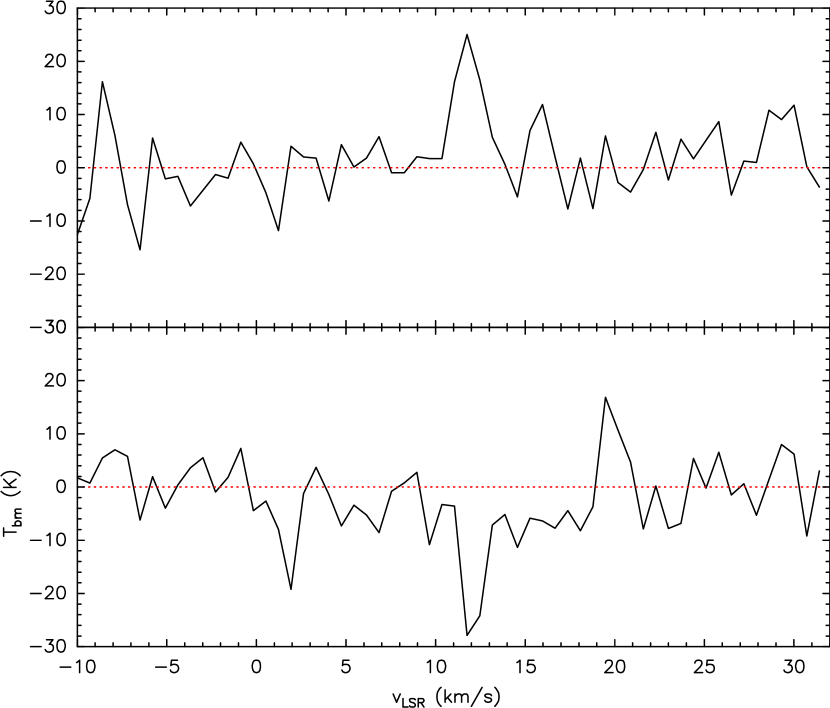
In contrast to these two sources, GGD27 MM1 shows many molecular transitions along the observed bandwidth (see Figures 2 and 3). The spectra is dominated by SO2, and SO isotopologues, as well as by CH3OH lines. Other lines detected are isotopologues of HCN, HC3N and deuterated formaldehyde. The H13CO+ 4–3 line is marginally detected in absorption towards the dust emission and in emission in an elongated structure east of the MM1 (the spectrum of these two features are shown in Fig. 4). Table 2 lists the parameters of the lines detected in MM1: line transition, frequency, line strength, energy level and integrated flux of the detected molecular transitions. The integrated flux was obtained by adding the emission for the channels where the emission is detected and over a region of arcsec2 on GGD27 MM1.
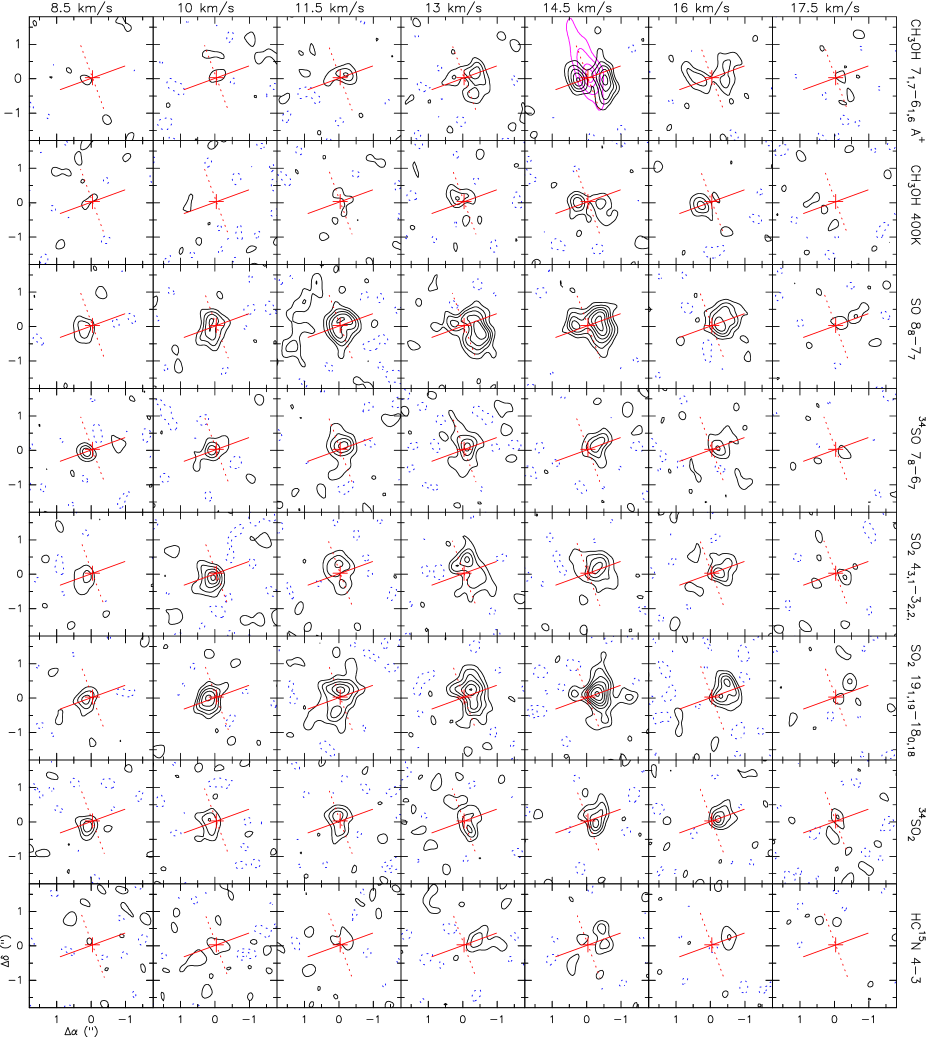
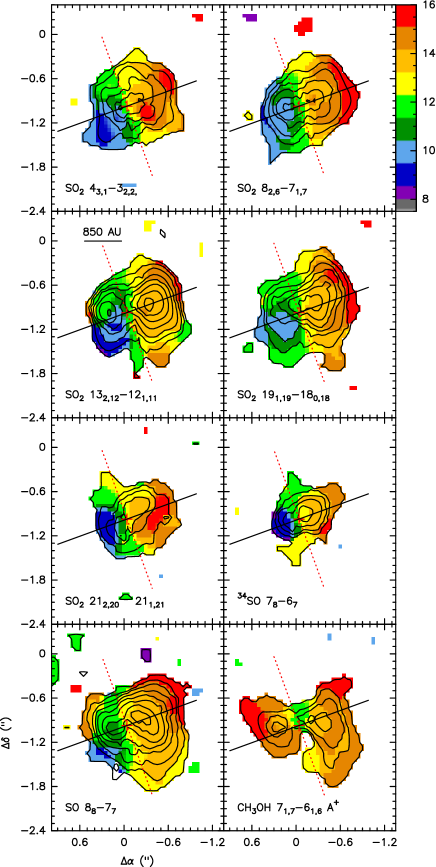
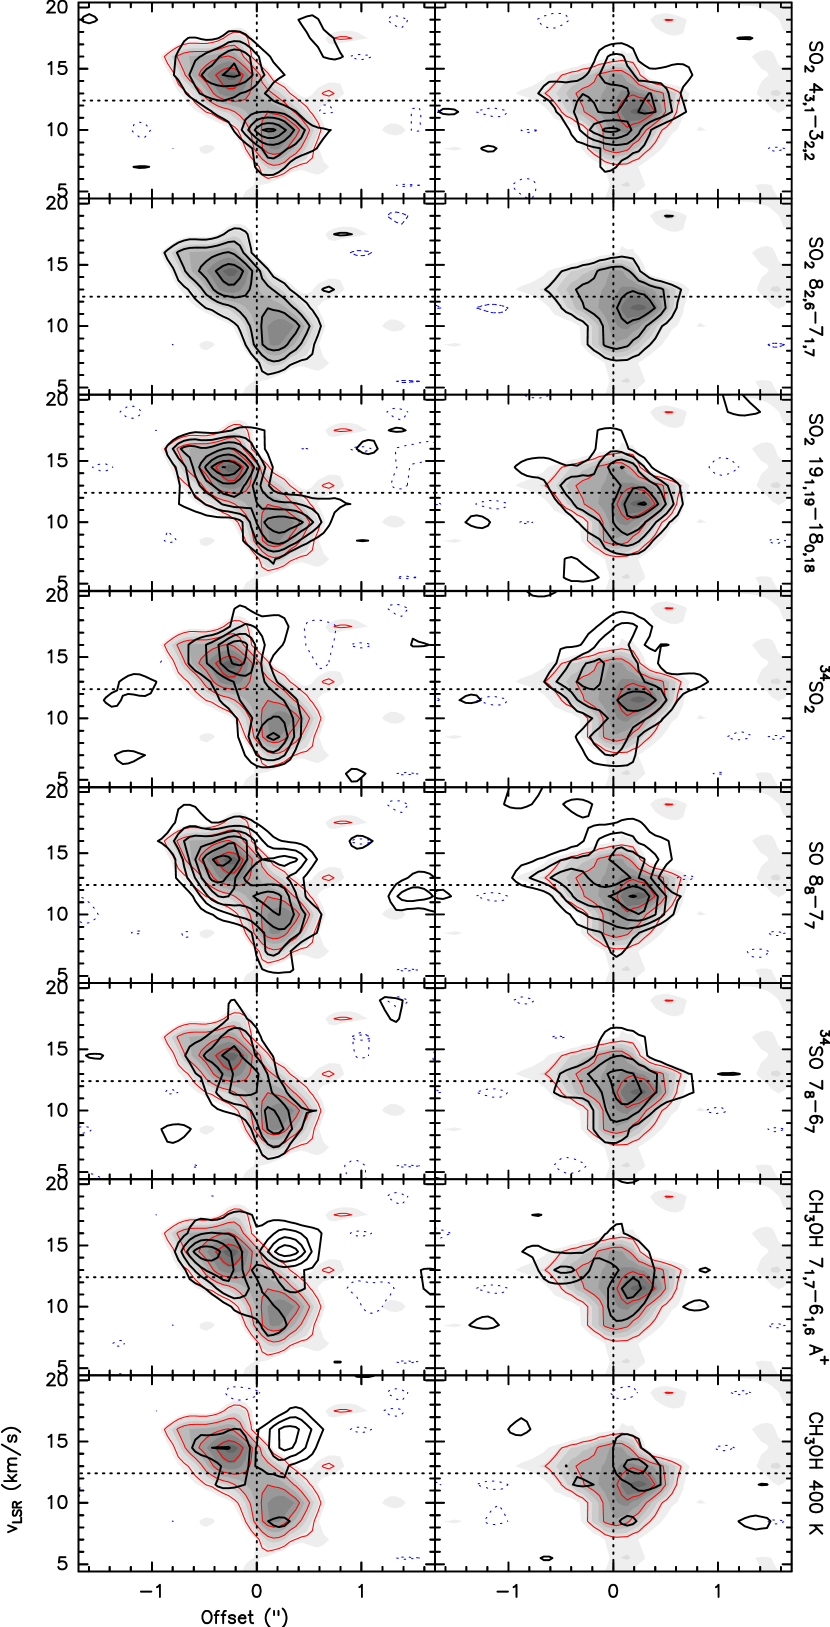
In order to better study and characterize the morphology and the kinematics of the detected molecular lines toward MM1, we present here channel maps of representative molecular lines (Fig. 3), the zero and first order moment maps (integrated emission and velocity field weighted by intensity, respectively; Fig. 5), and the position–velocity cuts along the major and minor axis of the molecular emission ( and 21°, respectively; Fig. 6) . For three high-excitation CH3OH lines (161,15-152,14, 182,16-173,14 and 191,19-182,16) and most of the detected 34SO lines (see the caption of Fig. 3 for more details), the maps were combined in order to increase their signal-to-noise ratio. The three figures show that there is a distinctive velocity gradient along the major axis of the molecular disk-like structure (blueshifted and redshifted gas to the east and west, respectively). This velocity gradient is along the major axis of the molecular emission and perpendicular to the HH 80-81-80N radio jet. These properties are more clearly seen in the SO2, 34SO2 and 34SO lines. Indeed, the first order moment maps of these lines are in agreement with those previously reported (FL11b, CG12), but the maps presented here resolve significantly better the velocity gradient. The emission along the major axis extends or 2400 AU. The position-velocity cuts along the major axis also show a clear linear velocity gradient. The different lines of the SO2 main isotopologues show the same gradient within the uncertainties. However, the combination of 34SO2 lines show a steeper gradient and more compact emission. The peak emission appears also at higher velocities. The steeper velocity gradient is also seen in the 34SO line. The position-velocity cuts along the minor axis present a broaden of the velocity range at the center for all the cases. All these features suggest that the emission traces a rotating molecular disk around the massive star, as previously suggested in FL11b and CG12.
The methanol emission appears to partially depart from the rotating disk pattern, which is clearly shown in the integrated emission and the velocity field of the CH3OH 71,7-61,6 A+ (Fig. 5). The position-velocity cut along the major axis shows that whereas part of the emission arises from the rotating disk, there is a clear redshifted knot (peaking at =16.0 km s-1) in the blueshifted side of the rotating disk (see Fig. 6). Furthermore, the central channels of the CH3OH 71,7-61,6 A+ line shows that the emission is elongated along the jet axis ( = 14.0 and 16.0 km s-1 channels in Fig. 3). This suggests that not all the methanol emission is associated with the rotating disk, so some may arise from the walls of the cavity excavated by the outflow. The SO 88-77 line seems to be tracing both features, the rotating disk and the walls of the cavity. Finally, the HC15N 4–3 line does not clearly show the velocity gradient (see Fig. 3), although this could be due to the low signal-to-noise ratio of the emission of this line.
IV. Analysis: The thin-disk model for the SO2 and SO emission
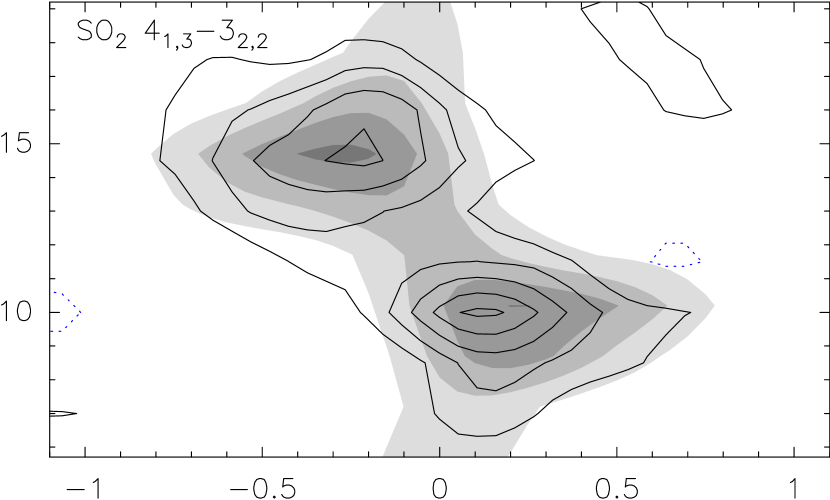
The SO2 and SO lines appear to show a clear velocity gradient along the major axis of the disk, suggestive of rotation, as observed previously at lower angular resolution (FL11b). To better constrain the kinematics of the disk, we modeled the emission with a rotating, geometrically thin disk, using the SO2 transitions 43,1-32,2, 82,6-71,7, 191,19-180,18, and 212,20-211,21; the 34SO 78-67 transition; and a sum of 34SO2 transitions for improving the signal-to-noise ratio.
| Parameter | Units | Value |
|---|---|---|
| Linewidth | (km s-1) | |
| Disk center | (arcsec) | |
| Disk center | (arcsec) | |
| Disk central | (km s-1) | |
| Rotation vel. aafootnotemark: | (km s-1) | |
| Disk inclination | (degrees) |
a At the reference radius .
| Inner Radius | Outer Radius | |
|---|---|---|
| Transition | (arcsec) | (arcsec) |
| SO2 43,1-32,2 | ||
| SO2 82,6-71,7 | ||
| SO2 191,19-180,18 | ||
| SO2 212,20-211,21 | ||
| 34SO 78-67 | ||
| 34SO2 |
The position angle of the projection of the disk axis on the plane of the sky (minor axis position angle) was fixed to , which is the position angle of the radio jet (Martí et al., 1993). The inclination of the disk, , was defined as the angle between the disk axis and the line of sight ( for a face-on disk). We considered a rotation velocity given by a power law of the radius, , where is an arbitrary reference radius () and is the rotation velocity at the reference radius. We assumed that the molecular emission arises from an area of the disk between an inner radius and an outer radius .
We computed, for each point of a regular grid on the plane of the sky, the projection of the rotation velocity of the corresponding point of the disk along the line of sight . A Gaussian line profile of width and centered on was added to the channels associated with the grid point. The intensity of the Gaussian was taken to follow a power-law dependence on the disk radius, . Finally, each channel map was convolved spatially with a Gaussian beam of width . However, the intensity scale of the channel maps is arbitrary. A scaling factor, the same for all channel maps, was obtained by minimizing the sum of the squared differences between the data channel maps and the synthetic channel maps. The model depends on a total of 11 parameters, namely the beamwidth, ; the linewidth, ; the disk center position, ; the disk systemic velocity, ; the disk inner and outer radii, and ; the radial dependence power-law index of the intensity, ; the projection of the disk rotation velocity at the reference radius, ; the radial dependence power-law index of the rotation velocity, ; and the disk inclination angle, .
Some of the parameters are known beforehand, such as , the synthesized beamwidth for every transition. Some other were taken as fixed: the rotation power-law index was taken as that of a Keplerian rotation, ; and the intensity power-law index, which takes into account the radial dependence of density and temperature, was taken as .
The fitting procedure was the sampling of the multidimensional parameter space, using the same procedure as that described in Girart et al. (2014) and Estalella (2017). The parameter space was searched for the minimum value of the rms fit residual. Once a minimum of the rms fit residual was found, the uncertainty in the parameters fitted was found as the increment of each of the parameters of the fit necessary to increase the rms fit residual a factor of , where is the number of data points fitted, is the number of parameters fitted, and is the value of for degrees of freedom (the number of free parameters) and is the significance level ( for 1- uncertainties).
The fit was performed in two steps. In a first run, the 8 free parameters (, , , , , , , and ) were fitted simultaneously for the 6 transitions. From this run we obtained the weighted average of the best fit values for the parameters that do not depend on the transition, , , , , , and (see Table 3). The value obtained for the disk inclination was . The projection of the rotation velocity at obtained is km s-1, corresponding to a deprojected rotation velocity km s-1.
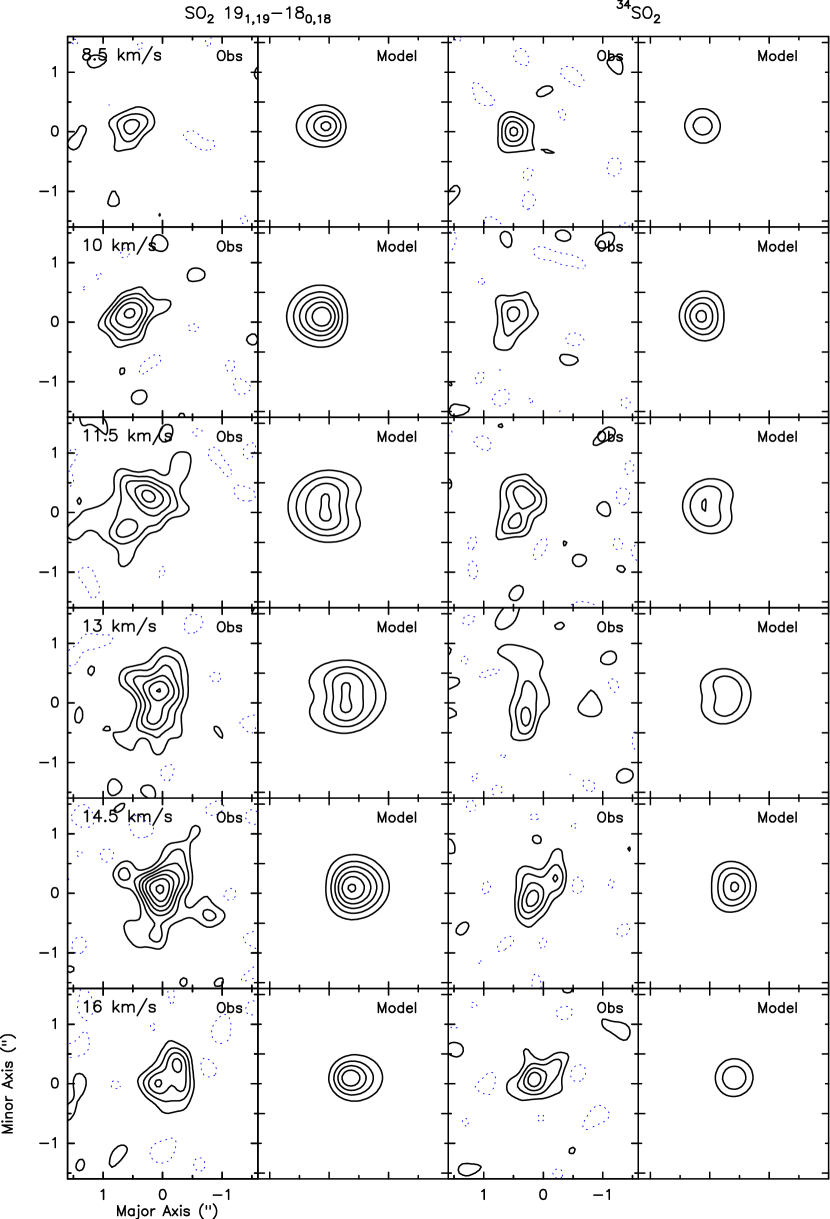
In a second run we set as constant the 8 parameters obtained from the first fit and we fitted the inner and outer radii of the disk for every transition. The results obtained are shown in Table 4. The inner radius obtained for all the transitions was . The outer radius for the SO2 transitions is while for the 34SO and 34SO2 transitions it is smaller, . Fig. 7 shows, as an example of the obtained fits, the channel maps for the SO2 43,1-32,2 and 191,19-180,18 transition data and their best fit model. Fig. 8 shows the position-velocity cut of the SO2 43,1-32,2 line and the best fit model along the major axis.
V. Discussion
V.1. Rotating disk-like structure and the stellar mass
The analysis of the velocity field derived from the SO2 and SO show that the emission is more compact in their 34S isotopologues and in the transition of the main SO2 isotopologue with the highest energy level (202,20-211,21). This is a consequence of the increase of the column density and temperature toward the center of the disk. However, the analysis of the velocity field derived from the SO2 and SO isotopologues is limited by the signal-to-noise of the data (the highest value is ). This precludes the detection of the faint gas at higher velocities, which is expected to arise closer to the protostar (according to the model, this gas has intensities below the detectability of our data). Thus, our data cannot discern whether the rotation is Keplerian. However, the dynamical mass of the system (protostar and disk) can be constrained by using two approximations. First we assume that the velocity in the whole disk is Keplerian (). Taking the obtained rotation velocity (3.4 km s-1) at the reference radius ( AU) we estimate a dynamical mass of M☉. In second place, we assume that the gas is not all in Keplerian motion but still gravitationally bound. In this case, we can still balance the gravitational and the kinetic energy of the gas at the outer edge of the disk ( AU and km s-1) to derive a dynamical mass () of M☉. With the present data we cannot discern whether the Keplerian approximation stands for all the observed gas surrounding MM1 or there is a centrifugal barrier separating a rotating infalling region (outer disk/envelope) from a Keplerian rotating region (inner disk), as found in some lower mass protostars (Sakai et al., 2014). In any case, the latter value of 8 M☉ is similar to that derived previously in (FL11b) where the virial assumption was used as well. From the dust emission at 1.36 mm, and assuming optically thin emission, the mass from the disk is M☉ (FL11a). This suggests that the stellar mass should be between 4 and 18 M☉. Therefore, the stellar mass is loosely constrain from the velocity analysis. The bolometric luminosity of this source is also not well constrained, but should be between 3300 L☉ and L☉ (FL11b). This is because there is contamination from other sources at mid to far infrared wavelengths (e.g., Aspin et al., 1991; Aspin & Geballe, 1992; Qiu et al., 2008) and, in particular, from the nearby massive MM2 (FL11b). Yet, the range of values for masses is compatible with the possible values of the bolometric luminosity because a significant fraction of the luminosity comes from accretion (Yorke & Sonnhalter, 2002; Hosokawa et al., 2010).
V.2. Chemical composition of the MM1 rotating disk-like structure
Despite of having an observed rich spectrum, MM1 has a less rich chemistry than standard hot cores. The spectrum is dominated by sulfurated molecules and the lines that more clearly trace the rotating disk are SO2 and SO isotopologues, but also H2CO (FL11b). Previous observations also show that CH3CN, OCS and HNCO are also bright in MM1 (Qiu & Zhang, 2009), but the limited angular resolution of these data prevents from confirming whether their emission arises from the rotating disk.
Girart et al. (2013) observed almost the same frequency range as the one presented here toward the DR 21(OH) massive star-forming region. The DR 21(OH) SMA 6 and SMA 7 submillimeter sources, known to be very dense hot cores, show the same lines detected in MM1. In these two hot cores there are other molecular species that show emission as bright as the 34SO2 lines, specially methyl formate (CH3OCHO), but also dimethyl ether (CH3OCH3), formic acid (HCOOH), nitrogen monosulfide (NS), methanimine (CH2NH) and ethyl cyanide (CH3CH2CN). None of these molecules are detected toward MM1. The molecular emission associated with MM1 arises from hot, 120–160 K, and very dense gas (FL11b), excluding the possibility that the difference between DR21(OH) and MM1 is due to a different excitation conditions. Thus, the lack of complex molecules in MM1 indicates a chemical differentiation with respect to the DR 21(OH) hot cores.
Recent observations toward disks around protostars show that the SO molecule is an excellent probe of the shocks generated at the position of the centrifugal barrier (Sakai et al., 2014; Oya et al., 2016). The centrifugal barrier is the transition region between the envelope and the rotationally supported disk, where most of the kinetic energy of the infalling envelope is converted into rotational energy (Sakai et al., 2014, 2016). Furthermore, chemical models predicts that not only SO but also SO2 are enhanced in shocks with moderate shock velocities (few km s-1) generated in dense molecular environments, (H2)- cm-3, (Pineau des Forets et al., 1993). Indeed, these two species are enhanced in shocks associated with molecular outflows (Bachiller & Pérez Gutiérrez, 1997; Codella et al., 2003; Podio et al., 2015).
Alternatively, the apparently sulfurated dominated chemistry of the rotating disk-like structure around MM1 could be a consequence of MM1 being more evolved than the typical massive hot molecular cores (e.g., Charnley, 1997; Minh, 2016). Indeed, a chemical study of different species found that most molecules that are abundant in the hot molecular phase have their abundances decreased in UCHII phase, but this decrease is not so significant in some sulfurated molecules such as SO and SO2 (e.g., Gerner et al., 2014). In the case of SO2, the UV photodissociation of the water, yielding OH, can enhance this molecule through the SO+OHSO2 reaction (Charnley, 1997; Tappe et al., 2008; Qiu & Zhang, 2009). In MM1, the source of UV radiation may arise from the strong shocks generated in the powerful jet (Carrasco-González et al., 2010), which would illuminate the surface of the molecular disk. A comparison between the spectral energy distribution of four massive cores without HII regions found that GGD 27 MM1 appears to be the most evolved one (Herpin et al., 2009). We speculate that the spectral features of GGD 27 MM1 indicate that this source is in the verge of forming an ultracompact (UC) HII region.
V.3. The outflow cavity walls
As noted in Section III, the spatial distribution of the CH3OH emission partially departs from the expected pattern for the rotating molecular disk. This is better seen in the first order momentum map (Fig. 5) and in the position–velocity cuts (Fig. 6). In this latter figure there is an emission feature at = 14.5 km s-1 just east of the disk center that does not follow the rotation pattern. The clump appears in the northern side of the blueshifted side of the rotating disk-like structure. This clump is also clearly seen in the SO 88-77 emission. This feature along with the overall morphology of the CH3OH, with the emission extended along the radio jet direction, suggests that the emission from CH3OH is tracing the outflow cavity walls (the outflow is probably atomic and ionized since no high velocity CO emission is detected at these scales, see Fernández-López et al., 2013). The SO emission, along with the H2CO 31,2-21,1 line emission (FL11a), appears to arise from both the rotating disk and the outflow cavity walls.
V.4. The lack of molecular emission associated with MM2 and WMC
The lack of molecular emission associated with MM2 and WMC may seem surprising, especially when they have bright 1 mm molecular emission at an angular resolution of (Qiu & Zhang, 2009). These observations showed that WMC and, in a less extent, MM2 are prominent in lines of CH3OH, CH3CN, HCO, SO, OCS and HNCO with upper energy levels of K. In contrast, none of the higher excitation lines detected in MM1 are detected in these two sources (Qiu & Zhang, 2009, FL11a). This is because of the lower temperature ( K) of these two sources. Thus, given the high volume density of MM2, cm-3, one should expect to detect the SO and CH3OH lines with similar energy levels and line strength as those detected at 1 mm, such as the CH3OH 71,7-61,6 A+ transition (see Table 2). But these are barely detected only in WMC. The rms in brightness temperature of our observation is about 4–5 K, so we are sensitive (at 3–) to line intensities of 12-15 K. This indicates that the molecular gas around these two sources is extended and, in addition, since the upper limits for the brightness temperature are significantly lower than the gas kinetic temperature, the observed molecular lines are optically thin.
The SO2 lines represent a different scenario, since they have not been detected toward WMC and MM2 at lower angular resolution and frequency (Qiu & Zhang, 2009, FL11a). In this case, Qiu & Zhang (2009) interpreted this as a chemical differentiation because of their different evolutionary stages. MM2 has a similar mass as MM1 but it has a lower average volume density because it is more extended (FL11a). This is an indication that MM2 is possibly younger, suggesting that the accreted mass to this young stellar object is still smaller or that the accretion rate is not as high as in MM1. The WMC could be a less massive object than MM1 and MM2 because of the non-detection of the dust continuum emission.
VI. Conclusions
We present subarcsecond angular resolution observations carried out with the Submillimeter Array (SMA) at 880 m toward the GGD27 system. We do not detect any polarized continuum emission and place upper limits for the polarized intensity on GGD27 MM1 () and GGD27 MM2 (). The MM1 spectrum is dominated by the presence of several sulfur-bearing species tracing the disk-like structure (SO and SO2 isotopologues mainly), but it also shows HCN-bearing and CH3OH lines. The CH3OH and SO emission is in part tracing the disk rotation, but also comes from the cavity walls of the outflow excavated by the jet. H13CO+ is seen in absorption against the MM1 continuum emission. We discuss that the abundance of sulfurated lines in the spectrum (which is not common in other massive hot cores) could indicate the presence of shocked gas at the disk’s centrifugal barrier or that MM1 is a hot core at an evolved stage.
The SMA resolution allows to clearly resolve the SO2 disk’s kinematics. MM1 shows a velocity gradient along the disk’s major axis, which is steeper for the 34SO2 and 34SO lines, since their emission is more compact than for the SO2 lines. We make a fit to the SMA observations using a thin-disk Keplerian model which fully characterize the geometry of the disk. The results of our fit give an inclination of 47, an inner radius of ( AU) and an outer radius between (950 AU) and (1300 AU), depending on the molecular tracer. We also constrain the radial velocity at a putative radius of 1700 AU in 3.4 km s-1. Using these results, the estimated protostellar dynamical mass of MM1 is 4-18 M☉.
Finally, we also detect molecular emission from the MM2 and WMC cores (MM2 is also resolved in continuum emission). They show in comparison with MM1 an almost empty spectra suggesting that they are associated with extended emission (detected in previous low-angular resolution observations), and therefore indicating the presence of a very young system (MM2), still in a very early stage of accretion, or/and the presence of a less massive object (WMC).
References
- Adams et al. (1987) Adams, F. C., Lada, C. J., & Shu, F. H. 1987, ApJ, 312, 788
- André et al. (2004) André, P., Bouwman, J., Belloche, A., & Hennebelle, P. 2004, Ap&SS, 292, 325
- Aspin et al. (1991) Aspin, C., Casali, M. M., Geballe, T. R., & McCaughrean, M. J. 1991, A&A, 252, 299
- Aspin & Geballe (1992) Aspin, C. & Geballe, T. R. 1992, A&A, 266, 219
- Baruteau et al. (2014) Baruteau, C., Crida, A., Paardekooper, S.-J., et al. 2014, Protostars and Planets VI, 667
- Bachiller & Pérez Gutiérrez (1997) Bachiller, R., & Pérez Gutiérrez, M. 1997, ApJ, 487, L93
- Beltrán & de Wit (2016) Beltrán, M. T., & de Wit, W. J. 2016, A&A Rev., 24, 6
- Brinch et al. (2007) Brinch, C., Crapsi, A., Hogerheijde, M. R., & Jørgensen, J. K. 2007, A&A, 461, 1037
- Brinch et al. (2009) Brinch, C., Jørgensen, J. K., & Hogerheijde, M. R. 2009, A&A, 502, 199
- Burrows et al. (1996) Burrows, C. J., Stapelfeldt, K. R., Watson, A. M., et al. 1996, ApJ, 473, 437
- Butner et al. (1991) Butner, H. M., Evans, II, N. J., Lester, D. F., Levreault, R. M., & Strom, S. E. 1991, ApJ, 376, 636
- Carrasco-González et al. (2010) Carrasco-González, C., Rodríguez, L. F., Anglada, G., Martí, J., Torrelles, J. M., & Osorio, M. 2010, Science, 330, 1209
- Carrasco-González et al. (2012) Carrasco-González, C., Galván-Madrid, R., Anglada, G., et al. 2012, ApJ, 752, L29 (CG12)
- Cesaroni et al. (2005) Cesaroni, R., Neri, R., Olmi, L., et al. 2005, A&A, 434, 1039
- Charnley (1997) Charnley, S. B. 1997, ApJ, 481, 396
- Codella et al. (2003) Codella, C., Bachiller, R., Benedettini, M., & Caselli, P. 2003, MNRAS, 341, 707
- Estalella (2017) Estalella, R. 2017, PASP, 129, 025003
- Fernández-López et al. (2011b) Fernández-López, M., Curiel, S., Girart, J. M., et al. 2011, AJ, 141, 72 (FL11b)
- Fernández-López et al. (2011a) Fernández-López, M., Girart, J. M., Curiel, S., et al. 2011, AJ, 142, 97 (FL11a)
- Fernández-López et al. (2013) Fernández-López, M., Girart, J. M., Curiel, S., et al. 2013, ApJ, 778, 72 (FL13)
- Franco-Hernández et al. (2009) Franco-Hernández, R., Moran, J. M., Rodríguez, L. F., & Garay, G. 2009, ApJ, 701, 974
- Frank et al. (2014) Frank, A., Ray, T. P., Cabrit, S., et al. 2014, Protostars and Planets VI, 451
- Gerner et al. (2014) Gerner, T., Beuther, H., Semenov, D., et al. 2014, A&A, 563, A97
- Girart et al. (2009) Girart, J. M., Beltrán, M. T., Zhang, Q., Rao, R., & Estalella, R. 2009, Science, 324, 1408
- Girart et al. (1999) Girart, J. M., Crutcher, R. M., & Rao, R. 1999, ApJ, 525, L109
- Girart et al. (2014) Girart, J. M., Estalella, R., Palau, A., Torrelles, J. M., & Rao, R. 2014, ApJ, 780, L11
- Girart et al. (2013) Girart, J. M., Frau, P., Zhang, Q., Koch, P. M., Qiu, K., et al. 2013, ApJ, 772, 69
- Girart et al. (2006) Girart, J. M., Rao, R., & Marrone, D. P. 2006, Science, 313, 812
- Gomez et al. (1995) Gomez, Y., Rodriguez, L. F., & Marti, J. 1995, ApJ, 453, 268
- Gómez et al. (2003) Gómez, Y., Rodríguez, L. F., Girart, J. M., Garay, G., & Martí, J. 2003, ApJ, 597, 414
- Guilloteau & Dutrey (1998) Guilloteau, S., & Dutrey, A. 1998, A&A, 339, 467
- Guilloteau et al. (1999) Guilloteau, S., Dutrey, A., & Simon, M. 1999, A&A, 348, 570
- Gyulbudaghian et al. (1978) Gyulbudaghian, A.L., Glushkov, Y.I., Denisyuk, E.K. 1978, ApJ, 224, L137
- Harsono et al. (2014) Harsono, D., Jørgensen, J. K., van Dishoeck, E. F., et al. 2014,A&A, 562, A77
- Herpin et al. (2009) Herpin, F., Marseille, M., Wakelam, V., Bontemps, S., & Lis, D. C. 2009, A&A, 504, 853
- Hosokawa et al. (2010) Hosokawa, T., Yorke, H. W., & Omukai, K. 2010, ApJ, 721, 478
- Hughes et al. (2013) Hughes, A. M., Hull, C. L. H., Wilner, D. J., & Plambeck, R. L. 2013, AJ, 145, 115
- Hull et al. (2014) Hull, C. L. H., Plambeck, R. L., Kwon, W., et al. 2014, ApJS, 213, 13
- Ilee et al. (2016) Ilee, J. D., Cyganowski, C. J., Nazari, P., et al. 2016, MNRAS, 462, 4386
- Johnston et al. (2015) Johnston, K. G., Robitaille, T. P., Beuther, H., et al. 2015, ApJ, 813, L19
- Lai et al. (2003) Lai, S.-P., Girart, J. M., & Crutcher, R. M. 2003, ApJ, 598, 392
- Helled et al. (2014) Helled, R., Bodenheimer, P., Podolak, M., et al. 2014, Protostars and Planets VI, 643
- Hogerheijde et al. (1998) Hogerheijde, M. R., van Dishoeck, E. F., Blake, G. A., & van Langevelde, H. J. 1998, ApJ, 502, 315
- Jørgensen et al. (2009) Jørgensen, J. K., van Dishoeck, E. F., Visser, R., et al. 2009, A&A, 507, 861
- Kataoka et al. (2016) Kataoka, A., Tsukagoshi, T., Momose, M., et al. 2016, ApJ, 831, L12
- Lommen et al. (2008) Lommen, D., Jørgensen, J. K., van Dishoeck, E. F., & Crapsi, A. 2008, A&A, 481, 141
- Marrone et al. (2006) Marrone, D. P., Moran, J. M., Zhao, J.-H., & Rao, R. 2006, ApJ, 640, 308
- Marrone & Rao (2008) Marrone, D. P., & Rao, R. 2008, Proc. SPIE, 7020
- Martí et al. (1993) Martí, J., Rodríguez, L. F., & Reipurth, B. 1993, ApJ, 416, 208
- Martí et al. (1995) —.1995, ApJ, 449, 184
- Martí et al. (1998) —. 1998, ApJ, 502, 337
- Masqué et al. (2012) Masqué, J. M., Girart, J. M., Estalella, R., Rodríguez, L. F., & Beltrán, M. T. 2012, ApJ, 758, L10
- Masqué et al. (2015) Masqué, J. M., Rodríguez, L. F., Araudo, A., et al. 2015, ApJ, 814, 44
- Minh (2016) Minh, Y. C. 2016, Journal of Physics Conference Series, 728, 052007
- Murillo & Lai (2013) Murillo, N. M., & Lai, S.-P. 2013, ApJ, 764, L15
- O’dell & Wen (1994) O’dell, C. R., & Wen, Z. 1994, ApJ, 436, 194
- O’dell et al. (1993) O’dell, C. R., Wen, Z., & Hu, X. 1993, ApJ, 410, 696
- Oya et al. (2016) Oya, Y., Sakai, N., López-Sepulcre, A. et al. 2016, ApJ, 824, 88
- Patel et al. (2005) Patel, N. A., Curiel, S., Sridharan, T. K., et al. 2005, Nature, 437, 109
- Piétu et al. (2014) Piétu, V., Guilloteau, S., Di Folco, E., Dutrey, A., & Boehler, Y. 2014, A&A, 564, A95
- Pineau des Forets et al. (1993) Pineau des Forets, G., Roueff, E., Schilke, P., & Flower, D. R. 1993, MNRAS, 262, 915
- Podio et al. (2015) Podio, L., Codella, C., Gueth, F., et al. 2015, A&A, 581, A85
- Qiu et al. (2008) Qiu, K., Zhang, Q., Megeath, S. T., et al. 2008, ApJ, 685, 1005
- Qiu & Zhang (2009) Qiu, K., & Zhang, Q. 2009, ApJ, 702, L66
- Rao et al. (2014) Rao, R., Girart, J. M., Lai, S.-P., & Marrone, D. P. 2014, ApJ, 780, L6
- Sakai et al. (2014) Sakai, N., Sakai, T., Hirota, T., et al. 2014, Nature, 507, 78
- Sakai et al. (2016) Sakai, N., Oya, Y., López-Sepulcre, A., et al. 2016, ApJ, 820, L34
- Sanchez-Monge et al. (2013) Sánchez-Monge, Á., Cesaroni, R., Beltrán, M. T., et al. 2013, A&A, 552, L10
- Schaefer et al. (2009) Schaefer, G. H., Dutrey, A., Guilloteau, S., Simon, M., & White, R. J. 2009, ApJ, 701, 698
- Segura-Cox et al. (2016) Segura-Cox, D. M., Harris, R. J., Tobin, J. J., et al. 2016, ApJ, 817, L14
- Shu et al. (1987) Shu, F. H., Adams, F. C., & Lizano, S. 1987, ARA&A, 25, 23
- Stecklum et al. (1997) Stecklum, B., Feldt, M., Richichi, A., Calamai, G., & Lagage, P. O. 1997, ApJ, 479, 339
- Stephens et al. (2014) Stephens, I. W., Looney, L. W., Kwon, W., et al. 2014, Nature, 514, 597
- Takakuwa et al. (2012) Takakuwa, S., Saito, M., Lim, J., et al. 2012,ApJ, 754, 52
- Takakuwa et al. (2007) Takakuwa, S., Ohashi, N., Bourke, T. L., et al. 2007,ApJ, 662, 431
- Tappe et al. (2008) Tappe, A., Lada, C. J., Black, J. H., & Muench, A. A. 2008, ApJ, 680, L117
- Tobin et al. (2012) Tobin, J. J., Hartmann, L., Chiang, H.-F., et al. 2012, Nature, 492, 83
- Tobin et al. (2013) Tobin, J. J., Chandler, C. J., Wilner, D. J., et al. 2013, ApJ, 779, 93
- Wang et al. (2012) Wang, K.-S., van der Tak, F. F. S., & Hogerheijde, M. R. 2012,A&A, 543, A22
- Wright & Sault (1993) Wright, M. C. H., & Sault, R. J. 1993, ApJ, 402, 546
- Yorke & Sonnhalter (2002) Yorke, H. W., & Sonnhalter, C. 2002, ApJ, 569, 846
- Zhang et al. (2014) Zhang, Q., Qiu, K., Girart, J. M., et al. 2014, ApJ, 792, 116