1\Yearpublication2014\Yearsubmission2014\Month0\Volume999\Issue0\DOIasna.201400000
XXXX
Stringent limits on the masses of the supermassive black holes in seven nearby galaxies ††thanks: Based on observations with the Hubble Space Telescope (HST) obtained at Space Telescope Science Institute (STScI), which is operated by the Association of Universities for Research in Astronomy (AURA), Inc., under National Aeronautics and Space Administration (NASA) contract NAS5-26555.
Abstract
We present new stringent limits on the mass of the central supermassive black hole for a sample of 7 nearby galaxies. Our estimates are based on the dynamical modeling of the central width of the nebular emission lines measured over subarcsecond apertures with the Hubble Space Telescope. The central stellar velocity dispersion of the sample galaxies is derived from new long-slit spectra from ground-based observations and the bulge effective radius is obtained from a two-dimensional photometric decomposition of the -band images from the Sloan Digital Sky Survey. The derived stringent limits run parallel and above the relation with no systematic trend depending on the galaxy distance or morphology. This gives further support to previous findings suggesting that the nuclear gravitational potential is remarkably well traced by the width of the nebular lines when the gas is centrally peaked. With our investigation, the number of galaxies with stringent limits obtained from nebular-line width increases to 114 and can be used for studying the scaling relations between and properties of their host galaxies.
keywords:
black hole physics – galaxies: kinematics and dynamics – galaxies: nuclei – galaxies: photometry1 Introduction
Over nearly three decades of measurements for the mass of central supermassive black holes (SBHs) have led to the conclusion that such objects should be nearly always present at the center of elliptical galaxies and bulges of disk galaxies (see Kormendy & Ho 2013, for a review). Furthermore, the finding that correlates with several properties of their host galaxies, and in particular with the velocity dispersion of their spheroidal component (Gebhardt et al. 2000; Ferrarese & Merritt 2000), suggests that somehow SBHs and spheroids grew together (see Saglia et al. 2016). These mutual relationships between the black holes and their host galaxies could come from feedback mechanisms (see Silk & Rees 1998; Fabian 1999). Large samples across different morphological types are needed to fully understand the underlying process behind the relation, as clues may be present not only in the slope of this relation but also in its scatter, the behavior of outliers, and secondary trends related for instance to galaxy morphology (Beifiori et al. 2012; McConnell & Ma 2013; Shankar et al. 2016).
For this purpose Beifiori et al. (2009, 2012) used archival Hubble Space Telescope (HST) spectroscopic data obtained with the Space Telescope Imaging Spectrograph (STIS) to estimate stringent limits on for 107 galaxies of various Hubble types, following the approach of Sarzi et al. (2002) to model the velocity dispersion of ionized-gas emission observed at sub-arcsecond scales. The sample of Beifiori et al. (2009) included an additional 21 objects with STIS data, but those were excluded since they missed a ground-based measurement and thus could not be placed on the relation. In this paper, we aim at increasing the sample of galaxies with stringent limits, by selecting 7 Northern galaxies () with detected emission lines in STIS spectra from the objects excluded by Beifiori et al. (2009) and observing them with the Asiago Astrophysical Observatory in order to derive their central .
| Galaxy | Mor. T. | Bar | Sp. Cl. | [] | [] | ||||
|---|---|---|---|---|---|---|---|---|---|
| [Mpc] | [mag] | [] | [] | [] | [] | ||||
| (1) | (2) | (3) | (4) | (5) | (6) | (7) | (8) | (9) | (10) |
| NGC 2654 | SBab: sp | yes | - | 19.4 | 1.9e7 | 4.2e6 | |||
| NGC 3049 | SB(rs)ab | yes | H | 23.9 | 4.3e6 | 1.2e6 | |||
| NGC 3259 | SAB(rs)bc: | no | S1 | 24.0 | 3.6e6 | 1.0e6 | |||
| NGC 4343 | SA(rs)b: | no | - | 18.1 | 6.4e7 | 5.1e7 | |||
| NGC 5141 | S0 | - | - | 72.4 | 6.3e8 | 2.0e8 | |||
| NGC 5635 | S pec | no | - | 60.1 | 1.1e9 | 2.9e8 | |||
| NGC 5713 | SAB(rs)bc pec | yes | H | 28.3 | 3.4e7 | 1.4e7 |
Notes. Col.(1): galaxy name. Col.(2): morphological type from de Vaucouleurs et al. (1991, RC3). Col.(3): presence of the bar according to the photometric decomposition. We inferred the presence of a bar in the edge-on galaxy NGC 2654 from its boxy/peanut bulge. NGC 5141 turned out to be an elliptical galaxy. Col.(4): nuclear spectral class from NED, where H = HII nucleus, L = LINER, S1 = Seyfert of type 1. Col.(5): distance. The distances were obtained as , where is the weighted mean recessional velocity corrected to the reference frame of the microwave background radiation given in RC3 and adopting . Col.(6): absolute total corrected magnitude obtained from (RC3) and adopted distance. Col.(7): stellar velocity dispersion within from this paper. Col.(8): stellar effective velocity dispersion within circularized from the aperture correction from Falcón-Barroso et al. (2017). Col.(9): stringent limit assuming for the gas disk from this paper. Col.(10): stringent limit assuming for the gas disk from this paper.
The paper is organized as follows. We derive the bulge effective radius from the analysis of broad-band imaging in Section 2. We measure the central stellar velocity dispersion from ground-based spectroscopy and apply the aperture correction to in Section 3. We obtain the distribution and central velocity dispersion of the ionized gas from HST spectroscopy in Section 4. We estimate the stringent limit from gas dynamics in Section 5. Finally, we discuss our results in the framework of the relation in Section 6. In this work we adopt , , and as cosmological parameters.
2 Surface-brightness distribution
2.1 Sloan Digital Sky Survey imaging
We retrieved the flux-calibrated -band images of the sample galaxies from the Data Release 12 of the Sloan Digital Sky Survey (SDSS-DR12, Alam et al. 2015).
We measured the sky level to be subtracted from the image of each sample galaxy, as done in Morelli et al. (2016). We masked the stars, galaxies, and spurious sources in the galaxy neighborhoods and measured its surface brightness radial profile with the ELLIPSE task in IRAF111Image Reduction and Analysis Facility is distributed by the National Optical Astronomy Observatory (NOAO), which is operated by the AURA, Inc., under cooperative agreement with the National Science Foundation.. First, we fitted the galaxy isophotes with ellipses having the center, ellipticity, and position angle free to vary. Then, we repeated the isophotal fit fixing the center we previously obtained for the inner ellipses and the ellipticity and position angle of the outer ones. We calculated the sky level by averaging the surface brightness measured at large radii, where there is no light contribution from the galaxy. We used the IRAF task IMEXAMINE to measure the standard deviation of the background in the sky-subtracted images and to fit the stars of the field of view with a circular Moffat profile (Moffat 1969), which we adopted to model the point spread function (PSF). Finally, we trimmed the sky-subtracted images to reduce the computing time required to perform a reliable photometric decomposition and we ran ELLIPSE on the trimmed images to derive the radial profiles of surface brightness, ellipticity, and position angle. They were used as an input to get the starting guesses of the galaxy structural parameters for the two-dimensional photometric decomposition.
2.2 Photometric decomposition
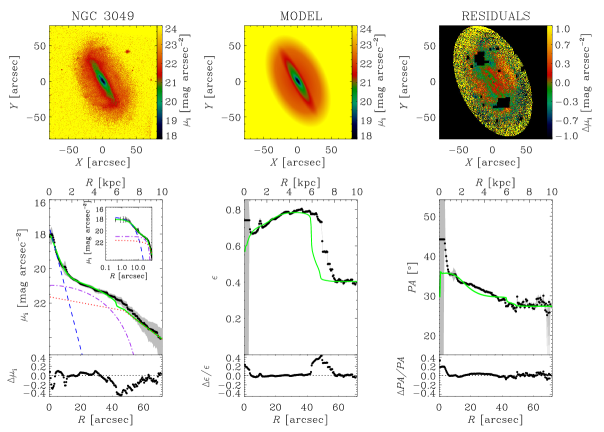
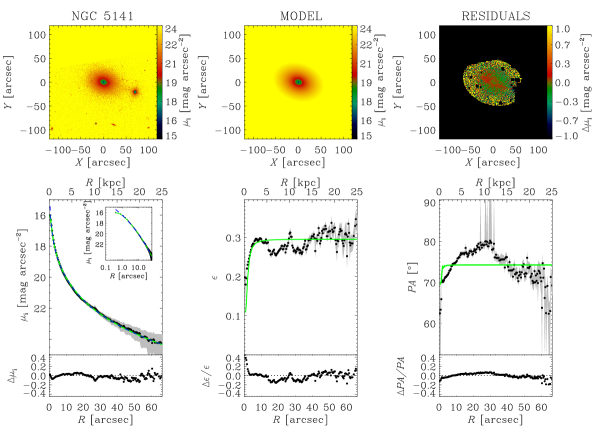
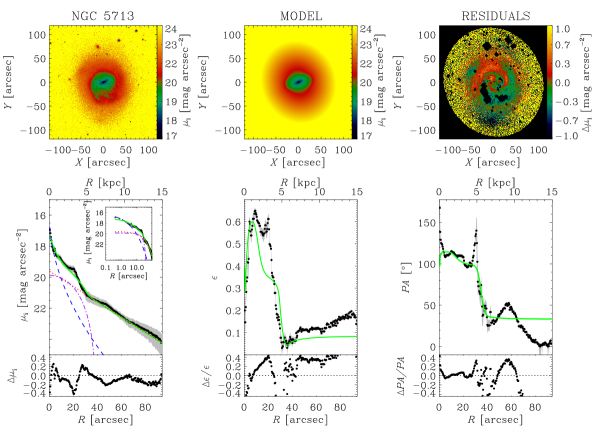
To measure the effective radius of the bulge, we performed the two-dimensional photometric decomposition of the SDSS images of the sample galaxies by using the Galaxy Surface Photometry 2-Dimensional Decomposition algorithm (GASP2D, Méndez-Abreu et al. 2008, 2014).
GASP2D performs a two-dimensional parametric photometric decomposition assuming that the observed surface brightness of the galaxy in each image pixel is expressed as the sum of analytical functions describing the light contribution of the structural components. We modeled (1) the surface brightness of the bulge with a Sérsic law (Sérsic 1968)
| (1) |
where is the effective radius, is the surface brightness at , is the shape parameter of the surface brightness profile, and (Caon et al. 1993) is a normalization coefficient; (2) the surface brightness of the disk either with a single exponential law (Freeman 1970)
| (2) |
where is the central surface brightness and is the scalelength, or with a double-exponential law (van der Kruit 1979)
| (3) |
where is the central surface brightness, is the break radius at which the slope change occurs, and are the scalelengths of the inner and outer exponential profiles, respectively; (3) the surface brightness of the bar with a Ferrers law (Ferrers 1877; Aguerri et al. 2009)
| (4) |
where is the central surface brightness and is the bar length. We assumed the isophotes of the bulge, disk, and bar to be elliptical, centered onto the galaxy center, and with constant position angle , , and and constant axial ratio , , and , respectively. We did not considered other components, such as rings, lenses, ovals, or spiral arms.
| Parameter | NGC 3049 | NGC 3259 | NGC 5141 | NGC 5713 |
|---|---|---|---|---|
| (1) | (2) | (3) | (4) | (5) |
| [mag arcsec-2] | ||||
| [] | ||||
| [∘] | ||||
| [mag arcsec-2] | - | |||
| [] | - | |||
| [] | - | - | - | |
| [] | - | - | - | |
| - | ||||
| [∘] | - | |||
| [mag arcsec-2] | - | - | ||
| [] | - | - | ||
| - | - | |||
| [∘] | - | - | ||
| 0.11 | 0.03 | 1.00 | 0.08 | |
| 0.71 | 0.97 | - | 0.76 | |
| 0.18 | - | - | 0.16 |
Notes. , , and are the bulge-to-total, disk-to-total, and bar-to-total luminosity ratio, respectively.
GASP2D returns the best-fitting values of the structural parameters of the bulge (, , , , ), disk (, , , , , ), and bar (, , , ) with a minimization by weighting the surface brightness of the image pixels according to the variance of the total observed photon counts due to the contribution of both galaxy and sky. It accounts as well for photon noise, CCD gain and read-out noise, and image PSF. We derived the errors on the structural parameters by analyzing a sample of mock galaxies generated with Monte Carlo simulations, as done by Costantin et al. (2017).
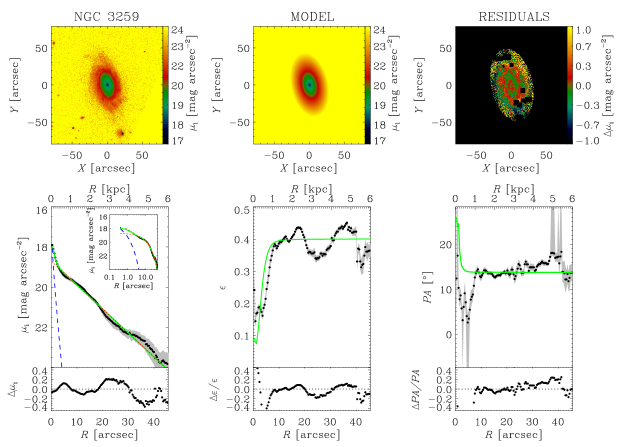
We successfully performed the photometric decomposition of all the sample galaxies, except for NGC 2654, NGC 4343, and NGC 5635. For the barred galaxy NGC 3049, we adopted the double-exponential disk to fit the slope change measured in the surface brightness distribution at about 50 arcsec. We fitted NGC 3259 with a Sérsic bulge and an exponential disk, although it is classified as a weakly barred galaxy. Indeed, an accurate inspection of the image shows that what it looks like a bar is actually an artifact resulting from the tightly wound spiral arms. NGC 5141 is classified as a lenticular galaxy, but we successfully fitted its surface brightness with a single Sérsic component. The best-fitting model was chosen by applying the Bayesian information criterion (Schwarz 1978) as done in Méndez-Abreu et al. (2017a, b) to discriminate between ellipticals and lenticulars. Therefore, the best-fitting value of refers to the entire galaxy. The prominent spiral arms of NGC 5713 produce the abrupt changes in surface brightness, ellipticity, and position angles measured at about 30 arcsec. We included the bar component in the fit in order to not overestimate the bulge contribution. We show in Fig. 1 the photometric decomposition of NGC 3259 as an example and report the results for the sample galaxies we analyzed in Table 2. We present in Fig. 1 the photometric decompositions of the remaining sample galaxies.
The GASP2D photometric decomposition of the -band SDSS image of NGC 5635 was performed by Méndez-Abreu et al. (2017a) and we took for the bulge their best-fitting value of arcsec.
NGC 2654 and NGC 4343 are two nearly edge-on galaxies. This prevented us from performing the photometric decomposition with GASP2D, which is best designed for galaxies with low-to-intermediate inclination (see Méndez-Abreu et al. 2008, for a discussion). We adopted the bulge obtained by Salo et al. (2015, NGC 2654: arcsec, NGC 4343: arcsec) from the analysis of the infrared images of the Spitzer Survey of Stellar Structure in Galaxies (S4G, Sheth et al. 2010).
3 Stellar kinematics
3.1 Ground-based spectroscopy
We performed the spectroscopic observations of the sample galaxies from 2016 January 4 to May 5 with the 1.22-m Galileo telescope (T122) at the Asiago Astrophysical Observatory (Italy). We used the Boller & Chivens spectrograph (B&C) and the grating with 1200 grooves mm-1 in combination with a 2 arcsec 7.75 arcmin slit and the Andor iDus DU440 CCD composed by pixels of 26 m 26 m each. The CCD gain and readout noise rms were 0.97 ADU-1 and 3.4 , respectively. The spectra were characterized by a wavelength range between about – with a reciprocal dispersion of 0.60 and a spatial scale of 1.0 arcsec pixel-1. We estimated the instrumental resolution as the mean of the Gaussian FWHMs measured for the unblended emission lines of a wavelength-calibrated comparison spectrum. We found corresponding to at 5100 . During the observing nights, we measured a seeing – arcsec by fitting the guiding star with a circular Gaussian function.
| Galaxy | Exp. T. | Apert. | |||
|---|---|---|---|---|---|
| [∘] | [h] | [arcsec] | [pc] | [] | |
| (1) | (2) | (3) | (4) | (5) | (6) |
| NGC 2654 | 63 | 3.0 | |||
| NGC 3049 | 25 | 5.0 | |||
| NGC 3259 | 20 | 3.5 | |||
| NGC 4343 | 133 | 3.0 | |||
| NGC 5141 | 80 | 3.0 | |||
| NGC 5635 | 65 | 3.5 | |||
| NGC 5713 | 10 | 3.0 | |||
Notes. Col.(1): galaxy name. Col.(2): position angle of the slit along the galaxy major axis as given by RC3. Col.(3): total exposure time. Col.(4): size of the central aperture where we measured the stellar velocity dispersion. Col.(5): physical size of the central aperture where we measured the stellar velocity dispersion. Col.(6): central stellar velocity dispersion.
We observed all the sample galaxies by centering their nucleus into the slit which we aligned along the galaxy major axis according to the position angle tabulated in Table 3. We splitted the total integration time into single exposures of 1800 s each for a better rejection of cosmic ray events. At the beginning of each exposure, we moved the slit of 10 arcsec along the galaxy major axis in order to avoid that bad pixels occurred in the same CCD position. During each night, we observed some spectrophotometric standard stars from the list of Hamuy et al. (1992, 1994) to successfully perform the flux calibration. Finally, we obtained a comparison spectrum of the available HeFeAr arc lamp before and after each object exposure to ensure an accurate wavelength calibration. The total exposure time of the T122 spectra is reported in Table 3.
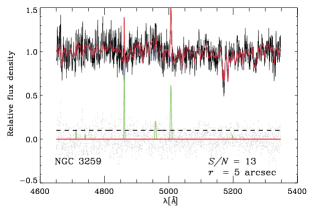
We reduced the T122 spectra using standard tasks in IRAF, as done in Corsini et al. (2017). The reduction steps included the subtraction of bias, correction for internal and sky flat-field, trimming of the spectra, removal of bad pixels and cosmic rays, correction for CCD misalignment, subtraction of the sky contribution, wavelength and flux calibration, alignment, and combination of the spectra obtained for the same galaxy. The combined T122 spectrum of NGC 3259 is given in Fig. 2. The T122 spectra of the remaining sample galaxies are presented in Fig. 2.
3.2 Absorption-line fitting
To measure the central stellar velocity dispersion, we analyzed the absorption lines in the combined T122 spectra of the sample galaxies with the Penalized Pixel Fitting (pPXF, Cappellari & Emsellem 2004) and Gas and Absorption Line Fitting (GANDALF, Sarzi et al. 2006) algorithms.
For each galaxy, we rebinned the combined spectrum along the dispersion direction to a logarithmic scale and we deredshifted it to rest frame. Then, we averaged the rebinned spectrum along the spatial direction either to cover a nearly square aperture (Table 3) or to have a signal-to-noise ratio per resolution element. We convolved a linear combination of stellar spectra from the ELODIE library at medium resolution ( , Prugniel & Soubiran 2001) with a Gauss-Hermite line-of-sight velocity distribution (LOSVD, Gerhard 1993; van der Marel & Franx 1993) to fit the summed spectrum by a minimization in pixel space. We selected 229 stellar spectra to fully cover the ELODIE parameter space of the effective temperature, surface gravity, and metallicity. They were broadened to match the T122 instrumental resolution, logarithmically rebinned, and cropped along the dispersion direction in order to match the wavelength range of each galaxy spectrum.
In addition, we simultaneously fitted all the ionized-gas emission lines in the covered wavelength range. We also added a fourth-order multiplicative Legendre polynomial to correct for reddening and large-scale residuals of flat-fielding. We excluded from the fitting procedure the wavelength ranges with a spurious signal coming from imperfect subtraction of cosmic rays and sky emission lines.
First, we obtained the best-fitting values of the LOS velocity , velocity dispersion , and Gauss-Hermite coefficients and of the stellar component. The fitting procedure returned the value of corrected for instrumental resolution. After checking that within the errors, we fitted again the galaxy spectra adopting a Gaussian LOSVD to measure (Table 3). We assumed its error to be the formal error of the best fit after evaluating to achieve , where , , and are the number of the degrees of freedom, data points, and fitting parameters, respectively (Press et al. 1992). The best-fitting model of the T122 spectrum of NGC 3259 is displayed in Fig. 2. Finally, for full consistency with Beifiori et al. (2009, 2012) we applied the aperture correction of Jrgensen et al. (1995) to obtain the stellar velocity dispersion , that would have been measured within a circular aperture of radius (Table 1).
4 Ionized-gas distribution and kinematics
4.1 Hubble Space Telescope spectroscopy
| Galaxy | Prop. Id. | Exp. T. | Sp. Range | Slit | Bin. | Apert. | |||
|---|---|---|---|---|---|---|---|---|---|
| [∘] | [h] | [] | [arcsec] | [arcsec] | [pc] | [] | |||
| (1) | (2) | (3) | (4) | (5) | (6) | (7) | (8) | (9) | (10) |
| NGC 2654 | 9046 | 62.0 | 1.25 | – | 0.1 | ||||
| NGC 3049 | 7513 | 42.1 | 0.27 | – | 0.1 | ||||
| NGC 3259 | 8228 | 20.1 | 0.24 | – | 0.2 | ||||
| NGC 4343 | 9068 | 144.1 | 0.81 | – | 0.2 | ||||
| NGC 5141 | 8236 | 72.3 | 0.36 | – | 0.2 | ||||
| NGC 5635 | 7354 | 63.6 | 0.13 | – | 0.1 | ||||
| NGC 5713 | 8228 | 10.1 | 0.20 | – | 0.2 | ||||
Notes. Col.(1): galaxy name. Col.(2): HST proposal number. Col.(3): position angle of the slit. Col.(4): total exposure time. Col.(5): spectral range. Col.(6): size of the slit. Col.(7): pixel binning. Col.(8): size of the central aperture where the gas velocity dispersion was measured. Col.(9): physical size of the central aperture where the gas velocity dispersion was measured. Col.(10): central gas velocity dispersion.
From the Hubble Data Archive, we retrieved the STIS spectra of the sample galaxies obtained with the G750M grating through either the arcsec2 or the arcsec2 slit placed across the galaxy nucleus at position angle close to the galaxy major axis. The detector was a SITe CCD with pixel of m2. The spectra covered a wavelength range of either – or – , depending on the tilt angle of the grating. The reciprocal dispersion was 0.554 and 1.108 for the 1-pixel and 2-pixel binning read-out mode along the dispersion direction, respectively. This setup yielded an instrumental FWHM of 0.87 ( ) in the case of a 0.1 arcsec-wide slit and 1.6 ( ) for the 0.2 arcsec-wide slit (Sarzi et al. 2002; Beifiori et al. 2009). The spatial scale was 0.0507 arcsec and 0.101 arcsec pixel-1 for the 1-pixel and 2-pixel binning read-out mode along the spatial direction, respectively. The HST proposal number, slit width and position angle, pixel binning, wavelength range, and total exposure times of the HST spectra of the sample galaxies are reported in Table 4.
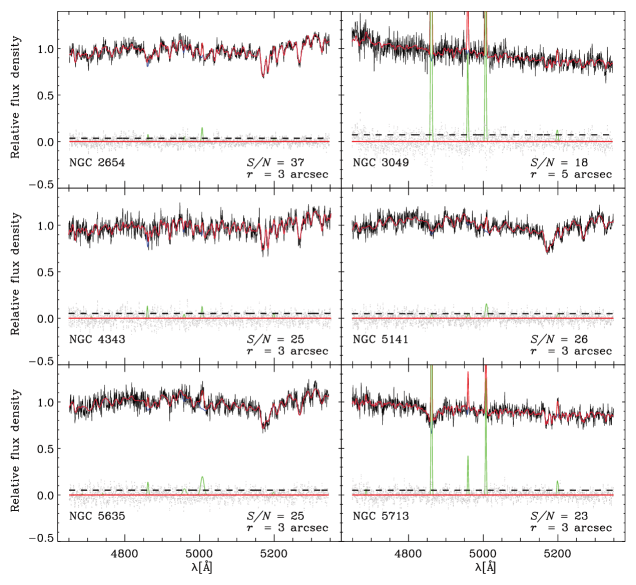
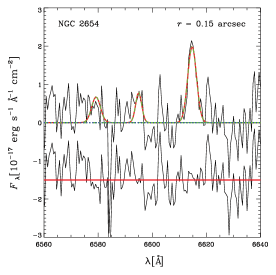
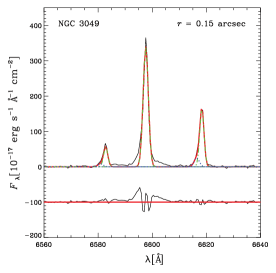
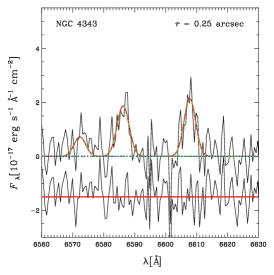
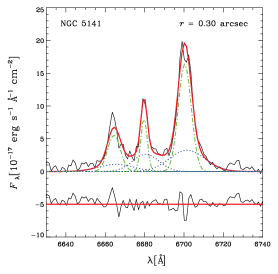
We reduced the HST spectra using IRAF tasks, as done in Beifiori et al. (2009). The reduction steps included the subtraction of the overscan, bias and dark contributions, correction for internal flat-field, trimming of the spectra, removal of bad pixels and cosmic rays, wavelength and flux calibration, correction for geometrical distortion, alignment and combination of the spectra obtained for the same galaxy. The combined HST spectrum of NGC 3259 is shown in Fig. 3. We present in Fig. 3 the HST spectra of the remaining sample galaxies.
4.2 Emission-line fitting
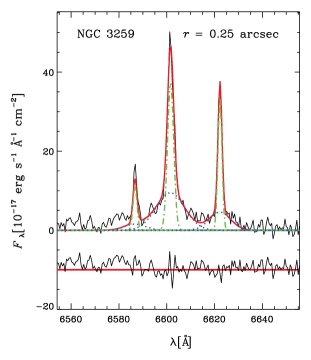
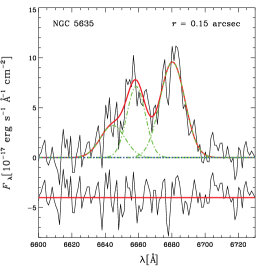
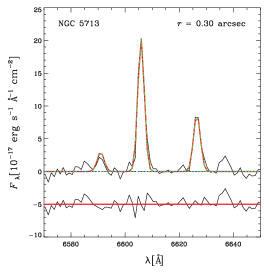
To measure the distribution and kinematics of the ionized gas, we analyzed the [N ii], H, and [S ii] emission lines in the combined HST spectra of the sample galaxies, following the prescriptions by Beifiori et al. (2009) and using their IDL algorithm based on MPFIT package (Markwardt 2009).
We fitted the stellar continuum with a low-order polynomial and the narrow and broad components of the observed emission lines with a sum of Gaussian functions. For all the objects the ionized-gas emission was always much stronger compared to the stellar continuum. The best-fitting parameters and their errors were derived by a minimization in pixel space and evaluating . We adopted both a narrow and broad component for the emission lines of NGC 3259 and NGC 5141, two narrow components for NGC 3049, and a single narrow component for all the other sample galaxies, including NGC 5635 for which the presence of two distinct components was not clear. For NGC 2654 and NGC 3049 the H line was not accurately fitted due to the low and presence of an asymmetric broad component, respectively. This does not influence our results since we considered only the [N ii] line for the dynamical modeling.
We focused on the [N ii] line because it was always the brightest nebular line in our spectra. The nebular lines actually probe the nuclear kinematics better than the H line, which could be affected by both the absorption from the stellar component and emission from circumnuclear starforming regions (e.g., Coccato et al. 2006).
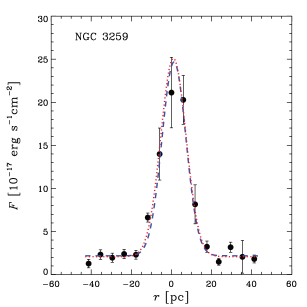
We measured the radial profile of the [N ii] flux along the spatial direction to constrain the distribution of the ionized gas. We assumed the gas to be distributed into a infinitesimally thin disk centered on the galaxy nucleus with an intrinsically Gaussian flux profile. We derived the intrinsic flux profile for two inclinations of the gaseous disk () by a minimization to match the observed flux, while accounting for the STIS PSF, which we generated with the TINY TIM package by Krist et al. (2011). The result for NGC 3259 is plotted in Fig. 3. We measured the [N ii] line width within a nearly square aperture centered on the continuum peak to estimate the central gas velocity dispersion . In the case of the 1-pixel spatial binning, we considered an aperture of 0.15 arcsec (3 pixels) or 0.25 arcsec (5 pixels) along the spatial direction when the spectrum was obtained with a 0.1 arcsec or a 0.2 arcsec-wide slit, respectively. In the case of a 2-pixel spatial binning, we took an aperture of 0.30 arcsec (3 pixels). The aperture sizes are listed in Table 4. We corrected the measured line width for instrumental resolution to obtain (Table 4).
5 Dynamical modeling
To derive stringent limits for our sample galaxies we followed the approach of Sarzi et al. (2002). This is based on the assumption that the nuclear gravitational potential is traced by the line width of the nebular emission originated from ionized gas in Keplerian rotation around the SBH. We considered the gas moving onto coplanar circular orbits in a infinitesimally thin disk with the intrinsic distribution we derived from the measured flux radial profile. The kinematics was measured along only one direction across the galaxy nucleus, which does not provide constraints on the orientation of the gas disk. We disregarded the effect on the unknown position angle of the gas disk, since we extracted our spectrum in a nearly square aperture. Thus, we could assume that the STIS slit was placed along the major axis of the gas disk and we estimated at two inclinations of and , which bracket the of randomly inclined disks (see Sarzi et al. 2002). Our choice of parametrization for the intrinsic flux of the gas is conservative, a cuspier function would lead to a more concentrated gas distribution and, therefore, to a smaller value of (see Sarzi et al. 2002). We also expect to find a smaller value of when taking into account the contributions of the stellar potential and non-gravitational forces (due for instance to the activity of the central SBH). These last factors imply that our estimates based on the assumption of a rotating gaseous disk should be strictly speaking regarded only as upper limits, although in practice it is unlikely that the gas motions are entirely driven by non-gravitational forces. In particular, the finding that the narrow-line ionized-gas emission is always rather concentrated around the nucleus contrasts with the idea that such gas would not respond to the central gravitational pull of the SBH. In fact, that non-gravitational forces are generally unimportant is also supported by the finding that the estimates derived from the central ionized-gas flux profile and line-width always agree with actual measurements based on resolved stellar and ionized-gas kinematics (Beifiori et al. 2012). Nonetheless, in some instances there are indications that estimates based on our method could be biased either due to the presence of non-gravitational forces or to the stellar potential (Beifiori et al. 2009).
6 Discussion and conclusions
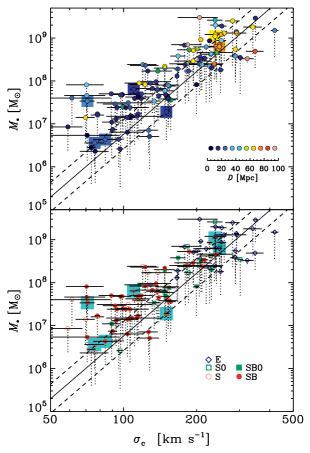
In Fig. 4, we compare our stringent limits to those of Beifiori et al. (2009, 2012) who considered the relation by Ferrarese & Ford (2005).
The limits of NGC 2654, NGC 3049, NGC 3259, NGC 4343, NGC 5141, and NGC 5635 are within the scatter of the relation. The of NGC 5635 is displaced towards higher values because we probably overestimated the value from the HST/STIS spectrum, where it was not possible to distinguish the broad and narrow components of the [N ii] line. The value for NGC 5713 exceeds more than three times the scatter of the relation. For this galaxy the contribution of the stellar mass that we disregarded in our analysis could play a significant role, as already pointed out by Beifiori et al. (2009) for a number of other galaxies with a stringent limit in the lower end of the relation. On the top of this, the center of NGC 5713 is poorly constrained because its nuclear surface brightness distribution is characterized by several bright knots rather than a well defined peak (see also Scarlata et al. 2004).
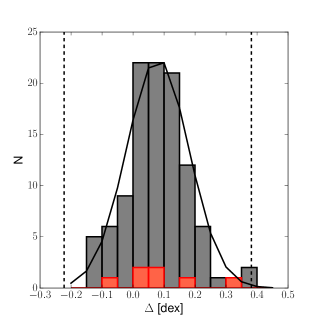
Our galaxies cover different morphological types (1 elliptical, 3 unbarred and 3 barred spirals according to the photometric decomposition) and span a wide range of central stellar velocity dispersion ( ) and ( for and for ). The stringent limits we measured are fully consistent with those by Beifiori et al. (2009, 2012). This is confirmed by the distribution of the distances of the two (, ) datasets from the relation by Ferrarese & Ford (2005), which we show in Fig. 5 for . On average, our run parallel and above the relation with no systematic trend depending on the galaxy distance or presence of the bar.
With our investigation, the number of galaxies with stringent limits obtained from nebular-line width increases to 114 and can be used for studying the scaling relations between and properties of their host galaxies. Most of our limits actually populate the low- end of the relation. They could be used to prove the claim by Beifiori et al. (2009) that the contribution of the stellar component to the gravitational potential is particularly significant in the low- regime and biases the measured towards exceedingly large values. This will be investigated in a forthcoming paper (Pagotto et al. in prep.) to prove previous findings suggesting that the nuclear gravitational potential is remarkably well traced by the width of the nebular lines when observed at sub-arcsecond scales.
Acknowledgements.
We acknowledge the anonymous referee for valuable comments that led to an improved presentation. We are grateful to Heikki Salo for valuable discussion on the photometric decomposition of NGC 4343. EMC, EDB, LM, and AP are supported by Padua University through grants 60A02-5857/13, 60A02-5833/14, 60A02-4434/15, CPDA133894, and BIRD164402/16. IP acknowledges the Max-Planck-Institut für extraterrestrische Physik for the hospitality while this paper was in progress. Part of the data used in this paper were acquired through the Sloan Digital Sky Survey Archive (http://www.sdss.org/). This research also made use of the HyperLeda Database (http://leda.univ-lyon1.fr/) and NASA/IPAC Extragalactic Database (http://ned.ipac.caltech.edu/).References
- Aguerri et al. (2009) Aguerri, J. A. L., Méndez-Abreu, J., & Corsini, E. M. 2009, A&A, 495, 491
- Alam et al. (2015) Alam, S., Albareti, F. D., Allende Prieto, C., et al. 2015, ApJS, 219, 12
- Beifiori et al. (2009) Beifiori, A., Sarzi, M., Corsini, E. M., et al. 2009, ApJ, 692, 856
- Beifiori et al. (2012) Beifiori, A., Courteau, S., Corsini, E. M., & Zhu, Y. 2012, MNRAS, 419, 2497
- Caon et al. (1993) Caon, N., Capaccioli, M., & D’Onofrio, M. 1993, MNRAS, 265, 1013
- Cappellari & Emsellem (2004) Cappellari, M. & Emsellem, E. 2004, PASP, 116, 138
- Coccato et al. (2006) Coccato, L., Sarzi, M., Pizzella, A., et al. 2006, MNRAS, 366, 1050
- Corsini et al. (2017) Corsini, E. M., Wegner, G. A., Thomas, J., Saglia, R. P., & Bender, R. 2017, MNRAS, 466, 974
- Costantin et al. (2017) Costantin, L., Méndez-Abreu, J., Corsini, E. M., et al. 2017, A&A, 601, 84
- de Vaucouleurs et al. (1991) de Vaucouleurs, G., de Vaucouleurs, A., Corwin, H. G., et al. 1991, Third Reference Catalogue of Bright Galaxies (Berlin: Springer) (RC3)
- Fabian (1999) Fabian, A.C. 1999, MNRAS, 308, 39
- Falcón-Barroso et al. (2017) Falcón-Barroso, J., Lyubenova, M., van de Ven, G., et al. 2017, A&A, 597, 48
- Ferrarese & Merritt (2000) Ferrarese, L. & Merritt, D. 2000, ApJ, 539, 9
- Ferrarese & Ford (2005) Ferrarese, L. & Ford, H. 2005, Space Sci. Rev., 116, 523
- Ferrers (1877) Ferrers, N. M. 1877, Quart. J. Pure and Appl. Math, 14, 1
- Freeman (1970) Freeman, K. C. 1970, ApJ, 160, 811
- Gebhardt et al. (2000) Gebhardt, K., Bender, R., Bower, G., et al. 2000, ApJ, 539, 13
- Gerhard (1993) Gerhard, O. E. 1993, MNRAS, 265, 213
- Hamuy et al. (1992) Hamuy, M., Walker, A. R., Suntzeff, N. B., et al. 1992, PASP, 104, 533
- Hamuy et al. (1994) Hamuy, M., Suntzeff, N. B., Heathcote, S. R., et al. 1994, 106, 566
- Jrgensen et al. (1995) Jrgensen, I., Franx, M., & Kjaergaard, P. 1995, MNRAS, 276, 1341
- Kormendy & Ho (2013) Kormendy, J. & Ho, L. C. 2013, ARA&A, 51, 511
- Krist et al. (2011) Krist, J. E., Hook, R. N., & Stoehr, F. 2011, Proc. SPIE, 8127, 81270J-1
- Markwardt (2009) Markwardt, C. B. 2009, in Astronomical Data Analysis Software and Systems XVIII, eds. D. A. Bohlender, D. Durand, & P. Dowler, ASP Conf. Ser. 411, 251
- McConnell & Ma (2013) McConnell, N. J. & Ma, C.-P. 2013, ApJ, 764, 184
- Méndez-Abreu et al. (2008) Méndez-Abreu, J., Aguerri, J. A. L., Corsini, E. M., & Simonneau, E. 2008, A&A, 478, 353
- Méndez-Abreu et al. (2014) Méndez-Abreu, J., Debattista, V. P., Corsini, E. M., & Aguerri, J. A. L. 2014, A&A, 572, A25
- Méndez-Abreu et al. (2017a) Méndez-Abreu, J., Ruiz-Lara, T., Sánchez-Menguiano, L., et al. 2017a, A&A, 598, 32
- Méndez-Abreu et al. (2017b) Méndez-Abreu, J., Aguerri, J. A. L., Falcón-Barroso, J., et al. 2017b, A&A, submitted
- Moffat (1969) Moffat, A. F. J. 1969, A&A, 3, 455
- Morelli et al. (2016) Morelli, L., Parmiggiani, M., Corsini E. M., et al. 2016, MNRAS, 463, 4396
- Press et al. (1992) Press W. H., Teukolsky S. A., Vetterling W. T., Flannery B. P., 1992, Numerical Recipes in FORTRAN. The Art of Scientific Computing (Cambridge: Cambridge Univ. Press)
- Prugniel & Soubiran (2001) Prugniel, Ph., & Soubiran, C. 2001, A&A, 369, 1048
- Saglia et al. (2016) Saglia, R. P., Opitsch, M., Erwin, P., et al. 2016, ApJ, 818, 47
- Salo et al. (2015) Salo, H., Laurikainen, E., Laine, J., et al. 2015, ApJS, 219, 4
- Sarzi et al. (2002) Sarzi, M., Rix, H.-W., Shields, J. C., et al. 2002, ApJ, 567, 237
- Sarzi et al. (2006) Sarzi, M., Falcón-Barroso, J., Davies, R. L., et al. 2006, MNRAS, 366, 1151
- Scarlata et al. (2004) Scarlata, C., Stiavelli, M., Hughes, M. A., et al. 2004, AJ, 128, 1124
- Schwarz (1978) Schwarz, G. E. 1978, Ann. Stat., 6, 461
- Sérsic (1968) Sérsic, J. L. 1968, Atlas de Galaxias Australes (Cordoba: Observatorio Astronomico)
- Shankar et al. (2016) Shankar, F., Bernardi, M., Sheth, R. K., et al. 2016, MNRAS, 460, 3119
- Sheth et al. (2010) Sheth, K., Regan, M., Hinz, J. L., et al. 2010, PASP, 122, 1397
- Silk & Rees (1998) Silk, J. & Rees, M. J. 1998, A&A, 331, 1
- van der Kruit (1979) van der Kruit, P. C. 1979, A&AS, 38, 15
- van der Marel & Franx (1993) van der Marel, R. P. & Franx, M. 1993, ApJ, 407, 525
Appendix A Appendix
Fig. 1, Fig. 2, and Fig. 3 show the two-dimensional photometric decomposition of the -band SDSS images, the rest-frame T122/B&C spectra, and HST/STIS spectra of the sample galaxies, except for NGC 3259, respectively.