KAVAGait: Knowledge-Assisted Visual Analytics
for Clinical Gait Analysis
Abstract
In 2014, more than 10 million people in the US were affected by an ambulatory disability. Thus, gait rehabilitation is a crucial part of health care systems. The quantification of human locomotion enables clinicians to describe and analyze a patient’s gait performance in detail and allows them to base clinical decisions on objective data. These assessments generate a vast amount of complex data which need to be interpreted in a short time period. We conducted a design study in cooperation with gait analysis experts to develop a novel Knowledge-Assisted Visual Analytics solution for clinical Gait analysis (KAVAGait). KAVAGait allows the clinician to store and inspect complex data derived during clinical gait analysis. The system incorporates innovative and interactive visual interface concepts, which were developed based on the needs of clinicians. Additionally, an explicit knowledge store (EKS) allows externalization and storage of implicit knowledge from clinicians. It makes this information available for others, supporting the process of data inspection and clinical decision making. We validated our system by conducting expert reviews, a user study, and a case study. Results suggest that KAVAGait is able to support a clinician during clinical practice by visualizing complex gait data and providing knowledge of other clinicians.
Index Terms:
Design study, interface design, knowledge generation, knowledge-assisted, visualization, visual analytics, gait analysis.1 Introduction
According to the 2014 United States Disability Status Report [1], 5.5% of working age adults (ages 21 to 64, amounting to more than 10 million nationwide) suffer from an ambulatory disability. Walking and stair-climbing are essential motor functions that are prerequisites for participation in activities of daily living. Disruptions to these motor skills hold severe health and socio-economic implications if left unattended. Therefore, gait rehabilitation is a crucial issue for clinicians.
Gait analysis tools allow clinicians to describe and analyze a patient’s gait performance to make objective, data based decisions. The systems commonly used for capturing gait data range from simple video cameras and force-distribution sensing walkways to highly sophisticated motion capture systems [2, 3]. The latter is often referred to as the gold standard in clinical gait analysis, as this method assesses the gait pattern’s underlying kinematic and kinetic components [4]. However, the motion capture system’s widespread use is limited due to its substantial monetary and infrastructural costs, prolonged time commitment for data collection, and its requirement for specialized technicians. Thus, clinics with a large daily influx of patients must rely on more practical and affordable methods. Force plates and cost-effective two-dimensional gait analysis tools are popular alternatives to determine external forces applied to the ground (ground reaction force, GRF) during gait [5, pp. 83–96] and the associated kinematic variables (e.g., 2D joint angles). A typical clinical gait analysis scenario involves the following: in a first step, a clinician conducts a physical examination of the patient. Then, the patient is instructed to walk across a walkway in the gait laboratory several times, while the clinician records the patient’s GRF. These analysis methods generate a vast amount of multivariate, time-oriented data, which need to be interpreted by the clinician in a short period of time. However, support for decision making based on analyzing this data is very limited in currently used systems. The resulting data are typically represented in a very simplistic manner using non-interactive visual representations such as line plots and simple spreadsheets to inform clinical decision making.
In the above-described scenario, it is a difficult task to interpret the obtained data as several parameters are inter-linked and data interpretation requires considerable domain expertise. The combination of a vast amount of inter-linked clinical data derived from clinical examinations, the need for sophisticated data analysis methods, and clinical decision making requiring the judgment and expertise of clinicians, strongly lends itself to the notion of visual analytics (VA) [6, 7]. VA may support the clinician with powerful interactive visualization techniques that are integrated in combination with semi-automated data analysis methods. Consequently, this may support the clinician in interpreting complex data and drawing appropriate clinical conclusions. The clinicians’ ‘implicit knowledge’ from prior experience is essential in the analysis process. Thus, it makes sense to externalize some of the domain experts’ ‘implicit knowledge’ and make it available as ‘explicit knowledge’ in the VA process [8, 9]. As such, it can be used to augment the visual display of data and to support (semi-)automated data analysis (knowledge-assisted VA methods). Additionally, joint learning between clinicians would be enabled as well as the collection of expert knowledge across several clinicians allows the constructing of a comprehensive clinical knowledge database [8] (refereed to as ‘explicit knowledge store’ (EKS) for the proposed prototype later in this article).
1.1 Overview and Method
This work follows the paradigm of problem-oriented research [10], i.e., working with real users (clinicians), and aims at solving the aforementioned problem by means of VA. In detail, a comprehensive prototype was developed which is intended to support the clinician in interpreting gait data during everyday clinical practice. The methods proposed in this work aim at externalizing implicit knowledge of clinicians into a knowledge database that makes these data available as explicit knowledge to other clinicians. For this purpose, we conducted a design study, following Sedlmair et al. [10]. Specifically, we followed the ‘nested model for visualization design and validation’ [11]. This model is a unified approach, which structures visualization design into four levels and combines them with appropriate validation methods, which reduces threats to validity at each level. Overall, our work contributes to visualization research in all three categories (1–3) outlined for design studies in [10] as well as presents new knowledge-assisted visualization approaches (4):
-
1.
Problem characterization and abstraction: A common language and understanding between domain experts and VA researchers was established. Specific data, user, and task requirements for clinical gait analysis were set as prerequisites during the design process (see Section 3) for the development of a novel knowledge-assisted VA system.
- 2.
-
3.
Reflection: Insights gained during the validation process (see Section 6) were reflected and analyzed to propose directions for possible future development.
-
4.
New knowledge-assisted visualization approaches were used to generate easily understandable ‘Graphical Summaries’ of the data as well as the novel ‘Interactive Twin Box Plots’ (ITBP).
2 Related Work
From a data perspective, gait measurements are multivariate time series. To visualize and analyze such data, a variety of different visual analytics (VA) approaches have been introduced in earlier work.
Visual Analytics for Movement Time Series: Andrienko et al. [12] give a broad overview how VA can be used to visualize locomotion, which they refer to as ‘Visual Analytics of Movement’. In their work, they give recommendations on how such data can be represented in the context of VA and how these data may be resampled. However, they mostly focus on geospatial datasets in relation to time. In the field of sport science, three VA systems [13, 14, 15] support soccer analysts in analyzing position-based soccer data at various levels of detail. Janetzko et al. [14] additionally enrich the analysis with manually annotated events such as fouls and suggest further candidate events based on classification. Chung et al. [16] applied a knowledge-assisted visual analytics approach to rank events in rugby plays. An effective fully automated method for human motion sequence segmentation for character animation purposes was introduced by Vögele et al. [17]. They described the fast detection of repetitions in discovered activity segments as a decisive problem of motion processing pipelines. For testing this method, they used different motion capture databases and visualized the results with stacked bar charts for comparison with other techniques. In the context of medicine, sports, and animation, the ‘MotionExplorer’ system [18] enables the exploration of large motion capture data collections represented as multivariate time series. Following an iterative design approach, Bernard et al. [18] demonstrated the functionality of the ‘MotionExplorer’ through case studies with five domain experts. A similar approach, the ‘MotionFlow’ system [19], allows more specific grouping and analysis of patterns in motion sequences. Another system was described by Purwantiningsih et al. [20]. They collected data on patients’ quality of movement using serious games and different motion sensing devices. To make these multivariate time-series data accessible to clinicians, their VA solution allows hierarchical clustering and navigation in time. The VA system ‘FuryExplorer’ [21] improves analytical workflows for evaluation of horse motion by interactive exploration of captured multivariate time-oriented data.
Visual Analytics for Multivariate Time Series: The analysis of time-oriented data is an important problem for many other domains beyond movement data. In a systematic review, Aigner et al. [22] surveyed more than 100 visualization approaches and systems for time-oriented data. Many approaches for visualizing multivariate time series are based on a form of small multiples [23] where the many charts – one for each univariate time series – are juxtaposed on a common time axis. Space-efficient visualization techniques like horizon graph [24], braided graph [25], and qualizon graph [26] have been designed and experimentally evaluated for such purposes. The ‘LiveRAC’ sytem [27] visualizes time series for hundreds of parameters in a reorderable matrix of charts, for IT systems management. The system allows for the reordering and side-by-side comparison with different levels of detail. ‘KAMAS’ [28] is a knowledge-assisted visual malware analysis system, supporting IT-security experts during behavior-based malware analysis based on multivariate log files of the executed system and API calls of an operating system.
The ‘PieceStack’ system [29] provides an interactive environment to split and hierarchically aggregate time series based on stacked graphs [30]. ‘Gnaeus’ [31] provides visualizations of multivariate time series data from electronic health records using clinical guidelines for knowledge-assisted aggregation and abstraction. A different approach to tackle multivariate data applies dimensionality reduction to project multivariate measurements to 2D space, where they can be displayed as trajectories (such as a connected scatter plot) [32]. The ‘TimeSeriesPaths’ system [33] applied this approach as a visual data aggregation metaphor to group similar data elements. Based on their VA approach, they provided a hatching based bar visualization for inner class comparison. Schreck et al. [34] showed trajectories in small multiples and applied self-organizing maps to spatially cluster the trajectories. Other recent work relating to visual analytics of biomedical models include PROACT [35], PhenoLines [36], and a study on trust-augmenting designs [37].
The presented work focuses on multivariate time series data to solve problems in different domains. However, only one of the identified approaches (KAMAS [28]) provide the ability to extract and store implicit knowledge of experts in the form of explicit knowledge in a database. This is a desirable feature for a VA tool, especially in clinical gait analysis, as it would support clinicians in decision making when analyzing a patient’s gait and would support joint learning between different clinical experts.
3 Problem Characterization
& Abstraction
One primary goal in clinical decision making during gait rehabilitation is to assess whether a recorded gait measurement displays normal gait behavior or if not, which specific gait patterns (abnormalities) are present. To understand how to support the analysts in this context, we performed a ‘problem characterization and abstraction’, defined as the first contribution of a design study [10]. To ensure knowledgeable results for the domain of clinical gait analysis and rehabilitation, along the triangle of data, users and tasks [38], we followed a user-centered design process [39]. Information was gathered primarily from focus group meetings [40, pp. 192] and set in context with domain-specific literature. Based on this, we addressed the first (domain problem and data characterization) and second level (operation and data type abstraction) of the nested model by Munzner [11].
3.1 Focus Group
The primary aim of the focus group meetings was to match the domain-specific vocabulary between the computer scientists and clinical experts. In addition, these meetings were used to establish a mutual understanding of the following questions for the specific setting:
-
•
What is the workflow in a clinical gait laboratory?
-
•
How does the clinician interact within this setting?
3.1.1 Focus Group Setup
Participants and Clinical Partner: Seven participants comprised the focus group (two clinical gait analysis experts, two pattern recognition experts, and three visual analytics (VA) experts). In addition the AUVA, as the mandatory social insurance for occupational risks for more than 3.3 million employees and 1.4 million pupils and students in Austria, served as a cooperation partner during the entire project. The AUVA runs several rehabilitation centers in Austria. The prototype described in this manuscript was developed along the needs of the AUVA’s clinical gait laboratories and clinical practice.
Design & Procedure: The focus group members shared a co-working space so that short stand-up meetings were possible and questions could be resolved quickly. Additionally, six focus group meetings with a duration of approximately one hour were held to discuss detailed questions. All these activities were held over a 13-months time frame.
Apparatus & Materials: The results of the frequent discussions and meetings were regularly documented, which resulted in an extensive basis for a common mutual understanding. These notes were subsequently transformed into the manuscript at hand.
3.1.2 Focus Group Findings
The findings of the focus group sessions mainly concerned data-related aspects as well as a deeper understanding of the overall analysis process. Next, these findings are briefly summarized.
A sufficient amount of patient gait data is necessary to develop visualization and pattern recognition applications for the clinical practice. While there have been attempts to provide such gait analysis databases [41], the amount of publicly available data is still too limited. The AUVA’s rehabilitation centers typically use force plates to determine ground reaction forces (GRFs) to assess patient gait disorders and to evaluate patient progress during physical therapy treatment. The data used were acquired retrospectively from the AUVA’s database.
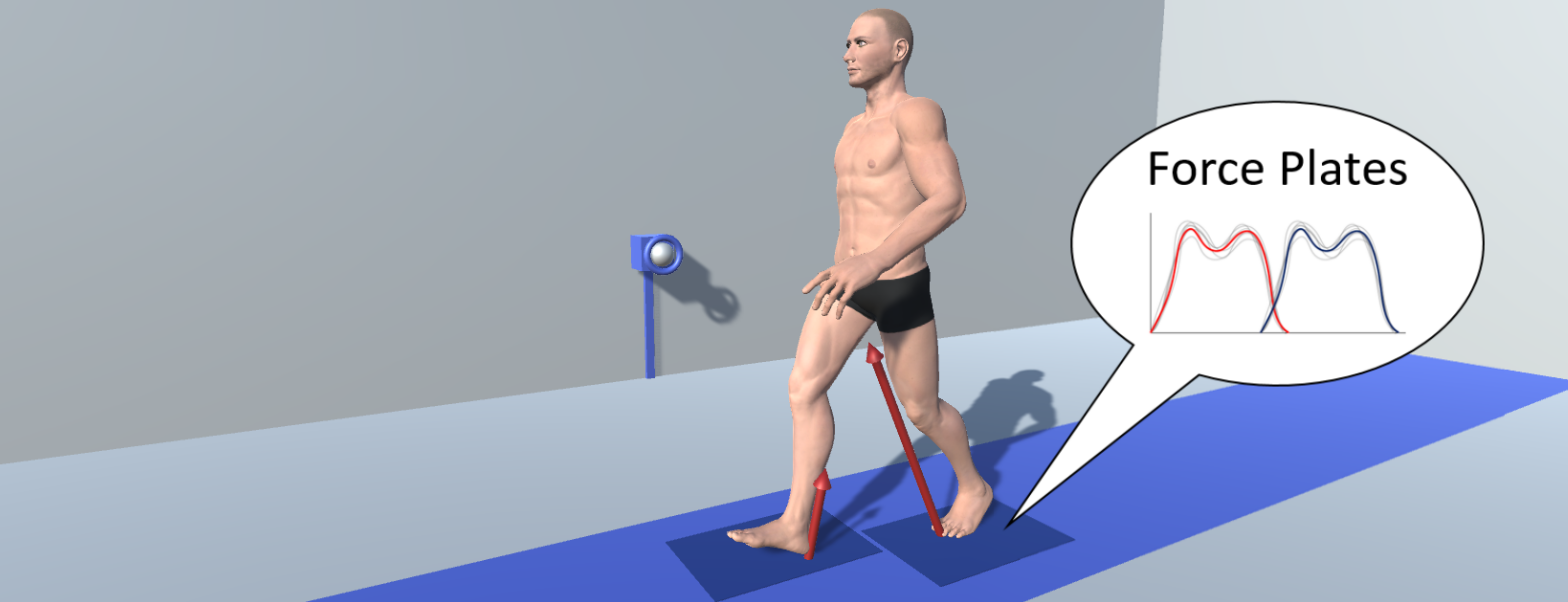
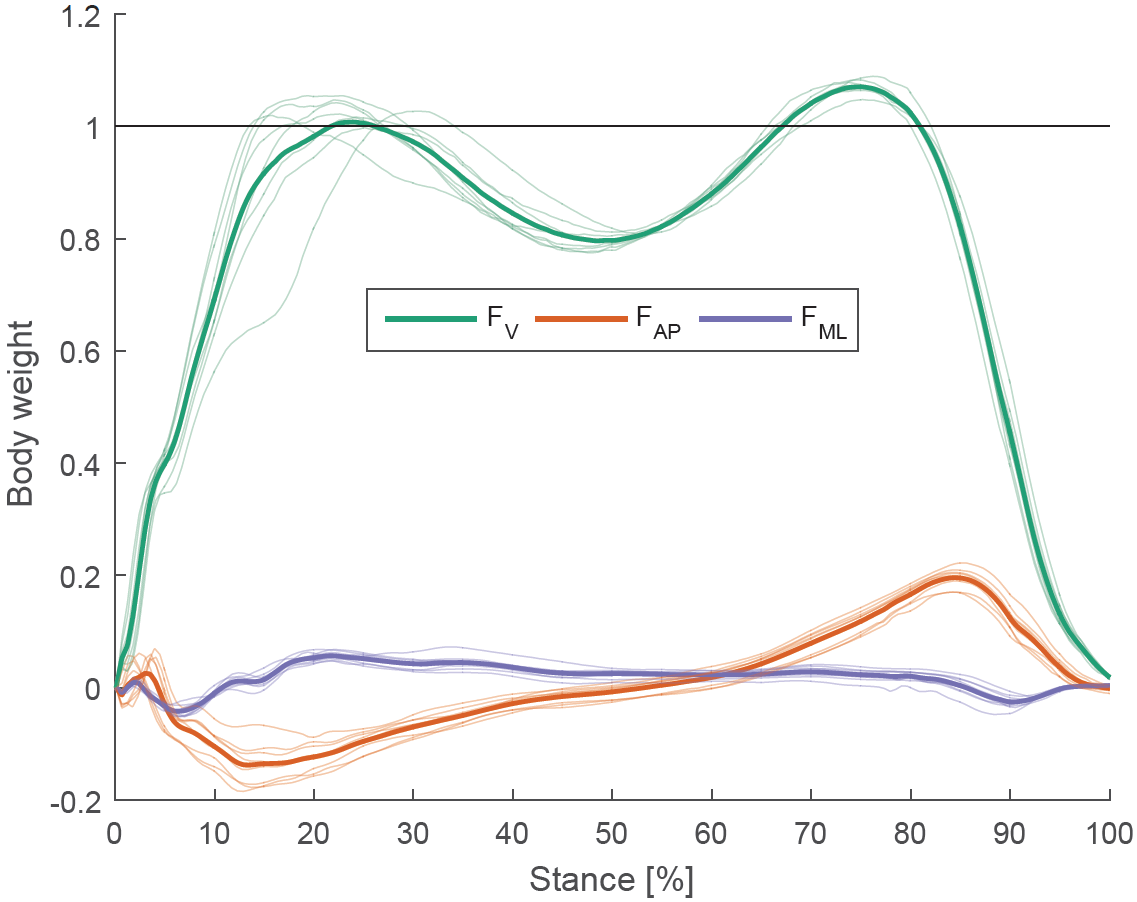
A typical gait analysis scenario may be divided into three main workflow stages: (1) Rigorous physical examination of the patient by the clinician. (2) Instruction of the patient during gait analysis and data recording: the clinician guides the patient through the entire process of gait analysis and instructs the patient to walk repeatedly across an approximately 10 meter walkway (see Figure 1). In the center of the walkway, one or more force plates with an approximate size of 0.4 x 0.6 meters are fitted flush to the ground. The clinician records necessary data by operating the measurement equipment and takes care that several clean footsteps and corresponding videos are recorded. (3) Processing and interpretation of the acquired data: the clinician processes recorded data using commercial software provided by the manufacturer of the measurement equipment. These systems typically present the collected data in a non-interactive interface, as line plots of GRFs (see Figure 2) and several calculated discrete parameters (e.g., walking velocity, step length, etc.) as numbers in a table.
3.2 Data–Users–Tasks Analysis
Above we have described the general workflow of clinical gait analysis. In addition to these results, we structured the ‘domain problem and data characterization’ along the Data-Users-Tasks triangle [38], which will be described in the following. This high-level framework is structured around three questions:
-
•
What kind of data are the users working with? (data)
-
•
Who are the users of the VA solution(s)? (users)
-
•
What are the (general) tasks of the users? (tasks) [38]
The answers to these questions support designers of VA methods to find or design appropriate visual representations of the data combined with appropriate analysis and interaction methods that support the users.
Data: The aforementioned force plates measure three components of the applied force as a vertical, anterior-posterior and medio-lateral force component, sampled typically at 1000 Hz [2, pp. 325–326]. Even though all three components are necessary to describe a patient’s gait pattern, the vertical component receives most attention in research and clinical practice. The reason is that the vertical component shows greater magnitudes than the other two components [42]. To foster comparability of the GRF data between different patients, each GRF signal is amplitude-normalized by the product of body weight () and standard gravity () and time-normalized by expressing the signals as 100% of stance time. Resulting data for each foot are then visualized by plotting so called consistency graphs, where all trials are plotted into one graph to inspect variability across the steps recorded (see Figure 2). Although GRF is a very sensitive measure of gait pathology, its specificity is low since GRF comprises the motion and acceleration of whole body dynamics [5, pp. 95]. Thus, additional measurements are necessary to describe the gait pattern of an individual in detail. In clinical gait analysis, the repeated movement of steps are referred to as a gait cycle, which starts with the initial contact of one leg with the ground, to the next ground contact of the same leg. Within this concept, one can assess spatial and temporal parameters (STPs) of gait [43]. Spatial parameters comprise the length of a step or a stride (two consecutive steps). Temporal parameters comprise the time duration of for example a single step, a stride, or the swing phase. Additionally, the cadence (steps per minute), number of gait cycles per specified time, and walking speed are used to express the temporal aspect of gait.
Users: Clinical gait analysis is performed by domain experts – physicians, physical therapists, bio-medical engineers, or movement scientists. They possess background knowledge about functional anatomy, biomechanics, and gait analysis. The users are comfortable using different data representations (e.g., spreadsheets, box plots, line plots), mostly developed for a special hardware setting. Thus, they have no dedicated experience with VA solutions.
Tasks: The primary task of a clinician in gait rehabilitation is to assess gait performance, to analyze and interpret the acquired data and to use this information for clinical decision making. Secondary tasks involve the identification of specific gait patterns (abnormalities) and the comparison of observed data to already existing patient data sets (e.g., in the clinic’s database). To support these tasks, expert knowledge might be stored in some sort of database, so that this information can be shared with other clinicians.
3.3 Prototype Requirements
Based on the insights gained in Section 3.2, we defined four key requirements (R) which have to be fulfilled by the KAVAGait system:
- R1 Data:
-
Handling of complex data structures in clinical gait analysis. To ensure the effective exploration and analysis, time-dependent three-dimensional ground reaction forces (GRFs) and spatio-temporal parameters (STPs) need to be modeled, stored, and visualized for inspection. In addition, for clinical decision making a visualization of the patients’ raw data is essential.
- R2 Visual Representation:
-
Visual representations appropriate for gait analysis experts. Clinicians use different diagrams (e.g., box and line plots) to conduct their analyses.
- R3 Workflow:
-
Workflow-specific interaction techniques. It is important to provide familiar interaction techniques (e.g., drag and drop, sorting, filtering) to the clinicians supporting the identification of specific gait patterns and the comparison to already existing data sets of patients.
- R4 Expert Knowledge:
-
Externalization of expert knowledge to reuse and share. When analysts solve real world problems, they have a vast amount of data at their disposal to be analyzed and interpreted. By storing the clinicians’ implicit knowledge, it can be made internally available in the system and usable to support the analysis process.
These four requirements form the basic pillars of KAVAGait and have to be fulfilled during the design and implementation.
4 Design & Implementation
To keep the design in line with the needs and requirements defined earlier (see Section 3), we continued our user-centered design process [39] by involving three domain experts in clinical gait analysis. We iteratively produced sketches, screen prototypes, and functional prototypes [44]. Thus, we could gather and apply feedback about the design’s usability and how well it supports clinicians’ needs. This way, we addressed the third (visual encoding and interaction design) and fourth level (algorithm design) of the nested model [11]. The design study resulted in KAVAGait, which is implemented in Java, based on a data-oriented design [45] (e.g., used in game development and real-time rendering). Next, we elaborate on central design decisions.
4.1 Input Data
The input data for KAVAGait are the vertical component of the ground reaction force () of both feet collected by force plates as two synchronized time series. From these time series, spatio-temporal parameters (STPs) are calculated as 16 discrete numbers. Additional patient data on gender, age, body mass, and body height are available.
4.2 Explicit Knowledge Store (EKS)
To support gait analysts during their work, we designed the EKS related to STPs for different categories of gait patterns. Generally, the EKS stores the computerized form of the analysts’ implicit knowledge as explicit knowledge. Therefore, categories of different gait patterns are used, whereby each contains 16 value ranges depending on the 16 STPs describing the gait analysis result of a patient. For each category, the EKS contains the previously assigned patients and their STP values. Additionally, clinicians can refine the value range for each STP and category manually.
4.3 Visual Interface Design Concept
To best support physical therapists and gait analysis experts, we created an interface structure that allows working from left-to-right to fulfill the analysis tasks. This interface structure establishes an easy workflow concept based on multiple views for gait analysis experts. In relation to this interface structures, we situated the table structure of the EKS (see Figure 3:1) as well as the tree structure of the EKS (see Figures 5:1 and 6:1) to the left side of the interface to select individuals or categories of interest for exploration that always includes the related filtering options.
4.4 Visualization Concept
The KAVAGait system supports two major use cases 1) to assess newly acquired patient gait data as elicitated in Section 3 and additionally 2) to explore and adjust the stored explicit knowledge .
The visual representations used in KAVAGait have been developed through continuous refinement in multiple focus group sessions. Typically, we started from sketches based on a small number of known visualization techniques for multivariate time-oriented data [22]. Those suggestions were then discussed in focus group meetings with the domain experts and continuously improved or new ones derived (e.g., ITBP) to fulfill the users’ needs.
4.4.1 Assessment of Newly Loaded Patient Gait Data
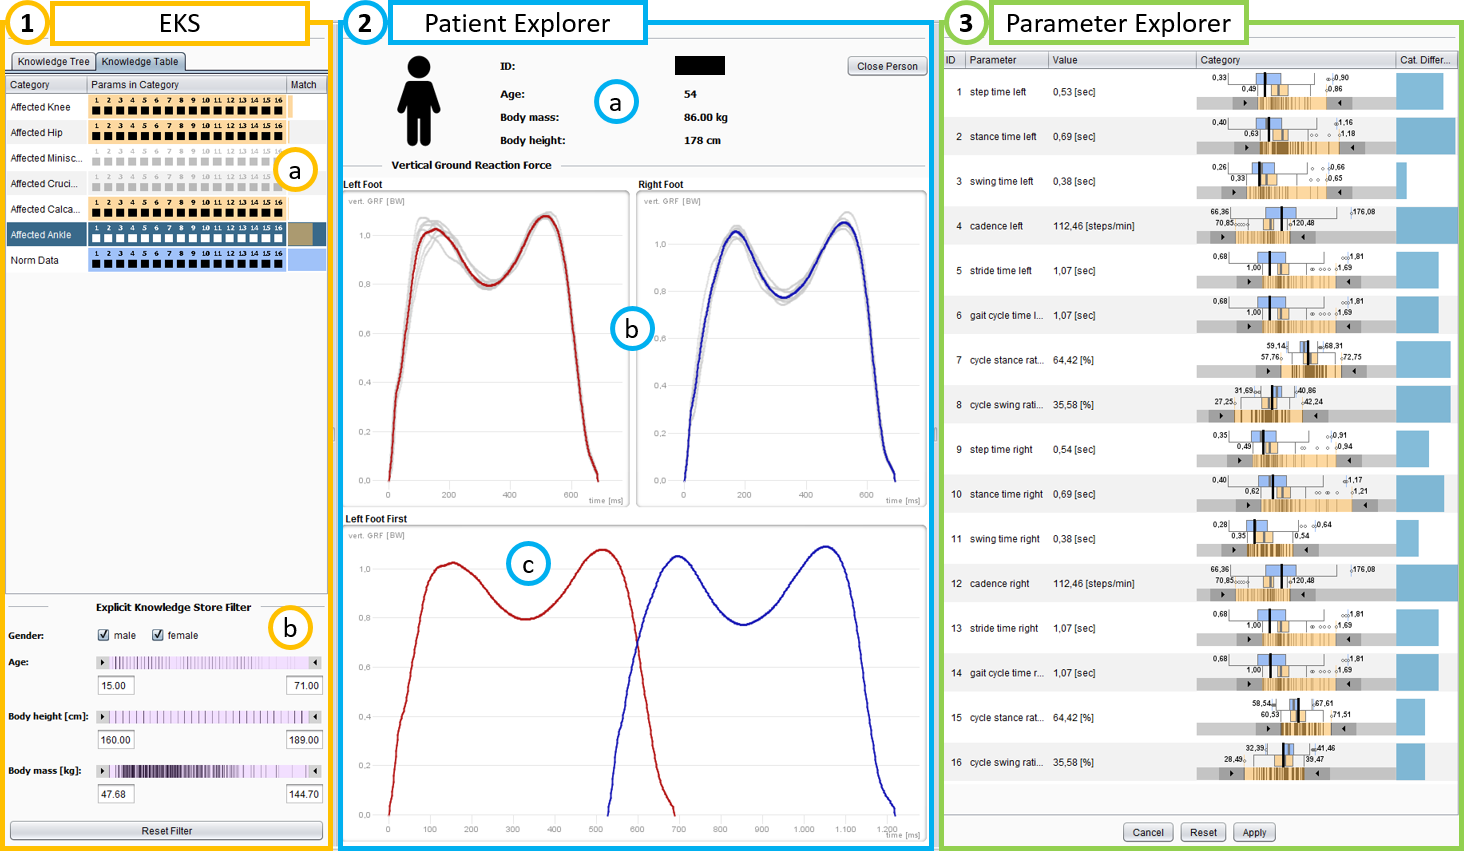
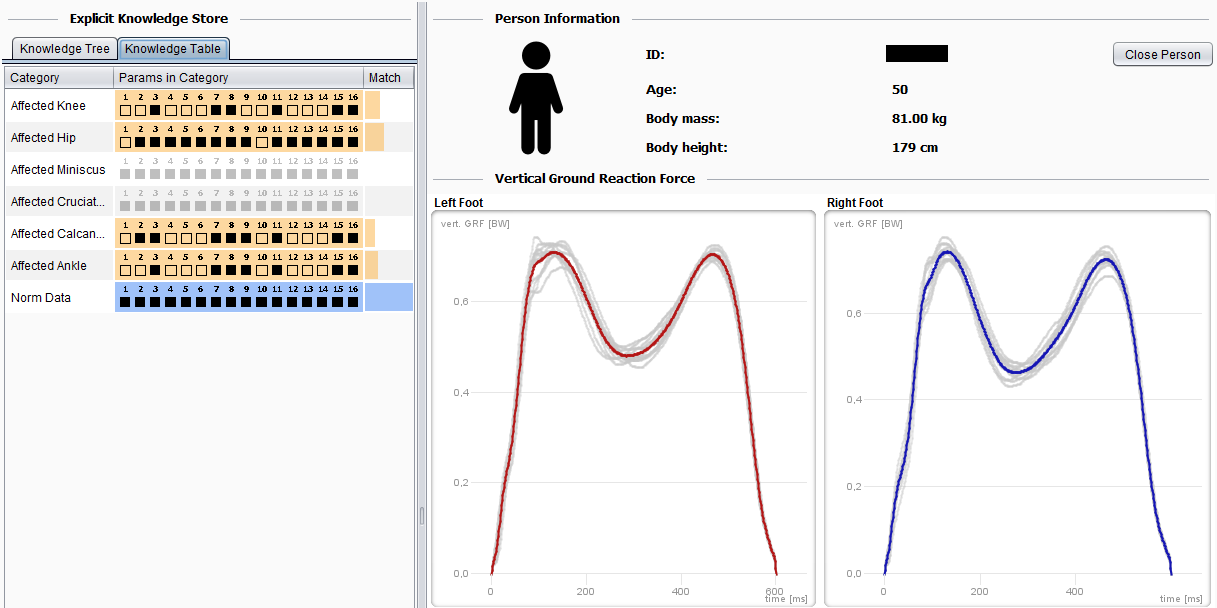
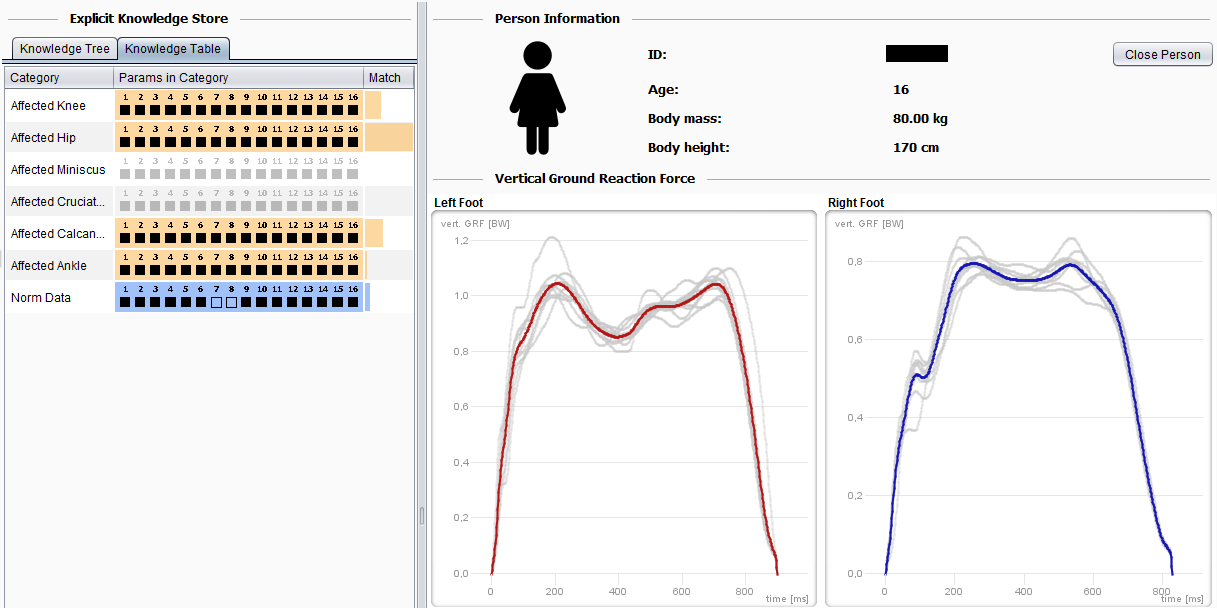
When loading new ‘Patient’ data, the information containing the ‘ID’, ‘Age’, ‘Body mass’, ‘Body height’ and ‘Gender’, and the measurements of the ‘vertical ground reaction forces’ () are visualized in the center view of KAVAGait (see Figure 3:2). These data are represented for each foot, whereby the light gray lines represent a single step and the red (left foot) or blue (right foot) line represent the mean data of the single steps. Additionally, a joint representation of on a combined temporal axis is available for further analysis and comparison. To make the of a newly loaded patient comparable with others, they are normalized by body weight.
For identification of possibly matching gait patterns, the ‘Knowledge Table’ (see Figure 3:1a) relates the newly loaded patient’s calculated STPs to ‘Categories’ (pathologies) of specific gait patterns (gait abnormalities) or norm data (describing healthy gait). The 16 calculated STPs are the input for the visualizations in the ‘Params in Category’ column. Depending on the 16 STPs, the so called ‘Graphical Summary’ tells the clinician if a patient parameter is in range with a black rectangle or if it is out of range ( ) with a black rectangular frame based on the calculated ranges out of the EKS. If the EKS does not contain data for a category (empty category), the ‘Graphical Summary’ represents a gray rectangle. Thus, these three states provide a first overview of the patient. The third column (‘Match’) represents how the newly loaded patient matches to the stored categories in the EKS (a wider bar means a better match) supporting the clinicians during clinical decision making. For each category, a bar of width is computed according to Equation 1:
| (1) |
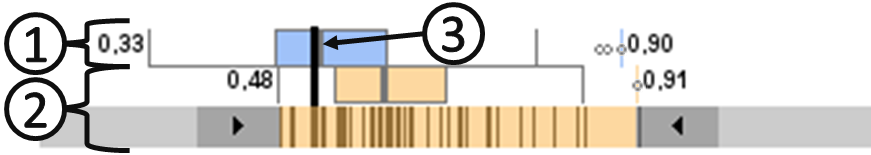
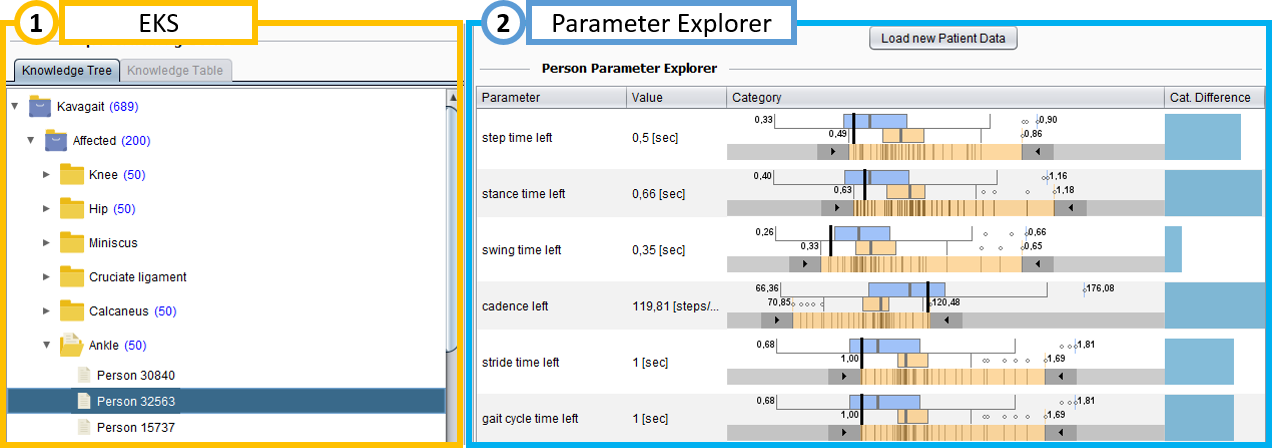
Equation 1 defines the matching between a sample and a ‘Gait Category’. Thereby, iterates over all 16 STPs, is the standard deviation and is the mean for the specific STP of all patients in the category. Additionally, is the specific STP of the newly loaded patient. Note that Equation 1 is an inverted variant of the Fisher criterion used in linear discriminant analysis (LDA) [46]. Variable grows with increasing agreement between and the distributions defined by and . is a small number that avoids potential division by zero. By using the included filtering options (see Figure 3:1b), the explicit knowledge used for the matching calculations can be filtered by ‘Gender’, ‘Age’, ‘Body height’ and ‘Body weight’. When selecting a category of interest, the loaded ‘Patient’ can be compared to other patients in the ‘Parameter Explorer’ view (see Figure 3:3). This table contains five columns. The first column represents the STP ‘ID’ to create a connection to the number in the graphical summary represented in the formerly described ‘Knowledge Table’. In the second column, the ‘Parameter’ name is represented and column three contains the calculated STP values for the loaded patient. The fourth column provides the ‘Interactive Twin Box Plot’ (ITBP) as shown in detail in Figure 4. It is an extended data visualization slider [47] for inter-category comparison in relation to: 1) the ‘Norm Data category’ represented as blue box plot; 2) the ‘Selected Category’ of a specific gait patterns represented as orange box plot. A ‘Hatching Range Slider’ (HRS) visualizing the related discrete parameters of each patient stored in the ‘Selected Category’ and 3) the STP value of the currently loaded patient. By placing the parts of the ITBP directly on top of each other, they can be perceived as a single control [48]. The ITBP enables the clinician to quickly compare two distributions and to set norm-value ranges for healthy and non-healthy categories. Additionally, based on the HRS, the clinician has the ability to quickly visually adjust the typical value ranges of the ‘Selected Category’.
The last column represents the difference between the ‘Norm Data Category’ and the ‘Selected Category’ which are visualized in the ITBP based on the Fisher discriminant function (see Equation 2) [46]:
| (2) |
Hereby, for a given parameter, specifies the mean and the variance of the first category and respectively specifies the mean and the variance of the second category . A higher represents a larger difference between the parameter distributions of the two categories, yielding a wider bar. After a clinician has finished exploring the newly loaded patient data, he or she can add them to the currently selected knowledge table category in the EKS by using the ‘Apply’ button. This way, the parameters of the patient are automatically transferred into the EKS, recalculating the value ranges. Thereby, new explicit knowledge is generated and used for analysis support. Likewise, the clinician has the possibility to undo various changes in the EKS at any time by using the ‘Reset’ button.
4.4.2 EKS Exploration and Adjustment
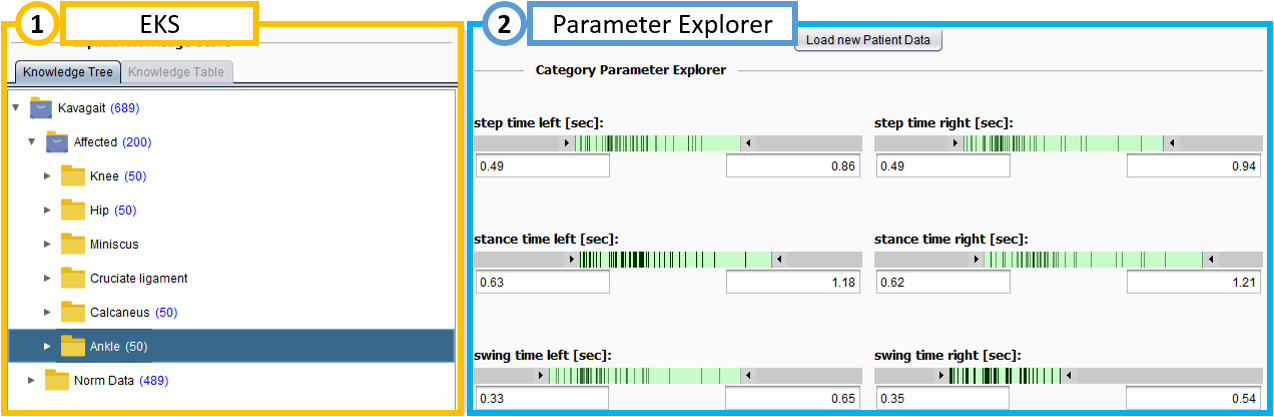
To support its second use case, KAVAGait contains two additional views for the exploration and adjustment of the explicit knowledge stored in the EKS. The clinician has the ability to select a single ‘Patient’ in the EKS for comparison with other patients (see Figure 5:1). The ITBPs are showing the relation to the ‘Norm Data Category’ and a ‘Selected Category’ of abnormalities (see Figure 5:2). This visualization works the same way as formerly described for the exploration of newly loaded patient data . On the other hand, as shown in Figure 6:1, the clinician can select a category visualizing each STP value range set by HRS (see Figure 6:2) included in the ‘Selected Category’. Here, the clinician has the ability to change (overwrite) the automatically estimated range by moving the HRS for each parameter. This feature is needed for two specific cases: 1) If the EKS did not contain any patients in a category, the clinician has the ability to create the ranges for each STP of a category based on his or her implicit knowledge; 2) If an STP of a category contains outliers based on patient data, the clinician has the ability to readjust the range. Hereby, the color of the HRS will change to dark orange and by applying the changes, the category receives an orange triangle in the tree structure to remind the clinician that changes were applied by hand. In general, each HRS included in the visual interface can be used for filtering or adjustment of the EKS included categories. The adjustments performed directly for the EKS will be stored permanently but they can be recalculated based on the values stored in the EKS if necessary. In contrast, the selected filtering options are automatically set back to default if the system is restarted.
4.5 Interaction Concept
For a better understanding of its functionality, we describe KAVAGait according to five steps based on the visual information seeking mantra by Shneiderman [49]: overview first, rearrange and filter, details-on-demand, then extract and analyze further.
4.5.1 Overview
When the clinician loads an input file, the patient’s information and the data from the performed analysis are displayed in the center of the view (see Figure 3). The automatically calculated matching of the patient to the stored EKS categories will be presented on the left side. Additionally, the ‘Graphical Summary’ provides an overview of the 16 represented STPs including a comparison to the stored values.
4.5.2 Rearrange
The clinician has the ability to rearrange each display, represented as a table, by sorting the columns.
4.5.3 Filter
To reduce the number of patients used for the automated category matching calculation, the interface offers the selection of several filtering options. Thereby, the clinician can filter the EKS data by ‘Gender’, ‘Age’, ‘Body height’ and ‘Body mass’. The matching results displayed in the ‘Knowledge Table’ are updated immediately, and the graphical summary (’Parameters in Category’) gives an impression of the 16 matched value ranges of the calculated STPs (see Figure 3:1).
4.5.4 Details-on-Demand
If a matching result catches the clinician’s interest, it can be selected from the knowledge table. This action opens a detailed visualization of the underlying parameters in a separate table – the ‘Parameter Explorer’ (see Figure 3:3), which can also be used for the exploration of patients already stored in the EKS (see Figure 5:2). In this table, the clinician can compare the calculated parameters of the loaded patient to the ‘Norm Data Category’ and to the ‘Selected Category’ from the ‘Interactive Twin Box Plots’ (ITBPs). Thus, the clinician still gets the information of how different the categories are for different STPs (’Category Difference’). It is important to note that the ITBPs are situated above each other to provide a better visual comparability of the differences between the left and the right foot. This is important, as the clinician needs to assess differences between both body sides (gait asymmetry). Additionally, the clinician has the ability to sort the visualized data based on the different columns by clicking the respective header.
4.5.5 Extract
Once the clinician has found the appropriate category for a patient’s gait, the calculated parameters can be added to the ‘Selected Category’ of the EKS by pressing the ‘Apply’ button (see Figure 3:3). Alternatively, the clinician can select some parameters of the patient in the ‘Parameter Explorer’ table to add only them to the ‘Selected Category’ of the EKS by using the ‘Apply’ button. From this moment, these data are immediately integrated into the automated analysis for the matching calculation. If a class contains insufficient samples or a value range is affected by outliers, the clinician has the possibility to extract further implicit knowledge by manually adapting these ranges in the ‘Category Parameter Explorer’. For this purpose, the ITBPs utilize the raw data of the selected class in order to provide the possibility for visual control by the clinicians (see Figure 6:2).
4.6 Externalized Knowledge Integration
The EKS is included on the left side of the interface in two different forms depending on the task to be supported.
4.6.1 Usage of Knowledge
When the clinician explores newly loaded patient data, the EKS is presented in a table format (the ‘Knowledge Table’ shown in Figure 3:1a). All of the ‘Categories’ integrated in the EKS will be checked against the loaded input data automatically. Based on the explicit knowledge, the system distinguishes between the three states (in range, out of range, or no data) of the graphical summary for each of the 16 STPs in the ‘Parameters in Category’ column. Additionally, the system calculates how newly loaded patients match to the stored ‘Categories’ in the EKS. To add new knowledge to the EKS, the system provides two possibilities: On the one hand, the clinician can add the full patient dataset, representing each parameter as ITBP, by using the ‘Apply’ button in the ‘Parameter Explorer’ (see Figure 3:3) to the ‘Selected Category’ in the ‘Knowledge Table’. On the other hand, the user has the ability to select a set of parameters of interest from the ‘Parameter Explorer’ table and add them using the ‘Apply’ button in the ‘Parameter Explorer’ to the ‘Selected Category’.
4.6.2 Adjustment of Knowledge
When the clinician explores the explicit knowledge, and adjusts it for single patient data or a category, the EKS is presented as an indented list (the ‘Knowledge Tree’) (see Figure 5:1). On the one hand, the clinician has the ability to select a single ‘Patient’ from the EKS for comparison with other patients by using the ITBP in relation to the ‘Norm Data Category’ and the ‘Selected Category’ including the selected ‘Patient’ (see Figure 5). On the other hand, the clinician can select a category visualized by HRS for each STP of the patients included in the ‘Selected Category’ of the EKS (see Figure 6). Generally, at the end of each ‘Category’, the number of contained ‘Patients’ is shown in blue brackets.
4.6.3 Knowledge Generation Loop
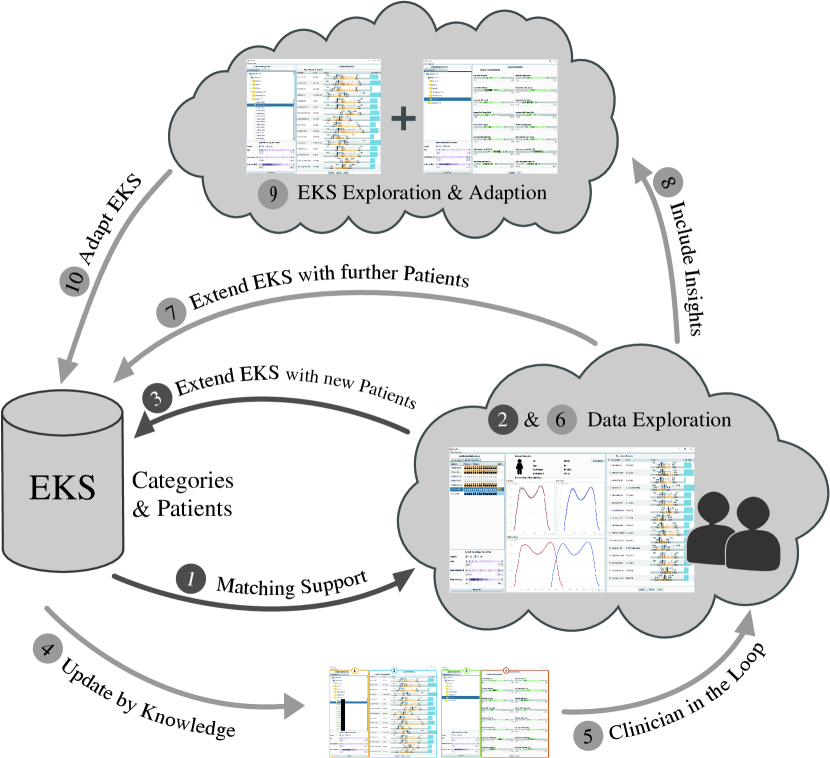
Figure 7 provides an overview of the system’s knowledge generation loop, starting at the dark gray inner loop. In general, the system’s EKS stores all ‘Patient’ data in several ‘Categories’ depending on patients’ pathologies (gait abnormalities) which were generated by former gait analysis sessions. If the clinician loads a new patient file, the calculated STPs will be checked automatically against the EKS (1) to calculate the category matching. Depending on the automated matching calculations, the system provides a visual representation of the results (2). From this point, the clinician can carry out the patient data exploration and analysis, thus, the clinician is an important part of the knowledge generation loop. (3) During the patient data analysis driven by the clinician, the clinician has the ability to include the patient data into a ‘Category’ in the EKS. By adding a new ‘Patient’ to the EKS or setting filters, the system automatically refreshes the matching calculations depending on the explicit knowledge stored in the system (4). This brings the user into the outer (light gray) part of knowledge generation loop. Here the clinician is part of the continuously recurring loop (5), for data exploration (6) and knowledge generation (7). Additionally, the clinician has the ability to continuously include new insights (i.e., gait categorizations, value range limits) (8) depending on ‘Patient’ and ‘Category’ exploration and adjustment (9) to adapt the EKS value ranges, which are predefined by the stored explicit knowledge, for further automated analysis (10).
5 Validation & Results
To validate the KAVAGait system and provide evidence for its effectiveness, we followed a threefold research approach consisting of moderated expert reviews, user studies [40] and a case study with a national expert. All of the insights were documented in detail to ensure reproducibility [50] and used to improve our research prototype. All materials used, such as interview guidelines and tasks, are available as supplemental material (http://phaidra.fhstp.ac.at/o:1928).
5.1 Expert Reviews
In the first step, we conducted iterative expert reviews to eliminate usability issues in the basic functionality and appearance of the interface.
5.1.1 Method
Participants: To validate the visual interface design, we invited three usability experts. Each of them has between two to four years of experience in this field. Two of them are between 20 and 29 years of age and one is between 30 and 39 years of age. All of them have a Master’s degree and advanced or expert knowledge in usability.
Design and Procedure: Each usability expert received a short introduction to the basic features and the workflow of the system. Next, each expert walked through each feature individually and assessed usability issues.
Apparatus and Materials: As evaluation material, we generated builds of KAVAGait in different development states and used them for the iterative expert review sessions performed on a 15′′ notebook with a full HD screen. Each expert review was documented in short notes on paper by the investigator.
5.1.2 Results
The basic color scheme of KAVAGait was found to be easily recognizable. Only the coloring of the ’Categories’ was pointed out as being not well differentiated from the other elements (see Figure 3). The visualization metaphors (boxes, folders and sheets) for the knowledge tree visualization was developed in conjunction with the usability experts to represent a familiar structure to the analysts. The experts suggested that it is necessary that the interface automatically applies the entered parameter if the user left the focus of a filtering input box. Overall, all of the usability experts provided positive feedback on the design structure of the system. All of the expert’s suggestions were used for a redesign and revision of the system in order to prevent the domain users from having basic interface issues.
5.2 User Study
A user study with six gait analysis experts was performed in October 2016 as formative evaluation of usability [51] on the revised system. Each test took approximately 1.5 hours and encompassed four analysis tasks, the system usability scale questionnaire (SUS) [52], and a semi-structured interview built upon 13 main questions to be answered. The user study’s goals (G) and non-goals (NG) are defined as: (G1) Testing the functionality of the research prototype; (G2) Testing the visualization techniques for comprehensibility in relation to the domain; (G3) Testing the utility of knowledge storage and representation in the system; (NG1) Comparison of KAVAGait with another analysis system and (NG2) conducting performance tests, because there was no comparable interactive analysis system found for this domain.
5.2.1 Method
Participants: We invited six gait analysis experts (see Table I) to participate in the user study. One participant had given feedback on sketches and early prototypes previously as a member of the focus group for the user-centered design process (see Section 4). All experts work in the field of clinical gait analysis as physical therapists, bio-medical engineers, or sports scientists. Additionally, all of them are involved in different gait analysis or physical therapy research projects and two of them are also working as physical therapist in a hospital.
| Person (Gender) | Organization | Age | Knowledge | Years in Field | Education |
|---|---|---|---|---|---|
| P1 (f) | F | 40-49 | 2 | 15 | MSc |
| P2 (m) | F | 40-49 | 3 | 15 | PhD |
| P3 (m) | R&F | 30-39 | 2 | 5 | PhD |
| P4 (f) | R | 40-49 | 1 | 1.5 | MSc |
| P5 (f) | F&H | 30-39 | 2 | 10 | MSc |
| P6 (f) | F&H | 20-29 | 2 | 7 | MSc |
Design and Procedure: At the beginning of the user study, each participant was asked about a general impression of the user interface and which functions could be recognized. This step took approximately five minutes. Subsequently, each participant had to solve four guided analysis tasks. The first three included a step-wise introduction to the system and the last one was a combined analysis task to determine the understanding of the system’s workflow (this step was also required for the subsequent SUS questionnaire). Each analysis task was read to the participant at the beginning of the task, and for reference, each task was handed over to the participant in printed form. For the analysis tasks, participants spent approximately 40 minutes. After the analysis task session, each participant had to fill out a standardized SUS questionnaire [52] in less than five minutes. Finally, we performed semi-structured interview sessions with an average duration of 40 minutes. For this, we used an interview guideline consisting of 13 major questions addressing general system usability, filtering, using the ‘explicit knowledge store’ (EKS), and individual visual metaphors used in KAVAGait.
Apparatus and Materials: The user studies were performed in a silent room and the analysis tasks were performed on a 15′′ notebook with full HD screen resolution and an external mouse. As datasets for the analysis tasks, we used two anonymous clinical gait analysis samples recorded by an AUVA clinical gait laboratory. The provided datasets included one healthy and one patient with a gait abnormality. To achieve the best outcome, we asked the participants to apply thinking aloud [53] during the whole analysis task part. For further analysis of the user test, we recorded the screen and the participant using the notebook’s internal webcam. In parallel, the facilitator took notes in our pre-defined test guideline. The SUS questionnaire and semi-structured interview were conducted on paper in the participants’ native language. For the detailed questions, we used small images in the semi-structured interview guidelines to support the participants in recalling the respective parts of KAVAGait.
5.2.2 Results
The following section describes the major findings of each part of the test and summarizes their results.
Analysis Tasks: During the four analysis tasks, all participants described their solutions to the tasks at hand by thinking aloud. They expressed problems as well as benefits of KAVAGait during their work. One major problem during the test was that the participants tried to find out which rectangle in the graphical summary, displayed in the knowledge table, relates to which ‘Interactive Twin Box Plot’ (ITBP) in the parameter explorer [P2, P3, P5, P6]. In relation to the graphical summary, all participants understood the gray rectangle, the empty black frame and the black rectangle shape encoding the matching of the individual parameters in relation to ’no data available’, ’out of range’ and ’is in range’. Four out of six participants stated during the third analysis task that they confirm the automated matching result after comparing to the vertical ground reaction force () data. In general, all participants stated that the automated matching can be used as a guided entry point for further analysis using the twin box plots to analyze the patients’ data in detail. Additionally, all participants handled the tasks depending on the knowledge exploration or own knowledge externalization very well. They understood the knowledge tree organization metaphors (boxes, folders and sheets) visualizing categories and individual persons.
System Usability Scale (SUS): By applying the SUS, we were able to obtain a good indication concerning the handling of our KAVAGait system. The results show a SUS value of 80 points in average out of 100, which can be interpreted as good without significant usability issues according to the SUS description by Bangor et al. [54]. Comparing 500 SUS scores, Sauro [55] found that only 10% of systems reached an SUS score greater than 80.
Semi-structured Interviews: Next, we present the results of the performed interviews, which were structured along 13 main questions. The detailed evaluation of the interviews can be found in our supplement material (http://phaidra.fhstp.ac.at/o:1928).
All participants attending the user study confirmed a very clear system design. The used visualization metaphors are described as well interpretable, the color scheme is conclusive and the calculated matching acts trustworthy. The integrated filter options for data reduction make sense and are understandable. The various visualization options included in KAVAGait and the curves and box plots contributed very well and were considered understandable. Only one participant, P6, indicated that it was not clear how the ’Category Difference’ was calculated.
Generally, all participants told us that they readily understood the EKS, including the ability to compare newly loaded patients to the EKS for categorization. Additionally, a single system would be very beneficial as well as a shared EKS. The knowledge representation options (’Knowledge Tree’, ’Knowledge Table’, ‘Hatching Range Slider’ (HRS) and ITBP) were described as very helpful and good for quick decision making. They described that it was easy to get an overview of the loaded patient in relation to the ’Norm Data Category’ and the ’Selected Category’ based on the ITBPs. Thus, the analyst has the ability to navigate through the data or to rely on the EKS based matches. Additionally, the participants referred to the categories of the EKS, including patient data of prior analysis, as well as to the different representations in the ’Knowledge Table’. Four out of six participants reported that based on the ITBP the sharp distinction, interval range, variance, differences and relationships can be derived for the analysis.
All participants noted that they have understood the saving process to the EKS. The category in which a patient is stored should appear subsequently. As ’nice to haves’, a separated saving area for not yet diagnosed patients and the ability for annotations would be helpful. The separated category should not be included in the automated matching calculations. Furthermore, all participants reported that they understood the symbols represented in the ’Knowledge Tree’ of the EKS but most of them did not assign any further meaning to them. Based on the different colors it was easy for the participants to distinguish the different EKS levels.
In relation to the ’Knowledge Table’, the participants classified the ’Graphical Summary’ as very helpful. Only two participants had small issues at the beginning when interpreting this visualization metaphor. Based on the coloring and the boxes for the parameters it was easy to understand the matching results. The matching criterion was indicated as helpful and good starting and orientation point for analysis. Some participants argued that a connection based on sequence numbers between the ’Graphical Summary’ and the ITBPs would be very helpful. This suggestion and other suggestions were subsequently implemented as shown in Figure 3. The range slider shading and its usability for range assessment was quickly recognized by most of the participants (e.g., used for filtering, category parameter exploration and adjustment). The shading gave an overview of the underlying data derivation and outliers. Additionally, it helps to explain the ITBPs shape.
All participants had prior exposure to statistical box plots and therefore readily understood the ITBPs. They noted that this metaphor contains a lot of information but it is clearly structured. Additionally, some participants stated that the usage of the same color will be better understandable when selecting the ’Norm Data Category’ for comparison in the ITBP (see Section 4) in the future. The comparison of a (newly loaded) patient with the ’Norm Data Category’ and a ’Selected Category’ based on the ITBPs was described as helpful. It is possible to see the differences of the individual category parameter, but you have to know how to interpret them.
In general, the KAVAGait system was described as very innovative and helpful for the analysts by providing automated analysis and pointing out possible reasons to be respected in clinical decision making.
5.3 Case Study
After finalizing the expert review and the user study we made the following improvements before conducting the final case study: 1) ID numbers for parameter identification were added to the ITBP and the ‘Graphical Summary’; 2) The coloring scheme of the ITBP was improved; 3) Tool tips were added to all elements; 4) The entire labeling used in the system was checked for consistency.
5.3.1 Method
Participants: For our case study, we invited one leading national expert for gait rehabilitation to test and comment on our novel KAVAGait system. The expert has more than one decade of experience in conducting clinical gait analysis. Thus, the expert is comfortable in identifying gait patterns based on the representation of ground reaction forces (GRFs) and the calculated spatio-temporal parameters (STPs).
Design and Procedure: At first, the expert received a short introduction, in the form of a presentation, about the basic features and workflow of the system. Next, the expert walked through each feature individually by an example and was asked to critically comment on the system. Additionally, the expert could choose different patients from our data pool to explore them and tell us new insights gained using KAVAGait.
Apparatus and Materials: We met in the expert’s office room to perform our case study. As materials, we used a short presentation of the KAVAGait system and a build of the revised prototype including 489 anonymized patients in the ‘Norm Data Category’ and 50 patients for each out of four patient categories (ankle, calcaneus, hip and knee associated gait abnormalities). The case study was performed in the same setup as in the user study before. The suggestions and comments stated by the expert were documented by the presenter and one observer.
5.3.2 Results
The expert initially noted that a clinician normally focuses on two major aspects. Firstly, they look for asymmetries comparing the STPs between the left and the right foot and secondly for deviations of them regarding to the norm data.
EKS Patient Exploration: The expert randomly selected a patient stored in the ‘Norm Data Category’. Generally, the expert found an added value in relation to the ITBP representation for the STPs. A key statement by the expert was: “You do not have to hit the median value directly, it is more important if the parameter values for the left and the right foot are looking similar” near to the median value of the ‘Norm Data Category’. By randomly selecting a patient from the ‘Knee Category’ for exploration, the expert was immediately able to sort the STPs. An additional suggestion was to provide the ability to select two groups for comparison. In this case, for example, the expert could compare the ‘Knee Category’ to the ‘Ankle Category’ without changing by viewing the related mean curves of each category with their associated one-standard deviation bands. Additionally, a more detailed separation of the datasets (e.g., for abnormalities in the left, the right or both feet) in the EKS was stated as helpful to activate and deactivate these groups directly in the future.
New Patient Data Exploration: To test the analysis abilities of KAVAGait, the expert successively loaded four clinical gait analysis records, which were containing gait abnormalities (1x norm, 2x hip, 1x ankle). Two of these examples are illustrated in Figure 8. The representation of the individual steps represented as light gray curves in the background with their corresponding mean value curve was described as very helpful. The expert analyzed each loaded patient file exactly with regard to the , the calculated parameters represented in ITBPs, and the system-internal computed matching based on the EKS. During the case study, several of the assessed records indicated multiple matching to different gait patterns (which were reported in the ‘Knowledge Table’). The expert was able to confirm the EKS based matching results, and reported that the system was of valuable support during gait record examination. This can be attributed to the fact that the patients usually undergo a therapy for a specific problem. However, KAVAGait also recognizes abnormalities in other joints caused by specific problems. The expert stated that the community has always been aware that one abnormality can lead to others, but it has never been so well presented.
Concluding Discussion: To date the system only incorporates a total of approximately 500 patients. Thus, in each category the chance for imbalances between sub-groups, such as defined by gender, age, body mass, or height may be present. These in consequence, may introduce a bias when calculating the final matching. Future prospects may include a direct connection the AUVA database to include a sufficient and representative number of patients per class to overcome this problem.
The expert also noted, that a further development could be to visualize and store additionally derived and commonly used discrete parameters (next to the STPs) from the entire GRF curves, such as local minima and maxima, loading rates, among many others. This would further strengthen the system’s capabilities of describing a patient’s gait performance. Another feature, noted to be of valuable interest, would be the possibility to compare a patient with earlier treatments. This would help to visualize the entire rehabilitation process over time.
In general, the expert outlined that the system supports the process of gait assessment in several ways: 1) The system easily allows to compare new patient data to stored EKS data, and thus helps to gather a more conclusive picture of the patient’s gait performance, which was not possible in clinical practice before. 2) The matching criteria of KAVAGait helps to clearly visualize and identify secondary gait impairments. This is very important, as during clinical examination secondary gait impairments are easily overlooked. 3) The ability to compare the norm data with a selected category for direct comparison based on the ITBP is very helpful to gain further insights into the patient’s gait performance and possible impairments. 4) In addition, the KAVAGait system is also well suited for educational training of unexperienced clinicians. Overall, the expert described KAVAGait as an excellent and helpful analysis tool for clinical practice.
6 Reflection & Conclusion
Following the design study methodology of Sedlmair et al. [10], the reflection (including retrospective analysis and lessons learned) is the third contribution of a design study which enables the improvement of current guidelines. The following paragraphs describe the reflection in line with the initially stated requirements from Section 3.3 (R1 – R4).
R1 Data: The data structure resulting from force plate recordings, are synchronized time series data of the ground reaction forces (GRF). Especially in a clinical gait analysis setting, these data comprise time series of two force plates (one per foot). Based on these data, we calculated 16 additional STPs (spatio-time parameters) parameters, which were used for automated and visual comparison. On the one hand, we designed the ‘Graphical Summary’ for data comparison, showing the analyst how a single patient parameter is related to the parameter set of a category. On the other hand, we designed the ‘Interactive Twin Box Plot’ (ITBP) for detailed inter-category parameter comparison between the ‘Norm Data Category’, a ‘Selected Category’ of a specific gait pattern and the patient to analyze.
R2 Visual Representation: In general, the decision for an interface providing a clear structure and understandable visual representations was well received. It was easy for the domain experts in our validation to understand the handling and to work with it. Additionally, they appreciated the prototype’s wide range of coordinated features, which they regarded as useful for data exploration and analysis while not being overloaded. A particularly interesting outcome of the tests from the visualization design perspective was, that the HRS are very useful for a parameter overview and range adjustments during patient data exploration as well as for the ‘explicit knowledge store’ (EKS) exploration and adaption. Additionally, the ITBPs were considered as well-suited for intercategory comparison in relation to a single patient parameter. This way, it is possible to see how well the patient develops in the direction of the ‘Norm Data Category’ for example. Another particularly notable outcome is that the ‘Graphical Summary’ and the ‘Matching Criteria’, represented in the ‘Knowledge Table’, were described as very valuable by the national gait rehabilitation expert. To date the system only provides information of the vertical GRF component. To increase the quality of the analysis, in the future we will extend the visualization to all three force components of the GRFs. In addition, we will also add discrete key GRF parameters of those components to further improve automated analysis and exploration. Additionally, direct comparisons of left and right foot (i.e., gait asymmetry indices [56]) need to be integrated in the twin box plots.
R3 Workflow: All included filter methods and the dynamic query concept providing a very fast response in KAVAGait were very well received. In general, the participants described the filtering, analysis, and exploration abilities as intuitive and the usage and adaption of the EKS as easy to use. Our national expert mentioned that KAVAGait is very valuable and suits several use cases, such as support for clinical experts, assistance for less experienced clinicians, and learning and training opportunities for students. Based on the insights we gained during our validation studies we found that for the participants and the national expert, the visual representations of the expert knowledge and the handling of the EKS was simple to understand and to use. To further improve the workflow, the ability to annotate the patients’ data would be a helpful feature.
R4 Expert Knowledge: As previously mentioned, the ‘Knowledge Tree’ and the ‘Knowledge Table’ of the EKS were well received by the participants and the case study member. The knowledge organization as boxes, folders (categories), and sheets (patients) was well received by most of the participants. Based on the counter after each category (see Figures 3:1 and 3:3), it was easy to understand how meaningful the data are for comparison and to get an overview of the included data. In future explicit knowledge should also be used in the VA workflow to train machine learning methods for improved automated categorization.
6.1 Lessons Learned
As described in Section 3, clinicians currently are using non-interactive line plots and tables. For clinical decision making they are using their implicit knowledge based on several years of experience. During this design study, we learned that explicit knowledge extracted from the clinicians implicit knowledge opens the possibility to support clinicians during clinical decision making. Additionally, KAVAGait could also be used to share the knowledge of domain experts and for educational support.
For keeping up with the large number of patients stored in the EKS, clinical gait analysts need to continuously adapt the systems settings during the clinical decision making process. Supporting such interactive workflows is a key strength of visualization systems. Clinical gait analysis in particular profits from extensive interaction and annotation because it is a very knowledge-intensive job. By providing knowledge-oriented interactions, externalized knowledge can subsequently be used in the analysis process to support the clinicians. Our newly developed visual metaphors provide an easy way to inspect variability of the data (e.g., standard deviation), allow to identify outliers in the data, and provide an easy to understand overview of the data and automated matching results (as demonstrated in Figure 3:1a). Additionally, based on the ITBPs it is possible to perform intercategory and patient comparisons by details on demand to find similarities in the data.
6.2 Limitations & Future Directions
KAVAGait is a design study investigating how interactive knowledge-assisted VA methods can aid clinical decision making in the context of gait analysis. Since the system is still a proof of concept, some limitations exist. These, however, point out future directions of research in both areas, VA and clinical gait analysis. Currently, the proposed system only incorporates the vertical ground reaction force component, as used by several studies [57, 58]. Nevertheless, it is subject to future work to include the other force components as well. This will help the clinicians to get a more holistic view of one’s gait performance and will further strengthen the system’s capability in supporting clinical practice. Another limitation might be associated with the defined parameters for matching and comparing purpose. To date only a set of the most commonly used STPs are included. However, there are several other discrete parameters that could be used for analysis and matching purpose. Research has shown that sophisticated machine learning algorithms bear the potential to identify and cluster gait patterns [59, 60]. For example automated patient categorization based on unsupervised (e.g., [61]) and supervised (e.g., [62]) approaches might be interesting. Both aspects will support in drawing more precise medical decisions based on the data available. Results, however, clearly state, that the entire waveforms as input variables result in higher classification accuracies than using discrete parameterization techniques. Thus, future work might opt to include both, discrete parameters to inform clinicians and machine learning techniques, which use the entire waveforms, to allow for more advanced pattern recognition abilities and classification functionalities. Another future direction might be to provide the ability for searching the most similar dataset stored in the EKS to the currently viewed patient data. At this time, such a mechanism is not included in KAVAGait. Currently, KAVAGait offers the ability for comparison of each parameter for both feet of one patient. Gait symmetry plays a key role for clinicians in analyzing and interpreting gait data. To date KAVAGait only allows for visual inspection of parameters of the left and right body side. To increase the quality of such comparisons, parameters such as the ‘gait asymmetry index’ (GAI) might be valuable and should be included in future versions (e.g., [63]). Finally, the clinical decision support provided by KAVAGait needs to be evaluated for the effect of cognitive biases such as the confirmation bias [64] that might increase due to previously externalized knowledge and interactive steering. KAVAGait addresses such concerns by prominently providing clinicans with raw GRFs displayed as curves. Our interviews indicate that these GRF curves are always considered in decision making. A further research direction is also the integration of information on provenance and certainty into the EKS.
6.3 Comparison to the State-of-the-Art
From a visual analytics perspective, this is the first design study in clinical gait analysis. Related work on human motion analysis [17, 18, 19] focuses on clustering of motion segments recorded by a tracking system. The gait analysis systems used in clinical practice typically come with gait analysis hardware and present the collected data of only one measurement session (of one patient) in a non-interactive interface, as line plots in combination with several calculated discrete parameters. In contrast to those, KAVAGait enables the comparison of a patient’s measurements with an entire knowledge store of pre-categorized measurement sessions (potentially thousands of previous measurements), interactive filtering, and the creation of new knowledge. Hence, a direct comparison between KAVAGait and currently available systems would be limited in terms of validity. KAVAGait uses analytical and visual representation methods to provide a scalable and problem-tailored visualization solution following the VA agenda [6, 7] and none of the existing systems provides a comparable basis.
6.4 Transferability & Generalization
The knowledge generation loop (see Figure 7) can be generalized for other domains taking into account domain-specific data structures and patterns of interest. In the recently published “Conceptual Model of Knowledge-Assisted Visual Analytics” by Federico and Wagner et al. [65], KAVAGait serves case study of how explicit knowledge is integrated in VA workflows. On a general level, the workflows for knowledge generation and extraction always need to involve the human expert. The methods to integrate knowledge and their applicability, generally depend on the type of the underlying data and the way how the explicit knowledge can be stored and connected to data. In context of KAVAGait , we focused on easy to understand parameter summarizations (‘Graphical Summary’) including automated matchings, the HRS for deviation and outliers observation and the ITBP for the comparison of different categories whereby each ITBP is used for one parameter set.
Acknowledgments
This work was supported by the Austrian Science Fund (FWF): P25489-N23 (“KAVA-Time”) and by the NFB – Lower Austrian Research and Education Company and the Provincial Government of Lower Austria, Dep. of Science and Research (“IntelliGait” LSC14-005). Cordial thanks to Marianne Worisch, Christina Niederer, and Niklas Thür for their support and to Tarique Siragy for proofreading. Special thanks to all focus group members and test participants who have agreed to volunteer in this project.
References
- [1] W. Erickson, C. Lee, and S. von Schrader, “2014 Disability Status Report: United States,” Cornell University Yang Tan Institute of Employment and Disability (YTI), Ithaca, NY, Tech. Rep., 2016. [Online]. Available: http://www.disabilitystatistics.org/
- [2] B. Nigg and W. Herzog, Biomechanics of the musculo-skeletal system, 3rd ed. Hoboken NJ: Wiley, 2007.
- [3] D. A. Winter, Biomechanics and motor control of human movement, 3rd ed. Hoboken NJ: Wiley, 2005.
- [4] A. Cappozzo, U. Della Croce, A. Leardini, and L. Chiari, “Human movement analysis using stereophotogrammetry: Part 1. theoretical background,” Gait & Posture, vol. 21, no. 2, pp. 186–196, 2005.
- [5] C. Kirtley, Clinical gait analysis theory and practice. Edinburgh: Elsevier, 2006.
- [6] J. J. Thomas and K. A. Cook, Eds., Illuminating the path: The research and development agenda for visual analytics. IEEE Comp. Society Press, 2005.
- [7] D. Keim, J. Kohlhammer, G. Ellis, and F. Mansmann, Eds., Mastering the information age: solving problems with visual analytics. Goslar, Germany: Eurographics, 2010.
- [8] M. Chen, D. Ebert, H. Hagen, R. Laramee, R. Van Liere, K.-L. Ma, W. Ribarsky, G. Scheuermann, and D. Silver, “Data, information, and knowledge in visualization,” IEEE Computer Graphics and Applications, vol. 29, no. 1, pp. 12–19, 2009.
- [9] X. Wang, D. H. Jeong, W. Dou, S.-W. Lee, W. Ribarsky, and R. Chang, “Defining and applying knowledge conversion processes to a visual analytics system,” Computers & Graphics, vol. 33, no. 5, pp. 616–623, 2009.
- [10] M. Sedlmair, M. Meyer, and T. Munzner, “Design study methodology: Reflections from the trenches and the stacks,” IEEE Trans. Vis. and Comp. Graphics, vol. 18, no. 12, pp. 2431–2440, 2012.
- [11] T. Munzner, “A nested model for visualization design and validation,” IEEE Trans. Vis. and Comp. Graphics, vol. 15, no. 6, pp. 921–928, 2009.
- [12] G. Andrienko, N. Andrienko, P. Bak, D. Keim, and S. Wrobel, Visual analytics of movement. Berlin: Springer, 2013.
- [13] C. Perin, R. Vuillemot, and J. D. Fekete, “SoccerStories: A kick-off for visual soccer analysis,” IEEE Trans. Vis. and Comp. Graphics, vol. 19, no. 12, pp. 2506–2515, Dec. 2013.
- [14] H. Janetzko, D. Sacha, M. Stein, T. Schreck, D. A. Keim, and O. Deussen, “Feature-driven visual analytics of soccer data,” in IEEE Conference on Visual Analytics Science and Technology (VAST), Oct. 2014, pp. 13–22.
- [15] M. Stein, H. Janetzko, A. Lamprecht, T. Breitkreutz, P. Zimmermann, B. Goldlücke, T. Schreck, G. Andrienko, M. Grossniklaus, and D. A. Keim, “Bring it to the pitch: Combining video and movement data to enhance team sport analysis,” IEEE Trans. Vis. and Comp. Graphics, vol. 24, no. 1, pp. 13–22, 2018.
- [16] D. H. S. Chung, M. L. Parry, I. W. Griffiths, R. S. Laramee, R. Bown, P. A. Legg, and M. Chen, “Knowledge-assisted ranking: A visual analytic application for sports event data,” IEEE Computer Graphics and Applications, vol. 36, no. 3, pp. 72–82, May 2016.
- [17] A. Vögele, B. Krüger, and R. Klein, “Efficient Unsupervised Temporal Segmentation of Human Motion,” in Proceedings of the ACM SIGGRAPH/Eurographics Symposium on Computer Animation, ser. SCA ’14. Aire-la-Ville, Switzerland: Eurographics, 2014, pp. 167–176.
- [18] J. Bernard, N. Wilhelm, B. Krüger, T. May, T. Schreck, and J. Kohlhammer, “MotionExplorer: Exploratory Search in Human Motion Capture Data Based on Hierarchical Aggregation,” IEEE Trans. Vis. and Comp. Graphics, vol. 19, no. 12, pp. 2257–2266, Dec. 2013.
- [19] S. Jang, N. Elmqvist, and K. Ramani, “Motionflow: Visual abstraction and aggregation of sequential patterns in human motion tracking data,” IEEE Trans. on Vis. and Comp. Graphics, vol. 22, no. 1, pp. 21–30, Jan 2016.
- [20] O. Purwantiningsih, A. Sallaberry, S. Andary, A. Seilles, and J. Azé, “Visual analysis of body movement in serious games for healthcare,” in IEEE Pacific Visualization Symposium (PacificVis), Apr. 2016, pp. 229–233.
- [21] N. Wilhelm, A. Vögele, R. Zsoldos, T. Licka, B. Krüger, and J. Bernard, “FuryExplorer: Visual-Interactive Exploration of Horse Motion Capture Data,” in Visualization and Data Analysis (VDA 2015), Feb. 2015.
- [22] W. Aigner, S. Miksch, H. Schumann, and C. Tominski, Visualization of Time-Oriented Data. London: Springer, 2011.
- [23] E. R. Tufte, The Visual Display of Quantitative Information. Cheshire, CT: Graphics Press, 1983.
- [24] J. Heer, N. Kong, and M. Agrawala, “Sizing the horizon: The effects of chart size and layering on the graphical perception of time series visualizations,” in Proceedings of the SIGCHI Conference on Human Factors in Computing Systems (SIGCHI). ACM, 2009, pp. 1303–1312.
- [25] W. Javed, B. McDonnel, and N. Elmqvist, “Graphical perception of multiple time series,” IEEE Trans. Vis. and Comp. Graphics, vol. 16, no. 6, pp. 927–934, Dec. 2010.
- [26] P. Federico, S. Hoffmann, A. Rind, W. Aigner, and S. Miksch, “Qualizon Graphs: Space-efficient time-series visualization with qualitative abstractions,” in Proc. 2014 Int. Working Conf. Advanced Visual Interfaces, AVI. ACM, 2014, pp. 273–280.
- [27] P. McLachlan, T. Munzner, E. Koutsofios, and S. North, “LiveRAC: Interactive visual exploration of system management time-series data,” in Proceedings of the SIGCHI Conference on Human Factors in Computing Systems (SIGCHI). ACM, 2008, pp. 1483–1492.
- [28] M. Wagner, A. Rind, N. Thür, and W. Aigner, “A knowledge-assisted visual malware analysis system: design, validation, and reflection of KAMAS,” Computers & Security, vol. 67, pp. 1–15, 2017.
- [29] T. Wu, Y. Wu, C. Shi, H. Qu, and W. Cui, “PieceStack: Toward better understanding of stacked graphs,” IEEE Trans. Vis. and Comp. Graphics, vol. 22, no. 6, pp. 1640–1651, Jun. 2016.
- [30] S. Havre, E. Hetzler, P. Whitney, and L. Nowell, “ThemeRiver: Visualizing thematic changes in large document collections,” IEEE Trans. Vis. and Comp. Graphics, vol. 8, no. 1, pp. 9–20, 2002.
- [31] P. Federico, J. Unger, A. Amor-Amorós, L. Sacchi, D. Klimov, and S. Miksch, “Gnaeus: Utilizing Clinical Guidelines for Knowledge-assisted Visualisation of EHR Cohorts,” in Proceedings of the EuroVis Workshop on Visual Analytic, EuroVA, E. Bertini and J. C. Roberts, Eds. EG, 2015.
- [32] S. Haroz, R. Kosara, and S. Franconeri, “The connected scatterplot for presenting paired time series,” IEEE Trans. Vis. and Comp. Graphics, vol. 22, no. 9, pp. 2174–2186, 2016.
- [33] J. Bernard, N. Wilhelm, M. Scherer, T. May, and T. Schreck, “TimeSeriesPaths: Projection-based explorative analysis of multivariate time series data,” Journal of WSCG20, vol. 20, no. 2, pp. 97–106, 2012.
- [34] T. Schreck, J. Bernard, T. v. Landesberger, and J. Kohlhammer, “Visual cluster analysis of trajectory data with interactive Kohonen maps,” Information Visualization, vol. 8, no. 1, pp. 14–29, Mar. 2009.
- [35] A. Hakone, L. Harrison, A. Ottley, N. Winters, C. Gutheil, P. K. J. Han, and R. Chang, “PROACT: Iterative design of a patient-centered visualization for effective prostate cancer health risk communication,” IEEE Trans. Vis. and Comp. Graphics, vol. 23, no. 1, pp. 601–610, 2017.
- [36] M. Glueck, M. P. Naeini, F. Doshi-Velez, F. Chevalier, A. Khan, D. Wigdor, and M. Brudno, “PhenoLines: Phenotype comparison visualizations for disease subtyping via topic models,” IEEE Trans. Vis. and Comp. Graphics, vol. 24, no. 1, pp. 371–381, 2018.
- [37] A. Dasgupta, J.-Y. Lee, R. Wilson, R. A. Lafrance, N. Cramer, K. Cook, and S. Payne, “Familiarity vs trust: A comparative study of domain scientists’ trust in visual analytics and conventional analysis methods,” IEEE Trans. Vis. and Comp. Graphics, vol. 23, no. 1, pp. 271–280, Jan. 2017.
- [38] S. Miksch and W. Aigner, “A matter of time: Applying a data-users-tasks design triangle to visual analytics of time-oriented data,” Computers & Graphics, vol. 38, pp. 286–290, 2014.
- [39] H. Sharp, Y. Rogers, and J. Preece, Interaction Design: Beyond Human-Computer Interaction, 2nd ed. Chichester: Wiley, 2007.
- [40] J. Lazar, J. H. Feng, and H. Hochheiser, Research Methods in Human-Computer Interaction, 1st ed. Chichester: Wiley, 2010.
- [41] O. Tirosh, R. Baker, and J. McGinley, “GaitaBase: Web-based repository system for gait analysis,” Computers in Biology and Medicine, vol. 40, no. 2, pp. 201–207, 2010.
- [42] J. Hamill and K. M. Knutzen, Biomechanical Basis of Human Movement. Lippincott Williams & Wilkins, 2006.
- [43] R. Baker, Measuring walking: a handbook of clinical gait analysis. London: Mac Keith Press, 2013.
- [44] O. Kulyk, R. Kosara, J. Urquiza, and I. Wassink, “Human-centered aspects,” in Human-Centered Visualization Environments, A. Kerren, A. Ebert, and J. Meyer, Eds. Springer, 2007, pp. 13–75.
- [45] R. Fabian, “Data-Oriented Design,” 2013. [Online]. Available: http://www.dataorienteddesign.com/dodmain/dodmain.html
- [46] R. A. Fisher, “The use of multiple measurements in taxonomic problems,” Annals of eugenics, vol. 7, no. 2, pp. 179–188, 1936.
- [47] S. G. Eick, “Data visualization sliders,” in Proc. User Interface Software and Technology (UIST). ACM, 1994, pp. 119–120.
- [48] C. Ware, Information Visualization: Perception for Design, 3rd ed. San Francisco, CA: Morgan Kaufmann, 2013.
- [49] B. Shneiderman, “The eyes have it: a task by data type taxonomy for information visualizations,” in IEEE Symposium on Visual Languages, 1996, pp. 336–343.
- [50] M. Smuc, G. Schreder, E. Mayr, and F. Windhager, “Should we dream the impossible dream of reproducibility in Visual Analytics evaluation?” in EuroVis Workshop on Reproducibility, Verification, and Validation in Visualization (EuroRV3). Eurographics, 2015.
- [51] A. Cooper, R. Reimann, and D. Cronin, About Face 3: The Essentials of Interaction Design, 3rd ed. Indianapolis, IN: Wiley, May 2007.
- [52] J. Brooke, “SUS–a quick and dirty usability scale,” Usability evaluation in industry, vol. 189, no. 194, pp. 4–7, 1996.
- [53] J. Nielsen, Usability engineering. Boston: Academic Press, 1993.
- [54] A. Bangor, P. Kortum, and J. Miller, “Determining what individual SUS scores mean: Adding an adjective rating scale,” J. Usability Studies, vol. 4, no. 3, pp. 114–123, 2009.
- [55] J. Sauro. (2011) Measuring usability with the system usability scale (SUS): MeasuringU. http://www.measuringu.com/sus.php, [cited: 2016-11-16].
- [56] S. Cabral, R. A. Resende, A. C. Clansey, K. J. Deluzio, W. S. Selbie, and A. P. Veloso, “A global gait asymmetry index,” Journal of applied biomechanics, vol. 32, no. 2, pp. 171–177, 2016.
- [57] A. Muniz and J. Nadal, “Application of principal component analysis in vertical ground reaction force to discriminate normal and abnormal gait,” Gait & Posture, vol. 29, no. 1, pp. 31–35, 2009.
- [58] C. A. Lozano-Ortiz, A. M. Muniz, and J. Nadal, “Human gait classification after lower limb fracture using artificial neural networks and principal component analysis,” in International Conference of the IEEE Engineering in Medicine and Biology Society. IEEE, 2010, pp. 1413–1416.
- [59] D. P. Soares, M. P. de Castro, E. A. Mendes, and L. Machado, “Principal component analysis in ground reaction forces and center of pressure gait waveforms of people with transfemoral amputation,” Prosthetics and orthotics international, vol. 40, no. 6, pp. 729–738, 2016.
- [60] W. Zeng, F. Liu, Q. Wang, Y. Wang, L. Ma, and Y. Zhang, “Parkinson’s disease classification using gait analysis via deterministic learning,” Neuroscience Letters, vol. 633, pp. 268–278, Oct. 2016.
- [61] J. Christian, J. Kröll, G. Strutzenberger, N. Alexander, M. Ofner, and H. Schwameder, “Computer aided analysis of gait patterns in patients with acute anterior cruciate ligament injury,” Clinical Biomechanics, vol. 33, pp. 55–60, 2016.
- [62] J. Pauk and K. Minta-Bielecka, “Gait patterns classification based on cluster and bicluster analysis,” Biocybernetics and Biomedical Engineering, vol. 36, no. 2, pp. 391–396, 2016.
- [63] W. Herzog, B. M. Nigg, L. J. Read, and E. Olsson, “Asymmetries in ground reaction force patterns in normal human gait,” Medicine and Science in Sports and Exercise, vol. 21, no. 1, pp. 110–114, 1989.
- [64] R. S. Nickerson, “Confirmation bias: A ubiquitous phenomenon in many guises.” Review of General Psychology, vol. 2, no. 2, pp. 175–220, 1998.
- [65] P. Federico, M. Wagner, A. Rind, A. Amor-Amorós, S. Miksch, and W. Aigner, “The role of explicit knowledge: A conceptual model of knowledge-assisted visual analytics,” in IEEE Conference on Visual Analytics Science and Technology (VAST). IEEE, 2017.
![[Uncaptioned image]](/html/1707.06105/assets/Fotos/MW.jpeg) |
Markus Wagner is a research associate at the Institute of CreativeMedia/Technologies, St. Pölten University of Applied Sciences (Austria) since 2014. He received his PhD in Computer Science from TU Wien (Austria) in June 2017 with highest distinction. His research interests involve knowledge-assisted information visualization and visual analytics methods. |
![[Uncaptioned image]](/html/1707.06105/assets/Fotos/DS.jpeg) |
Djordje Slijepčević is a research associate at the Institute of CreativeMedia/Technologies, St. Pölten University of Applied Sciences (Austria) and a PhD student at the Faculty of Informatics at TU Wien (Austria). His research focuses on feature learning, pattern recognition and machine learning. He graduated from TU Wien (Austria) with a MSc in Computer Engineering. |
![[Uncaptioned image]](/html/1707.06105/assets/Fotos/BH.jpeg) |
Brian Horsak holds a doctorate degree in Biomechanics and Kinesiology. He is researcher at the St. Pölten University of Applied Sciences (Austria) in the Department of Health Sciences. His research focuses on musculoskeletal loading of the lower extremities during locomotion and on innovative technologies supporting patients and therapists during rehabilitation. |
![[Uncaptioned image]](/html/1707.06105/assets/Fotos/AR.jpeg) |
Alexander Rind is a research associate at the Institute of CreativeMedia/Technologies, St. Pölten University of Applied Sciences (Austria) and a PhD student at the Faculty of Informatics at TU Wien (Austria). Alexander studied Business Informatics in Vienna and Lund and received his MSc degree from TU Wien. His research focuses on interaction and knowledge in visual analytics and visualization for health care. |
![[Uncaptioned image]](/html/1707.06105/assets/Fotos/MZ.jpeg) |
Matthias Zeppelzauer is a senior researcher at the Institute of CreativeMedia/Technologies at St. Pölten University of Applied Sciences (Austria) since 2013. He received his PhD in Computer Science from TU Wien (Austria) in 2011 with highest distinction. His research focuses on multimedia signal processing, pattern recognition and machine learning. |
![[Uncaptioned image]](/html/1707.06105/assets/Fotos/WA.jpeg) |
Wolfgang Aigner is the scientific director of the Institute of CreativeMedia/Technologies at St. Pölten University of Applied Sciences (Austria) and adjunct professor at TU Wien (Austria). He received his PhD degree and habilitation in computer science from TU Wien in 2006 and 2013. His main research interests include visual analytics and information visualization with a particular focus on time-oriented data. |