Laser induced fluorescence for axion dark matter detection:
a feasibility study in YLiF4:Er3+
Abstract
We present a detection scheme to search for QCD axion dark matter, that is based on a direct interaction between axions and electrons explicitly predicted by DFSZ axion models. The local axion dark matter field shall drive transitions between Zeeman-split atomic levels separated by the axion rest mass energy . Axion-related excitations are then detected with an upconversion scheme involving a pump laser that converts the absorbed axion energy ( hundreds of eV) to visible or infrared photons, where single photon detection is an established technique. The proposed scheme involves rare-earth ions doped into solid-state crystalline materials, and the optical transitions take place between energy levels of electron configuration. Beyond discussing theoretical aspects and requirements to achieve a cosmologically relevant sensitivity, especially in terms of spectroscopic material properties, we experimentally investigate backgrounds due to the pump laser at temperatures in the range K. Our results rule out excitation of the upper Zeeman component of the ground state by laser-related heating effects, and are of some help in optimizing activated material parameters to suppress the multiphonon-assisted Stokes fluorescence.
Valid PACS numbers may be entered using the \pacs{#1} command.
pacs:
Valid PACS appear hereI Introduction
The nature of particle dark matter (DM) is the most long standing question in Big Bang cosmology, and direct searches may shed light on this intriguing mystery. The non-detection of DM in the heavy mass range (10 GeV to 10 TeV) Aprile and et al. (2017); Akerib and et al. (2017); Agnese and et al. (2017) has motivated the scientific community to focus theoretical and experimental efforts on much lower mass particles Essig et al. (2012); Kouvaris and Pradler (2017). Among them, a well motivated light particle is the QCD axion Wilczek (1978); Weinberg (1978), introduced by Peccei-Quinn to solve the strong CP problem Peccei and Quinn (1977). Axion physical properties are described by several models that can be grouped into the KSVZ Kim (1979); Shifman et al. (1980) and DFSZ classes Zhitnitsky (1980); Dine et al. (1981); Dine and Fischler (1983), depending on zero or full axion coupling strength to leptons, respectively. Even so, an almost model-independent statement holds for the axion mass
| (1) |
where is the Peccei-Queen symmetry-breaking energy scale, inversely proportional to the coupling strenghts with standard model particles Wilczek (1978); Weinberg (1978). A light and stable axion emerges as an ideal DM candidate if large are considered. Due to the resulting huge occupation number, galactic halo axions can be described as a classical oscillating field , with oscillation frequency Sikivie (1983). The eV axion mass range has since long been favoured by astrophysical and cosmological bounds Raffelt (2008), while very recent high-temperature lattice QCD calculations suggest that eV Borsanyi et al. (2016).
The axion is intensively searched in haloscope experiments Marsh (2016), mostly based on resonant axion-photon conversion in a static magnetic field via Primakoff effect Sikivie (1983). The Axion Dark Matter eXperiment (ADMX) is the most sensitive haloscope detector based on high quality factor microwave resonators at cryogenic temperature. ADMX searches have excluded the mass range eV Asztalos et al. (2010); Sloan et al. (2016). The experiment HAYSTAC (formally ADMX-High Frequency) Brubaker et al. (2017), designed specifically to search for axions in the eV range ( GHz), has recently reached cosmologically relevant sensitivity at 24 eV (5.8 GHz).
The axion-electron coupling, explicitly predicted by DFSZ models Zhitnitsky (1980); Dine et al. (1981); Dine and Fischler (1983), can be considered to envisage another class of haloscopes, thereby providing the opportunity to discriminate among axion models in case of detection. Complementary approaches may prove crucial to determine the fractional amount of axions as DM constituent. For instance, inhomogeneous filled cavities, in which the effective axion field is converted to magnetization oscillations of a ferrimagnet, are under study Barbieri et al. (2017). In this case, single photon detection is required, and it can be realized by e.g. superconducting circuit devices acting as quantum bits properly coupled to the cavity photons Wallraff et al. (2004); Tabuchi et al. (2015), but as yet their dark count rate still exceeds the axion interaction rate.
Approaches described so far are affected by an extremely poor sensitivity for axion masses above 0.2 meV ( GHz), where the effective detector volume is a critical issue. Extension to the mass range up to 1 meV (250 GHz) may be rather accomplished in suitable condensed matter experiments, in which the space parameters hardly accessible to cavity technology could be tackled with the upconversion scheme investigated in this work, whereby cosmological axions cause transitions between Zeeman split levels of suitable atomic species.
As target atoms we consider rare-earth (RE) elements inserted as dopants in crystalline matrices, where they exist as trivalent ions, substitutional for one of the atoms of the host with the same valence state and similar ionic radius. Among RE ions, those with an odd number of electrons are called Kramers ions Liu (2005), and have electronic doublet levels with magnetic moments of the order of Bohr magnetons . Therefore, using Kramers doublets, axion-induced spin transitions can take place in the GHz range with application of moderate magnetic fields. For instance, in Er3+, the calculated splitting spans from 20 to 120 GHz with applied magnetic fields in the interval 0.4 to 2.5 T Marino et al. (2016), which translates to a large tunability in the favoured cosmological axion mass window.
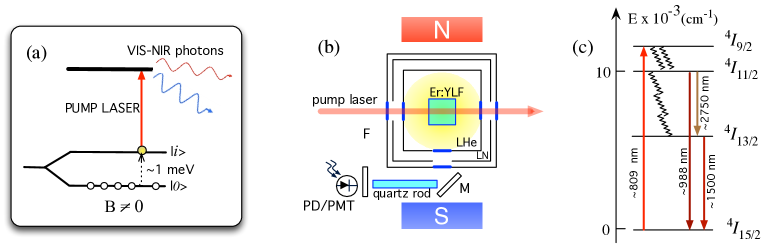
In the direct axion-electron coupling Krauss et al. (1985); Barbieri et al. (1989) the interaction energy is , where the term plays the role of an effective oscillating field, is the electron magnetic moment with electric charge and is the coupling constant Marsh (2016). Resonant condition is met when the Zeeman splitting energy is . As schematized in Fig. 1 (a), the axion excitation is upconverted by a pump laser to photons in visible or infrared ranges, where single photon detection with ultra-low dark count rate has been already demonstrated Hadfield (2009); Schuck et al. (2013); Dreyling-Eschweiler et al. (2015).
The proposed detection scheme is based on electronic transitions between states within a configuration of the trivalent RE, with positions of the discrete energy levels minimally perturbed by the crystal-field due to the screening action of the and orbitals Liu (2005). It is immediately evident that a first requirement for the feasibility of such a scheme is related to the the linewidth of the transition driven by the laser, which must be narrower than the energy difference between the atomic levels and .
Detectability of axions in this scheme can be at first discussed by considering only the thermal excitation of the atomic level as fundamental noise limit. Backgrounds of different nature are left for experimental investigations in the second part of the work. We consider one mole of target atoms in the ground state and, using Eq. 8 of Ref. [Sikivie, 2014], we establish the transition rate to the level by axion absorption on resonance:
| (2) | ||||
where is the transition rate of a single target atom, is the Avogadro number, is the axion energy, is the coupling strength to the target atom and is of the order of one Sikivie (2014), and is the mean square of the axion velocity. The value eV (80 GHz) is a midpoint of the Zeeman splitting frequency interval reported for Er3+ in Ref. Marino et al., 2016. As the in the considered galactic halo model axions are the dominant component of dark matter, we take for its energy density the value 0.4 GeV/cm3 obtained from the rotational curves.
The experiment coherence time is set by , where is the measurement integration time (inverse of the resolution bandwidth), and is the axion gradient coherence time at the resonant frequency of the experiment that can be calculated from the axion coherence time Turner (1990). The latter is related to the width of the axion kinetic energy distribution in the laboratory frame. If we assume a Maxwellian velocity distribution in the Galactic rest frame and we take as the local dark matter virial velocity, we get , and finally Barbieri et al. (2017)
| (3) |
where the merit factor qualifies the axion-microwave line width in haloscope experiments.
The lifetime of the Zeeman excited state is typically much longer than , and in the rare-earth doped materials considered in this work is strongly dependent on temperature, intensity of the static magnetic field, dopant concentration Macfarlane and Shelby (1987); Thiel et al. (2011); Lutz et al. (2016); Cruzeiro et al. (2017). The magnetic field, beyond splitting degenerate levels and thus opening a channel for resonant axion detection, may also inhibit spin flips and thus increase the lifetime of the intermediate level. Lifetimes much longer than ms have been measured in several rare-earth activated optical materials at LHe temperature with magnetic fields comparable to those used in this work ( T) up to about 3 T Thiel et al. (2011). Incidentally, for a given pump laser intensity, the efficiency of the mentioned upconversion process is greater for longer , thus allowing for mitigation of the laser power requirements when large detecting volumes are devised Krupke (1965).
As one might expect, the experiment must be operated in a ultra-cryogenic environment to minimize thermal population of the Zeeman excited level. To establish the working temperature of the apparatus, we treat the pumped crystal as if it were a single photon detector with overall efficiency (including the efficiency of upconversion, the fluorescence collection efficiency and self absorption), and calculate the allowed thermal rate by requiring that the signal to noise ratio (SNR) is at least 3. This condition is equivalent to Hz for an observation time of 1 hour Lamoreaux et al. (2013). For a given temperature of the doped crystal, the thermal excitation rate is related to the lifetime of the Zeeman excited level
| (4) |
with average number of excited ions in the energy level , and the Boltzmann constant. It is worth noticing that the contribution of adjacent Stark sublevels (due to interaction with the crystalline field) is not considered when their energy is much higher than , as the case analyzed in this work. If a level lifetime of ms is taken, we eventually get for the allowed thermal rate and thus 80 GHz mass axions can be searched provided the active crystal is cooled down to at least 300 mK.
In the following we present a systematic investigation of possible backgrounds induced by the pump laser in Er3+-doped YLiF4 crystals at cryogenic temperatures and sub-Tesla magnetic field.
II Experimental
The mm3 volume, Er3+:YLiF4 crystals used in this work were grown with the Czochralski method. They have nominal Er3+-dopant concentration of 1 % and 0.01% concentration (atomic percent substitution for Y3+). These concentrations correspond to and ions/cm3, with three electrons for each ion available as axion targets. Crystals with low concentration of dopants have been the subject of much scientific investigation for photon-echo-based optical data storage and data processing, owing to their narrow transition linewidths and long optical coherence times (see Thiel et al. (2011) and references therein). In this work we are interested in the behavior of higher concentration samples to maximize the axion interaction rate given by Eq. (2) for a given laser-pumped, active detector volume. Moreover, the 1% concentration samples allow for higher sensitivity to laser related backgrounds in the measurements described in sections IV and V.
To allow for Zeeman studies at LHe and superfluid He temperatures, the samples were housed in an immersion dewar located between two NdFeB magnetic discs that produced a field of 370 mT at the sample position. The c-axis of the crystal was parallel to the magnetic field direction. As shown in Fig. 1 (b), the sample fluorescence is collected orthogonally to the laser pump propagation direction and coupled to the photon detector by means of a mirror M and a quartz guide. With optical filters we suppress scattered pump radiation at signal wavelengths, and at the InGaAs photodiode we detect the 1.5 m component of the overall infrared fluorescence spectrum (see Fig. 1 (c)). The employed optical source is a cw Ti:sapphire laser, which can be finely tuned by rotating intracavity ethalons. Zeeman studies are conducted around 809 nm wavelength (section III), while laser-induced backgrounds are investigated at 810.1 nm (section IV). The laser linewidth is GHz ( pm), comparable with the detected transitions widths. The incident light polarization angle is varied by means of a half-wave plate. A typical value of laser intensity used in our measurements is 10 W/cm2, compatible with 0.1 upconversion efficiency in trivalent ions Krupke (1965). For the laser noise studies described in section IV the pump laser was chopped at 15 Hz to allow phase-sensitive detection.
III Zeeman splitting of the
We consider the electronic ground state of the erbium Kramers ion, the . The interaction with the crystal-field splits the magnetic sublevels into eight () Kramers doublets, labeled by , namely the absolute value of the projection on the crystal optical axis , . Through application of a magnetic field parallel to the c-axis, each Kramers doublet splits into two magnetic components: and . In YLiF4:Er3+, the lowest Kramers doublet is the . To determine its splitting under application of a 370 mT magnetic field, we measure the wavelength of transitions coupling the Zeeman components of the ground and the excited level by laser induced fluorescence (LIF) measurements.
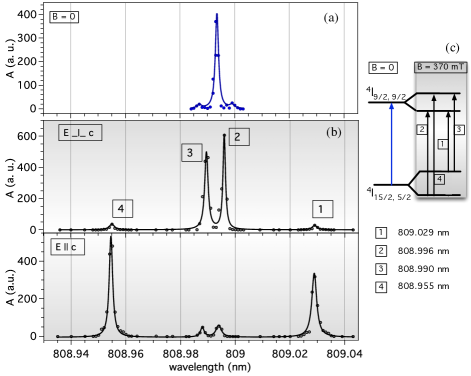
In Fig. 2 we report the results obtained with the 0.01 % concentration sample, where different incident laser polarization orientations (orthogonal and parallel to the crystallographic axis ) allow for a better detectability of possible transitions between Zeeman-split ground and excited states. The fluorescence spectrum displays sharp, well-separated lines. Among the observed transitions, only ( nm) and ( nm) are unambiguously identified. With the displayed data it is then not possible to determine whether the energy levels differences eV, eV and eV, eV represent the ground state or the excited level splittings. As described in section IV, we accomplish this task by laser excitation of the thermal population in the Zeeman-split first excited Stark level of the ground state. Independently of this limitation, the plots in Fig. 2 demonstrate that we are able to resolve the Zeeman splitting and therefore that it is possible to monitor the population of the upper Zeeman component of the ground state. Clearly at K thermal excitation of the level still prevents us from assigning a detection sensitivity to the present apparatus, but before we get to cool the sample to hundreds of mK temperatures, a thorough investigation of the pump laser related noise is accomplished as described in the following sections.
The LIF measurements in Fig. 2 have been repeated with the 1 % concentration sample. In this case the Zeeman transition is hardly resolved due to increased transition linewidths, ascribable to spin cross relaxation processes due to direct interactions among Er3+ ions Böttger et al. (2006); Cruzeiro et al. (2017). However, such a limitation might be overcome in the high magnetic field and low temperature regime, required to achieve ultimate sensitivity in the proposed axion detection scheme. For instance, in a 0.1% concentration sample of YLiF4:Er3+, authors have investigated the four transitions connecting the Zeeman sublevels of the ground and lowest excited state and demonstrated that their linewidth can be as low as MHz Wannemacher et al. (1989). The applied magnetic field was about 3 T and measurements were conducted below 4 K by Zeeman-switched optical-free-induction decay technique. These results, together with our findings, foster the development of a few liters detector with intermediate concentration active materials, matching the axion-induced transition rate in Eq. 2 to dark count rates in available single photon counters Hadfield (2009); Schuck et al. (2013); Dreyling-Eschweiler et al. (2015). As a final additional remark, we note that an intermediate concentration sample would allow for increasing the axion-electron interactions of six orders of magnitude compared to a gaseous target prepared by buffer cooling techniques Santamaria et al. (2015).
IV Laser-induced thermal noise
To assess heating effects in the active detector volume, we focus on the population of the first excited Stark (crystal-field) sublevel , that has a strong thermal coupling with the ground energy level. To enhance the sensitivity of our tests, we use the 1% concentration sample. The crystal-field splittings of Er3+ ions in YLiF4 have been calculated and measured by previous authors dos Santos et al. (1998); Kulpa (1975) and for the sublevel the separation from the ground state is cm-1 (2.1077 meV). If are the Stark sublevels energies of the level, the occupation probability of the first excited Stark level is proportional to , where the sum is well approximated with the first two terms. As the fluorescence intensity is proportional to the laser intensity times the level occupation number , we model a possible heating effect with the term in expression , where , are empirical parameters determined from a fit to the data.
From the data shown in the inset of Fig. 3, we infer that the parameter is compatible with zero within one standard deviation, which allows us to limit the temperature increase to less than 0.2 K/[W/cm2]. We stress that such limit is obtained in an unfavorable upconversion scheme, where the de-excitation takes place also through non radiative channels as shown in Fig. 1 (c). Therefore we can assign the temperature of the thermal bath to the entire crystal and calculate the ratio of the populations of the same Stark level at two different temperatures and . Such ratio is then compared to the LIF peak areas.
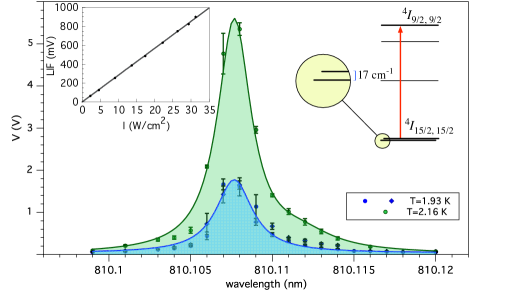
As shown in Fig. 3, with the pump laser tuned to the transition , we obtain peaks that differ only in their area parameter for K and K. The Er(1%):YLF crystal is immersed in superfluid He, and these points are obtained under -point operation at which bubbling disturbances are eliminated. A small satellite line is present on the right side of the main peak at both temperatures, which hinders an accurate fitting of the data. Therefore we compare the areas of the main peaks at K and K by summing the amplitudes of the data recorded at four wavelengths around resonance. The ratio of is in agreement with the expected value, confirming the assumption made in the introduction to calculate the rate of excited atoms via thermal bath temperature.
In addition, we confirm experimentally (Fig. 4) that also the population of the Zeeman-split levels follows Boltzmann statistics.
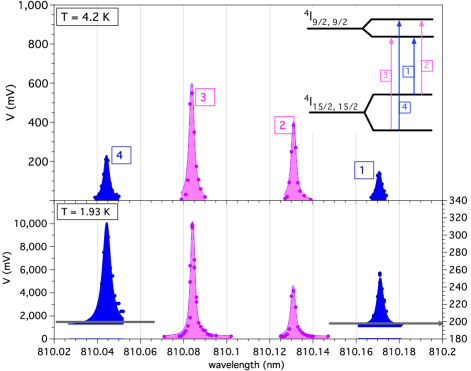
In this case, the pump laser is set to probe the populations of the Zeeman-split levels of the first excited Stark sublevel ( and ). As a larger splitting is expected for this level as compared to the ground state Kulpa (1975), by pumping the transitions to the Zeeman levels of the , the previously measured energy differences (see section III) can also be precisely identified. In fact, from the wavelengths reported in the first column of Table 1, we obtain the splitting of the first excited Stark level eV and eV, where the indices are assigned as described in the inset of Fig. 4. The latter value is consistent with the average of eV, eV measured in section III. Consequently, we take the average eV as the searched splitting of the ground state. To further confirm proper identification of the Zeeman split levels, we can use the ratios of reported factors in the same material oriented with its c-axis parallel to the magnetic field Kulpa (1975). We obtain , in agreement with . The ground state splitting value we measured at 0.37 mT is also in fair agreement with theoretical values reported in Ref. Marino et al., 2016.
| K | K | |||
|---|---|---|---|---|
| 1. 810.171 | ||||
| 2. 810.131 | ||||
| 3. 810.084 | 2 | |||
| 4. 810.044 | ||||
That is as far as our LIF measurement of the ground level splitting is concerned. As for the investigations of possible laser-induced deviations from Boltzmann statistics, we consider the peak areas of LIF measured for the levels and . The data displayed in Fig. 4 are fitted to a Lorentzian curve in the form and the results are reported in Table 1. The ratio and is in fair agreement with 0.69 expected ratio at K. At K we obtain and , which averages to a value compatible with the calculated one 0.37.
V Multiphonon background
In the data reported in Fig. 4 (lower side) the apparatus sensitivity allows observation of an out-of-resonance fluorescence level. To understand the physical origin of this background, we measure its intensity for values of pump laser wavelength in a wide range (corresponding to 10300–12360 cm-1), as shown in Fig. 5. The LIF measured with the pump laser tuned to transition is also plotted for comparison.
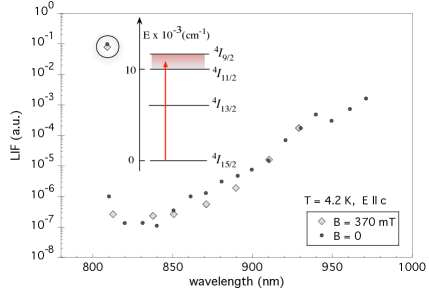
A similar exponential behaviour has been previously reported in Er:YLF and has been explained in terms of multiphonon-assisted, side-band absorption Auzel (2004). The RE manifolds can be in fact excited even by a nonresonant pump photon , when the missing/excess energy is bridged by absorption/emission of phonons via Anti-Stokes and Stokes processes, respectively. The related absorbed intensity is theoretically given by:
| (5) |
where and are the Stokes and Anti-Stokes coefficients, described in the model Auzel (1976) through expressions:
| (6) | |||||
| (7) |
In Eq. (6), is the crystal effective phonon energy, is the number of photons needed to bridge the energy gap, is the average occupation number and the Huang-Rhys coefficient that represents the electron-phonon coupling strength. Typical values of are smaller than cm-1 in bromides, greater than cm-1 in oxides Walsh et al. (2016), and in YLF cm-1 is reported.
The rapid suppression of the LIF observed in our 4.2 K data (Fig. 5) is ascribable to the expected suppression of the AS component with temperature (from eq. 7) and the exponential growth for increasing wavelengths is then mainly due to the Stokes process. Fitting of data with wavelength greater than 850 nm give an absorption coefficient cm-1, in agreement with the value reported in Ref. Chen and Auzel, 1995. Ground state absorption measurements allow to estimate a cm2 cross section of the pure electronic transition (circled data in Fig. 5) and thus to quantify the upconversion efficiency and the multiphonon side band relative amplitude. This type of background hinders the application of the present scheme to axion detection, unless a suitable combination of rare-earth dopant, pumping pathway and matrix is chosen. In particular, relevant suppression of the background should be accomplished in low phonon energy host matrices Walsh et al. (2016) or, as suggested by Eq. (5), by exploiting pumping schemes with larger . It is worth mentioning that a ultimate laser-induced background might also originate from impurity absorption, the same process that is currently limiting the efficiency of optical refrigeration Seletskiy et al. (2010); Melgaard et al. (2014); Di Lieto et al. (2014).
VI Discussion and conclusions
We have discussed a solid-state approach for direct detection of axion dark matter, and established the most important experimental parameters necessary to reach cosmologically relevant sensitivity in DFSZ models. The effect of the continuous, coherent axion field is searched in the excitation of the Zeeman upper component of the ground state of rare earth ions in crystalline matrices, at the energy scale , corresponding to transitions in the GHz range. The population of this excited level is probed by a pump laser tuned to the transition to a fluorescent level within the same atomic configuration, so as to convert the axion excitation into photons, detectable with state-of-the-art single-photon detectors. Assuming thermal excitation of the excited Zeeman level as fundamental noise limit, the active detector volume must be cooled down to ultracryogenic temperatures ( K). The rate of thermal excitation of the atomic level is directly related to its lifetime , and the temperature at which the final experiment must be performed has been estimated for 80 GHz axion-induced transitions and ms by requiring SNR. As long as s, upconversion with unitary efficiency is also ensured for 10 W/cm2 pumping intensity.
In the proposed scheme it is important to address a thorough experimental study of pump laser-related backgrounds. As a first step we have probed the population of atomic levels close to the ground state via LIF measurements in the temperature range K. Our main finding is that the pump laser does not affect the thermal population of the Zeeman excited level at least up to a few W/cm2 intensity. In addition, we have shown that it is crucial to optimize the pumping pathway and crystal properties to minimize scattering of the pump photons on crystal phonons (Stokes process).
As for the detection scheme via laser induced fluorescence, at K and with 370 mT magnetic field, we have demonstrated that the four transitions coupling the Zeeman levels of the ground and the excited can be resolved in the lowest concentration YLiF4:Er3+ sample (0.01 %). This was not possible in the 1 % sample. However, the spin population dynamics in Kramers ions strongly depends on applied magnetic field, temperature, dopant concentration and species, and we argue that a tradeoff between these parameters can be found for the proposed experiment feasibility. A few liters active volume ensures mHz axion and thermal transition rates, corresponding to statistically relevant counts of upconverted photons in a measurement time of a few hours. Fortuitously, the dark count rate of state-of-the-art single photon detectors holds below the transition rate in the detector active volume.
We are witnessing a blooming of table-top experiments pursuing new observables for axion DM direct detection Budker et al. (2014); Arvanitaki and Geraci (2014); Rybka et al. (2015); Kahn et al. (2016); Silva-Feaver et al. (2017); Group et al. (2017); Crescini et al. (2017). In such a multifaceted, dynamic scenario, our complementary proposal aims to probe the uncovered few hundred eV axion mass region by exploiting the axion-electron interaction predicted in the DFSZ models.
Acknowledgements.
The authors wish to thank I. Grassini for samples preparation. Technical support by E. Berto and F. Calaon is gratefully acknowledged.References
- Aprile and et al. (2017) E. Aprile and et al. (XENON Collaboration), arXiv:1705.06655v2 (2017).
- Akerib and et al. (2017) D. S. Akerib and et al. (LUX Collaboration), Phys Rev. Lett. 118, 021303 (2017).
- Agnese and et al. (2017) R. Agnese and et al. (SuperCDMS Collaboration), Phys. Rev. D 95, 082002 (2017).
- Essig et al. (2012) R. Essig, J. Mardon, and T. Volansky, Phys. Rev. D 85, 076007 (2012).
- Kouvaris and Pradler (2017) C. Kouvaris and J. Pradler, Phys. Rev. Lett. 118, 031803 (2017).
- Wilczek (1978) F. Wilczek, Phys. Rev. Lett. 40, 279 (1978).
- Weinberg (1978) S. Weinberg, Phys. Rev. Lett. 40, 223 (1978).
- Peccei and Quinn (1977) R. D. Peccei and H. R. Quinn, Phys. Rev. Lett. 38, 1440 (1977).
- Kim (1979) J. E. Kim, Physical Review Letters 43, 103 (1979).
- Shifman et al. (1980) M. Shifman, A. Vainshtein, and V. Zakharov, Nucl. Phys. B 166, 493 (1980).
- Zhitnitsky (1980) A. Zhitnitsky, Sov. J. Nucl. Phys. 31, 260 (1980).
- Dine et al. (1981) M. Dine, W. Fischler, and M. Srednicki, Physics Letters B 104, 199 (1981).
- Dine and Fischler (1983) M. Dine and W. Fischler, Physics Letters B 120, 137 (1983).
- Sikivie (1983) P. Sikivie, Phys Rev. Lett. 51, 1415 (1983).
- Raffelt (2008) G. Raffelt, in Axions, Lecture Notes in Physics, Vol. 741, edited by B. B. M. Kuster, G. Raffelt (Springer Verlag, 2008) p. 51.
- Borsanyi et al. (2016) S. Borsanyi, Z. Fodor, J. Guenther, K. H. Kampert, S. D. Katz, T. Kawanai, T. G. Kovacs, S. W. Mages, A. Pasztor, F. Pittler, J. Redondo, A. Ringwald, and K. K. Szabo, Nature 539, 69 (2016).
- Marsh (2016) D. J. E. Marsh, Axion cosmology, Phys. Rep. 643, 1 (2016).
- Asztalos et al. (2010) S. J. Asztalos, G. Carosi, C. Hagmann, D. Kinion, K. van Bibber, M. Hotz, L. J. Rosenberg, G. Rybka, J. Hoskins, J. Hwang, P. Sikivie, D. B. Tanner, R. Bradley, and J. Clarke, Phys Rev. Lett. 104, 041301 (2010).
- Sloan et al. (2016) J. V. Sloan, M. Hotz, C. Boutan, R. Bradley, G. Carosi, D. Carter, J. Clarke, N. Crisosto, E. J. Daw, J. Gleason, J. Hoskins, R. Khatiwada, D. Lyapustin, A. Malagon, S. O’Kelley, R. S. Ottens, L. J. Rosenberg, G. Rybka, I. Stern, N. S. Sullivan, D. B. Tanner, K. van Bibber, A. Wagner, and D. Will, Phys. Dark Universe 14, 95 (2016).
- Brubaker et al. (2017) B. M. Brubaker, L. Zhong, Y. V. Gurevich, S. B. Cahn, S. K. Lamoreaux, M. Simanovskaia, J. R. Root, S. M. Lewis, S. Al Kenany, K. M. Backes, I. Urdinaran, N. M. Rapidis, T. M. Shokair, K. A. van Bibber, D. A. Palken, M. Malnou, W. F. Kindel, M. A. Anil, K. W. Lehnert, and G. Carosi, Phys Rev. Lett. 118, 061302 (2017).
- Barbieri et al. (2017) R. Barbieri, C. Braggio, G. Carugno, C. S. Gallo, A. Lombardi, A. Ortolan, R. Pengo, G. Ruoso, and C. C. Speake, Phys. Dark Universe 15, 135 (2017).
- Wallraff et al. (2004) A. Wallraff, D. I. Schuster, A. Blais, L. Frunzio, R. S. Huang, J. Majer, S. Kumar, S. M. Girvin, and R. J. Schoelkopf, Nature 431, 162 (2004).
- Tabuchi et al. (2015) Y. Tabuchi, S. Ishino, A. Noguchi, T. Ishikawa, R. Yamazaki, K. Usami, and Y. Nakamura, Science 349, 405 (2015), http://science.sciencemag.org/content/349/6246/405.full.pdf .
- Liu (2005) G. Liu, in Spectroscopic Properties of Rare Earths in Optical Materials, Springer Series in Material Science, Vol. 83, edited by L. Guokui and J. Bernard (Springer, 2005) pp. 1–94.
- Marino et al. (2016) R. Marino, I. Lorgeré, O. Guillot-Noël, H. Vezin, A. Toncelli, M. Tonelli, J.-L. L. Gouët, and P. Goldner, J. Lumin. 169, Part B, 478 (2016), the 17th International Conference on Luminescence and Optical Spectroscopy of Condensed Matter (ICL’14).
- Krauss et al. (1985) L. Krauss, J. Moody, F. Wilczek, and D. E. Morris, Phys. Rev. Lett. 55, 1797 (1985).
- Barbieri et al. (1989) R. Barbieri, M. Cerdonio, G. Fiorentini, and S. Vitale, Phys. Lett. B 226, 357 (1989).
- Hadfield (2009) R. H. Hadfield, Nat Photon 3, 696 (2009).
- Schuck et al. (2013) C. Schuck, W. H. P. Pernice, and H. X. Tang, Sci. Rep. 3, 1893 EP (2013).
- Dreyling-Eschweiler et al. (2015) J. Dreyling-Eschweiler, N. Bastidon, B. Döbrich, D. Horns, F. Januschek, and A. Lindner, Journal of Modern Optics, J. Mod. Opt. 62, 1132 (2015).
- Tkachuk et al. (2002) A. M. Tkachuk, I. K. Razumova, A. A. Mirzaeva, A. V. Malyshev, and V. P. Gapontsev, Optics and Spectroscopy 92, 67 (2002).
- Sikivie (2014) P. Sikivie, Phys. Rev. Lett. 113, 201301 (2014).
- Turner (1990) M. S. Turner, Physical Review D 42, 3572 (1990).
- Macfarlane and Shelby (1987) R. M. Macfarlane and R. M. Shelby, in Spectroscopy of Solids Containing Rare Earth Ions, edited by A.A.Kaplyanskii and R. M. Macfarlane (North-Holland, Amsterdam, 1987) pp. 51–184.
- Thiel et al. (2011) C. W. Thiel, T. Böttger, and R. L. Cone, Selected papers from DPC’10, J. Lumin. 131, 353 (2011).
- Lutz et al. (2016) T. Lutz, L. Veissier, C. W. Thiel, R. L. Cone, P. E. Barclay, and W. Tittel, Phys. Rev. A 94, 013801 (2016).
- Cruzeiro et al. (2017) E. Z. Cruzeiro, A. Tiranov, I. Usmani, C. Laplane, J. Lavoie, A. Ferrier, P. Goldner, N. Gisin, and M. Afzelius, Phys. Rev. B 95, 205119 (2017).
- Krupke (1965) W. Krupke, IEEE J. Quant. Electron. 1, 20 (1965).
- Lamoreaux et al. (2013) S. K. Lamoreaux, K. A. van Bibber, K. W. Lehnert, and G. Carosi, Phys. Rev. D 88, 035020 (2013).
- Böttger et al. (2006) T. Böttger, Y. Sun, C. W. Thiel, and R. L. Cone, Phys. Rev. B 74, 075107 (2006).
- Wannemacher et al. (1989) R. Wannemacher, D. Boye, Y. P. Wang, R. Pradhan, W. Grill, J. E. Rives, and R. S. Meltzer, Phys. Rev. B 40, 4237 (1989).
- Santamaria et al. (2015) L. Santamaria, C. Braggio, G. Carugno, V. D. Sarno, P. Maddaloni, and G. Ruoso, N. J. Phys. 17, 113025 (2015).
- dos Santos et al. (1998) M. C. dos Santos, E. Antic-Fidancev, J. Gesland, J. Krupa, M. Lemaı̂tre-Blaise, and P. Porcher, Journal of Alloys and Compounds 275–277, 435 (1998).
- Kulpa (1975) S. M. Kulpa, J. Phys. Chem. Solids 36, 1317 (1975).
- Auzel (2004) F. Auzel, Chemical Reviews 104, 139 (2004), pMID: 14719973, http://dx.doi.org/10.1021/cr020357g .
- Auzel (1976) F. Auzel, Phys. Rev. B 13, 2809 (1976).
- Walsh et al. (2016) B. M. Walsh, H. R. Lee, and N. P. Barnes, The 17th International Conference on Luminescence and Optical Spectroscopy of Condensed Matter (ICL’14), Journal of Luminescence 169, Part B, 400 (2016).
- Chen and Auzel (1995) Y. Chen and F. Auzel, Non-oxide Glasses, Journal of Non-Crystalline Solids 184, 278 (1995).
- Seletskiy et al. (2010) D. V. Seletskiy, S. D. Melgaard, S. Bigotta, A. Di Lieto, M. Tonelli, and M. Sheik-Bahae, Nat. Photon. 4, 161 (2010).
- Melgaard et al. (2014) S. Melgaard, D. Seletskiy, V. Polyak, Y. Asmerom, and M. Sheik-Bahae, Opt. Express 22, 7756 (2014).
- Di Lieto et al. (2014) A. Di Lieto, A. Sottile, A. Volpi, Z. Zhang, D. V. Seletskiy, and M. Tonelli, Opt. Express 22, 28572 (2014).
- Budker et al. (2014) D. Budker, P. W. Graham, M. Ledbetter, S. Rajendran, and A. O. Sushkov, Phys. Rev. X 4, 021030 (2014).
- Arvanitaki and Geraci (2014) A. Arvanitaki and A. A. Geraci, Phys Rev. Lett. 113, 161801 (2014).
- Rybka et al. (2015) G. Rybka, A. Wagner, K. Patel, R. Percival, K. Ramos, and A. Brill, Phys. Rev. D 91, 011701 (2015).
- Kahn et al. (2016) Y. Kahn, B. R. Safdi, and J. Thaler, Physical Review Letters 117, 141801 (2016).
- Silva-Feaver et al. (2017) M. Silva-Feaver, S. Chaudhuri, H. M. Cho, C. Dawson, P. Graham, K. Irwin, S. Kuenstner, D. Li, J. Mardon, H. Moseley, R. Mule, A. Phipps, S. Rajendran, Z. Steffen, and B. Young, IEEE Trans. Appl. Supercond. 27, 1 (2017).
- Group et al. (2017) M. W. Group, A. Caldwell, G. Dvali, B. Majorovits, A. Millar, G. Raffelt, J. Redondo, O. Reimann, F. Simon, and F. Steffen, Physical Review Letters 118, 091801 (2017).
- Crescini et al. (2017) N. Crescini, C. Braggio, G. Carugno, P. Falferi, A. Ortolan, and G. Ruoso, Nucl. Instr. Meth. A 842, 109 (2017).