Diluted paramagnetic impurities in nonmagnetic Ba2YIrO6
Abstract
The cubic double perovskite Ba2YIrO6 has been investigated by the local probe techniques nuclear magnetic resonance (89Y NMR) and muon spin rotation (SR). Both methods confirm the absence of magnetic long-range order in this compound but find evidence for diluted localized paramagnetic moments. NMR spin-lattice relaxation rate measurements suggest a slowing down of localized spin moments at low temperatures. An increase of the SR spin-lattice relaxation rate confirms the presence of weak magnetism in Ba2YIrO6. However, these findings cannot be explained by the recently suggested excitonic type of magnetism. Instead, they point towards tiny amounts of localized paramagnetic spin centers leading to this magnetic response on the background of a simple nonmagnetic ground state of the 5 ( electronic configuration of Ir5+.
pacs:
75.70.Tj, 76.60.-k, 76.75.+iI Introduction
In recent years the 5 transition metal oxides have gained a lot of interest since the enhanced spin-orbit coupling (SOC) in these systems adds an interesting new energy scale to the rich physics of competition between crystal field (CF) and Coulomb interactions (U). This may lead to unexpected exotic magnetic phases and novel types of local-moment frustration.Jackeli and Khaliullin (2009); Chaloupka et al. (2010)
In most cases, systems with an odd number of electrons in the shell (Ir4+, 5) have been studied, such as A2IrO4 (A = Sr, Ba),Kim et al. (2008); Jackeli and Khaliullin (2009); Okabe et al. (2011); Boseggia et al. (2013) A2IrO3 (A = Na, Li)Shitade et al. (2009); Chaloupka et al. (2010); Singh and Gegenwart (2010); Singh et al. (2012); Choi et al. (2012); Gretarsson et al. (2013) and BaIrO3.Cao et al. (2000); Brooks et al. (2005) In the case of a 5 (Ir5+) electronic configuration, the strong SOC of the state with an integer low-spin state leads to a splitting into a nonmagnetic ground state and magnetic (and ) excited states.Khaliullin (2013) Magnetism can form only via a Van-Vleck-like singlet - triplet excitation over the SOC gap. Since this singlet - triplet gap is of similar size as the spin exchange energy scale ( meV), unusual magnetic states can be expected.Meetei et al. (2015) The double perovskites A2BB’O6 (with A an alkaline earth element and B and B’ two different transition metal ions) were suggested as potential candidates for such unusual magnetic states.Meetei et al. (2015)
From the experimental side, very different interpretations concerning these double perovskites have been raised. Early magnetization and heat capacity measurements on single crystals of Sr2YIrO6 and Ba2-xSrxYIrO6 (0, 0.74) revealed an antiferromagnetically long-range ordered ground state below 1.3 K (1.6 K respectively),Cao et al. (2014); Terizc et al. (2016) in contrast to the expected nonmagnetic ground state.Cao et al. (2014) In the case of Sr2YIrO6 this was assigned to result from the high distortion of the IrO6 octahedra in the monoclinic structure of this compound.Cao et al. (2014) De facto, lattice degrees of freedom can play a significant role in determining the ground state and the physical properties of a material. Slight alterations of the lattice may lead to strong effects in the magnetic properties, especially due to the extended 5 orbitals, as found e.g. in Sr- and Ru-doped BaIrO3.Cao et al. (2004); Yuan et al. (2016) However, this explanation breaks down in the case of the cubic analogue Ba2YIrO6 with regular IrO6 octahedra. Terizc et al., thus, interpret the observed long-range magnetic order in Ba2-xSrxYIrO6 as a result of band structure and/or electron-electron interaction effects competing with the SOC.Terizc et al. (2016) In contrast, studies on polycrystals of the series Ba2-xSrxYIrO6 reported the absence of any long-range order and no significant change in the magnetic properties upon increasing the structural disorder from cubic Ba2YIrO6 with regular IrO6 octahedra to monoclinic Sr2YIrO6 with highly distorted IrO6 octahedra, thus demonstrating that the CF splitting in Sr2YIrO6 is not enough to compete with the strong spin-orbit coupling.Ranjbar et al. (2015); Phelan et al. (2016) A recent detailed single crystal x-ray diffraction analysis of Sr2YIrO6 even questioned the formerly reported monoclinic structureWakeshima et al. (1999); Cao et al. (2014); Ranjbar et al. (2015) but reported a cubic unit cell with regular IrO6 octahedra.Corredor et al. (2017) Furthermore, no evidence for magnetic long-range order has been found down to 430 mK and the low temperature anomaly in the specific heat has been identified as a Schottky anomaly caused by tiny amounts ( %) of paramagnetic impurities.Corredor et al. (2017) Also for single crystals of Ba2YIrO6 long-range magnetic order has not been observed down to 0.4 K and the effective magnetic moment of 0.44 /Ir (extracted from a Curie-Weiß (CW) fit to the magnetic susceptibility), could be accounted for by 2 % of impurities.Dey et al. (2016) These studies thus corroborate the dominance of the SOC leading to a nonmagnetic ground state, whose weak magnetic response stems from paramagnetic impurities, such as tiny amounts of Ir4+ or Ir6+ ions, created by chemical disorder (Ir4+ for Y3+ substitution) and/or off-stoichiometry, respectively.Dey et al. (2016)
We investigated this weak magnetism by means of nuclear magnetic resonance and muon spin rotation measurements on single crystals and polycrystals of Ba2YIrO6. Taking advantage of the local probe character of these two methods in contrast to bulk characterization techniques, we can directly reveal the nonmagnetic =0 ground state of Ba2YIrO6, and show, that the observed weak magnetism stems from small amounts of diluted paramagnetic spin centers on top of this nonmagnetic ground state. The origin of these paramagnetic spin centers may in principle be either disorder, off-stoichiometry, oxygen deficiency or excess, although some scenarios seem to be more likely than others.
II Sample preparation, characterization and experimental details
High purity starting materials BaCO3 (Alpha Aesar 99.997 %), IrO2 (Alpha Aesar 99.99 %) and Y2O3 (Alpha Aesar 99.999 %) were used to grow single crystals of Ba2YIrO6 in a flux of ultradry BaCl2 (Alpha Aesar 99.5 %) as described in detail in Ref. Dey et al., 2016. Single crystals of typical dimensions 0.3 x 0.3 x 0.3 mm3 were obtained.Dey et al. (2016) Details on their characterization and magnetic properties are found in Ref. Dey et al., 2016. A polycrystalline sample of Ba2YIrO6 has been prepared by solid state reaction method. Stoichiometric amounts of high-purity BaCO3, Y2O3, and Ir metal powder were mixed thoroughly, pressed into pellets and calcined at 800 ∘C for 12h. Subsequently, the mixture was heated at 1200 ∘C for 80h with several intermediate grinding and pelletizing. From the point of view of standard bulk characterization techniques (XRD and magnetization) it appeared to be less disordered than the single crystals.
For 89Y nuclear magnetic resonance (NMR) measurements plenty of single crystals were crushed to a powder. The crushed single crystals were measured in static magnetic fields of 7 and 15 T, while the polycrystalline sample was measured in 7 T. 89Y possesses a nuclear spin , thus no quadrupolar effects influenced the NMR spectra and relaxation rate measurements. NMR spectra were measured by using a normal Hahn spin-echo sequence and Fourier transforming the echo. The repetition rate between subsequent pulse sequences was chosen to be suffienctly long to prevent spin-lattice relaxation rate effects. The spin lattice relaxation rate was measured by using the saturation recovery method and the recovery of the nuclear magnetization was fitted to:
| (1) |
with the nuclear saturation magnetization , for an ideal saturation recovery (otherwise ) and a stretched exponent . refers to a probability distribution of individual spin-lattice relaxation rates , with which the stretched exponential function can be expressed as: , where and .Johnston et al. (2005); Johnston (2006); Shiroka et al. (2011) In this case, denotes a characteristic relaxation rate of the system. Please note, that this characteristic relaxation rate differs from the average relaxation rate or its inverse. Instead, for , can be understood as the value for which it is equally likely for to be smaller or greater than . For , the probability distribution amounts to the Dirac function at and yields = . With decreasing , the probability distribution gets broader and more and more asymmetric and its maximum shifts to slower rates . Former works used a log-normal distribution to mimic the probability distribution of the stretched exponential.Mitrović et al. (2008); Dioguardi et al. (2015) They showed that the extracted are very similar to the characteristic as extracted by a stretched exponential recovery law and do not depend on the exact form of the distribution function. We therefore decided to use the stretched exponential fitting function for this work. For a more detailed analysis of the probability distribution the interested reader is referred to Ref. Johnston, 2006.
SR measurements on the same crushed single crystals of Ba2YIrO6 have been carried out at the M3 beam line at the GPS and LTF spectrometers of the Swiss Muon Source at the Paul Scherrer Institute (PSI) in Villigen. Positively spin-polarized muons were implanted into the sample and the time evolution of the muon spin polarization, , was monitored by detecting the asymmetric spatial distribution of positrons emitted from the muon decay.Schenck (1985); Yaouanc and de R otier (2011) The measurements have been performed in the temperature range between 300 mK and 200 K in zero magnetic field (ZF) and in longitudinal applied magnetic fields with respect to the initial muon spin polarization up to 1000 G (LF). To improve the thermal contact in the LTF machine, the samples were glued on an Ag plate giving rise to a time and temperature independent background signal due to muons that stopped in the Ag plate. The SR time spectra were analyzed using the free software package MUSRFIT.
III Experimental Results and Discussion
III.1 Nuclear Magnetic Resonance
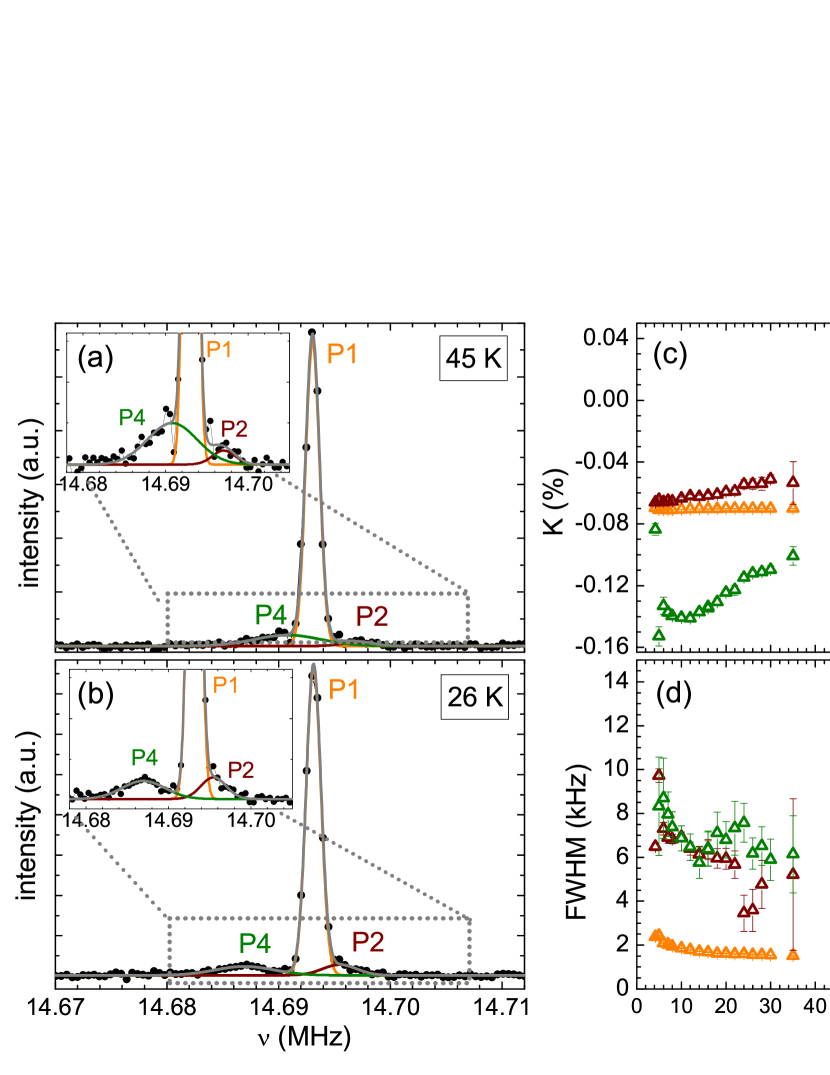
NMR measurements have been performed in the temperature range from 4.2 K up to 100 K. Figs. 1(a) and (b) show representative spectra measured in 7.0493 T. The main resonance line stemming from Y nuclei within the intrinsic Ba2YIrO6 phase is peaked around 14.692 MHz. It is asymmetric and can be described by a fit with two Gaussian lines, revealing the main peak (P1) and a high-frequency shoulder (P2). Additionally, a smaller peak is found at slightly higher frequencies (P3), with an average spectral weight of roughly 5 %. The nuclear spin-lattice relaxation rate of this small high-frequency peak is not accurately measurable. It is of the order of several thousands of seconds. Its observed temperature independent Knight shift K3 [see Fig. 1(c)] agrees well with the reported chemical shift of Y2O3 (roughly 300 ppm).Harazono and Watanabe (1997) Furthermore, traces of unreacted Y2O3 of the same order of magnitude (about 2 %) have also been found in the powder XRD characterization of these samples.Dey et al. (2016) Hence, we attribute P3 to Y nuclei within a tiny nonmagnetic Y2O3 impurity phase.
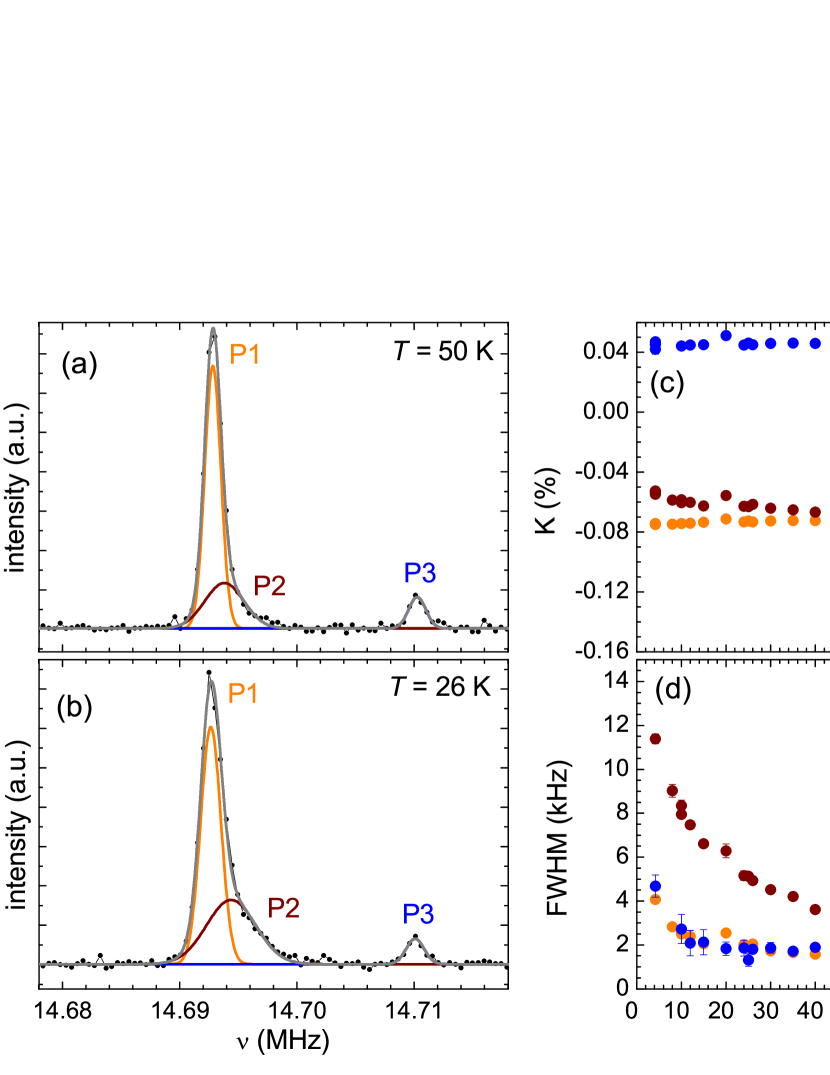
Fig. 1(c) shows the NMR Knight shift of all three peaks, extracted from their measured resonance frequencies as:
| (2) |
where Mhz/T is the gyromagnetic ratio of the 89Y nuclei and = 7.0493 T is the magnetic field. The Knight shift results from the hyperfine interaction between the spins of the electrons and the nuclear spins. In an applied magnetic field, polarized electrons create an additional hyperfine field at the nuclear sites, leading to a shift of the resonance line with respect to the unshifted Larmor frequency . This shift comprises the temperature-independent contributions: (orbital shift) and (diamagnetic shift), as well as a (in most cases temperature-dependent) spin part , which is a measure of the intrinsic local spin susceptibility :
| (3) |
with the hyperfine coupling constant . itself can consist of dipolar contributions, Fermi-contact contributions (only in the case of unpaired -electrons), and transferred Fermi-contact contributions via the polarization of the orbitals (also called core polarization).
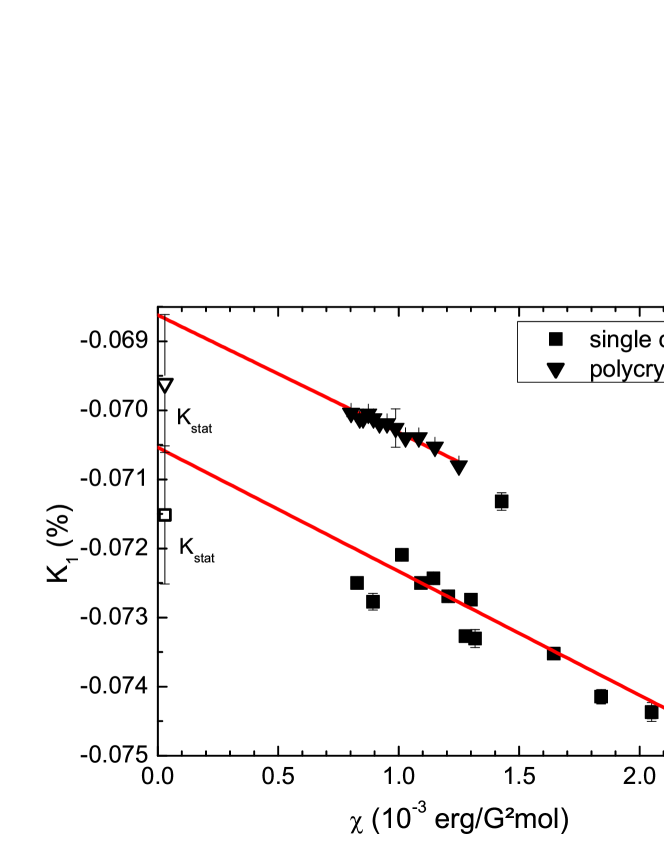
The nearly temperature independent Knight shifts of the main Ba2YIrO6 phase, and , and their low absolute values indicate that the local spin susceptibility is very small and only weakly temperature dependent, corroborating the theoretically proposed nonmagnetic ground state. This stands in contrast to the measured bulk susceptibility, which cannot differentiate between the intrinsic spin susceptibility and contributions from even tiny amounts of paramagnetic impurities, leading to a Curie-Weiß-like upturn at low temperatures.Dey et al. (2016) In the high temperature range, where is still rather flat, the hyperfine coupling constant can be deduced according to Eq. 3 and including a constant term for the static part .Johnston (2010) Fig. 2 shows as a function of the macroscopic susceptibility with temperature as implicit parameter (for T 10 K). The deduced hyperfine coupling constant amounts to kOe/. This small negative value is the sum of (direction-dependent negative and positive) dipolar and (negative) core polarization hyperfine interactions, which cannot be separated from each other. By extrapolating to and considering the maximal possible values of , we can also deduce the temperature independent part of the Knight shift, . This part comprises the orbital shift from unfilled electronic shells and the diamagnetic shift stemming from closed inner electronic shells. amounts to (-0.071 0.002) %. Hence, it is the dominant contribution to the measured shift, while the spin part is vanishingly small. These results together with the weak temperature dependence strongly hint towards a nonmagnetic ground state of Ba2YIrO6.
Solely the Knight shift of the shoulder peak P2 shows a slight enhancement towards low temperature, suggesting the presence of diluted paramagnetic impurities. We thus assume that the main peak P1 stems from nuclei in the nonmagnetic Ba2YIrO6 matrix, while peak P2 might stem from nuclei which sense the previously suggested Y-Ir disorder, leading to a few percent of paramagnetic J=1/2 impurity centers.Dey et al. (2016) In fact, an energy dispersive x-ray (EDX) analysis with a scanning electron microscope (SEM) suggested a small excess of Y in the crystal. Thus, a certain off-stoichiometry, i.e. Ba2Y1+dIr1-dO6, and/or site disorder between Y and Ir in the crystals cannot be ruled out, although the refinement of the powder XRD pattern could not reveal such effects.Dey et al. (2016) Note that in principal also a slight oxygen deficiency could lead to paramagnetic Ir4+ ions. However, previous magnetization measurements comparing as-grown crystals and crystals annealed in oxygen pressure did not show any difference,Dey et al. (2016) rendering this possibility rather unlikely. Since Ir6+ is also magnetic ( = 3/2), one may assign the paramagnetic impurities to stem from Ir6+ caused by oxygen excess, however experimental evidence for this scenario is lacking so far and former growth studies showed, that Ir6+ can only be stabilized under high oxygen pressure and high temperature.Demazeau et al. (1993)
Note that in light of the XRD results and the magnetization measurements,Dey et al. (2016) the spectral weight distribution between P1 and P2 of 70 % : 30 % seems surprisingly large. However, if we assume that, due to the extended 5 orbitals, also nearest neighbors (nn) [and potentially next-nearest neighbors (nnn)] sense the disorder caused by some tiny Y-Ir mismatch, the effects seen by NMR will be larger than the actual disorder itself. In fact, by considering the coordination number six at the Y site, P1 can be attributed to an Y - (O-Ir)6 nn environment, while P2 can be assigned to an Y - (O-Ir)5-(O-Y) nn environment and the spectral weight distribution between P1 and P2 translates to a Y-Ir mismatch of 5%.Aharen et al. (2009, 2010)
Fig. 1(d) shows the full width at half maximum (FWHM) of all three peaks. At high temperatures, the resonance lines are very narrow, pointing towards a nonmagnetic environment of the 89Y nuclei, since any magnetic environment would lead to slightly different hyperfine fields and thus slightly different , resulting in a broadening of the NMR lines. The linewidth of the shoulder peak P2 is always larger than the ones of P1 and P3, suggesting the more magnetic environment of the 89Y nuclei at this site, likely stemming from Y-Ir disorder. A small line broadening is observed at lower temperatures, pointing towards a slowing down of magnetic fluctuations. The absolute values of the linewidth at low temperature [11.4 kHz at 4.2 K (P2)] can be well reproduced by considering the deduced hyperfine coupling constant and the magnetic moment as obtained from a Curie-Weiß fit to the macroscopic susceptibility, which amounts to = 0.44 /Ir atom.Dey et al. (2016) The internal field = 44 Oe leads to a line broadening due to the effective magnetic moment of = 9.2 kHz. Taken together with the linewidth in the high temperature limit, which is based on other effects, this can account for the entire linewidth of 11.4 kHz at 4.2 K. Hence, no other line broadening effects have to be considered. The observed line broadening is solely a result of the tiny amount of paramagnetic impurities.
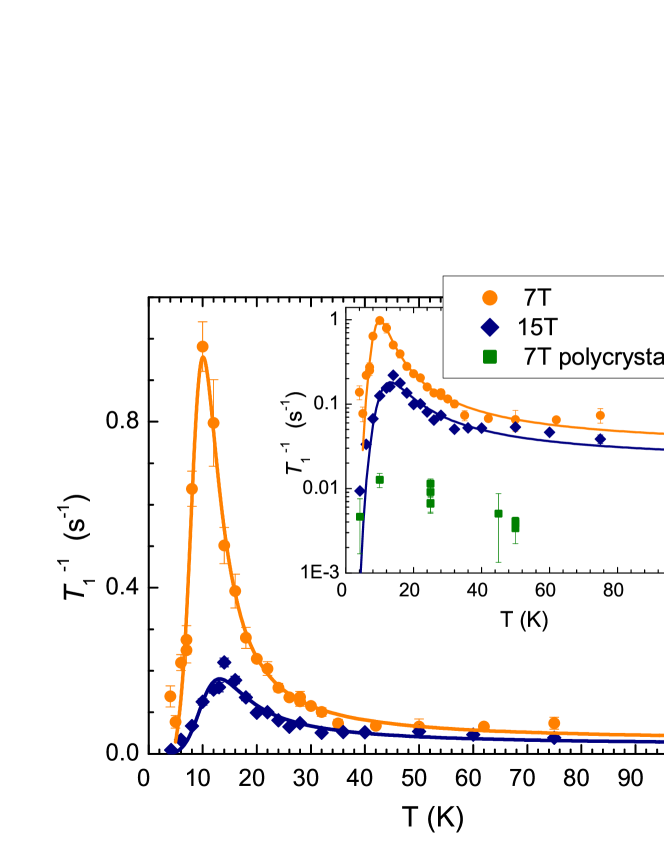
Measurements of the NMR spin-lattice relaxation rate have been performed on the main peak in magnetic fields of 7 and 15 T (see Fig. 3). Since P1 and P2 are very close to each other in the spectrum, can only be measured for both of them at the same time. This results in a stretched exponential recovery curve (see Eq. 1) with a basically temperature-independent stretching exponent , which points towards a rather broad, temperature-independent probability distribution of individual relaxation rates . The characteristic spin-lattice relaxation rate of this distribution, , is temperature independent from 100 K down to roughly 40 K. The absolute values of s (20 s) in 7 T (15 T) in this temperature range indicate the absence of any type of strong magnetic correlations, which would lead to a much faster relaxation.
| (K) | (K) | () s | (Gauss) | |
|---|---|---|---|---|
| 7 T | 10 | |||
| 15 T | 14 |
However, upon further lowering the temperature, gets faster and a pronounced peak appears in for both fields.rem Such a peak points towards a progressive slowing down of spin fluctuations, which can be described in the Bloembergen-Purcell-Pound (BPP) model.Bloembergen et al. (1947, 1948) Within this model, the spin-lattice relaxation rate is expressed as a function of the local fluctuating magnetic field perpendicular to the applied magnetic field and its characteristic autocorrelation time :Bloembergen et al. (1947, 1948)
| (4) |
This leads to a peak in at the temperature where the correlation time of the spin fluctuations equals the inverse Larmor frequency . For disordered systems, the temperature dependence can be well described by an activated behavior:Suh et al. (2000); Curro et al. (2000, 2009); Hammerath et al. (2013, 2015) , with the activation energy of the magnetic fluctuations and the correlation time at infinite temperature . Thus, the peak in should shift to higher temperature upon increasing the external magnetic field, which is indeed observed experimentally (see Fig. 3 and results in Table 1).
Fits according to Eq. 4 (solid lines in Fig. 3 and Table 1) can well describe the data and yield an activation energy of the slowing down of magnetic fluctuations of about K, which is in good agreement with the onset temperatures of the increase of the NMR FWHM [see. Fig. 1(d)] and the SR spin-lattice relaxation rate (see Fig. 7). The fluctuating field amounts to around Gauss, which is fairly small. It compares well to the internal field as extracted from the linewidth of P2 by considering that has been deduced from spin-lattice relaxation rate measurements on P1 and P2, while has been extracted from the linewidth of P2 only. The extracted activation energy of the slowing down of spin fluctuations, K is too small to account for singlet - triplet excitations over the SOC gap, which is of the order of 370 meV.Kusch et al. (2017); Nag et al. (2017) Since the BPP peak is seen at the main NMR resonance lines P1 and P2 of the Ba2YIrO6 phase, we suppose that these fluctuations stem from homogeneously distributed paramagnetic spin centers in the main phase. As already cited, these spin centers may arise due to slight off-stoichiometry and chemical disorder, leading to Ir4+ and Ir6+ ions with and , respectively. Recent electron spin resonance (ESR) investigations come to the same conclusion and give a detailed analysis of these spin centers.Fuchs et al. (2017) Certainly, the system is far from being magnetically long-range ordered, with the stoichiometric Ba2YIrO6 phase being in a nonmagnetic ground state as expected from the strong SOC.
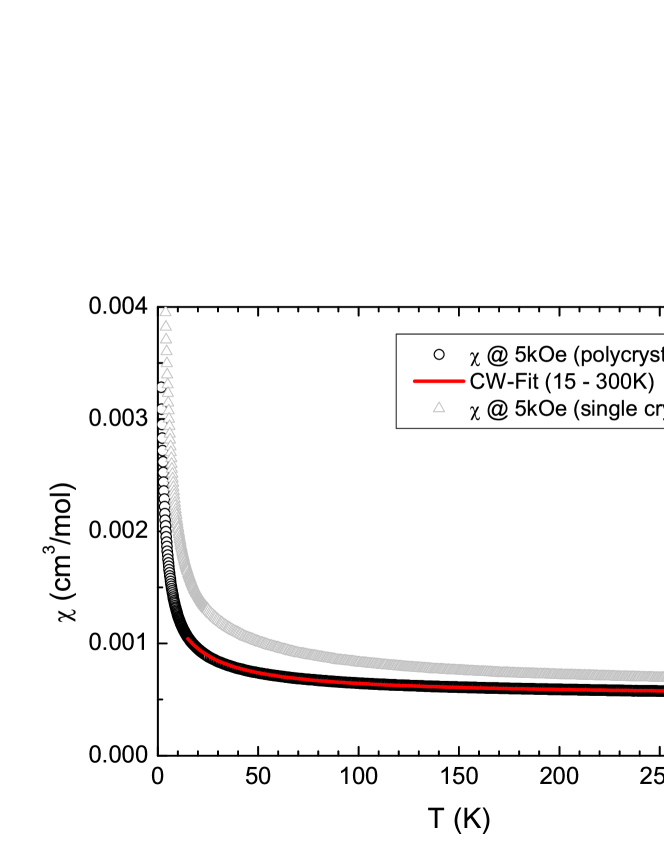
For comparison, we also measured a polycrystalline sample of Ba2YIrO6, which from the point of view of the bulk characterization appears to be less disordered than the single crystals. Its magnetic susceptibility is smaller than the one of the single crystal (see Fig. 4). A CW fit in the same temperature range (15 - 300 K) yielded an effective magnetic moment of 0.31 /Ir atom (C = 0.01228 cm3K/mol), which is smaller than the one of the single crystals (0.44 /Ir atom)Dey et al. (2016). Furthermore, no evidence for Y2O3 or other impurities was found in its XRD characterization (not shown).
This is reflected in the NMR spectra of the polycrystal [see Figs. 5(a) and (b)], where peak P3, which we assigned to nonmagnetic Y2O3 in the NMR spectra of the single crystals, is absent. Furthermore, the spectral weight of P2, which presumably arises from chemical disorder and/or off-stoichiometry, is much smaller. An analysis of the spectral weight distribution between P1 and P2 yields a Y-Ir mismatch of about 1 - 1.5 % (see discussion of the spectral weights of the single crystal NMR). The main resonance line of the nonmagnetic Ba2YIrO6 phase is found at the same frequency as for the single crystals and its Knight shift is the same as for the single crystal and is also temperature independent [see Fig. 5(c)]. A fit to results in the same hyperfine coupling constant and a very similar static shift as for the single crystals [see Fig. 2]. Also its FWHM is very small (1.3 kHz at 100 K) and increases even less (up to 2.4 kHz at 4.2 K for P1 and 9 kHz for P2) [Fig. 5(d)]. As for the single crystals, this is consistent with a calculated line broadening of = 6.5 kHz due to the reduced magnetic moment of 0.31/Ir atom (see discussion of the linewidth for the single crystals). Additionally, a small peak emerges at the lower frequency side (P4). This peak has a fast spin-lattice relaxation of roughly 100 - 300 ms and its Knight shift shows a rather strong temperature dependence in comparison to the other two resonance lines [see Fig. 5(c)], suggesting that it emerges from Y nuclei sitting very close to a paramagnetic impurity, which in this case might be a tiny extrinsic paramagnetic cluster. (Note that this extrinsic phase also contributes to the measured macroscopic susceptibility. This means (i) the extrinsic paramagnetic phase is indeed very tiny and, (ii) the actual magnetic moment stemming from diluted paramagnetic electrons within the Ba2YIrO6 main phase might even be smaller than what has been deduced from .) The spin-lattice relaxation time of P1 and P2 (which are indistinguishable) is very long, reaching the limits of a reasonable measurement duration. The data shown in the inset of Fig. 3 are thus only rough estimates (note the big error bars on the logarithmic scale) and cannot be used for any further analysis. However, they suffice to point out the difference between the polycrystal and the single crystals: The of the main peak of the polycrystal is at least one order of magnitude smaller than the one of the single crystals, stating that the less disordered polycrystal is even less magnetic than the single crystals. This confirms the nonmagnetic ground state of stoichiometric Ba2YIrO6 and proofs that the weak magnetic signals arising in the magnetic susceptibility and in the NMR of the single crystals stem from a small amount of paramagnetic spin centers, presumably arising from a certain Y-Ir site disorder and/or off-stoichiometry within the Ba2YIrO6 phase.
III.2 Muon Spin Rotation
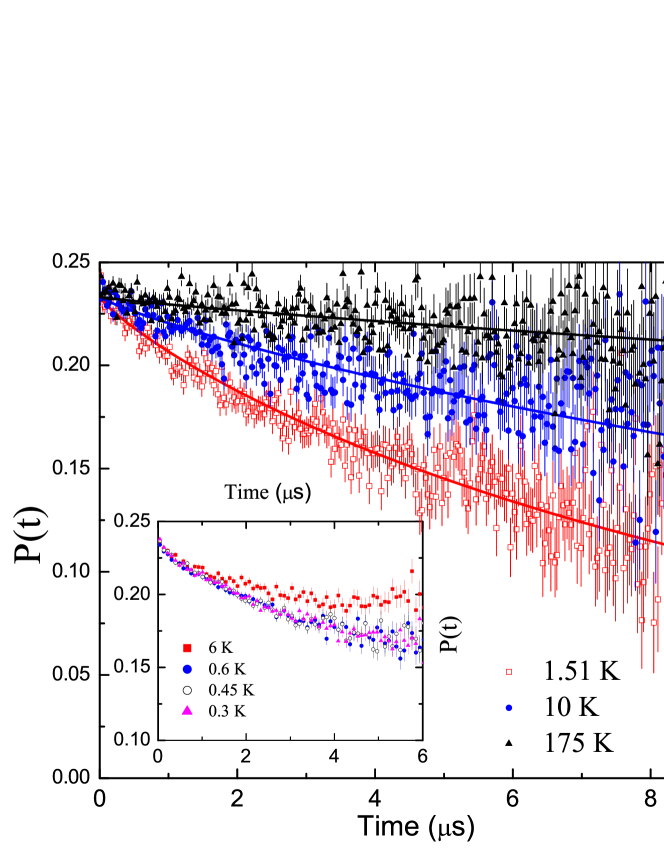
Zero-field (ZF) SR measurements have been carried out in the temperature range between 200 K and 300 mK. SR time spectra at representative temperatures are shown in Fig. 6. Down to the lowest measured temperature of 300 mK, the ZF SR time spectra exhibit a weak exponential decay. No signal of static long-range magnetic order, or a fast muon relaxation associated with a strongly disordered magnetic state are observed, in accordance with different bulk characterization methodsDey et al. (2016) and NMR. The spectra have been fitted with a stretched exponential function:
| (5) |
with the spin-lattice relaxation rate and a stretched exponent . The value of close to one suggests that the system is rather homogeneous since for a strongly disordered system such as a spin glass or some other spin-frozen state the expected value should be much lower than 1 (i.e. close to 1/3 for a spin glass)Campbell et al. (1994).
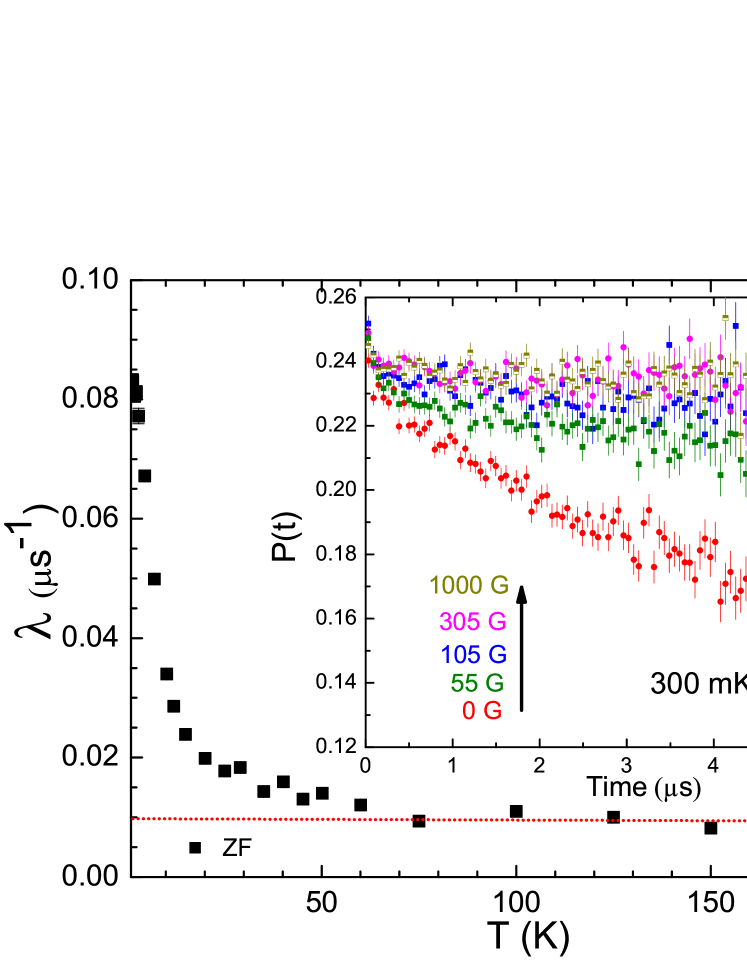
The spin-lattice relaxation rate [see Fig. 7] remains temperature independent down to 60 K, in conjunction with the magnetic susceptibilityDey et al. (2016) and the NMR . The non-zero value of above 60 K is associated with randomly distributed nuclear moments coupled with the muon spin. Below 60 K, starts to increase with decreasing temperature. This increase indicates that slow magnetic fluctuations develop, consistent with the increase of the 89Y NMR described above. It should be noted that the absolute values of in the temperature range from 60 K down to 300 mK are still very small, indicating that the overall density and size of the fluctuating localized moments are small. In contrast to the NMR the muon spin relaxation rate continously increases down to 600 mK. This is due to the different time windows of the electronic fluctuations, to which NMR and SR are sensitive to. Below 600 mK down to 300 mK no further change of the muon spin relaxation is observed.
To clarify whether the low temperature muon spin relaxation is static or dynamic in nature, two decoupling experiments have been performed at 3.7 K and 300 mK in different longitudinal fields (LF SR). At 3.7 K one can completely suppress the muon spin relaxation with a 200 G longitudinal field (not shown). Whereas, at 300 mK [see inset of Fig. 7] even a longitudinal field of 100 G is sufficient to decouple the muon spin relaxation.
This proves that the weak magnetic field distribution is quasistatic with a fluctuation rate below 1 MHz at 3.7 K and 300 mK. The data support the presence of diluted localized paramagnetic moments which exhibit a slowing down of fluctuations due to the presence of an energy barrier. This interpretation is consistent with the results of NMR (see above), specific heat and susceptibility measurements.Dey et al. (2016); Corredor et al. (2017)
IV Conclusion
By using local probe techniques, evidence for weak magnetic fluctuations in single crystals of Ba2YIrO6 could be revealed. Instead of pointing towards an exotic quasi-static ground state of Ba2YIrO6, we could show that these fluctuations stem from tiny amounts of diluted paramagnetic impurity centers on the background of the nonmagnetic ground state.
Due to the local character of NMR measurements, an impurity phase of nonmagnetic Y2O3 could be resolved in single crystals of Ba2YIrO6, in nice agreement with former XRD analysis. The local susceptibility of the intrinsic Ba2YIrO6 phase as measured by the NMR Knight shift was found to be temperature independent, in contrast to bulk susceptibility measurements, which are influenced by tiny amounts of Y-Ir disorder and/or off-stoichiometry, leading to a certain amount of paramagnetic impurities. The existence of these paramagnetic spin centers is expressed in an additional peak (P2) of the NMR spectrum, an increase in its FWHM and a pronounced peak in at low temperature, indicating a progressive slowing down of weak magnetic fluctuations of these spin centers.
These results are in perfect agreement with SR measurements on the same samples, where a slight increase of the ZF SR spin-lattice relaxation rate and corresponding decoupling experiments reveal weak magnetic fluctuations.
Comparing the activation energy of the magnetic fluctuations K resulting from a BPP analysis of the NMR spin-lattice relaxation rate, and the onset temperature of the increase of the SR spin-lattice relaxation rate with the theoretically and experimentally determined excitation gap between the and states of about 370 meV in this compound, it is evident that the theoretically suggested excitonic type of magnetism cannot account for the observed magnetic response. Instead, we propose that these weak magnetic fluctuations stem from tiny amounts of diluted paramagnetic impurities on the background of a nonmagnetic ground state. Measurements on a
less disordered polycrystal of Ba2YIrO6 further corroborated this scenario, since no evidence for magnetic fluctuations was found in this sample.
Note added in proof After submission of our manuscript, another work appeared which also discusses the effect of site disorder on the magnetism of Ba2YIrO6.Chen et al. (2017)
Acknowledgement
We thank V. Kataev, L. T. Corredor-Bohorquez, G. Prando, M. Sturza and D. Efremov for discussion and K. Leger, S. Müller-Litvyani, and J. Werner for technical support. This work has been supported by the Deutsche Forschungsgemeinschaft (DFG) through the Sonderforschungsbereich SFB 1143, grant No. WO1532/3-2, the Emmy-Noether program (Grant No. WU595/3-1), and materials world network (WU595/5.1).
References
- Jackeli and Khaliullin (2009) G. Jackeli and G. Khaliullin, Phys. Rev. Lett. 102, 017205 (2009).
- Chaloupka et al. (2010) J. c. v. Chaloupka, G. Jackeli, and G. Khaliullin, Phys. Rev. Lett. 105, 027204 (2010).
- Kim et al. (2008) B. J. Kim, H. Jin, S. J. Moon, J.-Y. Kim, B.-G. Park, C. S. Leem, J. Yu, T. W. Noh, C. Kim, S.-J. Oh, et al., Phys. Rev. Lett. 101, 076402 (2008).
- Okabe et al. (2011) H. Okabe, M. Isobe, E. Takayama-Muromachi, A. Koda, S. Takeshita, M. Hiraishi, M. Miyazaki, R. Kadono, Y. Miyake, and J. Akimitsu, Phys. Rev. B 83, 155118 (2011).
- Boseggia et al. (2013) S. Boseggia, R. Springell, H. C. Walker, H. M. Rønnow, C. Rüegg, H. Okabe, M. Isobe, R. S. Perry, S. P. Collins, and D. F. McMorrow, Phys. Rev. Lett. 110, 117207 (2013).
- Shitade et al. (2009) A. Shitade, H. Katsura, J. Kuneš, X.-L. Qi, S.-C. Zhang, and N. Nagaosa, Phys. Rev. Lett. 102, 256403 (2009).
- Singh and Gegenwart (2010) Y. Singh and P. Gegenwart, Phys. Rev. B 82, 064412 (2010).
- Singh et al. (2012) Y. Singh, S. Manni, J. Reuther, T. Berlijn, R. Thomale, W. Ku, S. Trebst, and P. Gegenwart, Phys. Rev. Lett. 108, 127203 (2012).
- Choi et al. (2012) S. K. Choi, R. Coldea, A. N. Kolmogorov, T. Lancaster, I. I. Mazin, S. J. Blundell, P. G. Radaelli, Y. Singh, P. Gegenwart, K. R. Choi, et al., Phys. Rev. Lett. 108, 127204 (2012).
- Gretarsson et al. (2013) H. Gretarsson, J. P. Clancy, X. Liu, J. P. Hill, E. Bozin, Y. Singh, S. Manni, P. Gegenwart, J. Kim, A. H. Said, et al., Phys. Rev. Lett. 110, 076402 (2013).
- Cao et al. (2000) G. Cao, J. Crow, R. Guertin, P. Henning, C. Homes, M. Strongin, D. Basov, and E. Lochner, Solid State Communications 113, 657 (2000).
- Brooks et al. (2005) M. L. Brooks, S. J. Blundell, T. Lancaster, W. Hayes, F. L. Pratt, P. P. C. Frampton, and P. D. Battle, Phys. Rev. B 71, 220411 (2005).
- Khaliullin (2013) G. Khaliullin, Phys. Rev. Lett. 111, 197201 (2013).
- Meetei et al. (2015) O. N. Meetei, W. S. Cole, M. Randeria, and N. Trivedi, Phys. Rev. B 91, 054412 (2015).
- Cao et al. (2014) G. Cao, T. Qi, L. Li, J. Terzic, S. Yuan, L. DeLong, G. Murthy, and R. Kaul, Phys. Rev. Lett. 112, 056402 (2014).
- Terizc et al. (2016) J. Terizc, H. Zheng, F. Ye, H. D. Zhao, P. Schlottmann, L. D. Long, and G. Cao (2016), eprint arXiv:1608.07624.
- Cao et al. (2004) G. Cao, X. N. Lin, S. Chikara, V. Durairaj, and E. Elhami, Phys. Rev. B 69, 174418 (2004).
- Yuan et al. (2016) S. J. Yuan, K. Butrouna, J. Terzic, H. Zheng, S. Aswartham, L. E. DeLong, F. Ye, P. Schlottmann, and G. Cao, Phys. Rev. B 93, 165136 (2016).
- Ranjbar et al. (2015) B. Ranjbar, E. Reynolds, P. Kayser, B. J. Kennedy, J. R. Hester, and J. A. Kimpton, Inorganic Chemistry 54, 10468 (2015).
- Phelan et al. (2016) B. F. Phelan, E. M. Seibel, D. B. Jr., W. Xie, and R. Cava, Solid State Communications 236, 37 (2016).
- Wakeshima et al. (1999) M. Wakeshima, D. Harada, and Y. Hinatsu, Journal of Alloys and Compounds 287, 130 (1999).
- Corredor et al. (2017) L. T. Corredor, G. Aslan-Cansever, M. Sturza, K. Manna, A. Maljuk, S. Gass, T. Dey, A. U. B. Wolter, O. Kataeva, A. Zimmermann, et al., Phys. Rev. B 95, 064418 (2017).
- Dey et al. (2016) T. Dey, A. Maljuk, D. V. Efremov, O. Kataeva, S. Gass, C. G. F. Blum, F. Steckel, D. Gruner, T. Ritschel, A. U. B. Wolter, et al., Phys. Rev. B 93, 014434 (2016).
- Johnston et al. (2005) D. C. Johnston, S.-H. Baek, X. Zong, F. Borsa, J. Schmalian, and S. Kondo, Phys. Rev. Lett. 95, 176408 (2005).
- Johnston (2006) D. C. Johnston, Phys. Rev. B 74, 184430 (2006).
- Shiroka et al. (2011) T. Shiroka, F. Casola, V. Glazkov, A. Zheludev, K. Prša, H.-R. Ott, and J. Mesot, Phys. Rev. Lett. 106, 137202 (2011).
- Mitrović et al. (2008) V. F. Mitrović, M.-H. Julien, C. de Vaulx, M. Horvati, C. Berthier, T. Suzuki, and K. Yamada, Phys. Rev. B 78, 014504 (2008).
- Dioguardi et al. (2015) A. P. Dioguardi, M. M. Lawson, B. T. Bush, J. Crocker, K. R. Shirer, D. M. Nisson, T. Kissikov, S. Ran, S. L. Bud’ko, P. C. Canfield, et al., Phys. Rev. B 92, 165116 (2015).
- Schenck (1985) A. Schenck, Muon spin rotation spectroscopy (1985).
- Yaouanc and de R otier (2011) A. Yaouanc and P. de R otier, Muon Spin Rotation, Relaxation, and Resonance: Applications to Condensed Matter, International Series of Monographs on Physics (OUP Oxford, 2011).
- Harazono and Watanabe (1997) T. Harazono and T. Watanabe, Bulletin of the Chemical Society of Japan 70, 2383 (1997).
- Johnston (2010) D. C. Johnston, Advances in Physics 59, 803 (2010).
- Demazeau et al. (1993) G. Demazeau, D.-Y. Jung, J.-P. Sanchez, E. Colineau, A. Blaise, and L. Fournes, Solid State Communications 85, 479 (1993).
- Aharen et al. (2009) T. Aharen, J. E. Greedan, F. Ning, T. Imai, V. Michaelis, S. Kroeker, H. Zhou, C. R. Wiebe, and L. M. D. Cranswick, Phys. Rev. B 80, 134423 (2009).
- Aharen et al. (2010) T. Aharen, J. E. Greedan, C. A. Bridges, A. A. Aczel, J. Rodriguez, G. MacDougall, G. M. Luke, T. Imai, V. K. Michaelis, S. Kroeker, et al., Phys. Rev. B 81, 224409 (2010).
- (36) One may wonder why the stretching exponent does not change in the temperature regime where the BPP peak of occurs. However, already points towards a rather broad distribution of relaxation rates, including the relaxation rates in the peak region.
- Bloembergen et al. (1947) N. Bloembergen, E. M. Purcell, and R. V. Pound, Nature 160, 475 (1947).
- Bloembergen et al. (1948) N. Bloembergen, E. M. Purcell, and R. V. Pound, Phys. Rev. 73, 679 (1948).
- Suh et al. (2000) B. J. Suh, P. C. Hammel, M. Hücker, B. Büchner, U. Ammerahl, and A. Revcolevschi, Phys. Rev. B 61, R9265 (2000).
- Curro et al. (2000) N. J. Curro, P. C. Hammel, B. J. Suh, M. Hücker, B. Büchner, U. Ammerahl, and A. Revcolevschi, Phys. Rev. Lett. 85, 642 (2000).
- Curro et al. (2009) N. J. Curro, A. P. Dioguardi, N. ApRoberts-Warren, A. C. Shockley, and P. Klavins, New J. Phys. 11, 075004 (2009).
- Hammerath et al. (2013) F. Hammerath, U. Gräfe, T. Kühne, H. Kühne, P. L. Kuhns, A. P. Reyes, G. Lang, S. Wurmehl, B. Büchner, P. Carretta, et al., Phys. Rev. B 88, 104503 (2013).
- Hammerath et al. (2015) F. Hammerath, M. Moroni, L. Bossoni, S. Sanna, R. Kappenberger, S. Wurmehl, A. U. B. Wolter, M. A. Afrassa, Y. Kobayashi, M. Sato, et al., Phys. Rev. B 92, 020505 (2015).
- Kusch et al. (2017) M. Kusch, V. M. Katukuri, B. Büchner, T. Dey, D. Efremov, J. E. Hamann-Borrero, B. H. Kim, M. Krisch, A. Malyuk, M. Moretti, et al. (2017).
- Nag et al. (2017) A. Nag, S. Bhowal, M. M. Sala, A. Efimenko, F. Bert, P. K. Biswas, A. D. Hillier, M. Itoh, S. D. Kaushik, V. Siruguri, et al., arXiv:1707.09304 (2017).
- Fuchs et al. (2017) S. Fuchs, T. Dey, G. Aslan-Cansever, A. Alfonsov, V. Kataev, S. Wurmehl, and B. Büchner (2017).
- Campbell et al. (1994) I. A. Campbell, A. Amato, F. N. Gygax, D. Herlach, A. Schenck, R. Cywinski, and S. H. Kilcoyne, Phys. Rev. Lett. 72, 1291 (1994).
- Chen et al. (2017) Q. Chen, C. Svoboda, Q. Zheng, B. C. Sales, D. G. Mandrus, H. D. Zhou, J. S. Zhou, D. McComb, M. Randeria, N. Trivedi, et al., arXiv:1707.06980 (2017).