Single-dish and VLBI observations of Cygnus X-3 during the 2016 giant flare episode
Abstract
In September 2016, the microquasar Cygnus X-3 underwent a giant radio flare, which was monitored for 6 days with the Medicina Radio Astronomical Station and the Sardinia Radio Telescope. Long observations were performed in order to follow the evolution of the flare on a hourly scale, covering six frequency ranges from 1.5 GHz to 25.6 GHz. The radio emission reached a maximum of Jy at 7.2 GHz and Jy at 18.6 GHz. Rapid flux variations were observed at high radio frequencies at the peak of the flare, together with rapid evolution of the spectral index: steepened from 0.3 to 0.6 (with ) within 5 hours. This is the first time that such fast variations are observed, giving support to the evolution from optically thick to optically thin plasmons in expansion moving outward from the core. Based on the Italian network (Noto, Medicina and SRT) and extended to the European antennas (Torun, Yebes, Onsala), VLBI observations were triggered at 22 GHz on five different occasions, four times prior to the giant flare, and once during its decay phase. Flux variations of 2-hour duration were recorded during the first session. They correspond to a mini-flare that occurred close to the core ten days before the onset of the giant flare. From the latest VLBI observation we infer that four days after the flare peak the jet emission was extended over 30 mas.
keywords:
radio continuum: stars – X-rays: binaries – stars: individual: Cyg X-3 – stars: flare – stars: jets1 Introduction
Galactic X-ray binaries with jets are called microquasars, in analogy to the phenomena seen in quasars but on much smaller scales (Mirabel & Rodríguez, 1999). Most microquasars host a stellar-mass black hole as the compact object. They spend most of their time in a dormant state and suddenly enter into periods of outburst activity. Major progress has been made in the understanding of the accretion/ejection connections thanks to multi-wavelength observations. However, the formation of relativistic jets, their composition and exact launching mechanisms are still poorly known.
Discovered by Giacconi et al. (1967) at the dawn of X-ray astronomy, Cygnus X-3 (Cyg X-3) is a rare high-mass X-ray binary consisting of a compact object wind-fed by a Wolf-Rayet star (van Kerkwijk et al., 1996; Fender et al., 1999; Koch-Miramond et al., 2002). The nature of the compact object is still uncertain, but a black hole seems to be favored considering X-ray and radio emissions (Hjalmarsdotter et al., 2009; Shrader et al., 2010, and references therein). Located in the Galactic plane at a distance of 7–9 kpc (Predehl et al., 2000; Ling et al., 2009; McCollough et al., 2016), Cyg X-3 has a short orbital period of 4.8 hr (Parsignault et al., 1972). It is a reasonably strong persistent radio source with a typical flux of about 100–200 mJy in the quiescent state (Waltman et al., 1996). Flares of various amplitudes are frequently detected, classified as minor or major flares according to the flux density below or above 1 Jy. Quenched radio states (< 30 mJy; Waltman et al., 1996) are occasionally observed for Cyg X-3. They are usually followed by major radio flares on a scale of a few days or weeks (Waltman et al., 1994, 1995). Radio fluxes of 10–20 Jy associated with giant flare events have been measured, with an increasing flux of a factor in a few days (Waltman et al., 1995; Mioduszewski et al., 2001; Miller-Jones et al., 2004; Corbel et al., 2012). No other X-ray binary has shown such strong and uncommon flux densities up to 20 Jy, which makes Cyg X-3 the brightest X-ray binary at radio frequencies. One- and two-sided relativistic jets with a complex structure were clearly resolved during these episodes using the Very Long Array (VLA), the Very Long Baseline Array (VLBA) and the European Very Long Baseline Interferometry Network (e-EVN) (Martí et al., 2001; Mioduszewski et al., 2001; Miller-Jones et al., 2004; Tudose et al., 2007).
X-ray data from Cyg X-3 is more complex compared to other X-ray binaries (Bonnet-Bidaud & Chardin, 1988; Szostek & Zdziarski, 2008; Koljonen et al., 2010). Strong X-ray absorption at low energies is likely associated with the dense wind of the companion star (Szostek & Zdziarski, 2008). Despite the complex spectral behaviour, observations have demonstrated that the source exhibits the canonical X-ray states (hard, intermediate, and soft states; McClintock & Remillard 2006; Belloni 2010) in addition to the very high state and the ultra-soft state (Szostek & Zdziarski, 2004; Hjalmarsdotter et al., 2009). The connections between the X-ray (accretion) and radio (ejections) emission of Cyg X-3 have been widely studied (Watanabe et al., 1994; McCollough et al., 1999; Gallo et al., 2003; Hjalmarsdotter et al., 2008; Szostek et al., 2008; Zdziarski et al., 2016). In particular, giant radio flares correspond to the transition from the ultra-soft state to a harder X-ray state (Koljonen et al., 2010).
Cyg X-3 was also the first microquasar detected in gamma rays with AGILE and Fermi/LAT (Tavani et al., 2009; Fermi LAT Collaboration et al., 2009), providing unique insight into the particle acceleration up to GeV energies during the ejection. Gamma-ray emission was detected by Fermi-LAT during the 2011 giant flare episode (Corbel et al., 2012). The high-energy emission (> 100 MeV) corresponds to transitions in and out of ultra-soft X-ray state.
The Sardinia Radio Telescope (SRT111www.srt.inaf.it) has carried out a large-monitoring program of several X-ray binaries during the Early Science Program (ESP222www.srt.inaf.it/astronomers/early-science-program-FEB-2016/), from February to July 2016 (PI: Egron). The weekly monitoring performed at 7.2 and 22 GHz has shown that Cyg X-3 was in the quiescent state during this period. A quenched radio state was detected by the RATAN-600 on 23–25 August 2016 (Trushkin et al., 2016b), five and a half years after its last quenched episode. The ultra-soft X-ray state was confirmed by Swift/BAT333see Krimm et al. 2013 for a description of the Swift/BAT transient monitor, which registered a strong decrease of a factor 25 of the hard X-ray emission in the 15–50 keV band in less than 10 days, from 15 August to 24 August. The AGILE-GRID detector revealed gamma-ray emission above 100 MeV consistent with the position of Cyg X-3 on 28–30 August (Piano et al., 2016). The strong increase of the radio flux occurred from 14 September, three weeks after the transition to the quenched radio state (Trushkin et al., 2016b, c). A gamma-ray flare was detected by Fermi/LAT the same days, on 15–16 September (Cheung & Loh, 2016).
In this paper, we present single-dish and Very Long Baseline Interferometry (VLBI) observations of Cyg X-3 corresponding to the 2016 September giant flare episode. We present the details of the observations and data reduction in Section 2, the evolution of the flux density and spectral index in Section 3, and discuss the results we obtained, in particular the jet characteristics and morphologies associated with the mini and giant flares in Section 4.
2 Observations and data reduction
We initially planned to perform VLBI observations to catch the source during the rising and declining phases of the flare in order to track the evolution of the relativistic jets. Due to the difficulty to trigger VLBI observations in a very short time (considering the availability of the antennas), we conducted single-dish observations at the moment of the peak of the flare (Egron et al., 2016a). The recently commisioned 64 m-SRT (Bolli et al., 2015; Prandoni et al., 2017) participated in both single-dish and VLBI observations, together with the 32 m-Medicina radio telescope. VLBI observations included SRT, Medicina, Noto, Torun, Yebes and Onsala in order to provide a larger coverage of the -plane.
2.1 Single-dish observations
A Target-Of-Opportunity program for Cyg X-3 was triggered by the Italian Medicina Radio Astronomical Station and SRT single dishes. The outburst was followed from 17 to 23 September 2016. Both antennas were equipped with the same control software designed to optimize single-dish observations (Orlati et al., 2016). The frequency agility (switching the observing frequencies in only a few minutes) coupled with the different SRT and Medicina receivers enabled a large frequency coverage of Cyg X-3 during the flare, from 1.5 GHz to 25.6 GHz.
SRT observations were carried out at 1.5 GHz (L-band), 7.2 GHz (C-band), and 22.7 GHz (K-band) using the Total Power and SARDARA (Melis et al. in prep.) backends in piggy-back mode. Observations consist of rectangular and perpendicular On-The-Fly (OTF) maps performed in the Right Ascension (RA) and Declination (DEC) directions (forming a Greek cross map), at constant velocity (/sec). The dimensions of the maps were chosen according to the beam size (see Table 1) at the observed frequencies: at 1.55 GHz, at 7.2 GHz and at 22.7 GHz. This method has been applied during the Early Science Program dedicated to the monitoring of X-ray binary systems. The observing strategy has the advantage of providing a direct image of the sources in the vicinity of the target and a better estimate of the flux density. The data analysis was accomplished with the SRT Single-Dish-Imager (SDI; Egron et al. 2016b), a software designed to perform automated baseline subtraction, radio interference rejection, and calibration. The spectral flux density of the target was reconstructed by observing three calibrators (3C286, 3C295 and 3C48) at all frequencies, by applying the values and polynomial expressions proposed by Perley & Butler (2013).
Cyg X-3 was observed with Medicina at 8.5 GHz (X-band), 18.6 GHz and 25.6 GHz (K-band), using the OTF cross-scan technique in RA and DEC directions. In X-band, the bandwidth was 680 MHz with a scan length and velocity of and /sec respectively, while in K-band we selected a bandwidth of 1200 MHz, scans of length and a scan velocity of /sec. We applied gain curve and pointing offset corrections to the measurements. Additional opacity and atmospheric corrections were added in the case of K-band data (18.6 GHz and 25.6 GHz). The flux calibration was performed with observations of 3C286, 3C48 and NGC7027. The flux of 3C286 was calculated according to Perley & Butler (2013), while the fluxes of the other calibrators were reckoned on the basis of Ott et al. (1994). The single-dish observations are reported in Table 2.
| Radio | Frequency | Beam size |
| Telescope | (GHz) | (arcmin) |
| SRT | 1.5 | 12.2 |
| 7.2 | 2.63 | |
| 22.7 | 0.816 | |
| Medicina | 8.5 | 4.55 |
| 18.6 | 2.08 | |
| 25.6 | 1.51 |
| Obs date | MJD | Frequency | Flux density |
|---|---|---|---|
| (GHz) | (Jy) | ||
| 17 Sept 2016 | 57648.86 | 8.5 | 13.1 0.4 |
| 57648.88 | 12.9 0.4 | ||
| 57648.90 | 13.0 0.4 | ||
| 57648.92 | 12.9 0.4 | ||
| 57648.95 | 18.6 | 7.5 0.8 | |
| 57648.97 | 25.6 | 7.0 0.7 | |
| 19 Sept 2016 | 57650.62 | 7.2 | 12.0 0.6 |
| 57650.65 | 8.5 | 12.9 0.4 | |
| 57650.67 | 12.9 0.4 | ||
| 57650.67 | 7.2 | 12.6 0.6 | |
| 57650.70 | 13.1 0.7 | ||
| 57650.70 | 18.6 | 8.9 0.9 | |
| 57650.71 | 7.2 | 12.8 0.6 | |
| 57650.72 | 22.7 | 9.5 0.9 | |
| 57650.73 | 18.6 | 10 1 | |
| 57650.77 | 7.2 | 13.2 0.7 | |
| 57650.88 | 12.8 0.6 | ||
| 57650.91 | 12.9 0.6 | ||
| 57650.91 | 25.6 | 6.1 0.6 | |
| 57650.93 | 5.6 0.6 | ||
| 57650.95 | 22.7 | 6.4 0.6 | |
| 20 Sept 2016 | 57651.54 | 7.2 | 11.4 0.6 |
| 57651.61 | 8.5 | 12.1 0.4 | |
| 57651.63 | 7.2 | 11.8 0.6 | |
| 57651.65 | 18.6 | 7.2 0.7 | |
| 57651.68 | 25.6 | 7.3 0.7 | |
| 21 Sept 2016 | 57652.67 | 7.2 | 6.9 0.3 |
| 57652.72 | 22.7 | 3.6 0.4 | |
| 57652.76 | 1.5 | 14.4 0.5 | |
| 22 Sept 2016 | 57653.97 | 8.5 | 3.2 0.1 |
| 57653.99 | 3.1 0.1 | ||
| 23 Sept 2016 | 57654.00 | 8.5 | 3.1 0.1 |
2.2 VLBI observations
We triggered five VLBI observations on Cyg X-3, from the quenched radio state until the end of the strong flare episode. Our aim was to catch the target in the rising and fading phases of the predicted giant flare (Trushkin et al., 2016b) in order to follow the evolution of the relativistic jets. The first two VLBI observations were triggered on 1 and 3 September 2016, right after the first increase of the hard X-ray emission recorded by the Swift/BAT on 29 August 2016. It turned out that the X-ray flux decreased three days later and the giant flare did not occur at that time. We triggered other VLBI observations a few days later, on 9 and 10 September 2016, after a second increase of the X-ray flux on 8 September. The last observation was carried out on 23 September, during the declining phase of the giant radio flaring episode. The observing sessions are indicated in the bottom panel of the Figure 1.

The VLBI observations were performed at 22 GHz with the following radio telescopes, according to their availability: SRT (Sr), Medicina (Mc), Noto (Nt, 32 m, Italy), Torun (Tr, 32 m, Poland), Yebes (Ys, 40 m, Spain) and Onsala (On, 20 m, Sweden). We alternately observed Cyg X-3 and the calibrators 3C345, BL Lac, J2007+4029, and J2015+3710, resulting in sessions of 7–15.5 hrs each. The data were processed with the DiFX correlator (Deller et al., 2011) installed and operated in Bologna. The VLBI analysis was performed with the Astronomical Image Processing System (AIPS; Greisen, 2003). The calibrator J2007+4029 was used to perform the phase referencing. The phase-referencing cycle was 4 min: 2.5 min on the target and 1.5 min on phase-cal. Since the calibrator-target separation was quite large (), and the region is subject to significant scatter, we also observed the check source J2015+3710 every 30 min. This source was also phase-referenced to J2007+4029 and it was used to confirm that the phase solutions were transferred correctly. We also tried to fringe-fit the Cyg X-3 data directly, in order to estimate its signal-to-noise ratio in each 2.5 min long scan. However, these results were rather used for data quality assessment than for further analysis.
3 Results
3.1 Single-dish monitoring of the giant flare
Medicina and SRT provided the monitoring of Cyg X-3 from 17 September to 23 September at 1.5, 7.2, 8.5, 18.6, 22.7 and 25.6 GHz, which was complementary to the daily monitoring of the source performed with the RATAN-600 (covering the 2.3, 4.6, 8.2, 11.2, 21.7 GHz frequencies; Trushkin et al., 2016a). Our observations are summarized in Table 2 and represented in Fig. 1, together with the X-ray light curves obtained with data daily averages from Swift/BAT at 15–50 keV and MAXI at 2–4 keV in Crab units4441 Crab = 0.22 ct/cm2/sec for the Swift/BAT rate and 1 Crab = 1.67 ct/cm2/sec for the MAXI rate.. The hardness ratio obtained from Swift/BAT and MAXI data is also reported despite the lack of MAXI data during most of the ultra-soft X-ray state, even though present in the Swift/BAT light curve.
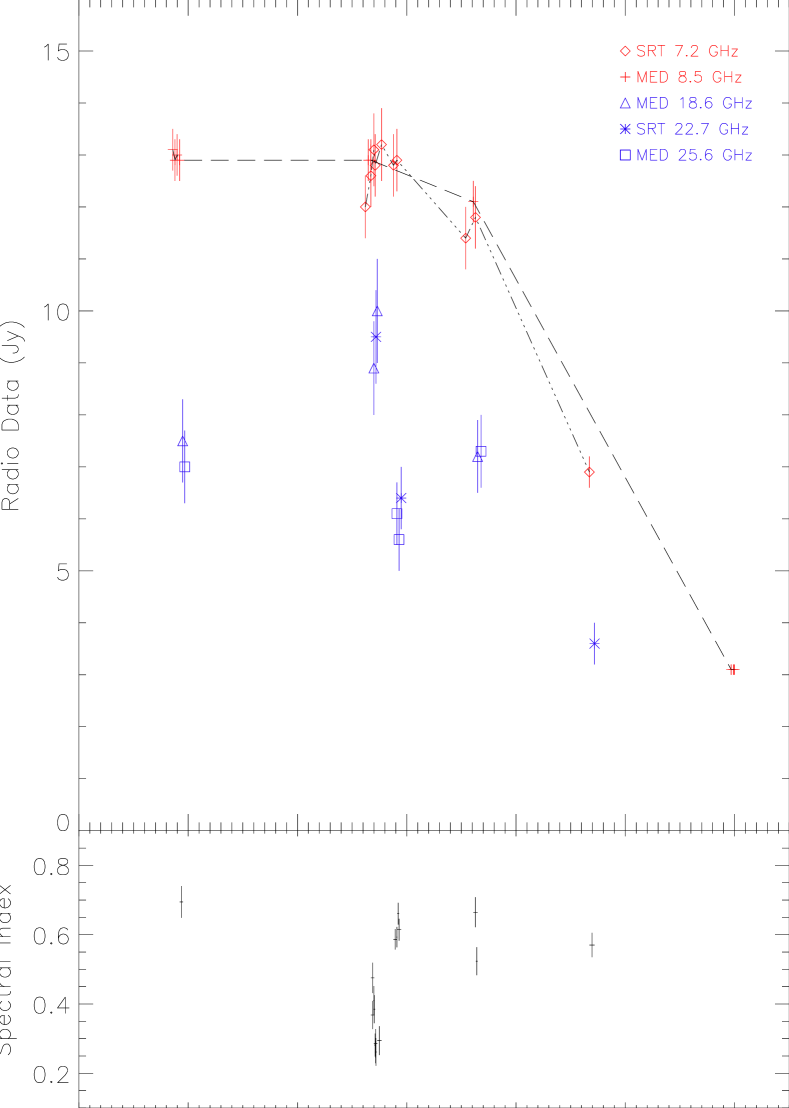
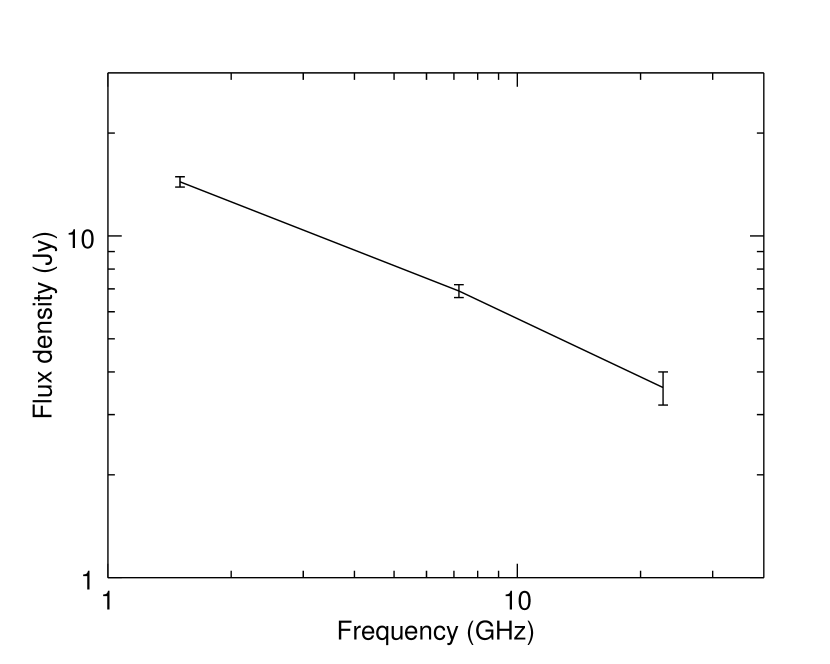
The giant radio flare reached its highest brightness on 19 September 2016 (MJD 57650.7). While the flux density remained quite stable ( Jy) at 7.2–8.5 GHz during the peak maximum, we observed flux variations on the timescale of a few hours in K-band, as shown in Fig. 2 and 3 (note that all error bars are at the level). The 18.6, 22.7 and 25.6 GHz observations performed independently (observational and data reduction techniques) with Medicina and SRT are perfectly consistent, demonstrating a decrease of the flux within less than 5 hours before it increased again the day after, on 20 September. On the other hand, the radio emission at 7.2–8.5 GHz severely weakened from 20 September; a reduction of Jy is detected within 2.4 days. Observations carried out with the SRT on 21 September at 1.5, 7.2 and 22.7 GHz indicated that the ejection is optically thin, as shown in Figure 4.
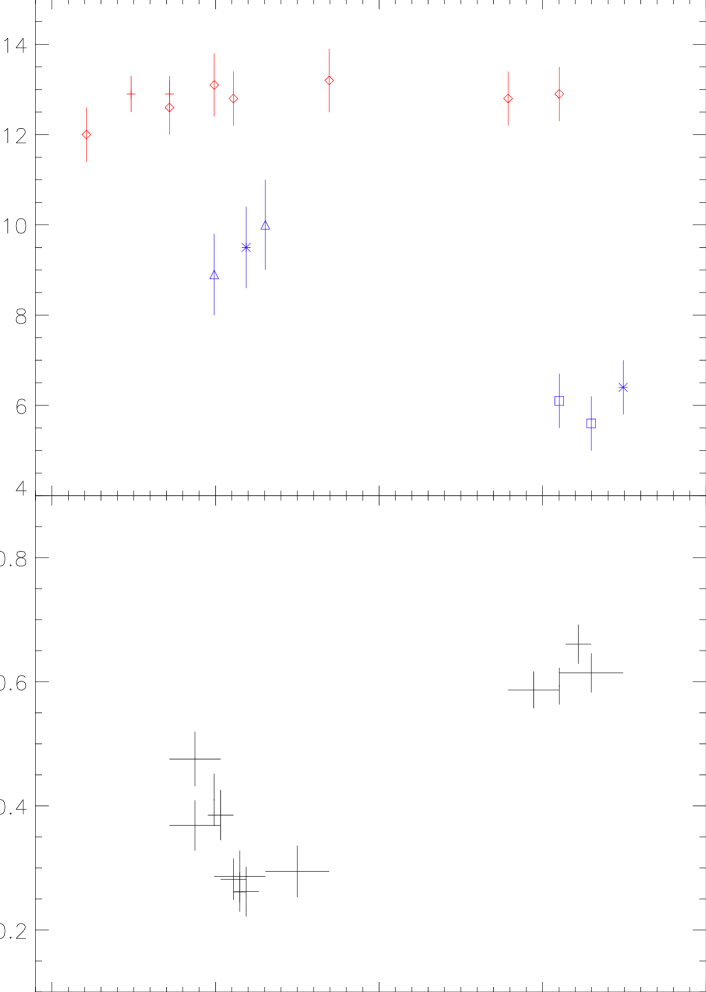
The evolution of the spectral index (with ) is shown in Figure 2. The spectral indexes were calculated by considering all couples of flux density measurements available at low and high frequencies (7.2–8.5 GHz and 18.6–25.6 GHz) within 1 hr from each other. Spectral index errors were derived from error propagation of flux density errors for each couple. The time tag of the reported spectral index values corresponds to the mid time between the epochs of each flux density measurement couple. The error bars on the x-axis (time) reflects the epoch separation for each couple of flux density measurements. We clearly observed a spectral steepening from to within hrs at the moment of the peak maximum of the flare. In Figure 3, we show a zoom of the light curve and spectral index evolution for the observation of 19 September 2016 (MJD 57650).
3.2 VLBI results
Compact (milliarcsecond scale) radio emission was detected from Cyg X-3 during the first VLBI observation, on 1 September 2016. This detection was confirmed both for the phase-referenced visibilities, whose amplitude and phase showed well-defined coherence, and from a run of fringe fitting directly to the source itself, which produced good solutions for all the intervals with valid data.
| Radio telescopes | Obs. date | MJD | MJD | Flux density |
|---|---|---|---|---|
| (start) | (end) | (mJy) | ||
| Sr, Mc, Nt, Tr, Ys | 1 Sept 2016 | 57632.67 | 57632.79⋆ | 440 |
| 57632.79⋆ | 57633.21 | 250 | ||
| Sr, Mc, Nt, Tr, Ys | 3 Sept 2016 | 57634.67 | 57635.21 | |
| Sr, Mc, Nt, Tr | 9 Sept 2016 | 57640.67 | 57641.19 | |
| Sr, Mc, Nt, Tr | 10 Sept 2016 | 57641.54 | 57641.83 | |
| Mc, Nt, Tr, On | 23 Sept 2016 | 57654.50 | 57655.15 |
⋆ The observations are split to report the different flux density values but they correspond to the same run.
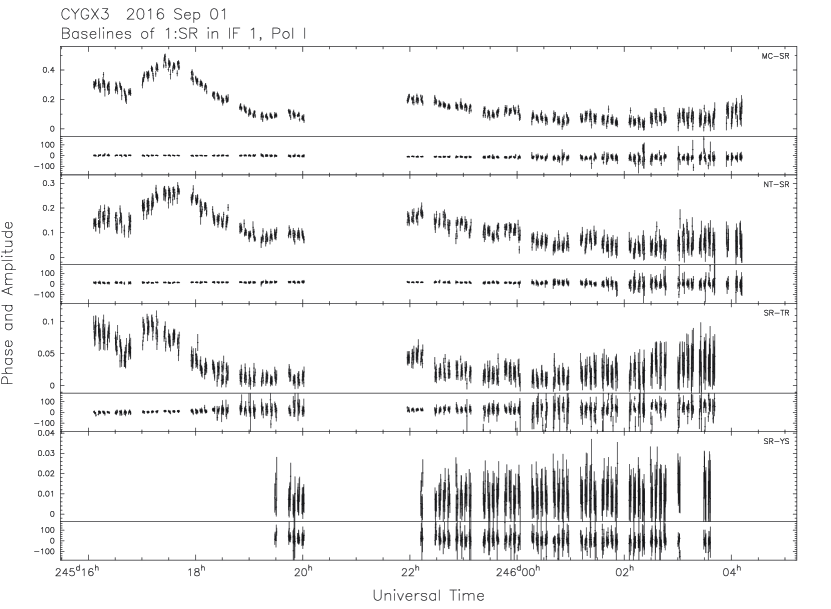
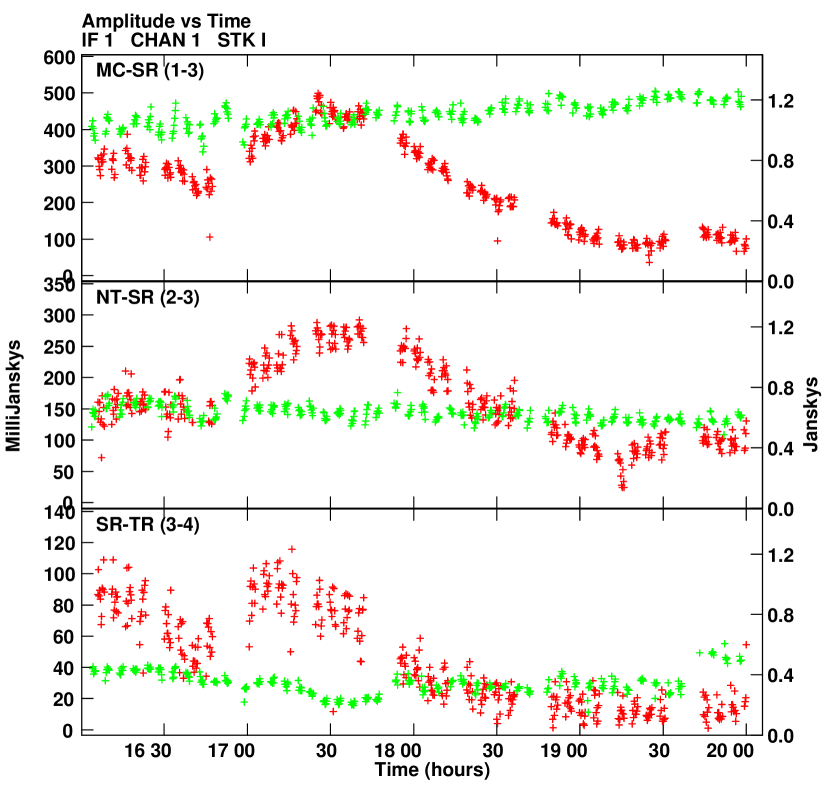
In Fig. 5, we show visibility amplitude and phase versus time for all the baselines to SRT. Other baselines show similar behaviour but with increased scatter due to lower baseline sensitivity. We note a variable total flux density: the amplitudes are in general higher in the first half of the session than in the second. Moreover, there is clear variability on hour-scale in the initial four hours of the observation. We exclude the possibility that this variability is instrumental: we present in Fig. 6 the visibility amplitudes (Mc-Sr, Nt-Sr, Sr-Tr baselines) for Cyg X-3 and J2007+4920 for the first four hours of observations. The comparison source shows the stability of the system, which allows us to infer that the amplitude variation is intrinsic to Cyg X-3. Moreover, the variations follow the same pattern on baselines of very different orientations in the -plane (including those not shown: Mc-Nt, Mc-Tr, Nt-Tr). This behaviour indicates that the amplitude variability is not due to the source structure but rather to intrinsic flux density variations.
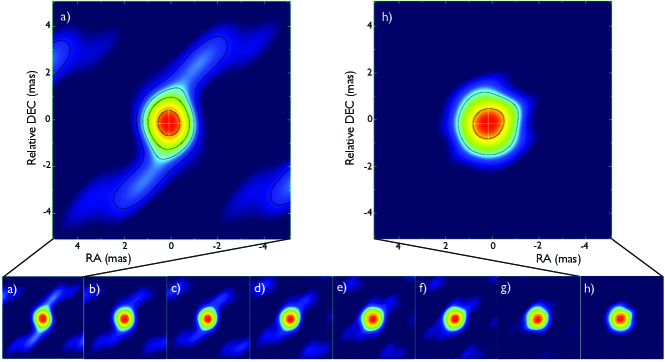
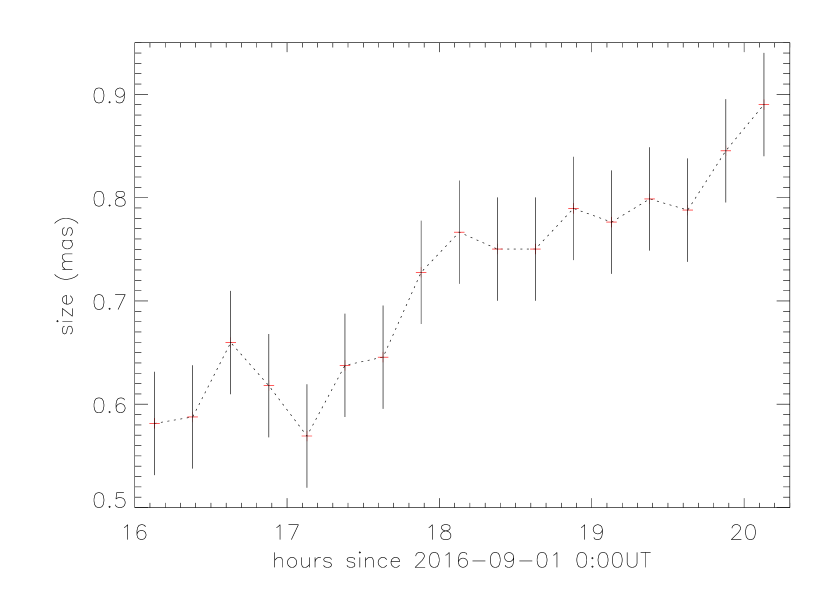
The short-scale time variability prevents us from obtaining a meaningful average image for the whole observation, as the imaging algorithms in interferometry produce a Fourier transform of the visibility amplitude and phase in the -plane to the brightness in the sky combining all visibilities together. Different portions of the -plane are therefore sampled at different times. When the source varies during the duration of the observation, the transform of the -plane consequently becomes ill-posed. For this reason, it is not possible to produce a meaningful image of the source from the entire dataset during our VLBI observation. A possibility would be to produce images for short time intervals, during which we can assume that variability plays a negligible role. However, in this case we can only use the visibilities acquired during that time interval, which means that we only sample a small portion of the -plane. As a result, the image quality becomes very poor (in particular for our sparse array of only 4–5 stations). This is the reason why we resorted to model-fitting in the -plane rather than to images. We model-fit the visibility within each time bin of 15 min by using a circular Gaussian model of 1.5 mas HPBW (the beam would naturally be elliptical; note that the real beam size during this observation was 1.50 mas 0.97 mas) in which we let position, amplitude, and width free to vary. It is therefore possible to study the evolution of the size of the emitting component, at least during the first 4 hours of the observation when we had a better signal-to-noise ratio to constrain the fit. The size of the emitting region increased with time from 0.6 to 0.9 mas radius, as shown in Fig. 7 and 8. After 20.00 UT on 1 September 2016, the size becomes smaller. This shrinking is most likely an artefact due to the low signal-to-noise-ratio. Another intriguing possibility is that the beam position angle is rotating from a direction aligned with the jet axis to a transverse one, so we see a narrower size.
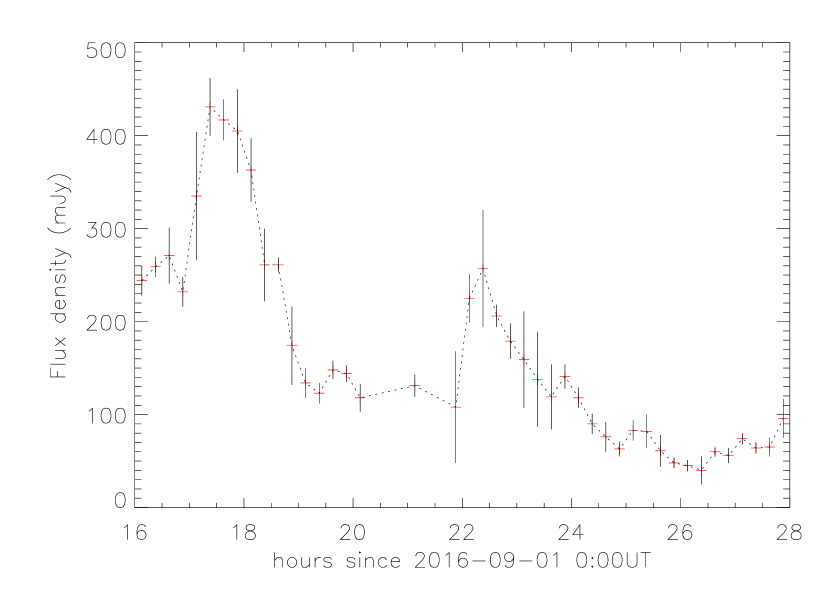
We have created both clean images and visibility data models for each time bin of 15 min and determined the target’s flux density using both methods. The resulting overall trends are entirely consistent. We report in Figure 9 the numbers provided by visibility model fits. Two small peaks of mJy and mJy flux density are clearly visible in the light curve, both with a 2-hour duration. We catched a mini-flare of Cyg X-3 instead of the expected giant flare event. The flux density variability on sub-hour scales is however clearly present and it is intrinsic to the source, as demonstrated in Figure 6.
The following VLBI observations triggered on 3, 9, and 10 September 2016 did not provide any detection of Cyg X-3 (upper limit of 8 mJy at ), as confirmed by the analysis in both the visibility and the image domains. In the visibility domain, after transferring phase solutions from the calibrator, we tried to fringe fit the source visibilities, finding no solution. After directly imaging the phase-referenced data, we did not find any significant peak in the image plane. Upper limits are reported in Table 3. Conservatively, we determined upper limits from the lack of fringe detections at significance in 2.5 minutes on the most sensitive baseline, based on the EVN online calculator555http://www.evlbi.org/cgi-bin/EVNcalc.pl. This is a more conservative approach than reporting the image rms noise. The latter is typically much lower but could underestimate the true source flux density in case of (1) variability on time scales shorter than the observation duration or (2) signifcant coherence losses due to imperfect phase referencing. These results are in agreement with the light curve obtained with the RATAN-600 at lower frequencies; the flux densities are between 10 and 40 mJy at 2.3, 4.6, 8.2, and 11.2 GHz (Trushkin et al., 2016a), which indicates a quenched radio state. The hard X-ray emission (Swift/BAT light curve) confirms the persistent ultra-soft state of the source during this period (see Fig. 1).
The case of the 23 September 2016 observation (last VLBI trigger) is more complex. SRT could not participate in the session due to technical problems following a storm. The fringe detection threshold therefore became significantly larger, probably around 15–20 mJy. Cyg X-3 was not detected even though the calibrators were correctly observed during the session. A summary of the five VLBI observations is presented in Table 3.
4 Discussion
4.1 X-ray and radio connections in August/September 2016
Ejection processes are closely linked to accretion in X-ray binaries, but the mechanisms at the origin of the launch of relativistic jets are not well established (Fender et al., 2004; Markoff et al., 2005).
The hard X-ray light curve (15–50 keV) extracted from Swift/BAT indicated that the flux of Cyg X-3 dramatically dropped starting from 15 August 2016 (MJD 57615) to reach an ultra-soft state ( Crab flux) a few days later (see Fig. 1). The hardness ratio and X-ray light curves obtained with MAXI (2–4 keV) and Swift/BAT highlight changes of states in Cyg X-3, from the ultra-soft to the soft state during the giant flare (maximum of the peak on MJD 57650), then from the soft to the hard state at the end of the event (MJD 57660). This favors changes in the accretion rate, likely related to variations in the mass-loss from the dense stellar wind associated with the Wolf-Rayet companion star (Kitamoto et al., 1994; Watanabe et al., 1994; Gies et al., 2003).
The quenching of the jet in the ultra-soft X-ray state could be a direct consequence of high accretion rates, with the inner radius of the disc approaching very close to the compact object (Hjalmarsdotter et al., 2009). Giant flares mark the end of this state and the transition to the soft state (Corbel et al., 2012). In this way, they became predictable events (Koljonen et al., 2010; Trushkin et al., 2016b).
A correlation may be present between the duration of the ultra-soft state and the strength of the subsequent radio flare. The two last giant flares in March 2011 and September 2016 had an extensive radio and X-ray monitoring that covered the full duration of the events. The March 2011 flare followed a very long ultra-soft state of days, reached a peak flux density of Jy at 15 GHz, doubling the September 2016 flare flux density ( Jy at 18.6 GHz) that occurred after a much shorter ultra-soft state ( days). Even for the multiple flares in 2006, the stronger double radio event in May peaking at 14 Jy at 15 GHz is preceeded by a longer ultra-soft state ( days) with respect to the July event (7 Jy at 11.2 GHz and 20 days ultra-soft state).
4.2 A small flare precursor to the giant flare
While Cyg X-3 was in the ultra-soft state, the hard X-ray flux suddenly increased for the three days following 29 August 2016 ( Crab flux), before decreasing again on 1 September (see Fig. 1). Fast variations of the flux density were detected at 22 GHz during the first VLBI session triggered on the same day (MJD 57632.7). Figure 9 shows the presence of two peaks of mJy and mJy with a duration of two hours each, while the off-peaks indicate a general diminution of the flux density. Images of the emitting component obtained during the first four hours of the observation highlighted an increase of the emission size from 0.6 to 0.9 mas (radius), as shown in Fig. 7 and Fig. 8 at the moment of the first peak at mJy during the mini-flare. We measured an expansion of 0.3 mas in radius in 4 hours, equivalent to a velocity of 0.07–0.09, assuming a distance to the source at 7–9 kpc. This velocity appears to be slower than the sound speed in mildly relativistic plasma and could be associated with the presence of a wind rather than a jet. The source was not detected during the VLBI observation performed a few days later, on 3, 9, and 10 September (upper limit of 8 mJy at 22 GHz).
The RATAN-600 light curve confirmed the presence of a mini-flare (Trushkin et al., 2016a) that started on 30 August and lasted for days before Cyg X-3 came back to the quenched state ( mJy at 11.2 GHz). The peak reached a maximum of 600–700 mJy at 8.2–11.2 GHz and mJy at 4.6 GHz on 1 September (Trushkin et al., 2016a). Our VLBI data obtained on 1 September 2016 correspond to the very beginning of the declining phase of the small flare, about 10 days before the onset of the rising phase of the giant flare. The short-duration flare occurred close to the core, with an evidence of a very slight extension of the wind or jet. Similar small radio flares have often been observed prior to giant flare events of Cyg X-3 (Waltman et al., 1994, 1995; Newell et al., 1998; Kim et al., 2013). In particular, a VLBI observation performed in 2007 during a short-live flare (3 hours) with a flux density of 1.6 Jy gives similar results. The analysis of the Gaussian fits to the visibility amplitudes with time bin of 10 min have shown an increase of the source size or a structural change during the mini-flare (Kim et al., 2013). In both cases, we note that the emitting size slightly increases from the peak of the mini-flare until the end of the flare. As a consequence, the maximum of the flux density is reached before the small expansion of the wind or jet occured.
4.3 Spectral index evolution during the giant flare
Single-dish observations of Cyg X-3 show evidence of flux density variations on a timescale of a few hours. The variations observed in the 7.2–8.5 GHz and 18.6–25.6 GHz light curves do not follow the same trend, in particular at the peak maximum, on 19 September 2016. While the flux density at lower frequencies remains quite stable, fast changes are observed at higher frequencies. The evolution of the spectral index testifies the high variability of the source. The spectral index flattens () during the rise of the source flux, while it steepens () when the source flux declines at high frenquencies. We note that the values of the spectral index are very similar to the ones associated with previous giant flares (Miller-Jones et al., 2004, and references therein) and with low-level flare events (Miller-Jones et al., 2009). However, the spectral steepening over a timescale of hours is for the first time highlighted. Miller-Jones et al. (2004) studied several hypotheses based on energy-dependent loss mechanisms to explain the steepening on the scale of a few days. Synchrotron, bremsstrahlung, inverse Compton and leakage (diffusive escape) losses have been ruled out because of the too long timescales. The only mechanism capable of producing such a spectral evolution is related to light-travel time effects in plasmons (van der Laan, 1966). Plasmons would evolve from optically thick to optically thin as they move outward from the core and expand. A flat-spectrum core component dominates the flux density initially but fades over time. A steep spectral index would be reached when the plasmons become optically thin.
4.4 Comparison between the small and the giant flares
Cyg X-3 was not detected during the last VLBI observation performed at 22 GHz, four days after the peak of the giant flare. Medicina recorded a flux density of Jy at 8.5 GHz the same day, while the RATAN-600 detected a radio emission of Jy at 21.7 GHz on 22 September 2016 and Jy on 24 September 2016 (Trushkin et al., 2016a). We can estimate the expected flux density at 22 GHz on 23 September, considering that the fading of the flare follows an exponential law , where the day of the peak maximum. This results in a flux density estimated at Jy, much higher than the upper limit we infered for this observation. The source was therefore strongly resolved out at mas scales.
In this way, our VLBI observations give us a direct comparison between the decay phases of the small/short-duration flare and the giant/longer flare in September 2016. Multi-frequency observations carried out with SRT on 21 September indicated that the spectrum of Cyg X-3 was optically thin two days after the peak of the flare. Trushkin et al. (2016a) confirm this statement and find a clear transition from optically thick to optically thin spectra right after the flare reached its highest brightness. Similar conclusions were drawn in the case of small flares (Miller-Jones et al., 2009). Optically thick spectra are most likely attributed to synchrotron self-absorption or thermal electrons mixed with relativistic ones, whereas optically thin spectra are probably associated with ejecta in expansion moving outwards from the core (Miller-Jones et al., 2009).
The results we obtained with the single-dish and VLBI observations are consistent with the shock-in-jet scenario supported by Lindfors et al. (2007), Miller-Jones et al. (2009) and Türler (2011). These authors suggest that the differences in shape, amplitude, timescale and frequency range of the flares are related to the strength of the shocks along the jet. Weaker and faster flares are produced closer to the core (Türler et al., 1999) whereas brighter flares evolve on longer time scales, peak at lower frequencies, and are the consequence of shocks forming further downstream in the jet. Shocks could provide a mechanism for the continuous replenishment of relativistic particles (Atoyan & Aharonian, 1999). However, shocks generally give an index of the power-law energy distribution of relativistic particles or with . While it may be possible to produce a in shocks, magnetic reconnection in relativistic plasmas with a relatively high magnetization could also explain the change from to 2.2 or to 0.6 (Guo et al., 2014; Sironi & Spitkovsky, 2014; Sironi et al., 2016).
The gamma-ray flares detected just before the mini radio flare with AGILE (Piano et al., 2016) and at the very onset of the giant radio flare with Fermi/LAT (Cheung & Loh, 2016) are also in agreement with our results and with the conclusions drawn from Corbel et al. (2012) during the March 2011 giant flare. The gamma-ray activity is most likely related to shocks appearing at different distances along the jet. Particle acceleration (thanks to shocks or reconnection) happening closer to the core is consistent with a brighter gamma-ray emission than that observed in shocks produced further downstream where the energy density in seed photon decreases, reducing inverse-Compton emission (Dubus et al., 2010).
4.5 Comparison with previous giant flares
In the following, we try to infer some constraints on the geometry and structure of the jet associated with the fading giant flare on 23 September 2016, based on a comparison with previous giant flares of Cyg X-3. Since the discovery of the first major radio flares by Gregory & Kronberg (1972), Cyg X-3 has gone through a dozen of giant flare episodes exceeding 10 Jy (Waltman et al., 1995, and reference therein). The last five giant flares occurred in February 1997 (Mioduszewski et al., 2001), September 2001 (Miller-Jones et al., 2004), May-July 2006 (Pal et al., 2009; Koljonen et al., 2013), March 2011 (Corbel et al., 2012) and the last one in September 2016 (Trushkin et al., 2016a).
High-resolution images obtained with the VLBA clearly demonstrated the complex jet-like structures during the 1997 and 2001 flares. A one-sided jet was detected in the south direction during the 1997 flare, with a speed and a precession period days (Mioduszewski et al., 2001). The jet emission extended over 50 mas two days after the peak of the flare (10 Jy at 15 GHz), and over 120 mas two days later. The corresponding synthesized beams were 3–5 mas while the proper motion of the jet was mas/day. This implies a movement by at least 2 beams during the hrs of the observations, which did not affect the images. VLBA images obtained at 22 GHz during the peak maximum of the 2001 flare revealed a strong core emission (Miller-Jones et al., 2004). The corresponding flux density was measured at 7.4 Jy with the VLA. A two-sided jet in an almost north-south orientation then appeared the following day, consisting of several discrete knots. A successive observation was triggered two days after the peak maximum and confirmed the expansion of the knot sequence with the fading flux density of Jy. The proper motions of individual knots, whose initial diameters are mas, were measured for the first time and showed evidence of a 5-day jet precession period with a jet speed .
The angular scale associated with our VLBI observation on 23 September 2016 was mas, depending on the projected baseline in the -plane. In particular, we estimate a sensitivity of 20 mJy beam-1, with a beam of 1.4 mas 0.8 mas full-width at half maximum (FWHM). This corresponds to a beam area of 0.88 mas2. The total flux density of the source estimated from the RATAN-600 light curve is 1.4 Jy. If we assume a symmetric, two-sided ejection, our non detection therefore implies that each of the two Jy features is distributed over a sky area such that ; i.e. . For a circular component, we thus determine the size of each region to be mas2, or mas. If we further assume that the separation from the core is about faster than the blob expansion, that implies a distance from the black hole of mas, or 3–4 cm (67 AU), considering a location at 7–9 kpc. Depending on when we assume the time of ejection, it is straightforward to determine a lower limit to the projected jet knot velocity. For example, assuming a blob formation at the peak radio emission as suggested by the change in the spectral index we observed and the clear transition from optically thick to optically thin jet (Trushkin et al., 2016a) at that epoch (on 19 September), we would obtain a jet speed . This is consistent with the plasmon expansion speed derived from previous giant flares. Instead, a later blob formation ( day from this VLBI observation) would imply a superluminal motion.
4.6 The peculiar case of Cyg X-3
A comparison with well-known microquasars shows us that Cyg X-3 represents a unique and somehow very particular source for different reasons. No other X-ray binaries have shown radio flux densities up to Jy during giant flare events. Major flares of 1–10 Jy have been observed in some transient black hole X-ray binaries, such as in SS433, V404 Cyg, GRO J165540 and A062000, all associated with hard-to-soft X-ray transitions. Based on spectral, velocity and morphological characteristics, two types of radio jets have been identified during outbursts, corresponding to different X-ray states (Fender et al., 2009) and so different accretion regimes. A steady jet appearing as a bright core (Dhawan et al., 2000), with a flat or inverted spectrum indicating optically thick self-absorbed synchrotron emission is associated with the hard state (Fender et al., 2004). A transient jet, corresponding to the ejection of optically thin radio plasmons moving away from the core of the system at relativistic speeds (Mirabel & Rodríguez, 1994), is instead associated with the transition between two types of intermediate states, which are themselves in between the hard and the soft state (Fender et al., 2004). Transitions from steady to transient jet occurs during outbursts, corresponding to an inversion of the spectrum from inverted to optically thin, as also seen in GRS 1915+105 and LS I .
In the case of Cyg X-3, giant flares occur at the end of the ultra-soft X-ray state (Watanabe et al., 1994) also defined as hyper-soft state by Koljonen et al. (2010), during the transition to a harder state. The jet is found to be optically thick during the rising phase of the giant flare, corresponding to the soft X-ray state, while the jet becomes optically thin at the peak and declining phase of the flare, which corresponds to soft-to-hard state transition (Miller-Jones et al., 2004; Trushkin et al., 2016a). A similar transition from the steady to transient jet is therefore observed, however the association with X-ray states is clearly different from other transient X-ray binaries. The presence of strong stellar wind from the companion star could be at the origin of these differences.
GRO J165540 shows interesting similarities with Cyg X-3, in particular the presence of the hyper-soft X-ray state that could be associated with very high and unusual rate of accretion close to or above the Eddington limit (Uttley & Klein-Wolt, 2015), and strong radio flares up to 10 Jy. GRO J165540 is a black hole low-mass X-ray binary, that presents the most powerful (possibly magnetically driven) disk wind among the other microquasars. Hard X-ray flares have been detected during the transition from the soft to the ultra-soft X-ray state, and also in the ultra-soft state. The first flare observed in 2005 during the transition from the soft to the ultra-soft state is coincident with an optically thin radio flare which is relatively weak compared to transitional radio flares observed from GRO J165540 in earlier outbursts (Kalemci et al., 2016). However, no giant flare has been observed after the 2005 ultra-soft X-ray state666www.aoc.nrao.edu/~mrupen/XRT/GRJ1655-40/grj1655-40.shtml.
5 Conclusions
Cyg X-3 represents an exceptional target that offers the possibility to better understand the relationship between accretion state and jet launching mechanisms, and to compare the effect of accretion geometry (companion star, orbital parameters) to other sources with more typical behaviour, in particular in the extreme cases of giant flares. These very bright and spectacular radio events are rare, clearly associated with the ultra-soft X-ray state and gamma-ray emission. After 5.5 years of quiescence, a giant flare occurred in September 2016. Single-dish observations performed with Medicina and SRT followed the evolution of the peak over 6 days in six frequency ranges. The observed frequencies are complementary with the ones used in the RATAN-600. Moreover, the long exposures provided with the Italian radio telescopes allowed us to infer variation of the radio emission on short timescale. In particular, we highlighted a decline of the flux density at high radio frequency with a steepening of the spectrum from to within hours at the peak of the flare. It is the first time that such a steepening is observed on the hour scale, which gives support to plasmon evolution from optically thick to optically thin as they move outward from the core and expand.
VLBI observations were triggered at 22 GHz at different phases of the 2016 flare episode. Flux variations were detected within 2 hours ten days before the onset of the giant radio flare. They are associated with the declining phase of a mini and short-lived flare produced close to the core. We measured a slight increase of the source size at the moment of the highest peak of the mini-flare. A VLBI observation performed 4 days after the peak of the giant flare allows us to infer constraints on the size and velocity of the jet. The jet emission was most likely extended over 30 mas with a jet knot velocity assuming a blob formation at the peak emission as suggested by the change in the spectral index we observed.
The complementarity between single-dish and VLBI observations is essential in order to better understand ejection mechanisms during giant flare episodes. The data recorded with the recently commissioned SRT confirm its excellent capabilities operating as single-dish and VLBI antenna. The selection of a few EVN telescopes as a EVN lite is very useful to provide VLBI observations of such rare events. For the next giant flares, it would be interesting to perform multi-frequency single-dish observations in parallel to VLBI observations from the peak of the flare in order to better track the plasmon evolution from optically thick to optically thin, and directly see the link between changes in the spectral index and jet morphology on relative short time scales (a few hours). Moreover, it would be more fitted to consider EVN-lite observations at lower frequency during the decay phase of the flare in order to study the morphology, velocity and evolution of the jet.
Acknowledgements
The authors would like to thank S. Trushkin for the useful discussions about Cyg X-3. M.P. acknowledges financial support from the RAS (CRP-25476). S.C. acknowledges the financial support from the UnivEarthS Labex program of Sorbonne Paris Cité (ANR-10-LABX-0023 and ANR-11- IDEX-0005-02). E.K. acknowledges support from TUBITAK Grant 115F488. The Sardinia Radio Telescope is funded by the Department of University and Research (MIUR), the Italian Space Agency (ASI), and the Autonomous Region of Sardinia (RAS), and is operated as a National Facility by the National Institute for Astrophysics (INAF). Based on observations with the Medicina telescope operated by INAF - Istituto di Radioastronomia.
References
- Atoyan & Aharonian (1999) Atoyan A. M., Aharonian F. A., 1999, MNRAS, 302, 253
- Belloni (2010) Belloni T. M., 2010, in Belloni T., ed., Lecture Notes in Physics, Berlin Springer Verlag Vol. 794, Lecture Notes in Physics, Berlin Springer Verlag. p. 53 (arXiv:0909.2474), doi:10.1007/978-3-540-76937-8_3
- Bolli et al. (2015) Bolli P., et al., 2015, Journal of Astronomical Instrumentation, 4, 1550008
- Bonnet-Bidaud & Chardin (1988) Bonnet-Bidaud J. M., Chardin G., 1988, Phys. Rep., 170, 325
- Cheung & Loh (2016) Cheung C. C., Loh A., 2016, The Astronomer’s Telegram, 9502
- Corbel et al. (2012) Corbel S., et al., 2012, MNRAS, 421, 2947
- Deller et al. (2011) Deller A. T., et al., 2011, PASP, 123, 275
- Dhawan et al. (2000) Dhawan V., Mirabel I. F., Rodríguez L. F., 2000, ApJ, 543, 373
- Dubus et al. (2010) Dubus G., Cerutti B., Henri G., 2010, MNRAS, 404, L55
- Egron et al. (2016a) Egron E., Pellizzoni A., Iacolina M. N., Loru S., Righini S., Trois A., SRT Astrophysical Validation Team 2016a, INAF - Osservatorio Astronomico di Cagliari. Internal Report N.59,
- Egron et al. (2016b) Egron E., et al., 2016b, The Astronomer’s Telegram, 9508
- Fender et al. (1999) Fender R. P., Hanson M. M., Pooley G. G., 1999, MNRAS, 308, 473
- Fender et al. (2004) Fender R. P., Belloni T. M., Gallo E., 2004, MNRAS, 355, 1105
- Fender et al. (2009) Fender R. P., Homan J., Belloni T. M., 2009, MNRAS, 396, 1370
- Fermi LAT Collaboration et al. (2009) Fermi LAT Collaboration et al., 2009, Science, 326, 1512
- Gallo et al. (2003) Gallo E., Fender R. P., Pooley G. G., 2003, MNRAS, 344, 60
- Giacconi et al. (1967) Giacconi R., Gorenstein P., Gursky H., Waters J. R., 1967, ApJ, 148, L119
- Gies et al. (2003) Gies D. R., et al., 2003, ApJ, 583, 424
- Gregory & Kronberg (1972) Gregory P. C., Kronberg P. P., 1972, Nature, 239, 440
- Greisen (2003) Greisen E. W., 2003, Information Handling in Astronomy - Historical Vistas, 285, 109
- Guo et al. (2014) Guo F., Li H., Daughton W., Liu Y.-H., 2014, Physical Review Letters, 113, 155005
- Hjalmarsdotter et al. (2008) Hjalmarsdotter L., Zdziarski A. A., Larsson S., Beckmann V., McCollough M., Hannikainen D. C., Vilhu O., 2008, MNRAS, 384, 278
- Hjalmarsdotter et al. (2009) Hjalmarsdotter L., Zdziarski A. A., Szostek A., Hannikainen D. C., 2009, MNRAS, 392, 251
- Kalemci et al. (2016) Kalemci E., Begelman M. C., Maccarone T. J., Dinçer T., Russell T. D., Bailyn C., Tomsick J. A., 2016, MNRAS, 463, 615
- Kim et al. (2013) Kim J.-S., Kim S.-W., Kurayama T., Honma M., Sasao T., Kim S. J., 2013, ApJ, 772, 41
- Kitamoto et al. (1994) Kitamoto S., Miyamoto S., Waltman E. B., Fiedler R. L., Johnston K. J., Ghigo F. D., 1994, A&A, 281, L85
- Koch-Miramond et al. (2002) Koch-Miramond L., Ábrahám P., Fuchs Y., Bonnet-Bidaud J.-M., Claret A., 2002, A&A, 396, 877
- Koljonen et al. (2010) Koljonen K. I. I., Hannikainen D. C., McCollough M. L., Pooley G. G., Trushkin S. A., 2010, MNRAS, 406, 307
- Koljonen et al. (2013) Koljonen K. I. I., McCollough M. L., Hannikainen D. C., Droulans R., 2013, MNRAS, 429, 1173
- Krimm et al. (2013) Krimm H. A., et al., 2013, ApJS, 209, 14
- Lindfors et al. (2007) Lindfors E. J., Türler M., Hannikainen D. C., Pooley G., Tammi J., Trushkin S. A., Valtaoja E., 2007, A&A, 473, 923
- Ling et al. (2009) Ling Z., Zhang S. N., Tang S., 2009, ApJ, 695, 1111
- Markoff et al. (2005) Markoff S., Nowak M. A., Wilms J., 2005, ApJ, 635, 1203
- Martí et al. (2001) Martí J., Paredes J. M., Peracaula M., 2001, A&A, 375, 476
- McClintock & Remillard (2006) McClintock J. E., Remillard R. A., 2006, Black hole binaries. pp 157–213
- McCollough et al. (1999) McCollough M. L., et al., 1999, ApJ, 517, 951
- McCollough et al. (2016) McCollough M. L., Corrales L., Dunham M. M., 2016, ApJ, 830, L36
- Miller-Jones et al. (2004) Miller-Jones J. C. A., Blundell K. M., Rupen M. P., Mioduszewski A. J., Duffy P., Beasley A. J., 2004, ApJ, 600, 368
- Miller-Jones et al. (2009) Miller-Jones J. C. A., Rupen M. P., Türler M., Lindfors E. J., Blundell K. M., Pooley G. G., 2009, MNRAS, 394, 309
- Mioduszewski et al. (2001) Mioduszewski A. J., Rupen M. P., Hjellming R. M., Pooley G. G., Waltman E. B., 2001, ApJ, 553, 766
- Mirabel & Rodríguez (1994) Mirabel I. F., Rodríguez L. F., 1994, Nature, 371, 46
- Mirabel & Rodríguez (1999) Mirabel I. F., Rodríguez L. F., 1999, ARA&A, 37, 409
- Newell et al. (1998) Newell S. J., Garrett M. A., Spencer R. E., 1998, MNRAS, 293, L17
- Orlati et al. (2016) Orlati A., Bartolini M., Buttu M., Fara A., Migoni C., Poppi S., Righini S., 2016, in Society of Photo-Optical Instrumentation Engineers (SPIE) Conference Series. p. 991310, doi:10.1117/12.2232581
- Ott et al. (1994) Ott M., Witzel A., Quirrenbach A., Krichbaum T. P., Standke K. J., Schalinski C. J., Hummel C. A., 1994, A&A, 284, 331
- Pal et al. (2009) Pal S., Ishwara-Chandra C. H., Rao A. P., 2009, in Saikia D. J., Green D. A., Gupta Y., Venturi T., eds, Astronomical Society of the Pacific Conference Series Vol. 407, The Low-Frequency Radio Universe. p. 277
- Parsignault et al. (1972) Parsignault D. R., et al., 1972, Nature Physical Science, 239, 123
- Perley & Butler (2013) Perley R. A., Butler B. J., 2013, ApJS, 204, 19
- Piano et al. (2016) Piano G., et al., 2016, The Astronomer’s Telegram, 9429
- Prandoni et al. (2017) Prandoni I., et al., 2017, ArXiv e-prints, accepted for publication in A&A,
- Predehl et al. (2000) Predehl P., Burwitz V., Paerels F., Trümper J., 2000, A&A, 357, L25
- Shrader et al. (2010) Shrader C. R., Titarchuk L., Shaposhnikov N., 2010, ApJ, 718, 488
- Sironi & Spitkovsky (2014) Sironi L., Spitkovsky A., 2014, ApJ, 783, L21
- Sironi et al. (2016) Sironi L., Giannios D., Petropoulou M., 2016, MNRAS, 462, 48
- Szostek & Zdziarski (2004) Szostek A., Zdziarski A. A., 2004, ArXiv Astrophysics e-prints,
- Szostek & Zdziarski (2008) Szostek A., Zdziarski A. A., 2008, MNRAS, 386, 593
- Szostek et al. (2008) Szostek A., Zdziarski A. A., McCollough M. L., 2008, MNRAS, 388, 1001
- Tavani et al. (2009) Tavani M., et al., 2009, Nature, 462, 620
- Trushkin et al. (2016a) Trushkin S. A., Nizhelskij N. A., Tsybulev P. G., Zhekanis G. V., 2016a, preprint, (arXiv:1612.00634)
- Trushkin et al. (2016b) Trushkin S. A., Nizhelskij N. A., Tsybulev P. G., Zhekanis G. V., 2016b, The Astronomer’s Telegram, 9416
- Trushkin et al. (2016c) Trushkin S. A., Nizhelskij N. A., Tsybulev P. G., Zhekanis G. V., 2016c, The Astronomer’s Telegram, 9501
- Tudose et al. (2007) Tudose V., et al., 2007, MNRAS, 375, L11
- Türler (2011) Türler M., 2011, Mem. Soc. Astron. Italiana, 82, 104
- Türler et al. (1999) Türler M., Courvoisier T. J.-L., Paltani S., 1999, A&A, 349, 45
- Uttley & Klein-Wolt (2015) Uttley P., Klein-Wolt M., 2015, MNRAS, 451, 475
- Waltman et al. (1994) Waltman E. B., Fiedler R. L., Johnston K. J., Ghigo F. D., 1994, AJ, 108, 179
- Waltman et al. (1995) Waltman E. B., Ghigo F. D., Johnston K. J., Foster R. S., Fiedler R. L., Spencer J. H., 1995, AJ, 110, 290
- Waltman et al. (1996) Waltman E. B., Foster R. S., Pooley G. G., Fender R. P., Ghigo F. D., 1996, AJ, 112, 2690
- Watanabe et al. (1994) Watanabe H., Kitamoto S., Miyamoto S., Fielder R. L., Waltman E. B., Johnston K. J., Ghigo F. D., 1994, ApJ, 433, 350
- Zdziarski et al. (2016) Zdziarski A. A., Segreto A., Pooley G. G., 2016, MNRAS, 456, 775
- van Kerkwijk et al. (1996) van Kerkwijk M. H., Geballe T. R., King D. L., van der Klis M., van Paradijs J., 1996, A&A, 314, 521
- van der Laan (1966) van der Laan H., 1966, Nature, 211, 1131