Microlensing Makes Lensed Quasar Time Delays Significantly Time Variable
Abstract
The time delays of gravitationally lensed quasars are generally believed to be unique numbers whose measurement is limited only by the quality of the light curves and the models for the contaminating contribution of gravitational microlensing to the light curves. This belief is incorrect – gravitational microlensing also produces changes in the actual time delays on the day(s) light-crossing time scale of the emission region. This is due to a combination of the inclination of the disk relative to the line of sight and the differential magnification of the temperature fluctuations producing the variability. We demonstrate this both mathematically and with direct calculations using microlensing magnification patterns. Measuring these delay fluctuations can provide a physical scale for microlensing observations, removing the need for priors on either the microlens masses or the component velocities. That time delays in lensed quasars are themselves time variable likely explains why repeated delay measurements of individual lensed quasars appear to vary by more than their estimated uncertainties. This effect is also an important new systematic problem for attempts to use time delays in lensed quasars for cosmology or to detect substructures (satellites) in lens galaxies.
keywords:
lensed quasars, time delays, Hubble constant, microlensing1 Introduction
Ever since Refsdal (1964) proposed the method, there have been hopes that gravitational lens time delays can be used to constrain the cosmological model (see the review by Treu & Marshall 2016). Current studies are quite optimistic, with Bonvin et al. (2017), based also on Fassnacht et al. (2002), Suyu et al. (2010), Tewes et al. (2013b), and Suyu et al. (2014), claiming a 3.8% measurement of (effectively) based on time delay measurements in 3 lenses. Fundamentally, time delays constrain where is the mean surface density (convergence) in the annulus between the two images (Kochanek 2002). The surface density must be constrained with some additional information about the geometry or kinematics of the lens (see the review by Kochanek 2006). One contribution to is simply the random fluctuations in the density along the line of sight to the lens (see, e.g., Keeton & Zabludoff 2004, Greene et al. 2013, McCully et al. 2017), and the other is the internal structure of the lens galaxy (see the discussion in Kochanek 2006).
The essence of the program to use lenses to constrain cosmology is to obtain time delays of lenses with individual time delay, line-of-sight convergence, and lens surface density uncertainties of , and and then combine them to obtain a fractional error in (really the combination of cosmological distances entering the lens time delay) of . It is generally assumed that the first two terms in this error budget are dominated by random errors and their contributions to the overall error will scale as . There are far greater concerns about whether the last term may already be dominated by systematic errors (e.g., Schneider & Sluse 2013, Birrer et al. 2016) for which there is no benefit from combining lenses. In any case, any ultimate claim of achieving is equivalent to the claim that there are also no systematic errors in the surface density estimates at a comparable level. It will be challenging to prove this assertion.
This is not, however, the focus of the present paper. Our concern here is the accuracy of the time delay measurements – the error contribution from . Dating from the attempts to measure gravitational lens time delays in the very first lens, Q 0957+561 (Walsh et al. 1979), time delay measurements have produced controversy (e.g., Schild (1990) versus Press et al. (1992), resolved in favor of the former by Kundić et al. (1997)). In most modern studies, the question is not so much the basic validity of the delay but the accuracy of the uncertainty estimates, and there have recently been a series of tests and comparisons of various delay measurement methods (e.g., Tewes et al. 2013a, Dobler et al. 2015, Liao et al. 2015, Bonvin et al. 2017). An adequate summary of these studies is that with reasonably good light curves it is feasible to measure time delays with both high accuracy and precision.
All of these studies assume, however, that the measured time delay is the standard cosmological delay used in all lens models. They also assume that the ratios of delays depend only on the large scale potential of the lens galaxy (possibly with some effects from the largest substructures in the galaxy, Keeton & Moustakas 2009). In this paper we show that for gravitationally lensed quasars, microlensing by the stars in the lens galaxy (see the review by Wambsganss 2006) makes both of these assumptions incorrect.
Microlensing changes time delays on the scale of the light crossing time of the accretion disk, which has a typical scale of light days. These microlensing induced time delays will then slowly change as the accretion disk moves relative the stars doing the microlensing.
There are two causes of the microlensing effect on time delays. The first is very simple. If the accretion disk does not lie in the plane of the sky, different parts of the disk lie at different line of sight distances. This has a negligible consequence based on the normal expression for the time delay, as partially discussed in Yonehara (1999), Goicoechea (2002) and in more detail below. However, the normal time delay expression neglects the variations in the delay due to the actual change in the line-of-sight distance to the source (because this term has been subtracted). This missing term is a delay of order where is the proper light travel time and is the effect of time dilation from the source redshift . Without microlensing, this effect is unimportant because is the same for all images. However, microlensing, by its very definition, differentially magnifies different regions of the disk and will vary between images when weighted by the spatially varying microlensing magnification.
The second effect is more subtle and exists even for a face-on disk. The variability of the disk is due to a pattern of temperature fluctuations on the disk with the observed light curve representing an average of the fluctuations. The simplest case to explain is a “lamp post” model, where luminosity fluctuations close to the disk center illuminate the disk to drive the temperature fluctuations but with a lag due to the light travel time from the center, . While there is no guarantee that the lamp post model explains all quasar variability (see, e.g., Dexter & Agol 2011), it has been successfully used to model the wavelength-dependent ultraviolet/optical/near-IR variability of NGC 2617 (Shappee et al., 2014) and NGC 5548 (Starkey et al., 2017). The black body function is quite broad, so a broad range of disk radii contribute to the variability observed at any given wavelength. Microlensing differentially weights the emission from the disk, so the mean emission radius of a microlensed disk is different from that of the unmicrolensed disk or a differently microlensed image of the same disk. This both introduces differential time delays on the scale of the light crossing time, and means that the light curves of lensed images will not be identical even for a fixed microlensing magnification pattern. There has been some prior discussion of this latter point (e.g., Gould & Miralda-Escudé 1997, Wyithe & Loeb 2002, Dexter & Agol 2011), largely to explain the rapid, uncorrelated variability seen in the light curves of some lensed quasars (e.g., Burud et al. 2002, Schechter et al. 2003). While we will illustrate this effect using the “lamp post” model, the effect will be present for any model of quasar variability.
To summarize, we should expect gravitational lens time delays to be affected by microlensing, with image-to-image shifts on the time scale of the light crossing time of the disk – days. In §2 we work through the basic mathematics of the effects. In §3 explore several numerical examples based on two of the lensed quasars used in Bonvin et al. (2017), RXJ 11311231 (Sluse et al. 2003) and HE 04351223 (Wisotzki et al. 2002). We summarize the consequences of our results in §4.

2 Mathematics
The standard expression for the time delay of a lens is
| (1) |
where and are the angular position of the image and the source and is the projected lensing potential (e.g., Schneider 1985, Blandford & Narayan 1986). The distances are proper motion distances between the Observer, Lens and Source. For a flat universe they are simply the comoving distances and . Using these distances instead of angular diameter distances both allows the use of this simple relation and eliminates extra redshift factors111This is true of most lensing calculations, see Kochanek (1993).. The lens potential combines a function which is independent of the source distance with a source distance scaling of for all models. Using Fermat’s principle, the observed images are located at solutions of .
Now consider a second source displaced in angle to and source redshift to . The images of this source will have different time delays due to the shift in the source position and the change in the Einstein radius of the lens. If we define , the change in the delay for any two associated images is
| (2) |
where the first term is the one previously discussed by Yonehara (1999) and Goicoechea (2002). The overall delays have a general scale of , where is the image separation (see, e.g., the review by Kochanek 2006). This means that the fractional change in the time delay from the first term is of order for a disk scale of order 10 light days and a lens Einstein radius of order a kpc. Hence, as fully realized by Yonehara (1999) and Goicoechea (2002), this effect only matters for sources separated by distances that are a non-trivial fraction of kpc. The second term was not considered in these papers and produces a fractional correction of order . For a flat universe where with , this becomes where the first term is essentially the fractional change in the distance to the source, which is and so even less important than the first term. At this point, the reader may be wondering why this paper is being written.
We have, however, left out an important effect. Equation 1 is the time delay relative to a fiducial ray from the observer to the source along the optic axis. The actual total delay is not but (for a flat universe)
| (3) |
For the time delay between two sources at a common distance, the first term simply cancels and thus is simply removed as a nuisance parameter to derive Equation 1. For two sources at different distances, however, it produces a delay difference of where is the proper separation of the two sources at the source and the net delay is simply the lag in the rest frame of the source time-dilated by the source redshift. Unlike the two terms that result from shifting the source in Equation 1, this term has the scale of the source size and it will matter for time delays between two images if the light contributing to the first image has an average source distance different from that contributing to the second image.
To calculate the delay shifts created by the inclination of the disk, we require a disk model. Since we also want to compute the second effect created by differential microlensing of the variable flux, it should also allow for a simple model of the variable flux. We will consider a standard, non-relativistic, thin disk model emitting as a black body (Shakura & Sunyaev 1973). If we are observing at wavelength rest , it is useful to define
| (4) |
where , is the temperature profile of the disk,
is the radius where the disk temperature matches the photon wavelength, , and is the inner edge of the disk (e.g., Morgan et al. 2010). Here is the Planck constant, is the Boltzmann constant, is the black hole mass, is the mass accretion rate, is luminosity in units of the Eddington luminosity, is the accretion efficiency, and for a Schwarzschild black hole and for an equatorial orbit co-rotating Kerr black hole. Converted to a time scale and using the observed wavelength instead of the rest wavelength,
| (6) |
The unperturbed surface brightness profile of the disk is simply
| (7) |
Ignoring the inner edge of the disk (), the mean radius of the unperturbed surface brightness profile is . That we are using a monochromatic wavelength is unimportant, as the radial width due to the black body emission is significantly more important than the wavelength spread from a typical broad-band filter.
In the simplest “lamp post” model of variability (e.g., Cackett et al. 2007), the fractional temperature variation is independent of radius in the disk, so
| (8) |
where is the unperturbed temperature profile and is the fractional luminosity variability “lagged” by the light travel time from the disk center. If we assume the temperature variations are small, then we can Taylor expand the black body function to find that the time-variable emission is
| (9) |
comes from the temperature derivative of the black body and the definition of . The average radius of the variable flux, is larger than that of the unperturbed disk because a constant fractional temperature fluctuation produces larger surface brightness fluctuations at larger radii where the disk becomes cooler.
We can characterize the effects of microlensing by averaging the delays over the variable surface brightness weighted by the absolute value of the microlensing magnification . Let the disk be tilted relative to the line of sight by an inclination angle with corresponding to the disk lying in the plane of the sky. If a point in the disk is labeled by and we rotate about the axis, then the observed position is . The average delay between the driving source and the observer is
| (10) |
where and are coordinates on the reference source plane of the lens, and . The factor governing the mean delay combines the propagation delay for the lamp post, with the line-of-sight delay due to the inclination of the disk. Without microlensing () and ignoring the inner disk edge, the inclination of the disk has no effects and we just measure the mean lag between the driving perturbation and the observed light curve, .
It is relatively easy to show that the primary lens potential and its satellites cannot produce large enough magnification gradients across the accretion disk to produce an observable effect. This is not true of microlensing of the disk by the stars near each lensed image. The basic physics of the effect, that the star field near each image produces a different and time variable magnification of the accretion disk, means that there are gradients in the magnification on the physical scale of the disk and that the characteristic amplitude of the microlensing-induced delays must be of order the light crossing time of the disk.
Figure 1 shows the two contributions to the mean delay in Equation 10 for a linear fold caustic parallel to the axis as a function of its position as it is moved across the disk. The magnification produced by the fold caustic is for and for . For the term of the delay, we have subtracted the lag in the absence of microlensing in order to focus on the changes created by the effect. Since the fold is moving along the projected short axis of the disk, the fold position is scaled by the projected short axis disk scale length, . The scale of the delays is , with the term due to the lag in the lamp post model () being independent of the inclination, and the term due to the disk inclination () depending on the inclination. We have set , although the results are insensitive to this choice for the parameter ranges relevant to optical monitoring of lensed quasars. For our definitions, the near side of the disk has and the far side has .
We can qualitatively understand the behavior of both terms. Consider the term due to the inclination of the disk first. When is negative, the caustic lies on the near side of the disk and so magnifies parts of the disk with shorter, negative delays. However, the fold magnification is not very singular, and so at large distances the dropping flux of the disk matters more than the magnification and the average delay becomes that of an unmicrolensed disk. As the caustic approaches the disk center, the magnification of the near side makes the lag increasingly negative, but not by huge factors. The sign reverses before the caustic reaches the disk center because the total flux from the far side now exceeds that from the near side. Once the caustic passes the disk center, the lag simply increases because there is no longer any contribution from the near side of the disk or smaller radii than the distance of the caustic from the disk center.
The term due to the lamp post model has some qualitative differences. It is again negligible when the caustic is on the near side and at large radius, but slightly positive because it is enhancing the contribution from large radii. As the caustic approaches the disk center, it produces a negative mean lag by enhancing the contribution from small radii. Then, as it moves outwards, it also produces an increasingly positive lag for the same reasons as the inclination-dependent term.
The flux from a microlensed quasar is never due to a single fold caustic. It is the sum of the flux from the direct image plus some number of additional image pairs created by microlensing (see, e.g., Granot et al. 2003). The model with a single fold caustic explores the contribution of a single image pair created by a fold caustic, which must then be combined with the fluxes of all the other images. When the flux from this image pair is small compared to the flux of the other images, the observed delay will be dominated the delays associated with the other images. Figure 1 also shows the magnification produced by the caustic relative to its peak, . The magnification rises until the caustic approaches the disk center and then declines. Thus, when the caustic is producing the largest shift in the time delay, it is also making a smaller and smaller contribution to the observed flux because only the outer parts of the disk are being lensed by the fold caustic.
We can get a sense of the consequences by assuming that there is additional flux equal to the flux produced by the caustic at its peak and with an average lag of zero. Under these assumptions, the mean lag becomes , which is also shown in Figure 1. The dilution by the additional flux eliminates the divergence in the delay as the caustic moves out to increasingly large radii. Reality is more complex, which is why numerical simulations are ultimately required to understand the magnitude of the effect.
3 Numerical Simulations
We demonstrate the effects of microlensing on gravitational lens time delays using numerical simulations for two of the lensed quasars, RXJ 11311231 and HE 04351223, used by Suyu et al. (2014) and Bonvin et al. (2017) to constrain . RXJ 11311231 is a four image lensed quasar with = 0.658 and = 0.295 (Sluse et al., 2003). Based on the H line width from Sluse et al. (2003), Dai et al. (2010) estimated the black hole mass to be (1.3 0.3)108 . HE 04351223 is another four image lensed quasar with = 1.689, = 0.46, and an estimated black hole mass of 0.5109 (see Mosquera & Kochanek, 2011 and references therein). Based on Equation 5, the accretion disk sizes for RXJ 11311231 and HE 04351223 are cm (0.28 light days) and cm (0.36 light days), respectively, in the observed -band (6586 Å) for an Eddington ratio of = 0.1 and a radiative efficiency of = 0.1.
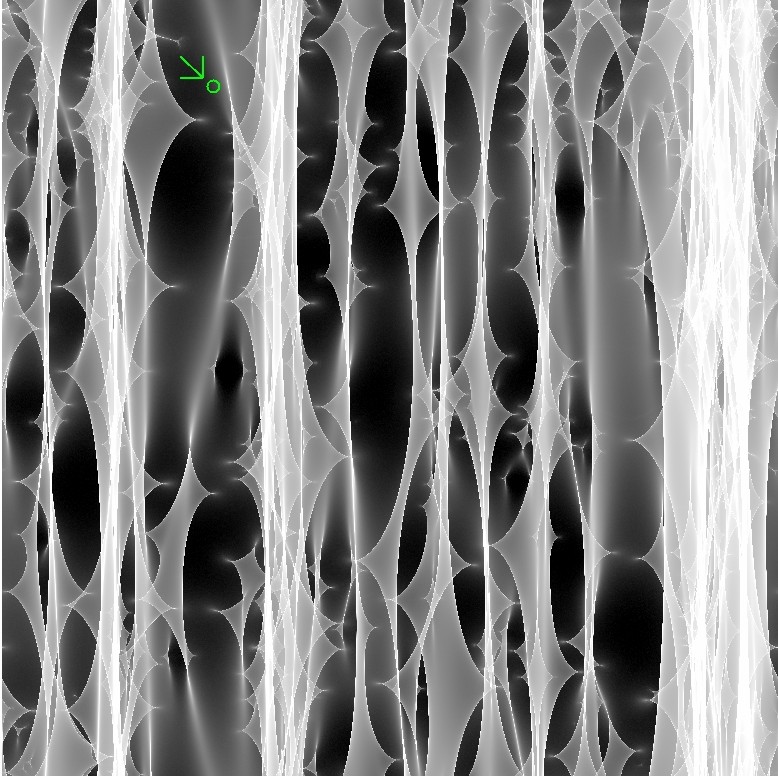
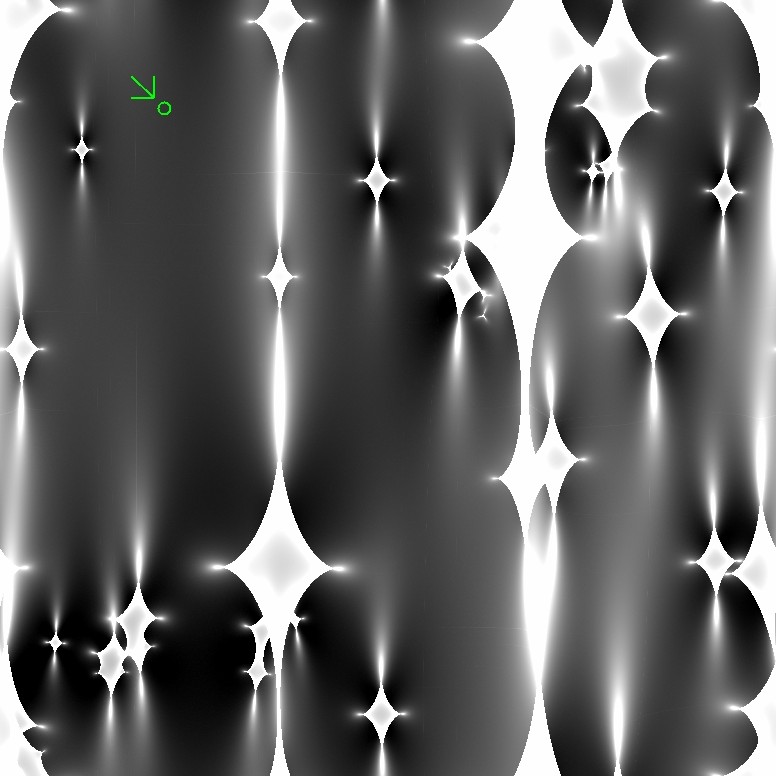
We created magnification maps for each lensed image using the ray-shooting method described in Kochanek (2004). The microlensing parameters, given in Table 1, correspond to a macro model with a stellar mass fraction of 0.2 relative to a pure de Vaucouleurs model (Dai et al., 2010). The magnification maps have dimensions of 81928192, an outer scale of 20, and a pixel scale of 0.00244 , where is the Einstein radius at the source plane. We assume a mean microlens mass of for both lenses, leading to an outer scale of cm and a pixel scale of cm for RXJ 11311231 and an outer scale of cm and a pixel scale of cm for HE 04351223. The accretion disk scale lengths are 12 times the pixel scale, while the region dominating the variability ( 5) is 60 times the pixel scale. Figure 5 and 5 show the full 81928192 magnification patterns for image A of each lens.
| Lens | Image | |||
|---|---|---|---|---|
| RXJ 11311231 | A | 0.618 | 0.412 | 0.0667 |
| B | 0.581 | 0.367 | 0.0597 | |
| C | 0.595 | 0.346 | 0.0622 | |
| D | 1.041 | 0.631 | 0.1590 | |
| HE 04351223 | A | 0.604 | 0.262 | 0.0500 |
| B | 0.734 | 0.395 | 0.0801 | |
| C | 0.605 | 0.265 | 0.0500 | |
| D | 0.783 | 0.427 | 0.0930 |
We calculated the mean delays between the driving source (the “lamp post”) and the observer using Equation 10 for each lensed image, where the surface brightness is given by Equation 9 and the inner edge of the disk is (safely) ignored. We investigated four disk configurations with inclination and position angles of (i) = 30∘, = 0∘, (ii) = 30∘, = 45∘, (iii) = 30∘, = 90∘, and (iv) = 0∘. The position angles determine whether the long axis of the tilted disk is parallel, perpendicular, or at an angle to the caustic structures in the magnification maps. In this paper, the long axis of the tilted disk is perpendicular (parallel) to the caustic structures for = 0∘ ( = 90∘). Note that the last case (iv) corresponds to a face-on disk where the position angle does not matter. For each disk configuration, we also investigated the effect of decreasing and increasing the source size by a factor of two.
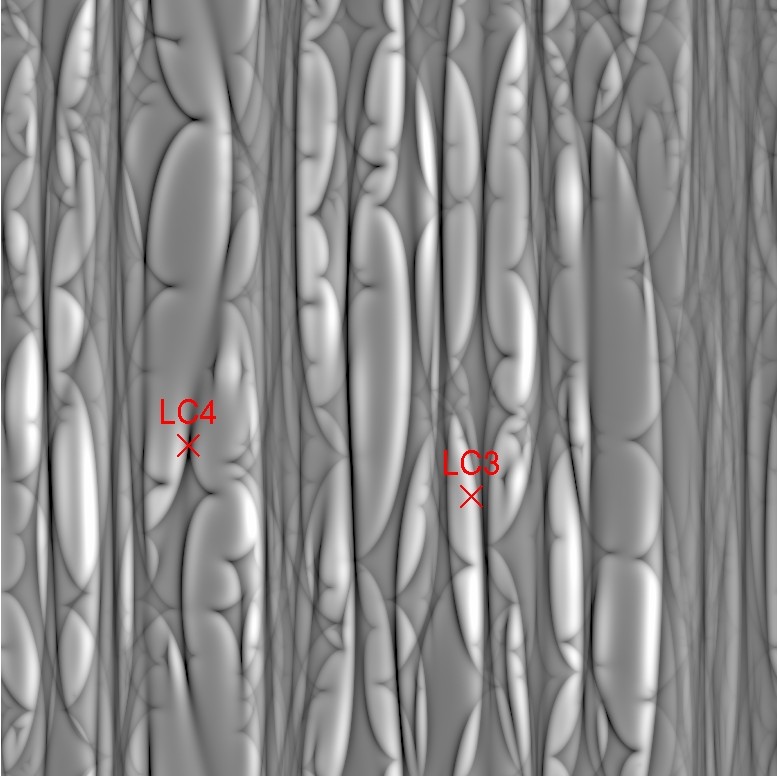
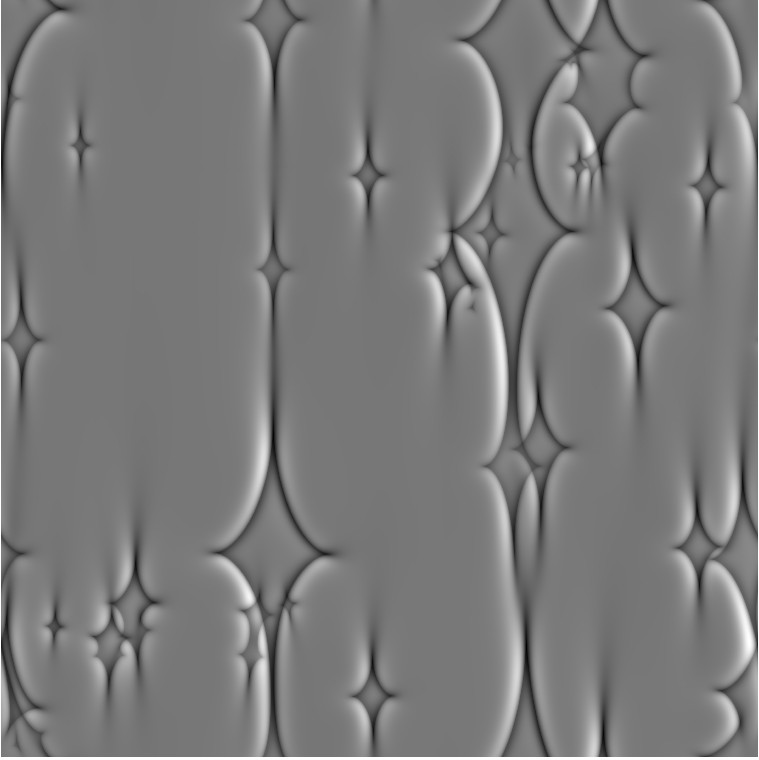
Examples of mean delay maps for image A of the two lenses are shown in Figures 5 and 5, where the constant delay of the lamp post model has been subtracted. The maps represent time delay perturbations due to microlensing, typically on the order of a day, with both positive and negative delays. The negative delays are shown in black, while the positive delays increase from darker to brighter regions. The edges and structures where the time delays change rapidly and frequently flip signs are due to caustics in the corresponding magnification patterns, shown in Figures 5 and 5.
Figures 68 show the mean delay distributions for the different disk configurations for all images of the lenses, based on 300,000 randomly-selected points from their delay maps. There are several interesting points to note from the delay distributions. First, the line of sight (LOS) delays from the disk inclination have a zero mean and are symmetric about zero delay, as expected. On the other hand, the delays depend little on inclination and have a positive mean. The skew to positive delays can be understood as follows. Producing a negative lag for the term requires magnifying only the inner part of the disk, which rarely happens because the caustic structures generally have scales larger than 5 and will magnify the outer parts of the disk as well. On the other hand, it is relatively easy to magnify the outer parts of the disk without magnifying the inner parts, leading to the delay asymmetry. Each image therefore has a non-zero mean for the total delay.
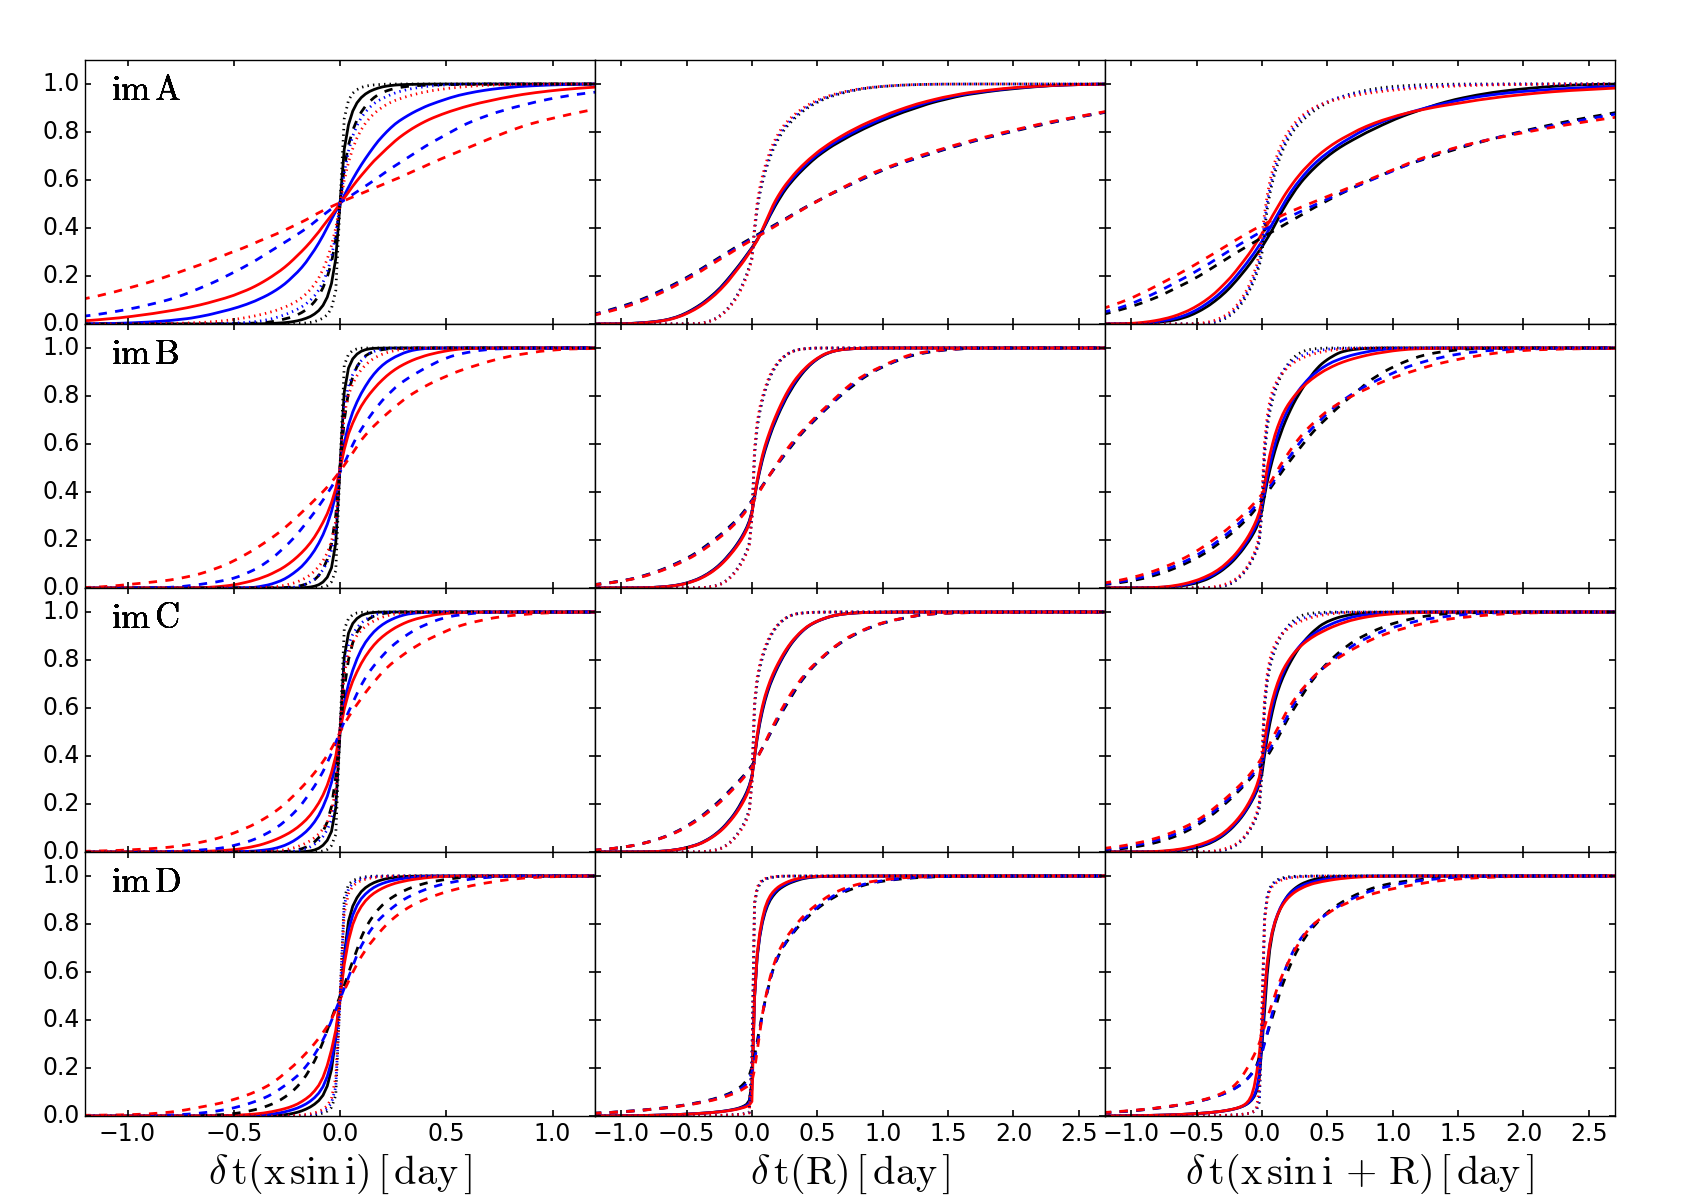
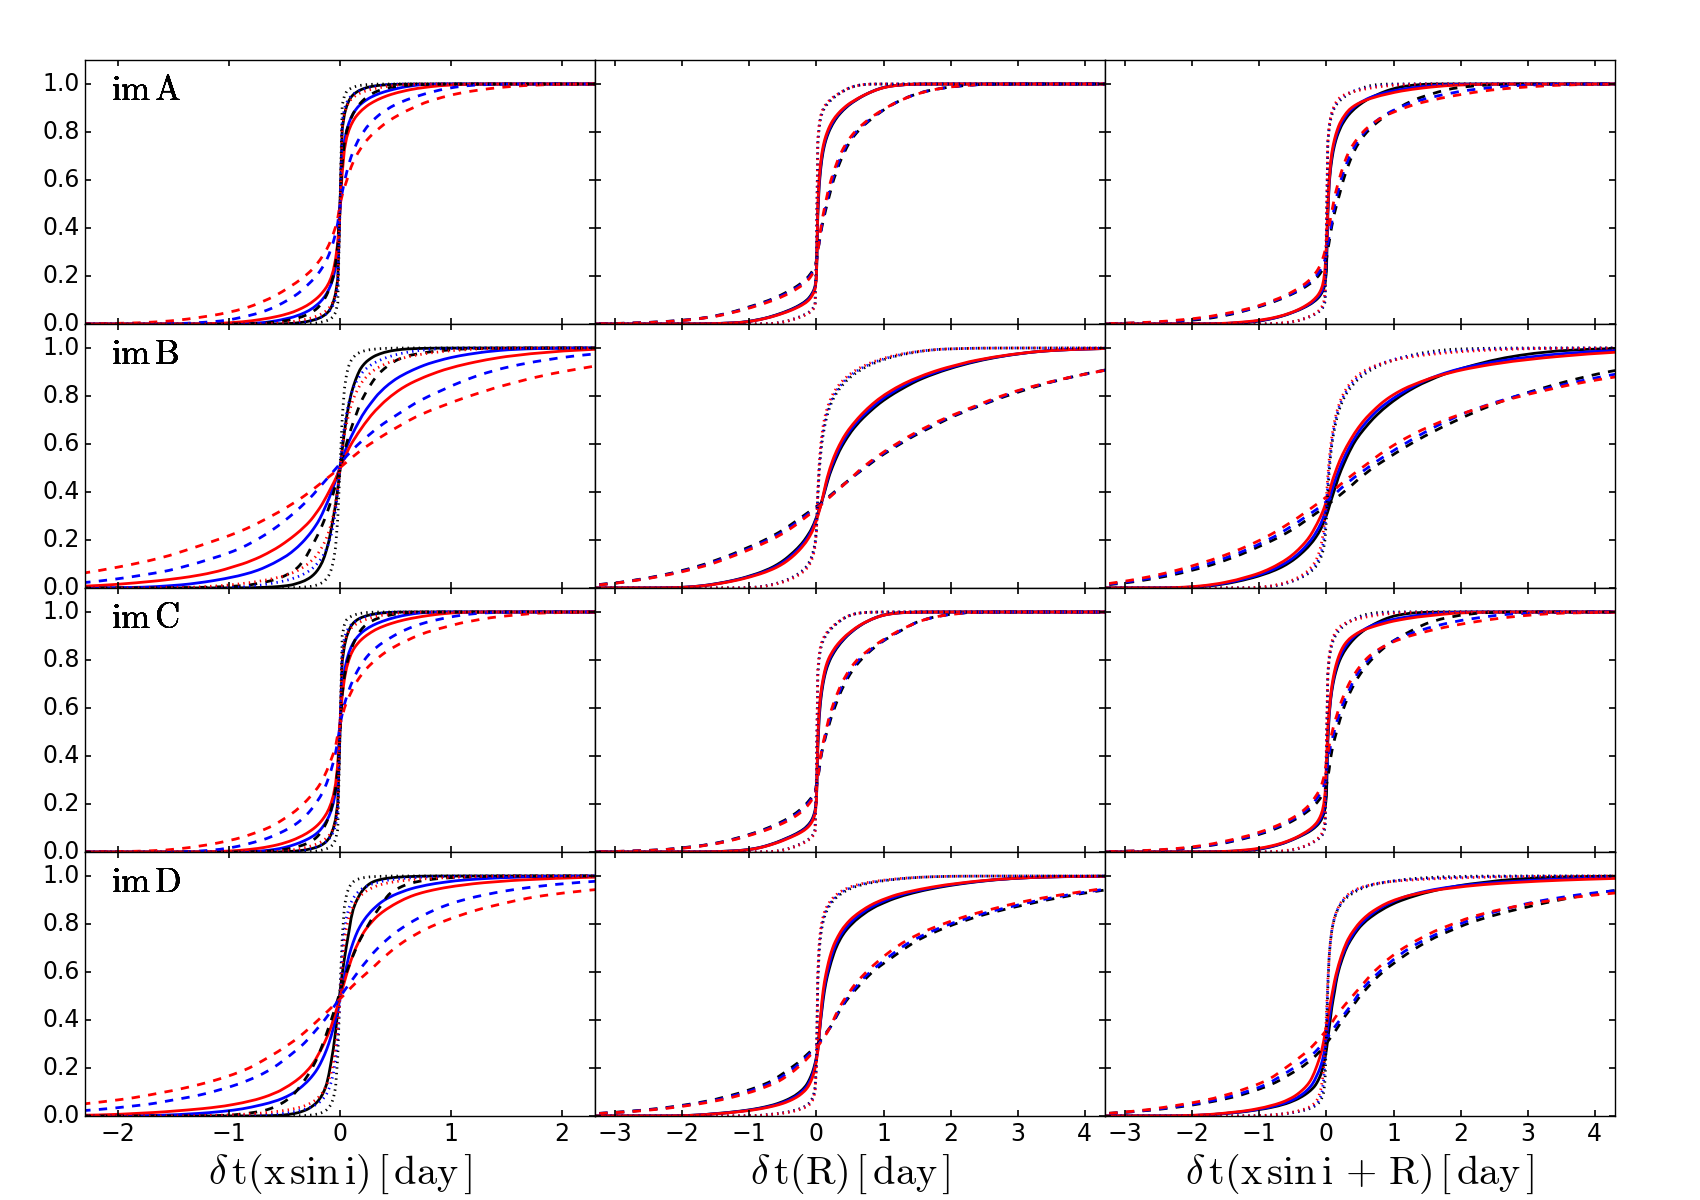
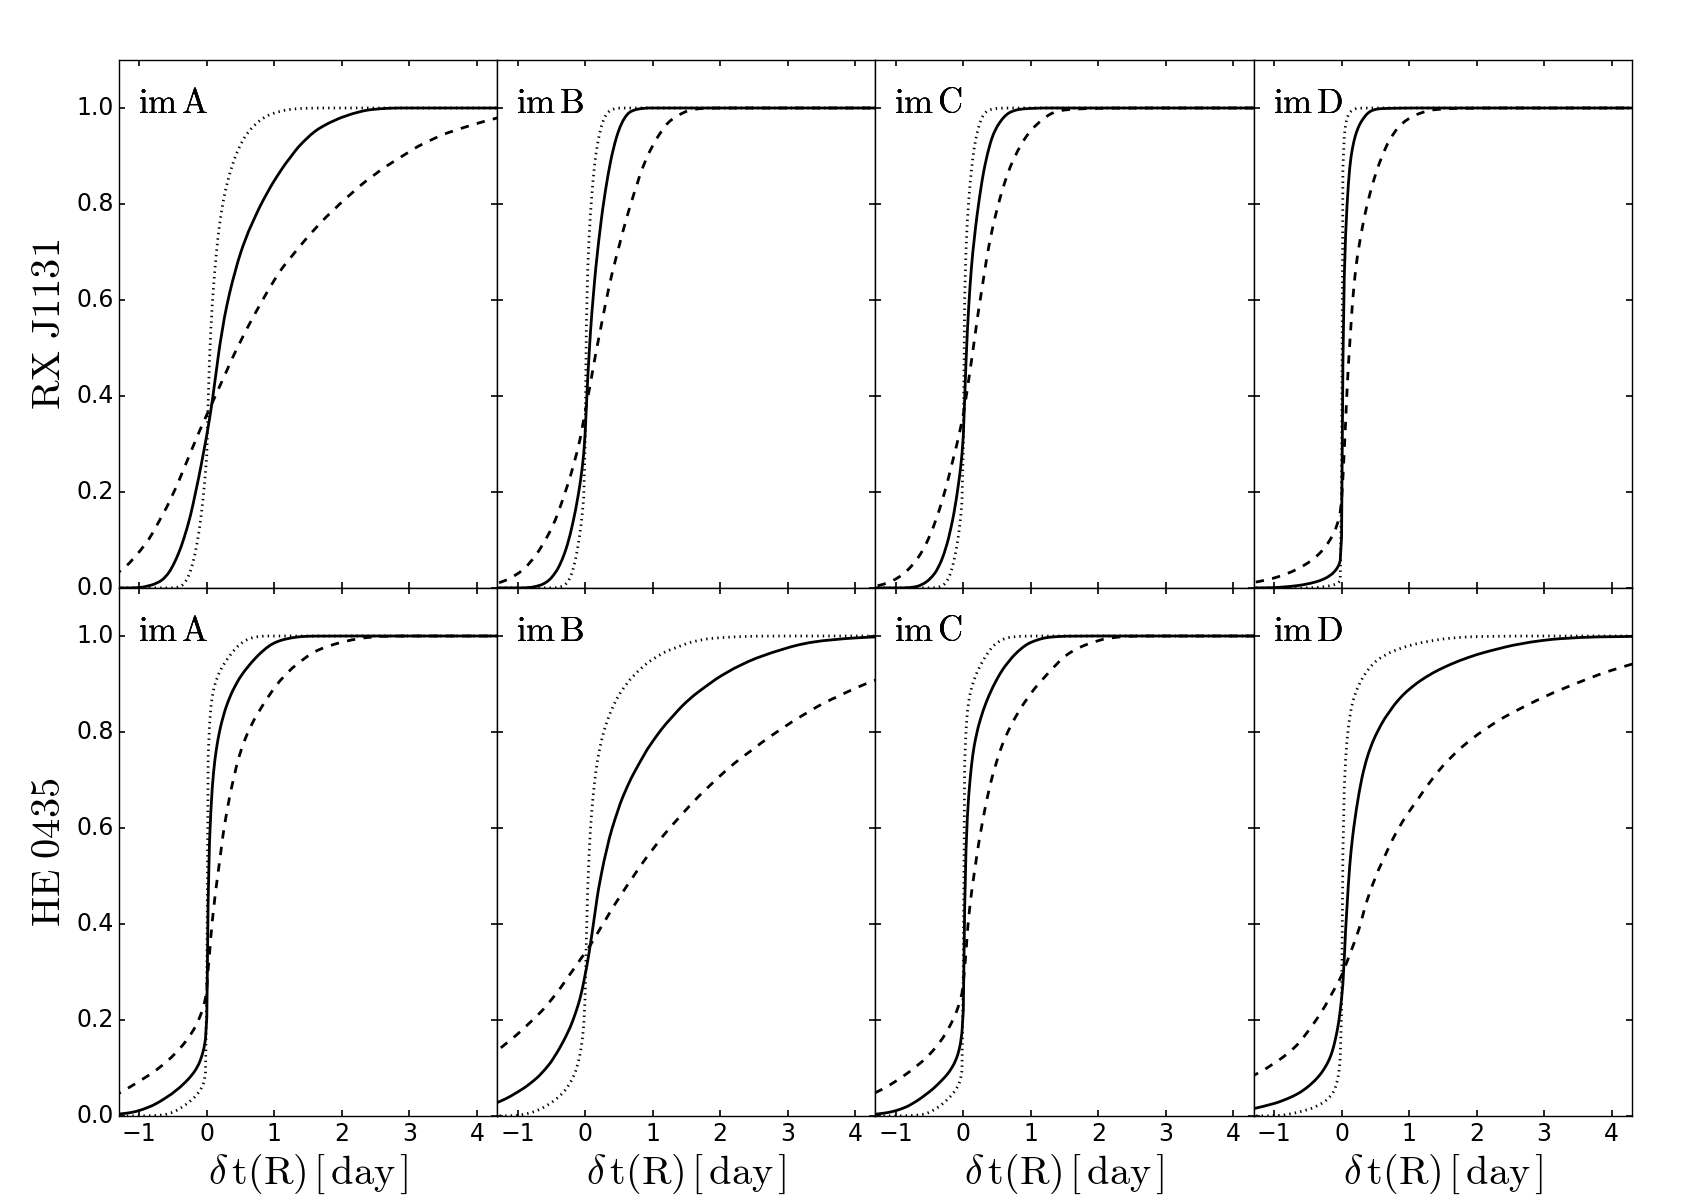
For all source sizes, the magnitudes of the total delays increase from a of 0∘ (perpendicular to caustic structures) to a of 90∘ (parallel to caustic structures). This is because when the long axis of the disk is perpendicular to the caustic structures, regions of positive and negative LOS delays are being magnified at the same time, leading to a smaller overall effect. When the caustic structures are parallel to the long axis of the disk, it is easier to magnify regions with only one sign of the delay. Therefore, microlensing has a more significant effect when the long axis of the disk is parallel to the caustic structures. Like the disk inclination, the disk has a larger effect on the LOS delays than the delays. The overall delays are also larger for a larger source size and smaller for a smaller source. Even when the disk is face-on, there are still non-negligible microlensing delay contributions due to the light travel time from the lamp post to the disk. In all cases, we have subtracted the mean delay of the lamp post model and verified that a uniform magnification leads to no change in the mean delays.
Table 2 summarizes the mean and dispersion of the delay differences between images based on randomly drawing a large number of delays from the delay distributions of the respective images. Since the mean total delay for the individual images are non-zero, the mean of the delay differences is also not zero. These non-zero means represent a bias in the delays between the images that cannot be removed simply by monitoring the lens for a long period of time. The dispersion of the delay differences about this mean represents an additional scatter introduced into a time delay between two images, which can be eliminated by monitoring the lens of a long time period. In producing Table 2, we simply used the same disk geometry for each image. In reality, the of the disk relative to the magnification pattern of the other images is determined once it it set for the first image to the extent that the orientation of the model shear for each image is well constrained.
| Lens | Size | ||||||||
|---|---|---|---|---|---|---|---|---|---|
| (days) | (days) | (days) | (days) | (days) | (days) | ||||
| RXJ 11311231 | 0.5 | 0 | 0 | (0.27) | (0.27) | (0.25) | (0.15) | (0.11) | (0.11) |
| … | 0 | 30 | (0.27) | (0.27) | (0.26) | (0.15) | (0.12) | (0.11) | |
| … | 45 | 30 | (0.30) | (0.30) | (0.28) | (0.17) | (0.13) | (0.12) | |
| … | 90 | 30 | (0.34) | (0.33) | (0.31) | (0.18) | (0.14) | (0.13) | |
| 0 | 0 | (0.68) | (0.67) | (0.64) | (0.34) | (0.28) | (0.27) | ||
| … | 0 | 30 | (0.68) | (0.68) | (0.65) | (0.35) | (0.29) | (0.28) | |
| … | 45 | 30 | (0.74) | (0.74) | (0.71) | (0.38) | (0.32) | (0.30) | |
| … | 90 | 30 | (0.83) | (0.81) | (0.78) | (0.42) | (0.35) | (0.33) | |
| 2 | 0 | 0 | (1.57) | (1.54) | (1.51) | (0.77) | (0.71) | 0.01 (0.65) | |
| … | 0 | 30 | (1.57) | (1.55) | (1.53) | (0.78) | (0.74) | 0.01 (0.68) | |
| … | 45 | 30 | (1.72) | (1.68) | (1.66) | (0.85) | (0.79) | 0.01 (0.72) | |
| … | 90 | 30 | (1.88) | (1.85) | (1.82) | (0.93) | (0.86) | 0.00 (0.78) | |
| HE 04351123 | 0.5 | 0 | 0 | 0.12 (0.42) | 0.00 (0.20) | 0.05 (0.31) | (0.42) | (0.48) | 0.05 (0.31) |
| … | 0 | 30 | 0.12 (0.43) | 0.00 (0.21) | 0.05 (0.31) | (0.43) | (0.49) | 0.05 (0.31) | |
| … | 45 | 30 | 0.12 (0.47) | 0.00 (0.23) | 0.05 (0.35) | (0.48) | (0.54) | 0.05 (0.35) | |
| … | 90 | 30 | 0.11 (0.52) | 0.00 (0.25) | 0.05 (0.39) | (0.52) | (0.60) | 0.05 (0.39) | |
| 0 | 0 | 0.38 (1.06) | 0.00 (0.47) | 0.21 (0.80) | (1.05) | (1.24) | 0.20 (0.80) | ||
| … | 0 | 30 | 0.38 (1.07) | 0.00 (0.49) | 0.20 (0.81) | (1.07) | (1.25) | 0.20 (0.82) | |
| … | 45 | 30 | 0.37 (1.16) | 0.00 (0.54) | 0.20 (0.91) | (1.17) | (1.38) | 0.19 (0.91) | |
| … | 90 | 30 | 0.36 (1.28) | 0.00 (0.59) | 0.18 (1.01) | (1.28) | (1.52) | 0.19 (1.02) | |
| 2 | 0 | 0 | 0.83 (2.38) | 0.01 (1.08) | 0.65 (2.00) | (2.38) | (2.92) | 0.65 (2.01) | |
| … | 0 | 30 | 0.85 (2.42) | 0.00 (1.10) | 0.65 (2.03) | (2.42) | (2.96) | 0.65 (2.04) | |
| … | 45 | 30 | 0.85 (2.64) | 0.01 (1.21) | 0.64 (2.24) | (2.64) | (3.25) | 0.64 (2.25) | |
| … | 90 | 30 | 0.85 (2.87) | 0.00 (1.32) | 0.61 (2.48) | (2.89) | (3.57) | 0.62 (2.50) |
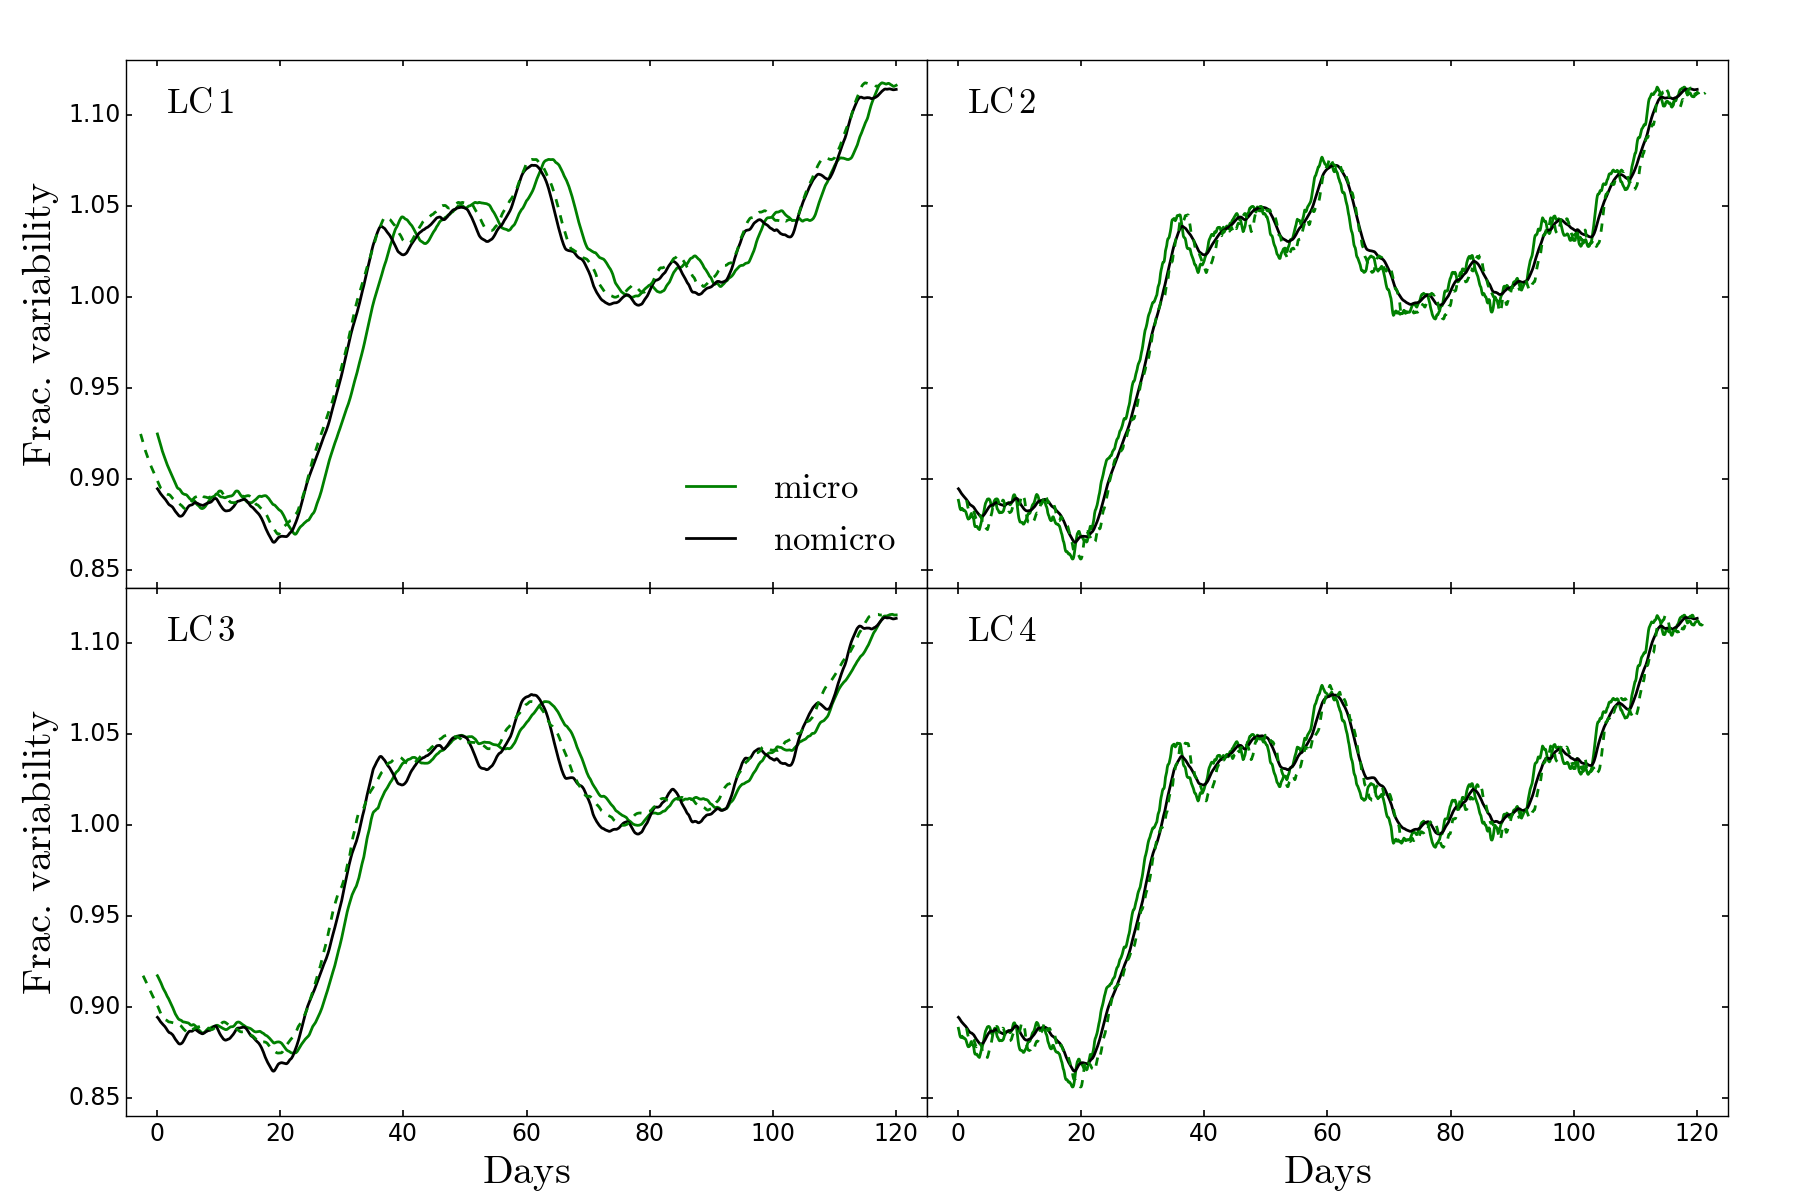
As a final illustration of microlensing effect on time delays, we created examples of microlensed quasar light curves including these effects. We used the damped random walk (DRW) model, which has been shown to capture quasar variability relatively well (Kelly et al., 2009; Kozlowski et al., 2010; MacLeod et al., 2010), to generate the driving light curve . The driving light curve is modeled with a time scale = 90 days and a fractional variability of 15%. This damping time is shorter than typical of quasars in order to make it easier to visualize the microlensing effects. The contribution from any point on the disk lags the driving light curve by , with a flux contribution of . This is then weighted either by a constant in the absence of microlensing or a magnification pattern when microlensing is present, resulting in a snapshot of the disk brightness. Repeating this as a function of time produces a set of evolving maps of the disk brightness, from which one can generate the observed light curve.
Figure 9 shows four examples of light curves (LC1–LC4) spanning 120 days for image A of RXJ 11311231. The disk size is set to . We show two examples for a face-on disk (LC1, LC2) and two examples for an inclined disk (LC3, LC4 with 45∘ and 30∘), where the disk positions are indicated in Figure 5 for the latter two cases. The predicted mean shifts based on Equation 10 are given in Table 3. If we shift the microlensed light curves by this delay, they match the input light curves with some small differences in structure due to the microlensing. It is important to note that these changes in the light curve structures are not due to any movement of the quasar relative to the magnification pattern, but are instead due to changes in the disk surface brightness with time that are differentially weighted by microlensing.
We next used the AGN lag estimation algorithm JAVELIN (Zu et al., 2011) to estimate the lags between the “micro” and “nomicro” light curves for the example light curves in Figure 9. We assumed a generic 5% fractional uncertainty and treated the “nomicro” light curves as the driving light curve and fit for the lag of the “micro” light curves. The medians lags and their 68% uncertainties are shown in Table 3. We see that the mean lags predicted by Equation 10 agree well with the lags determined from the model light curves.
| LC | (days) | JAVELIN (days) |
|---|---|---|
4 Discussion and conclusion
Using both simple models and full simulations, we have shown that microlensing leads to perturbations in time delays on the scale of the light crossing time of the quasar disk, on the order of days. Although the accretion disk is held fixed in this work, these delays will vary with time as the observer, source, lens, and stars in the lens move relative to one another. The time scales for changes are summarized in Mosquera & Kochanek (2011). Because the optical depth to microlensing for lensed images is almost unity, these time delay perturbations should be present to varying degrees in all lensed quasars.
We have been very conservative in illustrating the amplitude of the microlensing effect, scaling the disk size to a standard thin disk model with an Eddington ratio of 0.1. Typical quasars probably have higher Eddington ratios (see, e.g., Kollmeier et al. 2006), while both microlensing (e.g., Morgan et al. 2010; Mosquera & Kochanek 2011) and ongoing continuum reverberation mapping studies (e.g., Shappee et al. 2014; Fausnaugh et al. 2016) find that the accretion disks are two to four times larger than predicted by the thin disk theory. Hence, even our models may still be underestimating the overall effect. Particularly for face-on disks, the effect will also depend on the quasar variability model.
A first consequence of this new effect is that the uncertainty in a lens time delay now has an additional contributor, days. Ignoring the lens galaxy, the two traditional sources of error are measurement error in the time delay () and fluctuations in the surface density along the line of sight (). Unless the microlensing delays can be determined, there is no need for time delay measurement errors that are significantly smaller, . This is analogous to two image lenses where there is no point in measuring delays significantly more accurately than the limit set by the contribution from the cosmic variance in the density along the line of sight, .
The microlensing delay effect is an absolute, rather than fractional, error. Therefore, it is more important for the short delays common in four-image lenses (due to the high degree of symmetry) such as the two lenses investigated here, while it will matter less for long delays. For example, the longest delay in HE 04351123 is approximately days, so a day contribution from microlensing represents a 7% floor to the utility of this lens for cosmology. The longest delay in RXJ 11311231 is days, and such a microlensing effect represents a fractional error of only 1% that is comparable to the effects of large scale structure. Lenses with long time delays, which tend to be two image lenses, are therefore strongly favored for obtaining measurements of cosmological time delays. Unfortunately, two-image lenses supply fewer model constraints on the structure of the lens galaxy. Tagore et al. (2017) also showed that two image lenses will produce the most biased estimates of from time delays, while cruciform quads have the lowest biases. The presence of microlensing effects may well revise this conclusion, as cruciform lenses with short time delays will be strongly limited by the effects of microlensing delays. Since the microlensing delay is on the scale of the accretion disk size (Equation 2), lenses with lower mass black holes and shorter disk light crossing times are also preferred.
The microlensing delays also affect searches for substructures in lens galaxies using time delay anomalies in lensed quasars, also known as millilensing. Depending on the properties of the subhalo, substructures are thought to introduce time delay perturbations on the order of fraction of a day (Keeton & Moustakas, 2009). The substructure perturbations can be investigated through measurements of time delay ratios, which are insensitive to line of light structures and less sensitive to degeneracies due to the radial mass profile of the primary lens. Particularly with the biases produced by the mean delay shifts seen for microlensing of the lamp post variability model, this new microlensing effect may make using delay anomalies to search for substructures problematic.
In addition to being an important new systematic problem for time delay cosmology, this effect may be a boon to quasar microlensing studies. In theory, microlensing probes the size of the source ( or equivalent), the mean mass of the microlensing stars , and the effective velocity of the source relative to the magnification patterns. The mean stellar mass determines the typical Einstein radius , and the effective velocity is a combination of the motion of the observer, the microlensing stars and the peculiar velocities of the lens and the source. Unfortunately, the only observable with physical units is the time scale of the microlensing variability , which is a degenerate combination of the mean Einstein radius and the effective velocity. This means that one must use prior estimates for one of the three variables of interest (, and ) in order to constrain the other two. Traditionally, we have constrained the peculiar velocities (e.g., Poindexter et al. 2008; Dai et al. 2010; Morgan et al. 2010; Mosquera et al. 2013) while most other groups have assumed a mean microlens mass.
The microlensing time delay effect provides a new observable with units that is directly related to the size of the emission region, . Measuring the effect has the potential of eliminating the need for (strong) priors in microlensing analyses. For any particular image, the effect depends on the disk size and inclination, but the strong dependence of the effect on the inclination of the disk and its orientation relative to the caustic networks created by the tangential magnification suggests that it may be possible to disentangle the two effects, particularly for four image lenses. The projected shape and orientation of the disk is fixed on the sky, but the orientation of the caustic networks rotates from image to image, so the differences in the microlensing time delay effects between the images should strongly constrain both variables.
Acknowledgments
The authors thank J. Munoz, E. Mediavilla, P. Schechter and P. Schneider for discussions. CSK is supported by NSF grants AST-1515876 and AST-1515927. This research made use of Astropy, a community-developed core Python package for Astronomy (Astropy Collaboration, 2013).
References
- Birrer et al. (2016) Birrer, S., Amara, A., & Refregier, A. 2016, JCAP, 8, 020
- Blandford & Narayan (1986) Blandford, R. & Narayan, R. 1986, ApJ, 310, 568
- Bonvin et al. (2016) Bonvin, V., Tewes, M., Courbin, F., et al. 2016, AAP, 585, A88
- Bonvin et al. (2017) Bonvin, V., Courbin, F., Suyu, S. H., et al. 2017, MNRAS, 465, 4914
- Burud et al. (2002) Burud, I., Hjorth, J., Courbin, F., et al. 2002, AAP, 391, 481
- Cackett et al. (2007) Cackett, E. M., Horne, K., & Winkler, H. 2007, MNRAS, 380, 669
- Dai et al. (2010) Dai, X., Kochanek, C. S., Chartas, G., et al. 2010, ApJ, 709, 278
- Dexter & Agol (2011) Dexter, J., & Agol, E. 2011, ApJL, 727, L24
- Dobler et al. (2015) Dobler, G., Fassnacht, C. D., Treu, T., et al. 2015, ApJ, 799, 168
- Fassnacht et al. (2002) Fassnacht, C. D., Xanthopoulos, E., Koopmans, L. V. E., & Rusin, D. 2002, ApJ, 581, 823
- Fausnaugh et al. (2016) Fausnaugh, M. M., Denney, K. D., Barth, A. J., et al. 2016, ApJ, 821, 56
- Goicoechea (2002) Goicoechea, L. J. 2002, MNRAS, 334, 905
- Gould & Miralda-Escudé (1997) Gould, A., & Miralda-Escudé, J. 1997, ApJL, 483, L13
- Granot et al. (2003) Granot, J., Schechter, P. L., & Wambsganss, J. 2003, ApJ, 583, 575
- Greene et al. (2013) Greene, Z. S., Suyu, S. H., Treu, T., et al. 2013, ApJ, 768, 39
- Keeton & Zabludoff (2004) Keeton, C. R., & Zabludoff, A. I. 2004, ApJ, 612, 660
- Keeton & Moustakas (2009) Keeton, C. R., & Moustakas, L. A. 2009, ApJ, 699, 1720
- Kelly et al. (2009) Kelly, B. C., Bechtold, J. & Siemiginowska, A. 2009, ApJ, 698, 895-910
- Kochanek (1993) Kochanek, C. S. 1993, MNRAS, 261, 453
- Kochanek (2002) Kochanek, C. S. 2002, ApJ, 578, 25
- Kochanek (2004) Kochanek, C. S. 2004, ApJ, 605, 58
- Kochanek (2006) Kochanek, C. S. 2006, Saas-Fee Advanced Course 33: Gravitational Lensing: Strong, Weak and Micro, 91
- Kozlowski et al. (2010) Kozłowski, S., Kochanek, C. S., Udalski, A., Wyrzykowski, Ł. & the OGLE Collaboration 2010, ApJ, 708, 927
- Kollmeier et al. (2006) Kollmeier, J. A., Onken, C. A., Kochanek, C. S., et al. 2006, ApJ, 648, 128
- Kundić et al. (1997) Kundić, T., Turner, E. L., Colley, W. N., et al. 1997, ApJ, 482, 75
- Liao et al. (2015) Liao, K., Treu, T., Marshall, P., et al. 2015, ApJ, 800, 11
- MacLeod et al. (2010) MacLeod, C. L., Ivezić, Ž., Kochanek, C. S., et al. 2010, ApJ, 721, 1014
- McCully et al. (2017) McCully, C., Keeton, C. R., Wong, K. C., & Zabludoff, A. I. 2017, ApJ, 836, 141
- Morgan et al. (2010) Morgan, C. W., Kochanek, C. S., Morgan, N. D., & Falco, E. E. 2010, ApJ, 712, 1129
- Mosquera & Kochanek (2011) Mosquera, A. M. & Kochanek, C. S. 2011, ApJ, 738, 96
- Mosquera et al. (2013) Mosquera, A. M., Kochanek, C. S., Chen, B., et al. 2013, ApJ, 769, 53
- Poindexter et al. (2008) Poindexter, S., Morgan, N., & Kochanek, C. S. 2008, ApJ, 673, 34
- Press et al. (1992) Press, W. H., Rybicki, G. B., & Hewitt, J. N. 1992, ApJ, 385, 404
- Refsdal (1964) Refsdal, S. 1964, MNRAS, 128, 307
- Schechter et al. (2003) Schechter, P. L., Udalski, A., Szymański, M., et al. 2003, ApJ, 584, 657
- Schild (1990) Schild, R. E. 1990, AJ, 100, 1771
- Schneider (1985) Schneider, P. 1985, AAP, 143, 413
- Schneider & Sluse (2013) Schneider, P., & Sluse, D. 2013, AAP, 559, A37
- Shakura & Sunyaev (1973) Shakura, N. I., & Sunyaev, R. A. 1973, AAP, 24, 337
- Shappee et al. (2014) Shappee, B. J., & Prieto, J. L., & Grupe, D., et al. 2014, ApJ, 788, 48
- Sluse et al. (2003) Sluse, D., Surdej, J., Claeskens, J.-F., et al. 2003, AAP, 406, L43
- Starkey et al. (2017) Starkey, D., Horne, K., Fausnaugh, M. M., et al. 2017, ApJ, 835, 65
- Suyu et al. (2014) Suyu, S. H., Treu, T., Hilbert, S., et al. 2014, ApJL, 788, L35
- Suyu et al. (2010) Suyu, S. H., Marshall, P. J., Auger, M. W., et al. 2010, ApJ, 711, 201
- Tagore et al. (2017) Tagore, A. S., Barnes, D. J., Jackson, N., et al. 2017, arXiv, 1706.07733
- Tewes et al. (2013a) Tewes, M., Courbin, F., & Meylan, G. 2013a, AAP, 553, A120
- Tewes et al. (2013b) Tewes, M., Courbin, F., Meylan, G., et al. 2013b, AAP, 556, A22
- Treu & Marshall (2016) Treu, T., & Marshall, P. J. 2016, A&ARv, 24, #11
- Walsh et al. (1979) Walsh, D., Carswell, R. F., & Weymann, R. J. 1979, Nature, 279, 381
- Wambsganss (2006) Wambsganss, J. 2006, Saas-Fee Advanced Course 33: Gravitational Lensing: Strong, Weak and Micro, 453
- Wisotzki et al. (2002) Wisotzki, L., Schechter, P. L., Bradt, H. V., Heinmüller, J., & Reimers, D. 2002, AAP, 395, 17
- Wyithe & Loeb (2002) Wyithe, J. S. B., & Loeb, A. 2002, ApJ, 577, 615
- Yonehara (1999) Yonehara, A. 1999, ApJL, 519, L31
- Zu et al. (2011) Zu, Y., Kochanek, C. S., & Peterson, B. M. 2011, ApJ, 735, 80