Projected bounds on ALPs from Athena
Abstract
Galaxy clusters represent excellent laboratories to search for Axion-Like Particles (ALPs). They contain magnetic fields which can induce quasi-sinusoidal oscillations in the X-ray spectra of AGNs situated in or behind them. Due to its excellent energy resolution, the X-ray Integral Field Unit (X-IFU) instrument onboard the Athena X-ray Observatory will be far more sensitive to ALP-induced modulations than current detectors. As a first analysis of the sensitivity of Athena to the ALP-photon coupling , we simulate observations of the Seyfert galaxy NGC 1275 (hosting the radio source 3C 84) in the Perseus cluster using the SIXTE simulation software. We estimate that for a 200 ks exposure, a non-observation of spectral modulations will constrain for , representing an order of magnitude improvement over constraints derived using the current generation of satellites.
keywords:
astroparticle physics – elementary particles – galaxies: clusters: individual: Perseus1 Introduction
X-ray astronomy provides a novel arena for fundamental physics. Thanks to exciting recent data, such as the observed excess at 3.5 keV (Bulbul et al., 2014; Boyarsky et al., 2014), there has been a renewed interest among particle physicists in the great promise of X-ray astronomy to shed light on physics beyond the Standard Model, including the existence of new particles.
One area for which X-ray astronomy is particularly suitable is in the search for Axion-Like Particles (ALPs). ALPs are light pseudo-scalars that are a well motivated extension of the Standard Model (Peccei & Quinn, 1977; Wilczek, 1978; Weinberg, 1978) that arise generically in string compactifications, for example see (Conlon, 2006; Svrcek & Witten, 2006; Cicoli et al., 2012). A general review of ALPs is (Ringwald, 2012). In the presence of a magnetic field ALPs and photons interconvert (Sikivie, 1983; Raffelt & Stodolsky, 1988), and this induces quasi-sinusoidal oscillations at X-ray energies in the spectra of sources in and around galaxy clusters (Wouters & Brun, 2013; Conlon et al., 2016).
Searches for these oscillations can be used to constrain ALP parameter space. Current constraints on ALPs derived in this fashion (Wouters & Brun, 2013; Berg et al., 2017; Marsh et al., 2017; Conlon et al., 2017) are based on data taken with CCD detectors, which have an energy resolution of . A large improvement with sensitivity will be achieved once data becomes available from microcalorimeters with energy resolution. Such microcalorimeters will be on board the Advanced Telescope for High ENergy Astrophysics (ATHENA), currently scheduled to launch in 2028. Its X-IFU instrument will have both large effective area, good imaging and energy resolution of , greatly enhancing the discovery potential for ALPs.
In this paper we provide a first estimate for the experimental sensitivity of Athena to ALPs. We do so using simulated data for a mock observation of NGC 1275, hosting the radio source 3C 84, which contains the central AGN of the Perseus cluster. This object was chosen as we have previously used it to place bounds on ALPs using Chandra data (Berg et al., 2017).
2 Review of ALP-photon interconversion in clusters
An ALP couples to electromagnetism through the Lagrangian term:
| (1) |
where parametrises the strength of the interaction, and and are the electric and magnetic fields. As their potential and interactions are protected by shift symmetries, ALPs can naturally have very small masses . The probability of ALP-photon interaction in the presence of an external magnetic field is a standard result (Sikivie, 1983; Raffelt & Stodolsky, 1988).
The full analytic expression for the probability of an ALP being converted to a photon after propagating through a single magnetic field domain of length is:
| (2) |
where
| (3) |
| (4) |
Here denotes the magnetic field component perpendicular to the ALP wave vector, is the energy and is the electron density. In the limit , . However when but , then . This probability grows with energy, containing oscillations that are rapid at low energies and broader at higher energies. These oscillations leave a distinctive imprint on otherwise featureless spectra, and their absence allows us to constrain .
This photon-ALP interconversion is particularly efficient in galaxy clusters (e.g. see (Burrage et al., 2009; Conlon & Marsh, 2013)). Clusters have fields of order G which extend over megaparsec scales, within which the magnetic field coherence lengths reach tens of kiloparsecs. The relatively low electron densities () also implies that it is at X-ray energies that the ‘sweet spot’ of large , small , and quasi-sinusoidal energy-dependent is located (Wouters & Brun, 2013; Conlon & Marsh, 2013; Angus et al., 2014; Conlon et al., 2016).
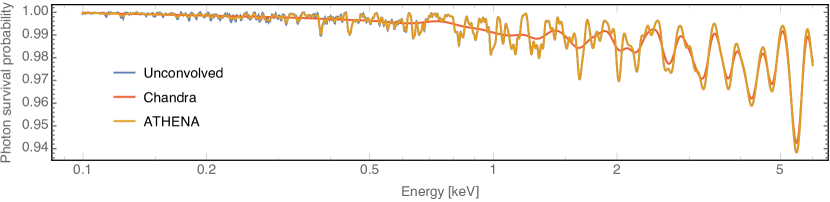
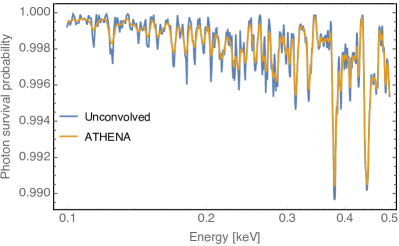
The 3D structure of intracluster magnetic fields is in general not known and so the precise form of the survival probability along any single line of sight cannot be determined. Figure 1 illustrates the energy-dependent survival probability for a photon passing across three hundred domains of a magnetic field, with the direction of the magnetic field randomised within each domain. The electron density and magnetic field strength in the model are based on those applicable in the Perseus cluster, but the pattern of smaller, rapid oscillations at low energies and slow oscillations with greater amplitude at high energies is generic.
Active Galactic Nuclei (AGNs) situated in or behind galaxy clusters provide excellent X-ray sources to search for such spectral modulations. One outstanding example is the bright central AGN of the Perseus cluster, at the heart of the galaxy NGC 1275. Its intrinsic spectrum is well described by an absorbed power law (Churazov et al., 2003; Yamazaki et al., 2013; Balmaverde et al., 2006; Fabian et al., 2015), and dominates the background cluster emission. The central cluster magnetic field value is estimated at G by (Taylor et al., 2006).
An analysis of archival data of observations of NGC 1275 by the Chandra and XMM-Newton satellites was done in (Berg et al., 2017) (see (Ajello et al., 2016) for a related analysis of NGC 1275 in gamma rays). Extending methods pioneered in (Wouters & Brun, 2013), the constraint on the ALP-photon coupling was found. For M87, a similar treatment was performed in (Marsh et al., 2017), finding a bound . An analysis of Chandra data of other bright point sources in galaxy clusters was conducted in ((Conlon et al., 2017)), deriving bounds of (for the Seyfert galaxy 2E 3140) and (for the AGN NGC 3862).
These bounds all hold for light ALPs with masses . This implies that these methods are not sensitive to an ordinary QCD axion, which for a photon couplings would typically have . However, unconventional models for the QCD axion where the photon coupling is significantly enhanced compared to naive expectation may be constrained using these techniques.
The bounds produced are superior to the bound on light ALPs derived from SN 1987A of (Payez et al., 2015), and are similar to those projected for IAXO in this low mass region (Irastorza et al., 2012). The bounds are also superior to those inferred from the absence of CMB distortions in COBE FIRAS data (Mirizzi et al., 2009), which constrain the product . Here is the strength of the cosmic magnetic field, which is limited to .
One major limiting constraint on existing data is the energy resolution of the detectors. If they exist, ALPs provide oscillatory structure all the way down to the lowest energies. However, as illustrated in Figure 1, detectors with energy resolutions of cannot resolve this structure at lower energies – but this does become accessible once a resolution of is achieved. We now discuss the future Athena X-ray observatory, whose greatly enhanced technical capabilities offer improved sensitivity to ALP-photon interconversion.
[\capbeside\thisfloatsetupcapbesideposition=right,center,capbesidewidth=0.48]figure[\FBwidth]
3 Athena
The Advanced Telescope for High ENergy Astrophysics (ATHENA) is an ESA mission to explore the Hot and Energetic Universe, due to launch in 2028 (Nandra
et al., 2013). The mirror will have a effective area and a 5 arcsec angular resolution. There are two instruments: the X-ray Integral Field Unit (X-IFU) and the Wide Field Imager (WFI). Here we focus on the former, which will consist of an array of TiAu Transition Edge Sensor (TES) micro-calorimeters sensitive to the energy range 0.2–12 keV (Barret
et al., 2016). When operated at a temperature of 50 mK, these can achieve an energy resolution of 2.5 eV below 7 keV (Gottardi
et al., 2014), implying X-IFU will be able to resolve narrow spectral oscillations. A readout time of will ensure pileup contamination is minimised. Table 1 contains
a summary of its properties, taken from the Athena Mission Proposal111http://www.the-athena-x-ray-observatory.eu/images/AthenaPapers/
The_Athena_Mission_Proposal.pdf, compared to properties of the Chandra ACIS-I detector, taken from the Chandra Proposer’s Guide222http://cxc.harvard.edu/proposer/POG/html/chap6.html.
| Athena (X-IFU) | Chandra (ACIS-I) | |
|---|---|---|
| Energy range | 0.2–12 keV | 0.3–10 keV |
| Energy resolution | 2.5 eV | 150 eV |
| at 6 keV | ||
| Spatial resolution | 5 arcsec | 0.5 arcsec |
| Time resolution | 10 s | 0.2 s |
| (2.8 ms single row) | ||
| Effective area | 2 m2 @ 1 keV | 600 cm2 @ 1.5 keV |
The combination of larger effective area, greatly improved energy resolution and reduced pileup contamination means Athena has far more potential to detect ALP-induced oscillations than the best current satellites. The aim of this paper is to make the first quantitative estimate of the extent to which Athena will be able to improve constraints on .
4 Estimate of projected bounds
In terms of estimating bounds on we use the same method as previously applied with Chandra data (Berg et al., 2017). This allows for a direct comparison between the capabilities of Chandra and Athena in terms of placing bounds.
We simulate Athena observations of NGC 1275, using two models for the photon spectra of the AGN. The first is a standard spectrum without ALPs, and the second is a model with the same spectrum multiplied with the photon survival probability distribution as introduced in Section 2. Using simulations of the X-IFU detector response, we fit spectra generated assuming ALP-photon conversion with the model without ALPs (Model 0) and then we compare this fit to the fit of the spectrum generated without ALPs to the same model. To allow for the uncertainty in the magnetic field configuration along the line of sight, we repeat this analysis using many different randomly generated magnetic fields.
The two photon spectra that we model are:
-
1.
Model 0: An absorbed power law plus thermal background:
(5) where and are the amplitude and index of the power law, is the energy, is the equivalent hydrogen column, is the photo-electric cross-section at redshift , and is the standard plasma thermal emission model.
-
2.
Model 1: An absorbed power law plus thermal background, multiplied by a table of survival probabilities for photons of different energies:
(6)
The index of the power law was set based on the best fit value from the cleanest Chandra observations of NGC 1275, and its normalisation was determined based on the Hitomi 230 ks observation of Perseus in 2016 (Aharonian et al., 2017). As the AGN in 2016 was roughly twice as bright as in 2009 and it has previously exhibited large historical variation (Fabian et al., 2015), it may be again much brighter (or dimmer) in 2028, which would affect both the contrast against the cluster background and also the observation time required to achieve a certain constraint on .
The 2016 Hitomi observation also constrained the temperature, abundances and velocity dispersion of the cluster thermal emission to a high degree of accuracy (Aharonian et al., 2017). For the spectral shape of the cluster background, we used the single-temperature model that was a good fit to the Hitomi spectrum across its field of view. While this single-temperature model is unlikely to be a good fit for the background contiguous to the AGN, it represents a useful proxy for the actual background that can only be determined at the time. The normalisation of the background was set by extracting a circular region of the cluster emission close to the AGN from the Chandra observations, of radius equal to the angular resolution of Athena, and determining the best fit. All model parameters are shown in Table 2.
| Model | parameter | symbol | value |
|---|---|---|---|
| nH column density | |||
| redshift | z | 0.0176 | |
| index | 1.8 | ||
| normalisation | A | ||
| temperature | kT | 3.48 keV | |
| abundances | 0.54 solar | ||
| velocity dispersion | v | 178 m | |
| normalisation | N |
As for the study with Chandra, we take the central magnetic field value as G, following (Taylor et al., 2006). We also assume that decreases with radius as . As there is not a direct measurement of the power spectrum and coherence length for the Perseus magnetic field, we base the model on those inferred for the cool core cluster A2199 (Vacca et al., 2012).
The electron density has the radial distribution found in (Churazov et al., 2003):
| (7) |
The magnetic field is generated over 300 domains, whose lengths are drawn from a Pareto distribution between and with power 2.8. In each domain the magnetic field and electron density are constant, with a random direction of . We then calculate the survival probability of a photon passing through this region, as described in (Angus et al., 2014).
The simulations were performed using the Simulation of X-ray Telescopes () code, a multi-instrument simulation package. It aims to offer an end-to-end simulation, i.e. the full detector chain from the source to the final data. It models the telescope’s vignetting, ARF and PSF, and X-IFU’s response, event reconstruction and pileup (Wilms et al., 2014).
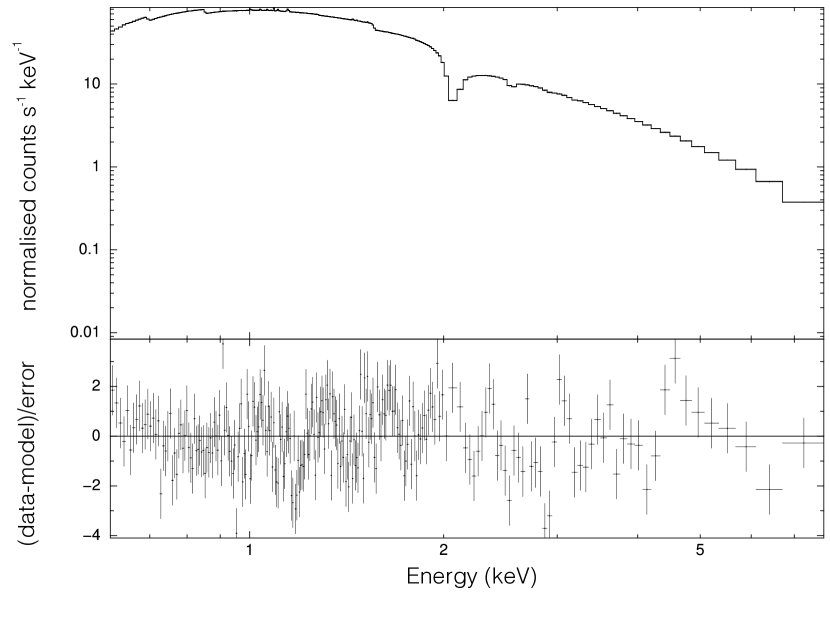
The spectrum of NGC 1275, and the cluster background, were modelled in 333https://heasarc.gsfc.nasa.gov/xanadu/xspec/manual/manual.html as an absorbed power law plus a thermal component, . This spectrum, either multiplied with the photon survival probabilities or not, was converted to the SIMPUT444http://hea-www.harvard.edu/heasarc/formats/simput-1.0.0.pdf file format using the command . The mirror and detector response were modelled with , using the ARF file and the RMF file . This generated an event FITS file, which was then converted into a PHA file using . We produced a fit to this spectrum in , using the Levenberg-Marquardt fitting method to calculate the reduced . Figure 2 shows one simulation for and its fit to an absorbed power law.
We use the following procedure to determine whether a particular value of is excluded: we varied the ALP-photon coupling from to , with stepsize . As the bound is dependent on uncertainties in the magnetic field strength of a factor of 2, and we are only using simulated data, we do not consider step sizes smaller than this. For each :
-
1.
Generate 50 configurations of the magnetic field .
-
2.
Use the to calculate the survival probability along the line of sight for different photon energies (as done in (Angus et al., 2014)). We calculate for 8000 equally spaced photon energies in the range 0.01–10 keV.
-
3.
Combine each with the AGN spectrum.
-
4.
Generate 10 fake PHAs for each spectrum, providing 500 fake data samples in total.
-
5.
Fit the fake data to Model 0, and calculate the reduced chi-squareds .
-
6.
Generate 100 fake PHAs based on Model 0, and compute the average of their reduced chi-squareds . Assuming the absence of ALPs, this represents the expected quality of the fit to the single real data set. If the actual data is a poor fit for some reason, then this will weaken the level of the resulting bounds that we can produce.
-
7.
Determine the percentage of fake data sets that have a reduced chi-squared . If this is true for fewer than 5 per cent of the data sets, the value of is excluded at 95 per cent confidence.
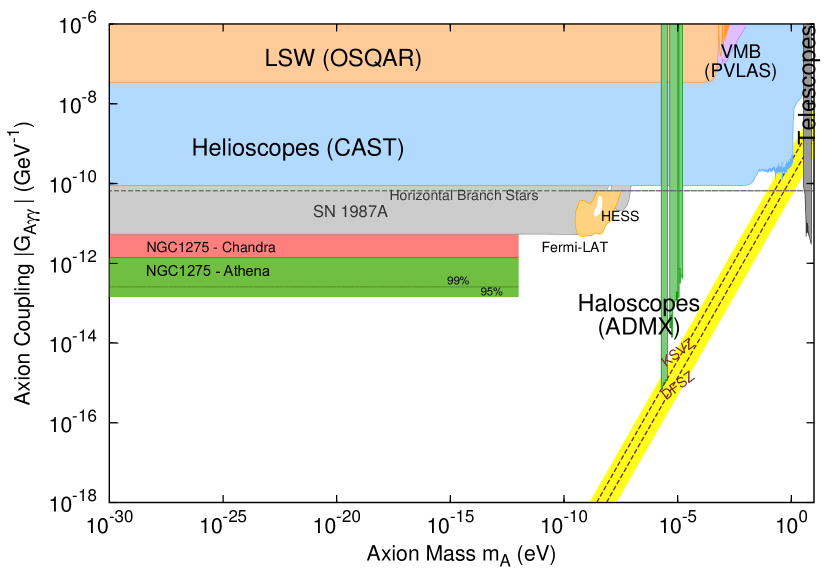
For a simulation of 200 ks of data with the nominal mirror configuration, we derive a projected bound of at 95 per cent confidence and of at 99% confidence, as shown in Fig. 3 alongside published data limits. This represents an order of magnitude improvement over the bound derived from the 200 ks of Chandra ACIS-I observations in (Berg et al., 2017). We also find that even a short 10 ks observation will lead to an improved bound of .
These bounds are substantially better than any current experimental or astrophysical bound, and also go beyond the capabilities of IAXO for ultralight ALP masses. The proposed DM haloscope ABRACADABRA has the potential to explore down to for (Kahn et al., 2016), if ALPs constitute the Dark Matter. The existence of ALP-induced oscillations in galaxy clusters is independent of this. Proposed CMB experiments such as PIXIE (Kogut et al., 2011) and PRISM (Andre et al., 2013) could produce a constraint which might be competitive with bounds from galaxy clusters if the cosmic magnetic field is close enough to saturation (Tashiro et al., 2013). Black hole superradiance also offers tentative constraints ALPs on in the mass range , depending on measurements of black hole spin (Arvanitaki et al., 2017).
5 Conclusion
AGNs situated in galaxy clusters are excellent targets to search for ALP-photon interconversion. Athena’s groundbreaking new technology will be able to resolve AGN spectra very precisely. The bound derived from simulations of 200 ks observations is an order of magnitude improvement over the bounds from current generation satellites. For the mass range , it will also be far better than the bounds obtainable from future experimental searches such as IAXO.
We stress that this is only a first estimate of the sensitivity of Athena to ALP-induced modulations. The final sensitivity will depend on the capabilities of the finished satellite, the brightness of the AGN in 2028 and the quality of the actual data. Telescopes such as the Square Kilometre Array (SKA) are likely to reduce the uncertainties in the magnetic field model (Braun et al., 2015), allowing for greater precision in bounds calculations by the time Athena launches. However, we have demonstrated that Athena will certainly improve bounds on substantively, and that X-ray astronomy will continue to be at the forefront of ultralight ALP searches in the coming decades.
Acknowledgements
This project is funded in part by the European Research Council starting grant ‘Supersymmetry Breaking in String Theory’ (307605). Both Francesca Day and Nicholas Jennings are also funded by STFC.
References
- Aharonian et al. (2017) Aharonian F. A., et al., 2017, Astrophys. J., 837, L15
- Ajello et al. (2016) Ajello M., et al., 2016, Physical Review Letters, 116, 161101
- Andre et al. (2013) Andre P., et al., 2013
- Angus et al. (2014) Angus S., Conlon J. P., Marsh M. C. D., Powell A. J., Witkowski L. T., 2014, JCAP, 1409, 026
- Arvanitaki et al. (2017) Arvanitaki A., Baryakhtar M., Dimopoulos S., Dubovsky S., Lasenby R., 2017, Phys. Rev., D95, 043001
- Balmaverde et al. (2006) Balmaverde B., Capetti A., Grandi P., 2006, Astron. Astrophys., 451, 35
- Barret et al. (2016) Barret D., et al., 2016, Proc. SPIE Int. Soc. Opt. Eng., 9905, 99052F
- Berg et al. (2017) Berg M., Conlon J. P., Day F., Jennings N., Krippendorf S., Powell A. J., Rummel M., 2017, Astrophys. J., 847, 101
- Boyarsky et al. (2014) Boyarsky A., Ruchayskiy O., Iakubovskyi D., Franse J., 2014, Phys. Rev. Lett., 113, 251301
- Braun et al. (2015) Braun R., Bourke T., Green J. A., Keane E., Wagg J., 2015, PoS, AASKA14, 174
- Bulbul et al. (2014) Bulbul E., Markevitch M., Foster A., Smith R. K., Loewenstein M., Randall S. W., 2014, Astrophys. J., 789, 13
- Burrage et al. (2009) Burrage C., Davis A.-C., Shaw D. J., 2009, Phys. Rev. Lett., 102, 201101
- Churazov et al. (2003) Churazov E., Forman W., Jones C., Bohringer H., 2003, Astrophys. J., 590, 225
- Cicoli et al. (2012) Cicoli M., Goodsell M., Ringwald A., 2012, JHEP, 10, 146
- Conlon (2006) Conlon J. P., 2006, JHEP, 05, 078
- Conlon & Marsh (2013) Conlon J. P., Marsh M. C. D., 2013, Phys. Rev. Lett., 111, 151301
- Conlon et al. (2016) Conlon J. P., Powell A. J., Marsh M. C. D., 2016, Phys. Rev. D, 93, 123526
- Conlon et al. (2017) Conlon J. P., Day F., Jennings N., Krippendorf S., Rummel M., 2017, JCAP, 1707, 005
- Fabian et al. (2015) Fabian A. C., Walker S. A., Pinto C., Russell H. R., Edge A. C., 2015, Mon. Not. Roy. Astron. Soc., 451, 3061
- Gottardi et al. (2014) Gottardi L., et al., 2014, Proc. SPIE Int. Soc. Opt. Eng., 9144, 91442M
- Irastorza et al. (2012) Irastorza I. G., et al., 2012, in Proceedings, 7th Patras Workshop on Axions, WIMPs and WISPs (AXION-WIMP 2011): Mykonos, Greece, June 27-July 1, 2011. pp 98–101 (arXiv:1201.3849), doi:10.3204/DESY-PROC-2011-04/irastorza_igor, http://inspirehep.net/record/1084988/files/arXiv:1201.3849.pdf
- Kahn et al. (2016) Kahn Y., Safdi B. R., Thaler J., 2016, Phys. Rev. Lett., 117, 141801
- Kogut et al. (2011) Kogut A., et al., 2011, JCAP, 1107, 025
- Marsh et al. (2017) Marsh M. C. D., Russell H. R., Fabian A. C., McNamara B. P., Nulsen P., Reynolds C. S., 2017
- Mirizzi et al. (2009) Mirizzi A., Redondo J., Sigl G., 2009, JCAP, 0908, 001
- Nandra et al. (2013) Nandra K., et al., 2013
- Patrignani et al. (2016) Patrignani C., et al., 2016, Chin. Phys., C40, 100001
- Payez et al. (2015) Payez A., Evoli C., Fischer T., Giannotti M., Mirizzi A., Ringwald A., 2015, JCAP, 1502, 006
- Peccei & Quinn (1977) Peccei R. D., Quinn H. R., 1977, Physical Review Letters, 38, 1440
- Raffelt & Stodolsky (1988) Raffelt G., Stodolsky L., 1988, Phys. Rev., D37, 1237
- Ringwald (2012) Ringwald A., 2012, Phys. Dark Univ., 1, 116
- Sikivie (1983) Sikivie P., 1983, Phys. Rev. Lett., 51, 1415
- Svrcek & Witten (2006) Svrcek P., Witten E., 2006, JHEP, 06, 051
- Tashiro et al. (2013) Tashiro H., Silk J., Marsh D. J. E., 2013, Phys. Rev., D88, 125024
- Taylor et al. (2006) Taylor G. B., Gugliucci N. E., Fabian A. C., Sanders J. S., Gentile G., Allen S. W., 2006, Mon. Not. Roy. Astron. Soc., 368, 1500
- Vacca et al. (2012) Vacca V., Murgia M., Govoni F., Feretti L., Giovannini G., Perley R. A., Taylor G. B., 2012, Astron. Astrophys., 540, A38
- Weinberg (1978) Weinberg S., 1978, Physical Review Letters, 40, 223
- Wilczek (1978) Wilczek F., 1978, Physical Review Letters, 40, 279
- Wilms et al. (2014) Wilms J., et al., 2014, in Space Telescopes and Instrumentation 2014: Ultraviolet to Gamma Ray. p. 91445X, doi:10.1117/12.2056347
- Wouters & Brun (2013) Wouters D., Brun P., 2013, Astrophys. J., 772, 44
- Yamazaki et al. (2013) Yamazaki S., et al., 2013, Publications of the Astronomical Society of Japan, 65