Monte Carlo Simulations of the Transition Radiation Detector of the AMS-02 Experiment111© 2017. This manuscript version is made available under the CC-BY-NC-ND 4.0 license, http://creativecommons.org/licenses/by-nc-nd/4.0/.
Abstract
The Transition Radiation Detector of the AMS-02 experiment on the International Space Station is used for the separation of cosmic-ray positrons and electrons from protons and anti-protons, and for the identification of nuclei up to carbon (). We present the Geant4 simulation that is used to describe the ionization and transition radiation processes and compare its results to flight data from AMS-02. After applying empirical corrections to the simulated data, the particle energy deposition and likelihood distributions in the TRD are described with high accuracy.
keywords:
AMS , TRD , Transition radiation , Geant , PAI modelPACS:
07.05.Tp , 29.40.Cs , 95.55.Vj , 96.50.sb1 Introduction
The effect of Transition Radiation (TR) can be used to effectively separate light and heavy particles in a high-energy physics detector. TR photons are emitted when a relativistic charged particle crosses boundaries between materials of different permittivity. Transition Radiation Detectors (TRD) exploit the fact that the yield of TR depends on the Lorentz factor of a particle.
For the design of a TRD and advanced data analysis, the availability of a realistic detector simulation is essential. Here, we compare data recorded by the TRD [1] of the Alpha Magnetic Spectrometer (AMS-02) [2], a general purpose particle detector for cosmic rays mounted on the International Space Station (ISS), to a Monte Carlo simulation. The AMS-02 TRD is capable of separating protons from positrons with a rejection power of more than 10000 at a particle momentum of and 10 at [3]. With the current high voltage settings, its dynamic range allows for the measurement of primary ionization for ions up to carbon (). AMS-02 has collected a vast amount of high-quality data since its launch in May 2011, which can be used for optimization and verification of the detector simulation.
The Monte Carlo simulation (MC) of the TRD is based on the widely used Geant simulation toolkit [4, 5]. We have used version 4.10.1. The ionization of charged particles in the thin gas inside the TRD straws, the production of TR in the fleece radiator and the photo-effect of TR X-ray photons in the gas are managed by Geant4 classes as well. We have optimized and tested the TRD simulation based on more than five years of AMS-02 data for all relevant particle species that cover a wide momentum range needed in data analysis. Despite the necessity for a good description of the TR production and ionization energy losses in thin absorbers, few studies have been published on experimental validation of TRD simulation so far [6, 7, 8, 9, 10]. We describe the design of the AMS-02 TRD and detail the steps to obtain an accurate simulation in Section 2. The most relevant AMS-02 TRD distributions are compared to results from the Geant4 simulation in Section 3, and conclusions are given in Section 4.
2 Design and simulation of the AMS-02 TRD
The TRD has approximate dimensions of m3. It is located in the upper part of AMS-02 above the permanent magnet that surrounds the inner tracker. The TRD provides important information for the particle identification and allows the selection of clean events through the recognition of secondary tracks that can emerge from possible hadronic interactions occuring above and inside the TRD.
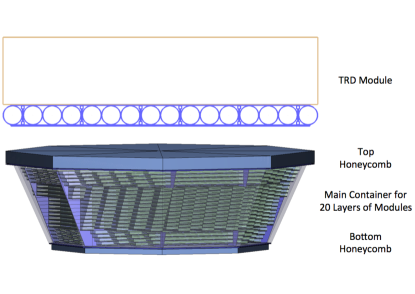
The TRD consists of 20 layers of straw tubes with cm inner diameter which are filled with a Xe/CO2 (%/%) gas mixture at a pressure of bar. The four topmost and four bottommost layers are oriented perpendicularly with respect to the inner layers to enable three-dimensional tracking with the TRD. The straws are grouped into modules, each module containing straws and a 20 mm thick irregular fleece radiator. The radiator is made of polyethylene and polypropylene fibers, with a density of g/cm3. The straws are made of double layer kapton-aluminum foil of m wall thickness, a gold-plated tungsten anode wire of m diameter attached in the center. In total, the TRD comprises straws, with lengths varying between – m. The model of the TRD implemented in the simulation [11] is visualized in Fig. 1.
The TRD is operated at a high voltage of 1.4 kV for a gas gain of . The readout electronics is based on two VA-chip analog multiplexers and 12-bit analog to digital converters (ADCs). On arrival of a trigger signal from the AMS main computer, the digitized data are collected, reduced, and recorded [12].
We use Geant4 to simulate the passage of particles through the TRD. For the simulation of ionization in the thin gas mixture inside the TRD straws the Photo-Absorption Ionization (PAI) Model [13] as implemented in Geant4 provides the most accurate description of energy losses. The production of TR in the fleece radiator is described best by the Geant4 G4GammaXTRadiator class [14], for which the adjustable parameters were optimized already in Ref. [6]. The optimal fiber thickness for the production of TR was found to be m, which is close to its nominal value of m. The relative fluctuation parameters for the fiber thickness and the gap width between adjacent fibers were set to and , respectively. The thickness of the fleece radiator blocks was adjusted to mm, resulting in a total weight of kg, in agreement with the measured weight. For the realistic simulation of the absorption of TR X-ray photons in gas, the atom de-excitation process was activated using the G4UAtomicDeexcitation class. The production cuts for secondary photons and electrons were 1 mm outside the tubes and 0.001 mm inside the tube walls. Apart from the processes used for the description of TR and ionization in the TRD gas, we use the standard electromagnetic physics list. For hadrons, we use the standard elastic scattering processes, combined with the QGSP_BIC inelastic model. Details on the physics list used for helium and heavier ions are given in Ref. [15].
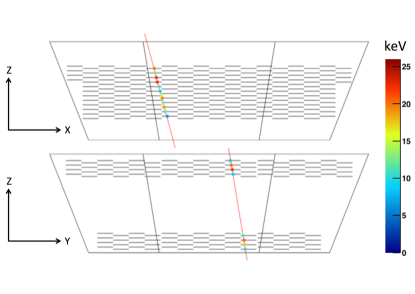
The total energy deposited in a TRD straw is converted to a number of ADC counts by the readout electronics chain. The ADC dynamic range extends to ADC counts, which corresponds to an energy deposition of keV. An example of a electron simulated in the TRD is illustrated in Fig. 1. In the standard analysis, a track reconstructed by the silicon tracker of AMS-02 is extrapolated through the TRD to select hits on the track and to determine the pathlengths inside the TRD straws. In addition, a standalone TRD tracking is available that identifies tracks and calculates pathlengths completely independent from the rest of AMS-02. A particle passing through the complete TRD produces hits on average.
Before simulated data and data from the AMS-02 TRD can be compared, the latter have to be calibrated to correct for time-dependent effects from the constantly changing thermal environment on the ISS [16, 17]. In the first step, the relative movement of the TRD with respect to the inner tracking system of AMS-02 is reconstructed and corrected for. Then, a relative gas-gain calibration factor is determined for every TRD module as a function of time. This is done by selecting a clean sample of protons and fitting the position of the peak of the Landau-like distribution of their energy depositions. The same procedure is applied to simulated data, to introduce realistic statistical fluctuations in the calibration factors.
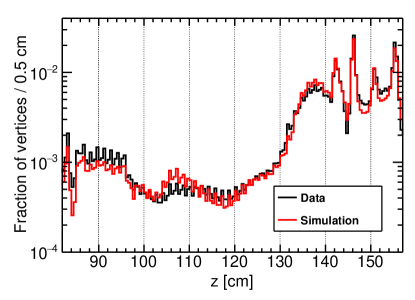
For a cross-check of the geometry description, we use rare events in which hadronic interactions occur inside or close to the TRD, resulting in secondary tracks that share a common vertex which can be reconstructed by the standalone TRD tracking. The distribution of interaction vertices reflects the material distribution in the detector. The amount of reconstructed vertices in AMS-02 data within cm in the TRD is shown in the top view of Fig. 2. The TRD covers a vertical range of – cm, with the coordinate system defined as shown in Fig. 1. Even tiny details are visible demonstrating the accuracy of the TRD standalone track reconstruction. In the bottom view of Fig. 2 the reconstructed vertex distributions in the TRD are compared between AMS-02 and simulated data. The fraction of vertices drops steeply in the lower part of TRD where the probability to reconstruct sufficiently long TRD tracks decreases strongly in the case of down-going primary particles. The lower the -position, the higher the probability that the vertex is based on backsplash secondary tracks of a down-going or on secondary tracks of an upward-going primary particle. These contributions can change the relative fraction of vertices at different vertical positions but are still reproduced well in the simulation.

In the TRD simulation, all energy depositions from primary and secondary particles in a given straw are summed up. Then, the total energy deposition amplitude is converted to an ADC value in a signal digitization step, using a conversion factor of . This procedure yields the ideal ADC value . The straws act as ideal detectors, that is, detailed gas physics phenomena like drifting of low-energy ionization electrons to the anode wire are not simulated. The detailed simulation of gas physics would require too much CPU time.
We find that the measured energy deposition is non-linear compared with the ideal detector simulation. The non-linearity of the readout electronics was measured in detail in the laboratory before the launch of AMS-02, but its magnitude is not sufficient to explain the measured difference to the ideal simulation. Therefore, gas effects have to be approximated by an effective empirical correction applied in the signal digitization procedure. We have found an empirical correction that needs as few parameters as possible and is universal, i.e. without explicit dependence on particle species. We observe several effects that we account for in the correction. All in all, the effects are similar to space-charge effects [18, 19]. First, we see a strong non-linearity for ions, which produce large numbers of secondary electrons. Second, the magnitude of non-linearity is stronger the larger the relative fraction of primary ionization. This is likely due to the fact that drift electrons originating from primary particle ionization arrive at the wire more localized than that from secondary particle ionization. If a significant fraction of the energy deposition comes from secondary particles, which hit the tube at some distance from the primary track, the drift electrons will be spread over a longer distance on the wire resulting in a reduction of the non-linearity. To account for this geometric effect, we will use the fraction of energy deposition that originates from primary ionization, . Third, the absorption of TR X-ray photons differs from continuous ionization since a photon is absorbed in a single point from which all electrons resulting from atom de-excitation drift together to the wire. Therefore, we will use the fraction of transition radiation that contributed to the energy deposition in the straw in the correction. The optimal corrections were found out by trying several different approaches. To ensure that corrections are smooth and behave as expected the simplest possible solutions were selected.
In the case of simulated data, all non-linearity effects present in AMS-02 data and discussed above need to be included by applying corrections to . In the first and strongest correction, the ADC value is adjusted downwards according to the second-order polynomial
| (1) |
where is given in ADC counts. Beyond a value of ADC counts, the correction becomes linear and continues tangentially. The amplitude is then further reduced depending on the value of :
| (2) |
where is the magnitude of the previous correction. Here, we consider all energy depositions in gas except absorption of TR photons as ionization. After the correction, some compensation is done depending on the fraction of TR , defined as
| (3) |
but not allowed to exceed . In the last step, a correction for the non-linearity of the electronics, based on laboratory measurements, is applied. It is approximated by the third-order polynomial
| (4) |
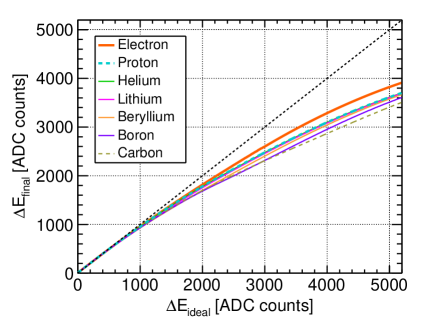
that continues linearly in the direction of the tangent after ADC counts. The electronics correction results in –% reduction in the end of ADC dynamic range. In the case of pure ionization, the correction in Eq. 1 has the largest contribution. The final correction function defined above is shown in Fig. 3 for particle species with . The correction function is independent of the particle species but varies slightly and especially for because of different primary ionization contributions. The final correction for electrons differs clearly from that for other species because of the TR-dependent compensation in Eq. 3. In general, the TRD response is relatively linear up to ADC counts after which non-linearity effects become important.
3 Validation of TRD simulation with AMS-02 data
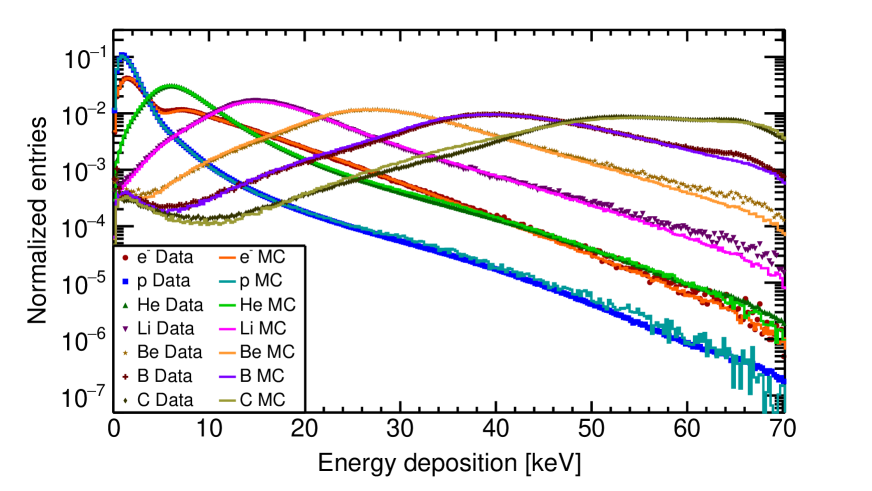
A precise description of particle energy deposition spectra is important since they are used for particle identification and background suppression in data analysis. The comparison between AMS-02 data and simulations for species in the rigidity range of – GV is shown in Fig. 4. Rigidity is defined as momentum per charge. Clean samples of particle species in the TRD were obtained by applying suitable selection cuts on observables measured by the other subdetectors of AMS-02 in the selected geometrical acceptance. In event selection, the xenon partial pressure in the TRD was required to be within mbar of the fixed mbar xenon pressure set in simulations to ensure similar conditions for data comparison. The distribution in momentum of the simulated primary particles was chosen to be proportional to , and events were then re-weighted to match the actual momentum spectra observed in cosmic rays.
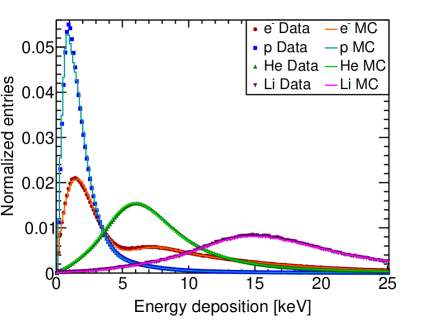
The simulations show a very good agreement with experimental data over a wide amplitude range for all the species. Small deviations from AMS-02 data in the tails of the distributions can be partially explained by the time-dependence of the straw pedestals, which changes the effective end of the ADC range, as well as variations in gas pressure which are not included in the simulation. As visible in Fig. 5, the shapes of the ionization peaks for simulated protons and electrons differ only slightly from AMS-02 data.
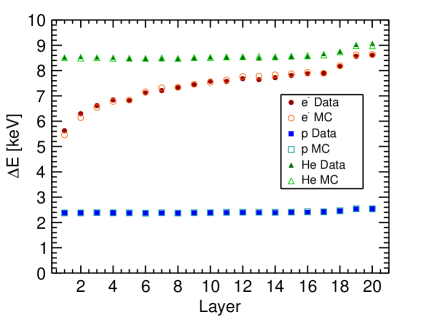
The accuracy of the TR simulation can be tested by comparing electron mean energy depositions from layer to layer (Fig. 6). For protons and helium nuclei the mean energy depositions in the TRD stay rather constant between the layers but for electrons they increase with depth since the TR photons accumulate as they can pass through several layers before being absorbed. Since the orientation of modules changes above layers and , there is less space for fleece radiator, which results in slightly reduced energy deposition in those layers. In the two bottom layers the mean energy deposition is enhanced because of backsplash particles originating from interactions in the TRD lower honeycomb.
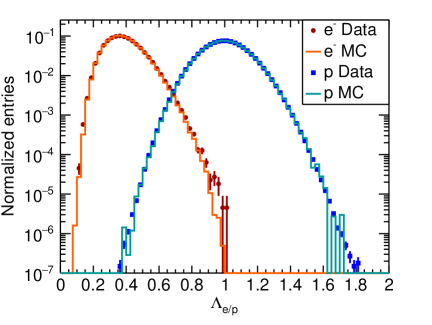
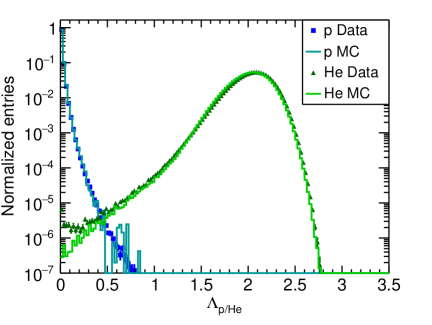
For particle identification purposes, one employs a TRD estimator calculated as a likelihood ratio between two particle hypotheses and ,
| (5) |
in which the likelihood for each particle hypothesis is calculated from the measurements in layers along one particle track in the TRD according to
| (6) |
where is the probability for a particle of species and rigidity to give an energy deposition in layer at a xenon partial pressure of over the measured pathlength . Lookups for the probability functions are created from AMS-02 data in a dedicated calibration analysis. The comparison of the distributions for protons and electrons and of the distributions for protons and helium between simulations and AMS-02 data is shown in Figs. 7 and 8. The simulation reproduces AMS-02 data with high accuracy.
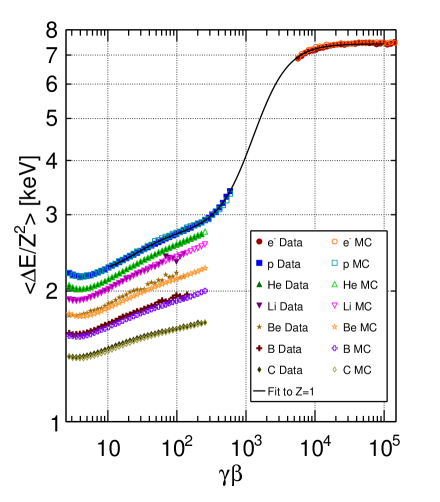
Another useful analysis variable is the TRD mean response, which is calculated as the mean of all hits that were associated with the primary track. The average mean response per as a function of for particle species is shown in Fig. 9, where is calculated for electrons from ECAL energy and for the rest of the particle species from the reconstructed rigidity. The mean response per gets systematically reduced with increasing charge because of the non-linearity effects, which get stronger the higher the energy deposition in a straw. The onset of TR at is clearly visible. A modified Fermi function was fitted to the AMS-02 datasets to demonstrate that they can be described universally.
4 Conclusions
We have shown that the geometry of the AMS-02 TRD is accurately modeled in our simulation. After optimization of the TRD simulation parameters and implementation of empirical non-linearity corrections, the TRD amplitude and likelihood distributions of all relevant particle species up to carbon nuclei are described at remarkable precision over a wide rigidity range. The non-linearity corrections, which are applied to simulated data in the digitization phase, play an important role for achieving a realistic detector simulation. The correction functions are independent of and they are motivated by physics principles. All in all, the TRD simulation works very well and provides important input to data analyses.
Acknowledgments
We are grateful to our colleagues of the AMS Collaboration, in particular those involved in the design, construction and operation of the TRD. Simulations were partially performed with computing resources granted by JARA-HPC from RWTH Aachen University under project jara0052.
References
References
- [1] T. Kirn et al., The AMS-02 TRD on the international space station, Nucl. Instrum. Methods in Phys. Research A 706 (2013) 43–47.
- [2] A. Kounine, The Alpha Magnetic Spectrometer on the International Space Station, Internat. Journ. Mod. Phys. E 21 (2012) 30005.
- [3] M. Aguilar et al., First Result from the Alpha Magnetic Spectrometer on the International Space Station: Precision Measurement of the Positron Fraction in Primary Cosmic Rays of 0.5–350 GeV, Phys. Rev. Lett. 110 (2013) 141102.
- [4] S. Agostinelli et al., GEANT4 – a simulation toolkit, Nucl. Instrum. Methods in Phys. Research A 506 (2003) 250–303.
- [5] J. Allison et al., Geant4 developments and applications, IEEE Trans. Nucl. Sci. 53 (2006) 270–278.
- [6] B. Beischer et al., Comparison of Geant4 transition radiation and ionization loss simulation to testbeam data, Nucl. Instrum. Methods in Phys. Research A 583 (2007) 485–493.
- [7] J. Apostolakis et al., An implementation of ionisation energy loss in very thin absorbers for the GEANT4 simulation package, Nucl. Instrum. Methods in Phys. Research A 453 (2000) 597–605.
- [8] V. M. Grichine, X-ray transition radiation energy loss of relativistic charge in absorbing media, Nucl. Instrum. Methods in Phys. Research A 484 (2002) 573–586.
- [9] V. M. Grichine, S. S. Sadilov, GEANT4 X-ray transition radiation package, Nucl. Instrum. Methods in Phys. Research A 563 (2006) 299–302.
- [10] V. M. Grichine, Generation of X-ray transition radiation inside complex radiators, Phys. Lett. B 525 (2002) 225–239.
- [11] M. Schmanau, Data acquisition development and background studies for the space borne detector AMS-02 and CMOS detector MIMOSA-V, Ph.D. thesis, University of Karlsruhe, Germany (2008).
- [12] C. H. Chung et al., The AMS-02 Transition Radiation Detector, Proc. 31st Int. Cosmic Ray Conf., Łódź, Poland (2009).
- [13] W. W. M. Allison, J. H. Cobb, Relativistic Charged Particle Identification by Energy Loss, Ann. Rev. Nucl. Part. Sci. 30 (1980) 253–298.
- [14] V. M. Grichine, S. S. Sadilov, GEANT4 models for X-ray transition radiation, Nucl. Instrum. Methods in Phys. Research A 522 (2004) 122–125.
- [15] J. Aguilar et al., Precision Measurement of the Helium Flux in Primary Cosmic Rays of Rigidities 1.9 GV to 3 TV with the Alpha Magnetic Spectrometer on the International Space Station, Phys. Rev. Lett. 115 (2015) 211101
- [16] M. Heil et al., Operations and Alignment of the AMS-02 Transition Radiation Detector, Proc. 33rd Int. Cosmic Ray Conf., Rio de Janeiro, Brazil (2013).
- [17] H. Gast et al., Identification of cosmic-ray positrons with the transition radiation detector of the AMS experiment on the International Space Station, Proc. 33rd Int. Cosmic Ray Conf., Rio de Janeiro, Brazil (2013).
- [18] R. W. Hendricks, Space Charge Effects in Proportional Counters, Rev. Sci. Instrum. 40 (1969) 1216–1223.
- [19] A. Andronic et al., Space charge in drift chambers operated with the Xe,CO2(15%) mixture, Nucl. Instrum. Methods in Phys. Research A 525 (2004) 447–457.