Lasing with cell-endogenous fluorophores: parameters and conditions
Abstract
The notion of lasing with biologics has recently been realized and has since rapidly developed with the collective objective of creating lasers in vivo. One limitation of achieving this goal is the requirement of exogenous laser dyes and fluorescent materials. To circumvent this, we investigate the use of cell-endogenous fluorophores - sources of cell autofluorescence - as laser gain material. In this work, we study the lasing potential and efficiency of flavins and reduced nicotinamide adenine dinucleotide (phosphate) (NAD(P)H) using a dye lasing model based on coupled rate equations. Analytical solutions for one- and two-photon pumped system were used in multi-parameter studies. We found that at physiological conditions, lasing can be supported by NAD(P)H with cavity quality factors of 105. With the further consideration of damage thresholds, we recommend the use of flavins as they entail lower threshold requirements. We then identify potential parameters for engineering to make the lasing of flavins feasible even at their low physiological intracellular concentrations. We also note the higher threshold requirements and lower efficiencies of two-photon pumping, but recognize its potential for realizing lasing in vivo.
Introduction
Biological lasers (bio-lasers) hold immense potential for applications within biological systems because they are themselves composed of biologics[1]. This concept of generating lasing within or by biologics would be able to circumvent the limited propagation of light in biological tissues as experienced by external laser sources. Since the first demonstration of a single-cell laser[2] by Gather and Yun in 2011, biological lasers have developed rapidly in recent years. This included the demonstration of intracellular lasing using native cell organelles as microcavities[3] for intracellular sensing as well as by internalizing microresonators[3, 4] for cell tagging and tracking. Aside from cells, bio-lasing has also been demonstrated with biomolecules (flavins[5, 6], green fluorescent protein[7] and chloropyll[8]) and human tissues (bone[9] and blood[10]).
Albeit novel and remarkable demonstrations of biological lasers, the generation of lasing by biological cells and tissues still entail the use of externally introduced laser dyes or fluorescent material. Notably, there are biomolecules existing natively within cells that fluoresce. These cell-endogenous fluorophores are the source of autofluorescence, which is often regarded as noise in fluorescence microscopy. Notably, they are also the very machineries responsible for cell functions and metabolic activities[11]. These biomolecules have therefore also been employed as endogenous biomarkers for applications like live cell characterization[12, 13] and cell sorting[14, 15]. Nevertheless, these are fluorescence emissions and are thus spectrally broad by nature. Such a property makes it difficult to discern between fluorophores with overlapping emission spectra. In contrast, lasing emissions are spectrally narrow and therefore would facilitate the differentation of emissions from several different fluorophores. In this work, we study the conditions and parameters for lasing two of the most abundant cell-endogenous fluorophores - flavins and reduced nicotinamide adenine dinucleotide (phosphate) (NAD(P)H). We do so by using and extending an established organic dye laser model[16]. The framework of the model is based on coupled rate equations that describe the different energy states of our fluorophores. We analytically obtain the lasing thresholds and efficiencies for flavins and NAD(P)H, and identify parameters required for lasing under physiological conditions. We then make recommendations for possible approaches to lower threshold requirements so as to mitigate risks of inducing irreversible cell damage.
Methods
Theoretical model
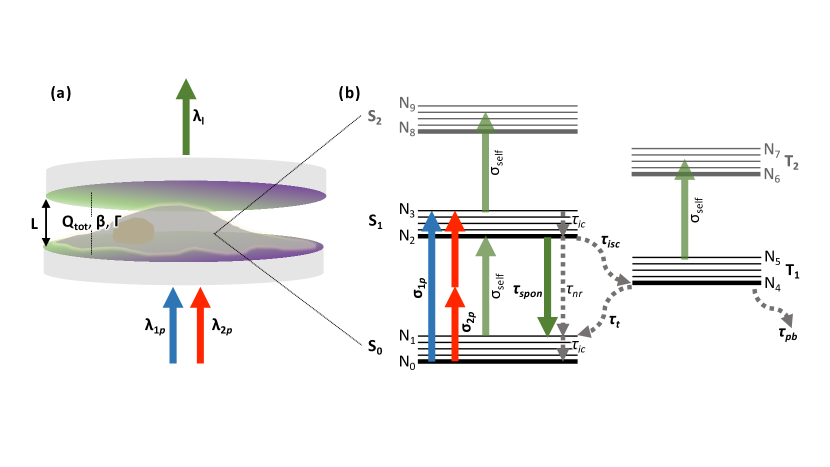
In this study, we investigated the parameters and conditions for lasing in biological cells without the introduction of exogenous laser dyes or fluorescent materials. We modelled the bio-laser construct as an adherent cell within an optical cavity, pumped by an external pulsed laser source as illustrated in Figure 1a. The endogenous fluorophores, flavins and NAD(P)H, were analyzed for their potential as laser gain media under physiological conditions. It should be noted that flavins here refer to all three fluorescent derivatives found natively within cells, namely riboflavins (RF), flavin mononucleotides (FMN) and flavin adenine dinucleotide (FAD); while NAD(P)H collectively refers to the fluorescent reduced forms of nicotinamide adenine dinucleotide (NAD) and nicotinamide adenine dinucleotide phosphate (NADP). The parameters that define each endogenous fluorophore are listed in Table 1. In the model, we assumed a homogenous distribution of either endogenous fluorophore within a 100m100m5m volume. These dimensions correspond to the approximate dimensions of an adherent cell stretched over a 100m100m area with a height of 5m - equivalent to the cavity length.
The theoretical framework in this study is based on 11 coupled rate equations that describe 10 energy levels (N0 to N9) and an output as depicted by the energy level diagram in Figure 1. These rate equations are based on an established organic dye laser model[16]. To incorporate the two-photon pumping regime, the terms describing the rate of pumping were reformulated. In the one-photon regime it takes the form:
| (1) |
Where is the input pump intensity; is Planck’s constant; is the frequency of the input pump under one-photon pumping; is the one-photon absorption cross section; is the number density of the fluorophore, calculated from (: Avogadro’s constant; : molar concentration); A is the area of pumping; and L is the thickness of the cavity. While in the two-photon regime, the rate of pumping takes the form:
| (2) |
Where is the frequency of the input pump under two-photon pumping and is its corresponding two-photon absorption cross section. Note that the approximation holds in this study across all considered fluorophore concentrations. Under the most ideal case of two-photon absorption by flavins at a concentration of 0.1M, deviation only occurs when pump intensities exceed 1017Wcm-2. All coupled rate equations were solved numerically in MATLAB. Parameters used in computations are listed in Table 1.
| Parameters | Flavins | NAD(P)H |
|---|---|---|
| Pump area, | cm2 | |
| Cavity length, | 5m | |
| Quality factor of cavity due to radiative loss, | ||
| Spontaneous emission coupling factor, | ([17],a) | |
| Confinement factor of lasing mode, | 0.2 | |
| One-photon pump wavelength, | 390nm | |
| Two-photon pump wavelength, | 780nm | |
| Lasing output wavelength, | 580nm | 500nm |
| One-photon absorption cross section, | cm2 ([18]) | cm2 ([19]) |
| Two-photon absorption cross section, | cm4W-1 ([20]) | cm4W-1 ([20]) |
| Self-absorption cross section of output , | cm2 | cm2 |
| Self-absorption cross section of output , | cm2 | cm2 |
| Self-absorption cross section of output , | cm2 | cm2 |
| Fluorescence quantum yield, | 0.26 ([21, 22, 23]) | 0.019 ([24]) |
| Spontaneous emission lifetime, | 4.6ns ([23, 25, 26]) | 0.4 ([27, 28, 29, 30]) |
| Internal conversion lifetime, | 1ps | 1ps |
| Intersystem crossing lifetime, | 13.6ns ([31]) | ([32]) |
| Triplet decay lifetime, | 27s ([33]) | 2.7s ([34]) |
| Intracellular concentration, | M ([35],b) | M ([30]) |
| Critical transfer concentration, | M ([36]) | M ([37]) |
| Dimerization constant, | 118M-1 ([38]) | NA ([39, 40],c) |
Lasing threshold
Simplified analytical solutions to lasing thresholds were derived from the couple rate equations at steady state (i.e. =0, where corresponds to the different energy levels). The total fluorophore population is assumed to be Ntot=N0+N2+N4. This assumption is valid when: (i) pulsed excitation is considered where the rate of photobleaching () is orders of magnitudes slower; (ii) pump absorption is negligible for S1 to S2 and T1 to T2 transitions; (iii) pump intensities are reasonably low, such that other levels are negligibly populated. The one-photon pumped lasing threshold[16] is:
| (3) |
Where is the fluorescence quantum yield; , and correspond to the lifetimes of spontaneous emission, intersystem crossing from S1 to T1 and triplet relaxation from T1 to S0 respectively; is the spontaneous emission coupling factor; is the confinement factor of the lasing mode; is the gain volume defined by ; and are the combined losses from the passive cavity’s photon decay lifetime () and self-absorption of the output from S0 to S1 and S1 to S2 (or T1 to T2) respectively. ( and , where ; is the lasing frequency; is the group velocity of the lasing output; is the self-absorption cross section). Similarly, we derived the lasing threshold under two-photon pumping as:
| (4) |
Effects of concentration quenching by dimerization[41, 42] on and were also included in the lasing threshold analysis using the parameters acquired for the fluorophores’ critical transfer concentration () and dimerization constant ().
Lasing efficiency
Simplified analytical solutions to lasing efficiencies were likewise derived based on the same assumptions. The one-photon pumped lasing efficiency[16] is:
| (5) |
is essentially the gradient of the post-threshold linear slope for the input-output intensity plot (i.e. ). Here, is the photon decay lifetime due to radiative loss from the cavity. We also derive the two-photon pumped lasing efficiency as:
| (6) |
Where . Here, has been formulated as a dimensionless term like .
Results
Lasing thresholds
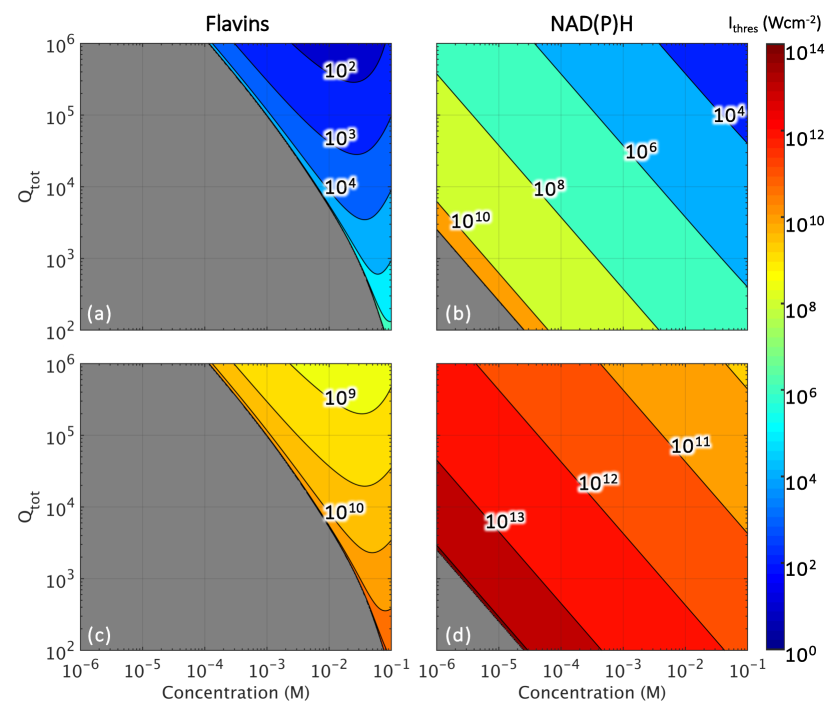
In this section, we studied the order of pump intensities required for lasing by varying 3 parameters - total quality factor of cavity (), concentration of fluorophores () and ratio of lifetimes for intersystem crossing (). Lasing thresholds were computed using Equations 1 and Theoretical model. In Figure 2, lasing thresholds are reported as a function of and and we note two key observations from the plots. First, NAD(P)H supports lasing over a wider range of concentrations as compared to flavins where lasing cannot be achieved below 10-4M. This is true under both one- and two-photon pumping. Next, we note higher threshold intensities for NAD(P)H. Threshold intensities were computed to range from 102 to 1011Wcm-2 for NAD(P)H and 101 to 106Wcm-2 for flavins under one-photon pumping. For two-photon pumping, threshold intensities ranged from 109 to 1014Wcm-2 for NAD(P)H and 108 to 1011Wcm-2 for flavins.
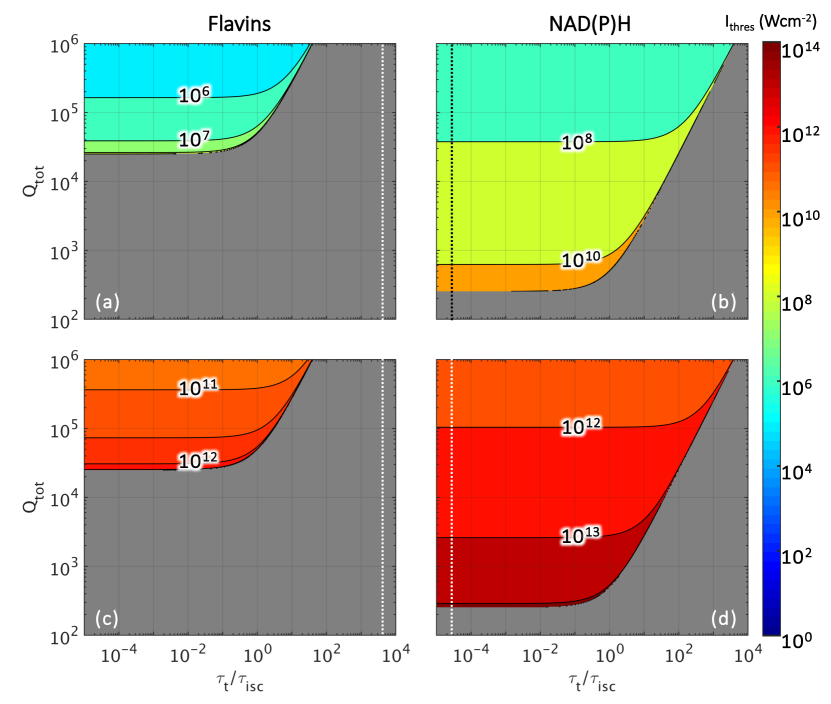
In Figure 3, we study the effects of varying and on lasing thresholds. Threshold intensities were computed for intracellular concentrations of flavins[35] and NAD(P)H[30] at 10-6M and 10-5M respectively. Here, we note that lasing is supported in NAD(P)H at lower values of . Under both pumping regimes, lasing can be achieved from of for NAD(P)H and for flavins. In addition, we highlight that at physiological conditions of , lasing is not supported by flavins. This is indicated by the white-dotted line residing within the non-lasing region of the Figure 3a and c.
Lasing efficiencies
| from simplified analytical solution | 15.7 | 21.4 | 132 |
| Linear fit of semi-simplified analytical solution | 15.4 | 18.2 | 58.5 |
We further analyzed the efficiency of lasing for 10-5M NAD(P)H for different . Lasing efficiency corresponds to the amount of output lasing intensity generated per unit of input pump intensity (or square of input pump intensity for the two-photon regime) . Efficiencies were computed using Equations 5 and 6 and are reported in Table 2. For both regimes of pumping, efficiencies are noted to decrease by approximately an order per order of decrease in . We further observe that efficiencies under one-photon pumping are 18 to 19 orders higher than their two-photon pumped counterparts.
Next, we examined the deviation of simplified analytical solution from numerically computed results. Initial computations revealed significant deviations from the numerical solution especially at low . At high pump intensities, assumption (iii) that was stated in the derivation of lasing threshold solutions becomes invalid. A semi-simplified analytical solution was thus derived by considering Ntot=N0+N2+N3+N4. This solution under one-photon pumping was derived as follows. First we obtained expressions to eliminate terms defining the populations at different energy levels:
| (7) |
| (8) |
The above expressions were then incorporated into the following equation:
| (9) |
A semi-simplified analytical solution for Iout was then solved from the above using MATLAB. The same was done for the two-photon regime, by replacing the rate of pumping terms from what is defined in Equation 3 to that in Equation 4.
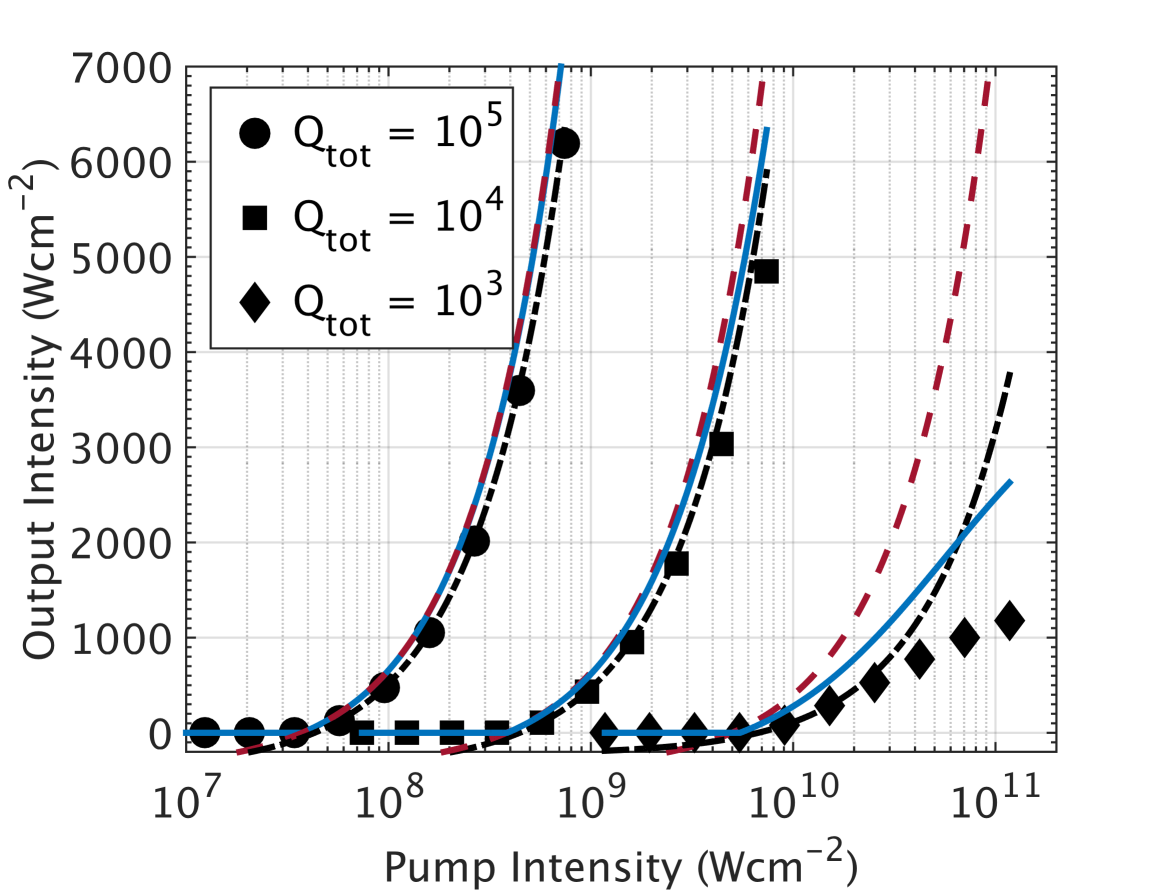
In Figure 4, we see the differences between the simplified (red dashed lines) and semi-simplified analytical solutions (blue solid lines) and the numerical data (black-coloured data points). This difference is observed to increase with decreasing . This difference is further quantified by taking the difference between analytical and numerical solutions as a percentage of the corresponding numerical solutions. We report these calculated percentage deviations for lasing efficiency in Table 3. To obtain lasing efficiencies from the numerical solution, linear fits were made with the first two data points post-lasing threshold. The corresponding range of data points for the semi-simplified analytical solution were then used in obtaining their respective lasing efficiencies.
Discussion
Lasing at physiological conditions
At physiological conditions, where intracellular concentrations of flavins and NAD(P)H are at 10-6M and 10-5M respectively, we note from Figure 2 that it is not possible to lase flavins. It is however possible to lase NAD(P)H with high pump intensities. According to the ICNIRP guidelines[43], the damage threshold for tissues (skin) exposed to visible lasers of nanosecond pulses is 20mJcm-2 - for a 1ns pulse, this is equivalent to 20MWcm-2. From Figure 2b, we identify a required total cavity quality factor of 105 to lase NAD(P)H without inducing damage. Such quality factors are attainable by whispering gallery mode (WGM) microresonators[44] and even Fabry-Pérot microcavities that enable three-dimensional confinement[45]. However, considering that a WGM microresonator requires the fluorophores to reside at its periphery to effectively generate lasing, it becomes a challenge for microresonators in a cell to be able to tap on all of the intracellular fluorophores. Fabry-Pérot cavities, on the contrary, offer a more efficient means of utilizing all of the cell’s contents since the fluorophore need only be sandwiched between a pair of mirrors. On the other hand, when pumped at NIR wavelengths, the ICNIRP guidelines do not state any thresholds for sub-nanosecond pulses for irradiation of skin tissue, instead it only suggests a conservative damage threshold of 20GWcm-2 for NIR femtosecond pulses. The guidelines do however list a damage threshold of 1MWcm-2 for exposure of the eye to 100fs NIR pulses. A study[46] on cells in culture irradiated by multiple (76MHz over 0.25s) 130fs NIR (810nm) pulses at a beam diameter of 100m reports a damage threshold of 1.9kJcm-2. By taking the very conservative assumption that damage is induced upon irradiation by the very first pulse (at 0.1mJcm-2), we estimate a threshold intensity of 1GWcm-2. From Figure 2d, we see that lasing NAD(P)H is possible at physiological conditions under two-photon pumping by NIR lasers, but the reported damage thresholds imply the cell’s inevitable demise. It is hence more feasible to lase NAD(P)H in cells under the one-photon regime than by its two-photon counterpart.
It is interesting to note that although NAD(P)H have both absorption cross sections and quantum yields at an order of magnitude smaller than flavins, they are able to support a much larger range of conditions for lasing. This is counterintuitive considering that flavins are able to absorb and emit more efficiently than NAD(P)H. From the energy level diagram in Figure 1b, we understand this to be due to intersystem crossing from the singlet (S1) to triplet (T1) state. In flavins, the intersystem crossing lifetime[31] () is of the same nanosecond timescale as its spontaneous emission lifetime[23, 25, 26] (). This implies competition between transitions from the upper laser level (N2) to either the lower laser level (N1) or the lower triplet level (N4). Furthermore, the decay rate of flavins from its triplet to singlet state is three orders slower than its rate of triplet formation, resulting in the “trapping” of excited fluorophores in a energy state not usable in lasing transitions. In comparison, NAD(P)H has virtually negligible triplet transitions[32]. From Figure 3a and c, we observe again that at physiological conditions (denoted by vertical dotted lines) lasing is not supported by flavins. From the plots, we also see that reducing to a value of 10 would render flavins capable of lasing at its physiological intracellular concentration. This can be achieved by reducing and increasing , which translates to faster decays from the triplet state and reduced intersystem crossings respectively. The use of iodide as quenchers has been reported to reduce the triplet population and increase fluorescence in flavins when used in small quantities[47]. Although iodide is known to increase the rate of intersystem crossing (results in higher triplet populations), the authors have attributed their findings to the concomitant increase in triplet decay rates, which undergo a relatively higher increment than that of intersystem crossing. Alternatively, binding of flavins with light-oxygen-voltage-sensing (LOV) proteins has also been demonstrated to reduce the rate of intersystem crossing[31], again resulting in a lower triplet population. Considering the several-order lower lasing threshold intensities required by flavins, we recommend that an approach involving the engineering of the above-mentioned lifetimes be adopted. When 1, lasing is achievable in flavins at physiological intracellular concentrations with just a of 4104 and by pump intensities under the damage threshold. Such a is still attainable under the most ideal conditions of a Fabry-Pérot cavity comprising a mirror pair.
One- vs. two-photon pumping
When we compare one- and two-photon pumping, we note two keys points for discussion. First, threshold intensity requirements are many orders of magnitude higher for the two-photon regime. This is consequent of the nature of multi-photon processes, where two or more photons have to arrive simultaneously for energy transitions to take place. Such a requirement translates into a large number of photons arriving over a short period of time in a small area, ergo high intensities (in Wcm-2). That being said, it should be highlighted that such a property is in fact an advantage of multi-photon processes, particularly in the biosciences[48]. The high intensity requirements enable spatial specificity and transparency of materials at low intensities. Although not considered in this study, this property could enable the lasing of specific cells buried within tissues provided that cavity requirements can be met intracellularly. Furthermore, the typical use of NIR wavelengths in such process also enables deeper penetration in vivo[49], indicating the possibility of in vivo laser generation. Similarly, as would be expected, lasing efficiencies are many orders of magnitude lower considering the high intensities already required to first excite the fluorophores. Secondly, we note the parameters that do not support lasing are dependent only on the fluorophore and not the regime of pumping. This is seen in the identical grey regions shaded in Figures 2 and 3. From Equations 3 and 4, lasing is not supported when the denominator of the last collection of terms becomes negative. This occurs when (refer to Methods and Table 1 for details) - i.e. when the maximal available gain is smaller than the intrinsic losses of the system. This is thus independent on the pump but still dependent on cavity properties, namely the spontaneous emission coupling factor () and lasing mode confinement (). However, should the spatial specificity of multi-photon processes be considered, the pump area effectively changes and consequently the available fluorophores within said area. It is thus particularly important to note the beam diameter when employing the two-photon regime described in this study.
Saturation of higher excited state (N3)
At high pump intensities we observe a deviation the simplified analytical solution from its numerical counterpart. We attribute this to the breakdown of the assumption that only N0, N2 and N4 are populated. When pumped at high intensities, the rate of internal conversion from N3 to N2 () becomes insufficient to significantly depopulate N3. This results in saturation of the fluorophore population in this higher excited state, which is different from the typical saturation we observe in two-level laser systems. For 10-5M NAD(P)H, the rate of excitation from N0 to N3 matches the rate of depopulation from N3 to N2 when pump intensities exceed 104Wcm-2 and 1010Wcm-2 under one- and two-photon pumping, correspondingly. From threshold intensities in Figure 2, we note that this applies to all ranges of parameters studied. Hence, non-negligible populations of fluorophores exist in N3. A semi-simplified analytical solution was hence derived by considering Ntot=N0+N2+N3+N4. We compared the simplified analytical, semi-simplified analytical and numerical solutions in Figure 4 and further quantified deviations of the analytical solutions from the numerical solution in Table 3. It should be noted that the x-axis of the input-output plot is in the log scale, which accounts for the non-linear curves. We first observe that all lasing thresholds were well within the same order of magnitude, implying no need to derive more complex solutions for threshold computations. Lasing efficiencies, on the other hand, are observed to differ significantly in Figure 4, especially for a low of 103. We also see how the semi-simplified analytical solution better matches the numerical solution, with its relative amount of deviation improving for lower values of . In that regard, we recommend the use of the semi-simplified analytical solution when studying poorly performing cavities so as to not get an over estimate of lasing efficiency.
Conclusion
In summary, we have theoretically studied the feasibility of lasing with cell-endogenous fluorophores and identified parameters that allow for lasing in cells at physiological conditions. We found that lasing is supported by NAD(P)H but not flavins at physiological intracellular concentrations. This could be achieved using cavities with 105 under the one-photon pumping regime. From further analysis of the fluorophores’s transitions, we identified the intersystem crossing in flavins to be a key reason for its inability to support lasing. Recommendations on methods of engineering and were made so as to allow lasing of flavins to be achievable at physiological intracellular concentrations. In short, lasing flavins would be preferred over NAD(P)H due to its lower threshold requirements, which implies lower risks of inducing damage to cells. We also highlight the benefits of lasing under the two-photon regime, which we recognize to hold more potential for in vivo applications than the one-photon regime. In conclusion, we summarize from this theoretical study that lasing unlabelled cells is possible, and can be further developed with novel methods of (i) integrating high quality factor optical cavities with cells; and (ii) minimizing intersystem crossings in fluorophores intracellularly.
References
- [1] Fan, X. & Yun, S.-H. The potential of optofluidic biolasers. \JournalTitleNature Methods 11, 141–147 (2014). URL http://dx.doi.org/10.1038/nmeth.2805. DOI 10.1038/nmeth.2805.
- [2] Gather, M. C. & Yun, S. H. Single-cell biological lasers. \JournalTitleNature Photonics 5, 406–410 (2011). URL http://www.nature.com/nphoton/journal/v5/n7/abs/nphoton.2011.99.html. DOI http://dx.doi.org/10.1038/nphoton.2011.99.
- [3] Humar, M. & Yun, S. H. Intracellular microlasers. \JournalTitleNature Photonics 9, 572–576 (2015). URL http://dx.doi.org/10.1038/nphoton.2015.129. DOI 10.1038/nphoton.2015.129 http://www.nature.com/nphoton/journal/v9/n9/abs/nphoton.2015.129.html.
- [4] Schubert, M. et al. Lasing within live cells containing intracellular optical microresonators for barcode-type cell tagging and tracking. \JournalTitleNano Letters (2015). URL http://dx.doi.org/10.1021/acs.nanolett.5b02491. DOI 10.1021/acs.nanolett.5b02491.
- [5] Nizamoglu, S., Gather, M. C. & Yun, S. H. All-biomaterial laser using vitamin and biopolymers. \JournalTitleAdvanced Materials 25, 5943–5947 (2013). URL http://dx.doi.org/10.1002/adma201300818. DOI 10.1002/adma201300818.
- [6] Vannahme, C., Maier-Flaig, F., Lemmer, U. & Kristensen, A. Single-mode biological distributed feedback laser. \JournalTitleLab on a Chip 13, 2675–2678 (2013). URL http://dx.doi.org/10.1039/C3LC50140J. DOI 10.1039/C3LC50140J.
- [7] Gather, M. C. & Yun, S. H. Bio-optimized energy transfer in densely packed fluorescent protein enables near-maximal luminescence and solid-state lasers. \JournalTitleNature Communications 5 (2014). URL http://dx.doi.org/10.1038/ncomms6722. DOI 10.1038/ncomms6722.
- [8] Chen, Y.-C., Chen, Q. & Fan, X. Optofluidic chlorophyll lasers. \JournalTitleLab on a Chip 16, 2228–2235 (2016). URL http://dx.doi.org/10.1039/C6LC00512H. DOI 10.1039/C6LC00512H.
- [9] Choi, S. & Kim, Y. The potential of naturally occurring lasing for biological and chemical sensors. \JournalTitleBiomedical Engineering Letters 4, 201–212 (2014). URL http://dx.doi.org/10.1007/s13534-014-0155-x. DOI 10.1007/s13534-014-0155-x.
- [10] Chen, Y.-C., Chen, Q. & Fan, X. Lasing in blood. \JournalTitleOptica 3, 809–815 (2016). URL http://www.osapublishing.org/optica/abstract.cfm?URI=optica-3-8-809. DOI 10.1364/OPTICA.3.000809.
- [11] Ghukasyan, V. V. & Heikal, A. A. (eds.) Natural Biomarkers for Cellular Metabolism: Biology, Techniques, and Applications. Series in Cellular and Clinical Imaging (CRC Press, 2014).
- [12] Heikal, A. A. Intracellular coenzymes as natural biomarkers for metabolic activities and mitochondrial anomalies. \JournalTitleBiomarkers in Medicine 4, 241–263 (2010). URL http://dx.doi.org/10.2217/bmm.10.1. DOI 10.2217/bmm.10.1.
- [13] Rodrigues, R. M., Macko, P., Palosaari, T. & Whelan, M. P. Autofluorescence microscopy: A non-destructive tool to monitor mitochondrial toxicity. \JournalTitleToxicology Letters 206, 281–288 (2011). URL http://www.sciencedirect.com/science/article/pii/S0378427411012926. DOI http://dx.doi.org/10.1016/j.toxlet.2011.06.025.
- [14] Emmelkamp, J. et al. The potential of autofluorescence for the detection of single living cells for label-free cell sorting in microfluidic systems. \JournalTitleELECTROPHORESIS 25, 3740–3745 (2004). URL http://dx.doi.org/10.1002/elps.200406070. DOI 10.1002/elps.200406070.
- [15] Miranda-Lorenzo, I. et al. Intracellular autofluorescence: a biomarker for epithelial cancer stem cells. \JournalTitleNature Methods 11, 1161–1169 (2014). URL http://dx.doi.org/10.1038/nmeth.3112. DOI 10.1038/nmeth.3112.
- [16] Chua, S.-L. et al. Modeling of threshold and dynamics behavior of organic nanostructured lasers. \JournalTitleJournal of Materials Chemistry C 2, 1463–1473 (2014). URL http://dx.doi.org/10.1039/C3TC31870B. DOI 10.1039/C3TC31870B.
- [17] Björk, G., Heitmann, H. & Yamamoto, Y. Spontaneous-emission coupling factor and mode characteristics of planar dielectric microcavity lasers. \JournalTitlePhysical Review A 47, 4451–4463 (1993). URL https://link.aps.org/doi/10.1103/PhysRevA.47.4451.
- [18] Whitby, L. G. A new method for preparing flavin-adenine dinucleotide. \JournalTitleBiochemical Journal 54, 437–442 (1953). URL http://www.biochemj.org/content/ppbiochemj/54/3/437.full.pdf. DOI 10.1042/bj0540437.
- [19] McComb, R. B., Bond, L. W., Burnett, R. W., Keech, R. C. & Bowers, G. N. Determination of the molar absorptivity of nadh. \JournalTitleClinical Chemistry 22, 141–150 (1976).
- [20] Xu, C., Zipfel, W., Shear, J. B., Williams, R. M. & Webb, W. W. Multiphoton fluorescence excitation: new spectral windows for biological nonlinear microscopy. \JournalTitleProceedings of the National Academy of Sciences of the United States of America 93, 10763–10768 (1996). URL http://www.ncbi.nlm.nih.gov/pmc/articles/PMC38229/.
- [21] Weber, G. & Teale, F. W. J. Determination of the absolute quantum yield of fluorescent solutions. \JournalTitleTransactions of the Faraday Society 53, 646–655 (1957). URL http://dx.doi.org/10.1039/TF9575300646. DOI 10.1039/TF9575300646.
- [22] Heelis, P. F. The photophysical and photochemical properties of flavins (isoalloxazines). \JournalTitleChemical Society Reviews 11, 15–39 (1982). URL http://dx.doi.org/10.1039/CS9821100015. DOI 10.1039/CS9821100015.
- [23] Holzer, W., Penzkofer, A., Fuhrmann, M. & Hegemann, P. Spectroscopic characterization of flavin mononucleotide bound to the lov1 domain of phot1 from chlamydomonas reinhardtii¶. \JournalTitlePhotochemistry and Photobiology 75, 479–487 (2002). URL http://dx.doi.org/10.1562/0031-8655(2002)0750479SCOFMB2.0.CO2. DOI 10.1562/0031-8655(2002)0750479SCOFMB2.0.CO2.
- [24] Scott, T. G., Spencer, R. D., Leonard, N. J. & Weber, G. Synthetic spectroscopic models related to coenzymes and base pairs. v. emission properties of nadh. studies of fluorescence lifetimes and quantum efficiencies of nadh, acpyadh, [reduced acetylpyridineadenine dinucleotide] and simplified synthetic models. \JournalTitleJournal of the American Chemical Society 92, 687–695 (1970). URL http://dx.doi.org/10.1021/ja00706a043. DOI 10.1021/ja00706a043.
- [25] Lasser, N. & Feitelson, J. Excited-state reactions of oxidized flavin derivatives. \JournalTitlePhotochemistry and Photobiology 21, 249–254 (1975). URL http://dx.doi.org/10.1111/j.1751-1097.1975.tb06664.x. DOI 10.1111/j.1751-1097.1975.tb06664.x.
- [26] Visser, A. J. W. G. & Müller, F. [52] Time-resolved fluorescence on flavins and flavoproteins, vol. Volume 66, 373–385 (Academic Press, 1980). URL //www.sciencedirect.com/science/article/pii/0076687980664829.
- [27] Lakowicz, J. R., Szmacinski, H., Nowaczyk, K. & Johnson, M. L. Fluorescence lifetime imaging of free and protein-bound nadh. \JournalTitleProceedings of the National Academy of Sciences of the United States of America 89, 1271–1275 (1992). URL http://www.ncbi.nlm.nih.gov/pmc/articles/PMC48431/.
- [28] Skala, M. C. et al. In vivo multiphoton fluorescence lifetime imaging of protein-bound and free nadh in normal and pre-cancerous epithelia. \JournalTitleJournal of biomedical optics 12, 024014–024014 (2007). URL http://www.ncbi.nlm.nih.gov/pmc/articles/PMC2743958/. DOI 10.1117/1.2717503.
- [29] Wang, H.-W. et al. Differentiation of apoptosis from necrosis by dynamic changes of reduced nicotinamide adenine dinucleotide fluorescence lifetime in live cells. \JournalTitleJournal of Biomedical Optics 13, 054011–054011–9 (2008). URL http://dx.doi.org/10.1117/1.2975831. DOI 10.1117/1.2975831.
- [30] Yu, Q. & Heikal, A. A. Two-photon autofluorescence dynamics imaging reveals sensitivity of intracellular nadh concentration and conformation to cell physiology at the single-cell level. \JournalTitleJournal of Photochemistry and Photobiology B: Biology 95, 46–57 (2009). URL http://www.sciencedirect.com/science/article/pii/S1011134408002625. DOI http://dx.doi.org/10.1016/j.jphotobiol.2008.12.010.
- [31] Islam, S. D. M., Penzkofer, A. & Hegemann, P. Quantum yield of triplet formation of riboflavin in aqueous solution and of flavin mononucleotide bound to the lov1 domain of phot1 from chlamydomonas reinhardtii. \JournalTitleChemical Physics 291, 97–114 (2003). URL http://www.sciencedirect.com/science/article/pii/S0301010403001873. DOI http://dx.doi.org/10.1016/S0301-0104(03)00187-3.
- [32] Lindqvist, L., Czochralska, B. & Grigorov, I. Determination of the mechanism of photo-ionization of nadh in aqueous solution on laser excitation at 355 nm. \JournalTitleChemical Physics Letters 119, 494–498 (1985). URL http://www.sciencedirect.com/science/article/pii/0009261485853756. DOI http://dx.doi.org/10.1016/0009-2614(85)85375-6.
- [33] Kottke, T., Heberle, J., Hehn, D., Dick, B. & Hegemann, P. Phot-lov1: Photocycle of a blue-light receptor domain from the green alga Chlamydomonas reinhardtii. \JournalTitleBiophysical Journal 84, 1192–1201 (2003). URL http://dx.doi.org/10.1016/S0006-3495(03)74933-9. DOI 10.1016/S0006-3495(03)74933-9.
- [34] Ross, J. B. A., Rousslang, K. W., Motten, A. G. & Kwiram, A. L. Base interactions in the triplet states of nad+ and nadh. \JournalTitleBiochemistry 18, 1808–1813 (1979). URL http://dx.doi.org/10.1021/bi00576a027. DOI 10.1021/bi00576a027.
- [35] Hühner, J., Ingles-Prieto, Á., Neusüß, C., Lämmerhofer, M. & Janovjak, H. Quantification of riboflavin, flavin mononucleotide, and flavin adenine dinucleotide in mammalian model cells by ce with led-induced fluorescence detection. \JournalTitleELECTROPHORESIS 36, 518–525 (2015). URL http://dx.doi.org/10.1002/elps.201400451. DOI 10.1002/elps.201400451.
- [36] Grajek, H., Żurkowska, G. & Kuśba, J. Influence of diffusion on nonradiative energy transfer between fmn molecules in aqueous solutions. \JournalTitleJournal of Photochemistry and Photobiology B: Biology 80, 145–155 (2005). URL http://www.sciencedirect.com/science/article/pii/S1011134405000813. DOI http://dx.doi.org/10.1016/j.jphotobiol.2005.04.002.
- [37] Wos, M. & Pollard, P. Sensitive and meaningful measures of bacterial metabolic activity using nadh fluorescence. \JournalTitleWater Research 40, 2084–2092 (2006). URL http://www.sciencedirect.com/science/article/pii/S0043135406001916. DOI https://doi.org/10.1016/j.watres.2006.03.020.
- [38] Grajek, H., Drabent, R., Żurkowska, G. & Bojarski, C. Absorption of the flavin dimers. \JournalTitleBiochimica et Biophysica Acta (BBA) - General Subjects 801, 456–460 (1984). URL http://www.sciencedirect.com/science/article/pii/0304416584901521. DOI http://dx.doi.org/10.1016/0304-4165(84)90152-1.
- [39] Burnett, J. N. & Underwood, A. L. Electrochemical reduction of diphosphopyridine nucleotide*. \JournalTitleBiochemistry 4, 2060–2064 (1965). URL http://dx.doi.org/10.1021/bi00886a021. DOI 10.1021/bi00886a021.
- [40] Burnett, R. W. & Underwood, A. L. A dimer of diphosphopyridine nucleotide. \JournalTitleBiochemistry 7, 3328–3333 (1968). URL http://dx.doi.org/10.1021/bi00850a003. DOI 10.1021/bi00850a003.
- [41] Lu, Y. & Penzkofer, A. Absorption behaviour of methanolic rhodamine 6g solutions at high concentration. \JournalTitleChemical Physics 107, 175–184 (1986). URL http://www.sciencedirect.com/science/article/pii/0301010486850029. DOI http://dx.doi.org/10.1016/0301-0104(86)85002-9.
- [42] Penzkofer, A. & Leupacher, W. Fluorescence behaviour of highly concentrated rhodamine 6g solutions. \JournalTitleJournal of Luminescence 37, 61–72 (1987). URL http://www.sciencedirect.com/science/article/pii/0022231387901670. DOI http://dx.doi.org/10.1016/0022-2313(87)90167-0.
- [43] Ziegelberger, G. ICNIRP guidelines on limits of exposure to laser radiation of wavelengths between 180 nm and 1,000 m. \JournalTitleHealth Physics 105, 271–295 (2013). URL http://journals.lww.com/health-physics/Fulltext/2013/09000/ICNIRP_Guidelines_on_Limits_of_Exposure_to_Laser.6.aspx. DOI 10.1097/HP.0b013e3182983fd4.
- [44] He, L., ’́ Ozdemir, Ş. K. & Yang, L. Whispering gallery microcavity lasers. \JournalTitleLaser & Photonics Reviews 7, 60–82 (2013). URL http://dx.doi.org/10.1002/lpor.201100032. DOI 10.1002/lpor.201100032.
- [45] Ding, F., Stöferle, T., Mai, L., Knoll, A. & Mahrt, R. F. Vertical microcavities with high and strong lateral mode confinement. \JournalTitlePhys. Rev. B 87, 161116 (2013). URL https://link.aps.org/doi/10.1103/PhysRevB.87.161116. DOI 10.1103/PhysRevB.87.161116.
- [46] Denton, M. L. et al. Damage thresholds for exposure to nir and blue lasers in an in vitro rpe cell system. \JournalTitleInvestigative Ophthalmology & Visual Science 47, 3065–3073 (2006). URL http://dx.doi.org/10.1167/iovs.05-1066. DOI 10.1167/iovs.05-1066.
- [47] van den Berg, P. A., Widengren, J., Hink, M. A., Rigler, R. & Visser, A. J. Fluorescence correlation spectroscopy of flavins and flavoenzymes: photochemical and photophysical aspects. \JournalTitleSpectrochimica Acta Part A: Molecular and Biomolecular Spectroscopy 57, 2135 – 2144 (2001). URL http://www.sciencedirect.com/science/article/pii/S1386142501004942. DOI http://dx.doi.org/10.1016/S1386-1425(01)00494-2.
- [48] Zipfel, W. R., Williams, R. M. & Webb, W. W. Nonlinear magic: multiphoton microscopy in the biosciences. \JournalTitleNature Biotechnology 21, 1369–1377 (2003). URL http://dx.doi.org/10.1038/nbt899.
- [49] Weissleder, R. A clearer vision for in vivo imaging. \JournalTitleNature Biotechnology 19, 316–317 (2001). URL http://dx.doi.org/10.1038/86684.
Acknowledgements
This work was supported by the Agency for Science Technology and Research (A∗STAR), Singapore.
Author contributions statement
D.Y. conceived the idea, D.Y. formulated the algorithms and conducted the computations, D.Y. and D.D. studied and refined the model, D.Y. and D.D. analysed and articulated the results. All authors reviewed the manuscript.
Additional information
Competing financial interests The authors declare no competing financial interests.