The 1600 Å Emission Bump in Protoplanetary Disks:
A Spectral Signature of H2O Dissociation**affiliation: Based on observations made with the NASA/ESA , obtained from the data archive at the Space Telescope Science Institute. STScI is operated by the Association of Universities for Research in Astronomy, Inc. under NASA contract NAS 5-26555.
Abstract
The FUV continuum spectrum of many accreting pre-main sequence stars, Classical T Tauri Stars (CTTSs), does not continue smoothly from the well-studied Balmer continuum emission in the NUV, suggesting that additional processes contribute to the short-wavelength emission in these objects. The most notable spectral feature in the FUV continuum of some CTTSs is a broad emission approximately centered at 1600 Å, which has been referred to as the “1600 Å Bump”. The origin of this feature remains unclear. In an effort to better understand the molecular properties of planet-forming disks and the UV spectral properties of accreting protostars, we have assembled archival FUV spectra of 37 disk-hosting systems observed by the Hubble Space Telescope-Cosmic Origins Spectrograph. Clear 1600 Å Bump emission is observed above the smooth, underlying 1100 – 1800 Å continuum spectrum in 19/37 Classical T Tauri disks in the -COS sample, with the detection rate in transition disks (8/8) being much higher than in primordial or non-transition sources (11/29). We describe a spectral deconvolution analysis to separate the Bump (spanning 1490 – 1690 Å) from the underlying FUV continuum, finding an average Bump luminosity, (Bump) 7 1029 erg s-1. Parameterizing the Bump with a combination of Gaussian and polynomial components, we find that the 1600 Å Bump is characterized by a peak wavelength = 1598.6 3.3 Å, with FWHM = 35.8 19.1 Å.
Contrary to previous studies, we find that this feature is inconsistent with models of H2 excited by electron-impact. We show that this Bump makes up between 5 – 50% of the total FUV continuum emission in the 1490 – 1690 Å band and emits roughly 10 – 80% of the total fluorescent H2 luminosity for stars with well-defined Bump features. Energetically, this suggests that the carrier of the 1600 Å Bump emission is powered by Ly photons. We argue that the most likely mechanism is Ly-driven dissociation of H2O in the inner disk, 2 AU. We demonstrate that non-thermally populated H2O fragments can qualitatively account for the observed emission (discrete and continuum), and find that the average Ly-driven H2O dissociation rate is 1.7 1042 water molecules s-1.
Subject headings:
protoplanetary disks — stars: pre-main sequence — ultraviolet: planetary systems1. Introduction
Measurements of the composition and physical state of protoplanetary gas disks form the basis for estimating the initial conditions of planet formation. Molecular gas emission and absorption originating inside of 10 AU provide our best means of estimating the conditions at the radii where gas giant and rocky planet cores are forming and accreting their nascent atmospheres. Over the past decade, surveys of molecular emission from the inner few AU have provided new constraints on the radial distribution, temperature, and composition of planet-forming disks. Surveys of mid-IR emission from CO (Salyk et al., 2008, 2009; Brown et al., 2013; Banzatti & Pontoppidan, 2015), H2O and organic molecules (Pontoppidan et al., 2010; Carr & Najita, 2011; Salyk et al., 2011a), UV emission and absorption of H2 and CO (Herczeg et al., 2004; France et al., 2011a; Schindhelm et al., 2012a; France et al., 2014a), and spectrally/spatially-resolved near-IR observations (Pontoppidan et al., 2011; Carmona et al., 2011; Brittain et al., 2015) have placed constraints on the relative abundance ratios of H2, CO, and H2O, the evolution of the inner gas disk radius, and the excitation conditions of the molecular gas.
An important caveat when considering molecular spectra of inner disks is that none of these tracers probe the disk midplane where planet-formation is active. Similarly, very few of these surveys provide spatially-resolved maps of this region (although see, e.g., Eisner et al. 2008) and ALMA is not sensitive to warm gas emission inside of 10 AU for disks at typical star-forming region distances of 100 pc (ALMA Partnership et al., 2015; Andrews et al., 2016). The inner disk tracers noted in the preceding paragraph all probe various heights in the inner disk atmosphere, mostly at vertical columns of 100 – 1000 lower than the optically thick and observationally inaccessible midplane. Given these challenges, our best opportunity to converge on a three-dimensional view of the planet-forming regions around young stars is to assemble panchromatic tracers of the relevant disk molecules (Sicilia-Aguilar et al., 2016). Taken as an ensemble, the weaknesses of individual tracers can be mitigated and we can develop a suite of diagnostics that support a more complete picture of this phase of planet-formation.
James Webb Space Telescope observations of water and other organic molecules are a highly anticipated contribution to this goal (e.g., Banzatti et al. 2017) and there is work to be done placing panchromatic disk observations into a unified modeling framework (Haworth et al., 2016). In an effort to expand the observational database of UV molecular tracers, we present a new analysis of archival Hubble Space Telescope UV spectra of protoplanetary disks around M∗ 2M⊙ central stars (Classical T Tauri Stars; CTTSs) to propose a new origin for the broad, quasi-continuous, spectral feature near 1600 Å (which we refer to as the “1600 Å Bump”, or simply the Bump hereafter). This work represents the largest survey of high-resolution UV CTTS spectra obtained to date, and presents new measurements of key UV diagnostics (H2, Ly, C IV, FUV continuum) in addition to the new analysis and model-based interpretation of the 1600 Å Bump feature.
The FUV continuum in CTTSs has been shown to be in excess of what is predicted by scaling the Balmer continuum to shorter wavelengths (Herczeg et al., 2004; France et al., 2014b) and several authors have noted the presence of the broad, likely molecular, quasi-continuum emission observed between 1450 1650 Å in many CTTSs. This emission was first noted by Herczeg et al. (2004) and Bergin et al. (2004) in -STIS observations of bright CTTSs. They argued that it originated from X-ray generated photo-electron impact on H2, though it was noted that TW Hya did not show the characteristic discrete emission lines from the electron-impact process that are observed in Herbig-Haro objects (Raymond et al., 1997) and the aurorae of gas giant planets (Liu & Dalgarno, 1996; Gustin et al., 2004; France et al., 2010b). Under the assumption that this feature was attributable to collisionally excited H2, Ingleby et al. (2009) analyzed 33 low-resolution CTTS spectra to constrain the molecular surface density of the surrounding circumstellar material.
In previous work (France et al., 2011b), we have shown that while a combination of accretion continuum and electron-impact H2 emission can reproduce some features of the spectra, there are significant discrepancies between the predicted and observed spectral features from this process. Most notably, the dearth of bound-bound transitions (discrete emission lines) from this process and an observed shift in the peak wavelength of the observed H2 collisional dissociation peak make it hard to assign the entire Bump spectrum to electron-impact excited H2. Deep, spectrally resolved observations have shown that CO fluorescence (excited by Ly and C IV photons) can account for some of these discrepancies (France et al., 2011a), and in this work we propose a new mechanism to account for the excess emission in the quasi-continuous 1600 Å Bump feature: emission from highly non-thermal H2 molecules that are the fragments of water photodissociation by Ly photons.
This paper is laid out as follows – Section 2 presents a brief overview of the data sets used in this work. In Section 3, we describe the new analysis of the UV spectra, including consideration of updated dust reddening parameters, new measurements of the 1600 Å Bump and fluorescent H2 emission, and extension of previous relations to estimate the intrinsic Ly emission from these sources. Section 3 concludes with an empirical characterization of the Bump properties and Section 4 places these properties into context with other parameters of the star + disk systems. In Section 5, we make several arguments against an electron-impact excited H2 origin for the Bump and present new calculations of Ly excitation on the dissociation products of H2O, demonstrating that this interpretation provides a consistent fit to both the quasi-continuous and discrete emissions present in UV spectral observations of protoplanetary disks. Section 5 also places the Bump in context of mid-IR water emission features observed by and Section 6 summarizes this work.
2. Ultraviolet Spectroscopy
We use the medium spectral resolution G160M mode of -COS (Green et al., 2012) to measure the FUV continuum and separate broad spectral features from narrow emission lines for a sample of 37 disk-hosting stars. Most have these observations have been analyzed as part of previous disk (France et al., 2012b) or accretion diagnostic (Ardila et al., 2013) studies. We refer the reader to these works for an overview of the observations. We have augmented the COS Guaranteed Time (PIDs 11533 and 12036; PI - J. Green) and DAO samples (PID 11616; PI - G. Herczeg) with observations of DQ Tau and UZ Tau E (PID 12161; PI - D. Ardila), young stars in the Orion star-forming region (PID 13363; PI - N. Calvet), the binary PMS star AK Sco (PID 13372; PI - A. Gomez de Castro; Gomez de Castro et al. 2016), the young brown dwarfs 2M1207 and SCH0439 (PIDs 11531 and 11616; PI - J. Green and G. Herczeg), and follow-up observations of AA Tau, RECX-15, and RW Aur (PID 12876; PI - K. France). Finally, we have included two observations of TW Hya, the well-studied -STIS spectrum (Herczeg et al., 2002, 2004) and archival observations from -COS (PID 12315; PI - H. M. Guenther). This brings the sample to a total of 41 unique, high-resolution FUV observations capable of isolating and characterizing the 1600 Å spectral feature.
While the majority of the observations used in this study have broader FUV wavelength coverage, we only present new analyses of the G160M data (and STIS E140M for TW Hya). The COS G160M mode spans the wavelength range 1390 – 1780 Å for most stars, and the medium resolution mode provides point-source resolution of 17 km s-1 with 7 pixels per resolution element (Osterman et al., 2011). The STIS observations were acquired using the E140M echelle mode ( 8 km s-1) through the 0.2″ 0.2″ aperture. The relatively high spectral resolution and signal-to-noise ratio of these data are critical for being able to separate the forest of H2, CO, and atomic emission and absorption lines (Herczeg et al., 2002, 2005; France et al., 2011a) from the quasi-continuous Bump feature. Table 1 lists relevant system parameters and assumed distances for the objects studied in this paper.
3. Analysis
3.1. Spectral Measurements from the FUV Disk Sample
There are five key spectral features that we extract from this FUV spectral disk survey to study the origin of the 1600 Å Bump feature: The Bump, the underlying FUV continuum spectrum, the fluorescent H2 luminosity, the Ly luminosity, and the C IV luminosity. We use all of these observations to constrain the chemical and spatial origin of the Bump emission.
3.1.1 FUV Continuum and 1600 Å Bump
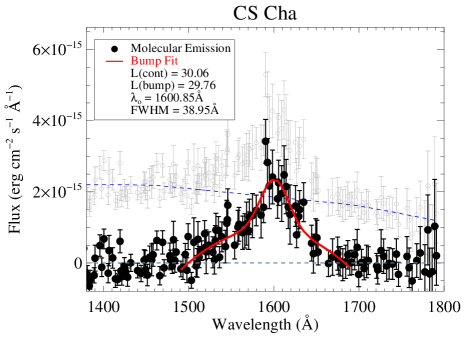
We have created new FUV continuum spectra for the 41 observations (37 targets) analyzed in this work, following the continuum extraction methodology described in (France et al., 2014b). We create a grid of 131 unique spectral points between 1381 and 1781 Å, selected by hand to avoid discrete molecular and atomic emission and absorption features, where 0.75 Å (approximately 10 spectral resolution elements) spectral continuum windows can be cleanly measured. We measure the mean and standard deviation of the observed spectra, and these points define the binned flux spectrum and error array (see Figure 1). These binned spectra are then corrected for interstellar reddening (see Section 3.2) and the FUV continuum and 1600 Å Bump are separated as described below.
We measure the FUV continuum emission by fitting the binned spectrum with a second order polynomial at wavelengths away from the Bump, in the regions = 1395 – 1401 Å, 1420 – 1465 Å, 1690 – 1710 Å, and 1730 – 1760 Å. Some spectra did not have this standard COS G160M wavelength coverage (e.g., the Orion stars and the STIS observations of TW Hya), had broad hot gas lines that had to be avoided in the continuum spectra (e.g., RW Aur), or were of early spectral type such that the photospheric contribution contaminated the long-wavelength FUV continuum fit (e.g., HD 134344B). In these cases, small adjustments were made to the exact wavelength bounds, but visual inspection indicated that this did not have a significant impact on the Bump extraction region. The FUV continuum flux, , is the integral of the polynomial over the 1490 – 1690 Å wavelength region for direct comparison with the integrated 1600 Å Bump fluxes. The FUV continuum luminosity is defined as (FUV Cont) = 4.
The most prominent feature in the binned spectra of some CTTSs is the 1600 Å Bump, a spectral feature that spans 30 – 150 Å and has a peak flux 0 – 4 times the smooth underlying continuum level at 1600 Å. We define the 1600 Å Bump as the excess emission above the FUV continuum in the 1490 – 1690 Å spectral region, where the Bump spectrum is the binned data minus the FUV continuum fit. An example of the well-defined Bump spectrum of CS Cha is shown in Figure 1. We found that a Gaussian line profile and a second-order polynomial were a good representation of the Bump spectrum in objects with well-defined Bumps, and we fitted this function to all of the observations in our sample (see the Appendix for plots of all 41 observations). For broad Bumps however, these two components can be degenerate. We define the total Bump flux, , as the integral of the continuum-subtracted Bump spectrum from 1490 to 1690 Å, and (Bump) = 4. We use the parameters of the Central Gaussian (CG) to quantify the full-width at half-maximum (FWHM) and central wavelength ((CG)) of the feature. Given the asymmetric shape of the Bump spectrum, these values do not describe the FWHM and line center of the feature as a whole, but allow us to define the brightest peak of the emission seen in most of the Bump-detected sources and enable us to discriminate between different origins for this emission based on the peak of the continuum emission spectrum.
This procedure captures the majority of the clear Bump sources, however this automated Bump-fitting routine is not perfect. There are examples of stars without clear Bump emission that returned good fits (e.g., CSVO109, DK Tau, DR Tau, and TW Hya-STIS), and stars that demonstrate Bumps that are missed by this procedure (e.g., DN Tau, DQ Tau, and LkCa15). In the Appendix, we display the Bump region spectra for all of the sources studied here, and Gaussian fits are included for stars with FWHM 0 and good visual fits to the data. For the plots in Figures 4, 5, 7, and 8, we plot the 24 spectra with visually-defined Bumps (stars with FWHM 0, except CSVO109, DK Tau, DR Tau, and TW Hya-STIS, plus DN Tau, DQ Tau, and LkCa15) as solid black diamonds and non-detections (stars with FWHM 0, plus CSVO109, DK Tau, DR Tau, and TW Hya-STIS) as blue upper limit symbols. Stars with visually well-defined Bumps are noted in Table 2.
3.1.2 H2, Ly, and C IV
In order to explore excitation mechanisms for the Bump emission, in particular photoexcitation/photodissociation versus excitation/dissociation by non-thermal electrons, we need to quantify the H I Ly flux as this is the dominant UV emission component in accreting protostars. Ly contributes, on average, 10 times the intrinsic flux as the second largest contributor to the FUV luminosity, the continuum emission (France et al., 2014b). However, direct measurements of the intrinsic Ly luminosity are impossible owing to resonant scattering by circumstellar and interstellar hydrogen atoms (Herczeg et al., 2004; Lamzin, 2006; McJunkin et al., 2014). The best indirect method for measuring the Ly emission line profile and the total Ly power is a fluorescent H2-based profile reconstruction. The flux distribution of the numerous H2 progressions pumped by stellar/accretion-generated Ly photons can provide constraints on the H2 rovibrational temperature, the H2 column density, and the neutral hydrogen outflow from the protostar. These parameters can be solved simultaneously with a parameterized Ly profile to calculate the intrinsic Ly flux from the accreting protostar (Herczeg et al., 2004; Schindhelm et al., 2012b).
The Ly reconstruction technique relies on constraints from the observed high-velocity wings of the line, but not all of the stars in our sample have the requisite FUV spectral coverage to carry out the full reconstruction. Instead, we extrapolate the H2-to-Ly flux relationship developed by Schindhelm et al. (2012b) to predict the Ly flux from stars in our sample without reconstructed Ly profiles in the literature. We measure intrinsic Ly fluxes for all of the targets with reconstructed profiles and create new measurements of the H2 fluorescence luminosity111We estimate that the brightest 12 H2 progressions contribute 80% of the total fluorescent H2 emission from CTTSs. following the prescription described in France et al. (2012b). We measure 3 to 4 individual emission lines from the 12 brightest H2 progressions that are pumped out of transitions spanning the Ly emission profile (1213.3 – 1219.1 Å).
H2 thermally excited to several thousand degree K dominate the discrete H2 fluorescence spectra of CTTSs (Herczeg et al., 2004; McJunkin et al., 2016) and present significant populations in a range of rovibrational levels, up to roughly 4, meaning that self-absorption can impact individual H2 emission lines at shorter wavelengths (Herczeg et al., 2004; McJunkin et al., 2016). The self-absorption concern, in concert with the fact that the strongest H2 emission lines from most progressions arise at 1340 Å, limits us to the measurement of lines ending in vibrational levels 5. The total flux in each progression , (H2), is defined as the emission line flux divided by its branching ratio, and the uncertainty on the total progression flux is the taken as the standard deviation of all of the measured progression fluxes. The total H2 flux, (H2), is the sum over all progressions, and the H2 luminosity is then (H2) = 4(H2). We refer the reader to Section 3.1 of France et al. (2012b) for a complete description of the H2 emission lines studied here.
Given the wide range of C IV doublet ( = 1548.20, 1550.77 Å) line morphologies (Ardila et al., 2013), we do not attempt to parameterize these lines and simply integrate the reddening-corrected spectra over a wavelength range 1547.6 – 1553.0 Å and subtract the flux from a nearby continuum region to measure the C IV fluxes presented in Table 2. Some uncertainty is introduced by contamination from the H2 – (1 – 8)(3) 1547.34 Å and – (3 – 7)(17) 1551.76 Å lines (see, e.g., Figure 9 of France et al. 2014), but these lines typically make up less than 10% of the total C IV flux, so we ignore this effect.
3.2. Optical Reddening Values and the Extinction Correction
The reddening correction is an important component to the luminosity calculations presented here. This is particularly true because we are working in the FUV bandpass, where dust attenuation curves have significantly larger impact than at optical and infrared wavelengths. For instance, at optical extinction values approaching AV = 2, the FUV reddening correction can be as high as 20 – 30, depending on the assumed dust grain distribution of the intervening interstellar and circumstellar media. Traditionally, extinction estimates for PMS stars are derived by measuring optical or infrared color excesses, in photometric or spectrophotometric data, relative to stellar photospheric templates or stellar photosphere templates coupled with additional accretion continuum (“veiling”; e.g., Hartigan & Kenyon 2003; Herczeg & Hillenbrand 2014). Temporal variability in optical and near-IR observations of CTTSs (Herbst et al., 1994; Cody et al., 2013; Venuti et al., 2015) can happen on timescales of hours and can be accompanied by changes in the spectral slope, complicating simultaneous stellar model and extinction fitting for non-simultaneous observations.
An alternative method for calculating the color excess in CTTSs has been proposed by McJunkin et al. (2014) – combining measurements of the atomic hydrogen along the sightline to the central star with column density-to-color excess relationships derived for the diffuse and translucent ISM (Bohlin et al., 1978; Diplas & Savage, 1994). This technique uses the central star as the background source and measures the N(H I) from the heavily damped Ly absorption line profile observed against the red side of the broad Ly emission line (see also Lamzin 2006). Since the absorbing material is fixed in velocity222Variable outflows from the star may enhance the H I absorption on the blue side of the Ly profile, but the outflows are likely not associated with significant dust columns and are 1 – 2 orders of magnitude smaller column densities than the stationary ISM component, this method is insensitive to changes in the accretion rate (i.e., the background Ly spectrum) and veiling does not contribute at these wavelengths. Comparing the N(H I)-based AV with optical/IR-derived values from the literature, McJunkin et al. (2014) found AV values on average 0.6 magnitudes lower, corresponding to factors of 1.5-to-10 lower extinction corrections, again depending on the adopted interstellar grain distribution. Two significant uncertainties with this approach are that 1) the grain distribution (and thus the UV opacity), approximated by the ratio of total to selective extinction (), may be significantly different in star-forming regions than in the average diffuse ISM (Calvet et al., 2004), and 2) the gas-to-dust ratio may be different than the interstellar value.
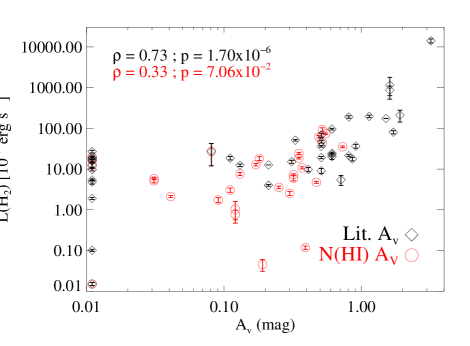
Because we are investigating potential causal correlations for the Bump flux, we compared these two reddening estimation methods to evaluate potential biases. A comparison of the correlation between fluorescent H2 luminosity ((H2)) and AV is shown in Figure 2. The two primary drivers for the H2 luminosity are the amount of hot H2 in the circumstellar disk surface and/or the Ly flux incident on the disk, and neither of these should be related to the amount of dust along the line-of-sight. Therefore, the reddening and the H2 luminosity should be uncorrelated. Figure 2 shows however that there is a strong correlation between (H2) and AV for the literature reddening values (open black diamonds), indicating that the extinction correction and not the intrinsic H2 flux level will likely drive luminosity-luminosity relationships. The Spearman correlation coefficient is =+0.73 with a very low probability of these variables being uncorrelated (p = 1.70 10-6). A similar comparison using N(H I)-based AV shows a very weak correlation [ =+0.33, p = 7.06 10-2]. In order to obtain unbiased flux measurements for the star and disk emission components studied here, we adopt the McJunkin et al. (2014) N(H I)-based AV values, assuming the standard ISM value of 3.1, for all stars with N(H I) measurements. The C IV, 1600 Å Bump, and FUV continuum measurements were made with the N(H I)-based AV values. The Ly reconstructions were derived using literature reddening values (Schindhelm et al., 2012b; France et al., 2012b), and these literature H2 and Ly fluxes were scaled by the ratio of the literature and N(H I)-based extinction curves, evaluated at 1500 Å and 1216 Å, respectively. We note that the two accreting brown dwarfs do not show significant Ly emission, and that DQ Tau, UZ Tau, and the Orion stars do not have Ly observations available; we adopt the literature value for those sources.

3.3. The 1600 Å Bump Properties
We find that 19/37 sources in this study display an unambiguously detected 1600 Å Bump in their FUV spectra. The criteria for an unambiguous detection include fits to the two-component Bump fit: (Bump) 0, FWHM 8 Å, and 1580 (CG) 1620 Å, and clear Bump upon visual inspection. Given the size of the sample, we propose that this trend would hold for larger samples so that we can conclude that 50% of all CTTSs show Bump emission. The systems that display clear bumps span a range of stellar masses, from M2 (RECX-15) to G1 (SU Aur), a range of inner disk dust content from primordial disks (BP Tau, HN Tau) to prototypical transition disks (DM Tau, GM Aur), and a range of mass accretion rates ( 10-8 M⊙ yr-1, BP Tau to 10-9 M⊙ yr-1, RECX-11). The list of clear Bump sources is AA Tau, BP Tau, CS Cha, CSVO090, DE Tau, DF Tau, DM Tau, GM Aur, HN Tau, RECX-11, RECX-15, RY Lup, SU Aur, SZ 102, TW Hya (COS), UX Tau, UZ Tau, V4046 Sgr, and V836 Tau. In addition to the list of confident Bump detections, three sources appear to display Bumps, but did not meet the parameterized requirement for a well-defined Bump – DN Tau, DQ Tau, and LkCa15 (see Section 3.1.2).
The average parameterized Bump properties are (CG) = 1598.6 3.3 Å, with FWHM = 35.8 19.1 Å. The average Bump Luminosity in the sample is log10(Bump) = 29.83, or 1.8 10-4 . For comparison with a strong accretion tracer, the 1600 Å Bump has a similar emitted power to the C IV doublet, (Bump)/(C IV) = 1.25 for the 24 observations with visually well-defined Bumps. Figure 3 shows that the central wavelength of the Bump is relatively invariant to the total Bump flux, suggesting that the composition and/or rovibrational population of the Bump carrier does not change dramatically in different star + disk environments. It also shows that the Bump is never centered near the 1575 Å dissociation peak associated with electron-impact H2, as will be discussed in the context of H2 models below. We present the integrated 1600 Å Bump luminosities and Gaussian parameters in Table 2, and present a discussion about the spectral characteristics of the Bump in Sections 4 and 5.
4. Discussion: The 1600 Å Bump in the Star + Disk System
In these subsections, we look at the relationship between the measured Bump parameters with the properties of the star and disk systems. In Section 4.1, we compare the Bump luminosity with the mass of the central star, the X-ray luminosity, and the mass-accretion rate. Section 4.2 presents a comparison of the 1600 Å Bump with tracers of the gas and dust distributions in the inner disks of CTTSs.
4.1. Correlations with Stellar Parameters and Radiation Field
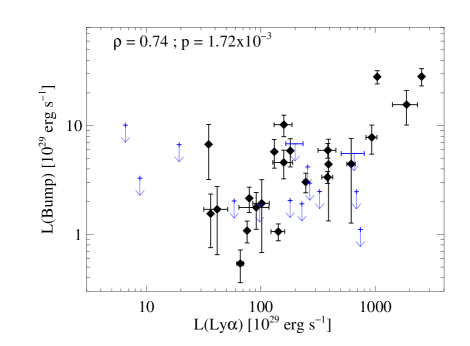
Figure 4 shows the correlation between the Bump luminosity and the accretion-dominated Ly luminosity generated near the stellar surface. There is a strong correlation [ =+0.74, p = 1.72 10-3], suggesting that Ly photoexcitation may play a role in the production of the Bump emission and/or the carrier of the Bump. The average fractional Bump luminosity is (Bump)/(Ly) = 0.013, however this Ly luminosity is the intrinsic Ly that does not account for absorption by neutral outflows. When considering that outflows block 30 – 60% of the Ly from reaching the disk surface, the Bump likely emits 2 – 4% of the Ly luminosity. The magnitude of the Bump/Ly ratio, combined with the correlation with the Ly luminosity, is a strong clue to the origin of the Bump emission. If photoexcitation is responsible for producing the Bump, there are very few other emission sources in the system that can produce a few percent of the total FUV output333Ly emission makes up, on average, 88% of the total stellar FUV output from CTTSs (France et al., 2014b).. The next brightest UV photon source, the FUV continuum, makes up about 8% of the total stellar FUV output, however, at the observed flux levels, the FUV continuum-to-Bump would have to have an energy conversion efficiency of 10 – 20% of the total panchromatic energy into the Bump, which seems unrealistic. This large FUV continuum-to-Bump conversion is particularly unlikely because most of that energy would have to come from the shorter-wavelength continuum ( 1500 Å; the Bump has a specific intensity higher than the FUV continuum in many sources), and the FUV continuum decreases to the blue in most CTTS sources. In short, it appears that the underlying FUV continuum has neither the spectral distribution nor the total power available to explain the 1600 Å Bump.
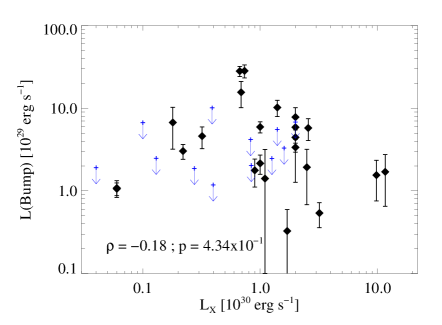
Figure 5 compares the Bump luminosity with both the stellar mass () and the X-ray luminosity () of the star. There is no clear correlation with either of these stellar quantities. The Spearman correlation coefficient and null-correlation probability with the stellar mass are [ =-0.04, p = 6.93 10-1] for the 24 spectra with visually-defined Bumps (Section 3.1.1). Separate Bump populations in higher- and lower-mass CTTSs may be expected if the carrier of the Bump is destroyed by the elevated NUV and red-FUV ( 1700 Å) flux from the hotter stars. However, no statistically significant difference is seen in our sample. Figure 5 shows an arbitrarily defined division at 1.1 M⊙, with a 52% (15/29 sources) detection rate for M∗ 1.1 M⊙ and a 50% (4/8 sources) detection rate with M∗ 1.1 M⊙. A complementary sample of Herbig Ae stars would be useful to fill in the higher-mass portion of this diagram, but in practice the detectability of the Bump will likely be decreased due to contrast with the brighter photospheres of those hotter stars. Similarly, there is no correlation between the X-ray luminosity and the 1600 Å Bump luminosity [ =-0.18, p = 4.34 10-1 for the 24 spectra with visually-defined Bumps (Section 3.1.1)] as shown in Figure 5, . Most Bump detections display (Bump)/ of order unity. (Bump)/ for 20/24 detections are in the range 0.2 – 4 (note that 7 spectra show (Bump) ). Of the sample of clearly detected Bump spectra, 4/24 detections (V836 Tau, RECX-11, RY Lup, and SU Aur) have low (Bump)/, 0.01 – 0.02.
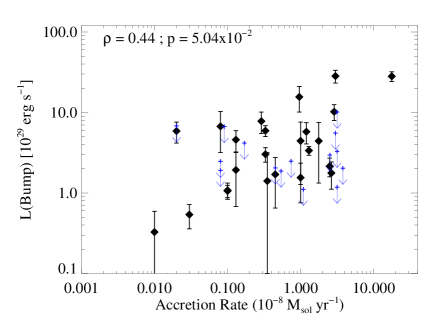
Figure 5 () also compares the Bump Lumonsity with mass accretion rate measurments from the literature. We observe a weak but significant [ =+0.44, p = 5.04 10-2] correlation between these two quantities when considering sources with well-defined Bumps. We argue that this is an indirect correlation instead of production of the Bump in the immediate vicinity of the accretion flows. In Section 5 we describe a scenario where the Bump is powered by stellar+accretion Ly photons; the Ly flux level is largely driven by the mass accretion rate onto the central star.
The stellar properties analysis also supports the argument that the underlying FUV continuum emission is generated by mass-accretion luminosity (either directly or is powered by illumination from the accreting star) (France et al., 2014b). Figure 6 shows the strong correlation between the FUV continuum luminosity, (FUV Cont), and the C IV luminosity, (C IV), [ =+0.84, p = 3.79 10-10]. Following the discussion in §3.2, previous correlations between C IV and the accretion rate may have been driven in part by an overestimated extinction correction, but this plot demonstrates that (FUV Cont) and (C IV) are strongly correlated over more than three decades of C IV luminosity. The FUV continuum has been shown to not be a direct extension of the NUV Balmer continuum in most CTTS (Herczeg et al., 2004; France et al., 2014b), but instead is likely contributed by specific high-temperature pre-shock regions where accretion columns are impacting the protostellar surface, likely with a small geometric filling faction over the stellar surface (e.g., Ingleby et al. 2013). Models of the FUV accretion continuum generation would be valuable inputs to studies of disk photochemistry and the photoevaporative evolution of gas disks.

4.2. Correlations with Disk Parameters
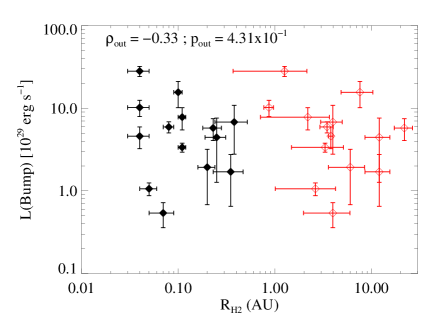
We investigate correlations between the Bump luminosity and tracers of inner disk evolution in Figure 7. Figure 7 () displays (Bump) as a function of the H2 fluorescence inner and outer radii, RH2 (Hoadley et al., 2015). The H2 radii are derived from radiative transfer modeling of the photo-illuminated disk surface; the radial flux distributions is retrieved by comparing the model output to the spectrally resolved H2 emission line profiles. The inner and outer RH2 are defined as the disk radii where 90% of the emission originates exterior to (inner radius) and 90% of the emission originates interior to (outer radius), respectively. By eye, there appears to be a weak anti-correlation between (Bump) and the H2 radius, in particular the outer radius, but no statistically strong correlation is observed [ =-0.33, p = 4.31 10-1].
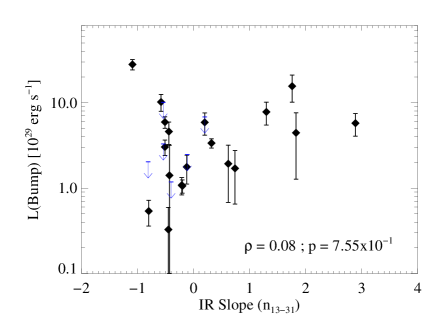
Figure 7 () compares the Bump luminosity with the slope of the mid-IR spectral energy distribution, quantified by the difference in the 13 m and 31 m brightness, (Furlan et al., 2009). Disks with 0 are generally considered to be primordial, with little dissipation of their optically thick inner dust distributions while disks with 0 indicate that the inner disk dust has been (at least partially) cleared, likely by some combination of dynamical interaction with a forming planetary system (Dong & Dawson, 2016) and photoevaporation by the high-energy irradiance of the accreting central star (Alexander et al., 2014).
There is a clear population bimodality in the detection rate of Bumps between so-called “primordial” and “transition” disks. All eight of the transition disks (CS Cha, DM Tau, GM Aur, LkCa15, SU Aur, TW Hya (COS observation only), UX Tau A, and V4046 Sgr) display Bumps. By contrast, only 11 of the remaining 29, non-transitional sources show a Bump. This suggests that a degree of inner disk clearing creates a favorable environment for the production of the 1600 Å Bump, possibly by facilitating the propagation of Ly photons through the inner few astronomical units. Disks in our sample span a range of primordial to transitional dust distribution (1 3), and despite the obvious population bimodality, no correlation is found between (Bump) and [ =+0.08, p = 7.55 10-1]. Taken together, these results suggest that if the Bump carrier is a gas phase species, it is not coupled to the optically thick dust and does not significantly diminish as the hot H2 disk atmosphere moves outward. This would favor material in a residual gas disk or disk atmosphere that remains inside the transitional dust gap, as has been seen for fluorescent H2 (France et al., 2012b) and collisional and fluorescent CO emission (Salyk et al., 2009; Brown et al., 2013; Banzatti & Pontoppidan, 2015; Schindhelm et al., 2012a).

Related to the strong correlation between the Bump and Ly is the comparison of the total luminosity from the Bump and (H2). Figure 8 shows that targets with well-defined bumps span a range (Bump)/(H2) = 10 – 80%, a number that is at first surprisingly large: H2 dissociation from a purely thermal population excited by Ly photons is small but non-zero. Taking a conservatively large dissociation fraction by assuming a hot H2 distribution ( = 4000 K), the ratio of continuum (1500 – 1700 Å) to bound-bound line flux (1200 – 1700 Å) is approximately 2.4 %. Therefore, a thermal population of fluorescent H2 falls far short of producing the observed, large (Bump)/(H2) ratio. The (Bump)/(H2) ratio is plotted versus the FUV continuum luminosity in Figure 8, and no correlation is observed [ =-0.14, p = 6.42 10-1].
We pause here to remind the reader that it is only the large specific flux of Ly that makes the hot H2 in these systems observable. For example, the brightest H2 emission cascade in most CTTSs is the [,] = [1,4] progression pumped out of the = 2, = 5 level through the (1 – 2)P(5) absorption line ( =1216.07 Å). The [2,5] rovibrational level of the ground electronic state contains 0.2% of the total H2 column at = 2500 K. Without the very strong Ly pumping source (Herczeg et al., 2004; Schindhelm et al., 2012b), these H2 emission lines would not be observable. Furthermore, Ádámkovics et al. (2016) has argued that it is the strong Ly irradiation itself that heats the H2 to the high temperatures required for detectable H2 fluorescence. Similarly, CO has a gas-phase abundance 10-4 that of H2 (France et al., 2014a) and very weak absorbing overlap transitions (through the – (14 – 0) band, where 104 s-1) with Ly (France et al., 2012b). However, the Ly luminosity is large enough to enable the detection of fluorescent CO emission lines from this process for 50% of CTTSs (Schindhelm et al., 2012a). The observation that the 1600 Å Bump has a luminosity 10 – 80 % of the total H2 fluorescent output in half of CTTSs permits a scenario where the carrier of the Bump may also be a relatively low-abundance species, provided that it has absorption transitions that overlap with Ly. In the following section, we compare the standard explanation for the Bump (collisional excitation by photoelectrons) with a possible Ly photo-excitation scenario.

5. Physical Mechanism for Producing the 1600 Å Bump
5.1. Comparison with Electron-Impact Models
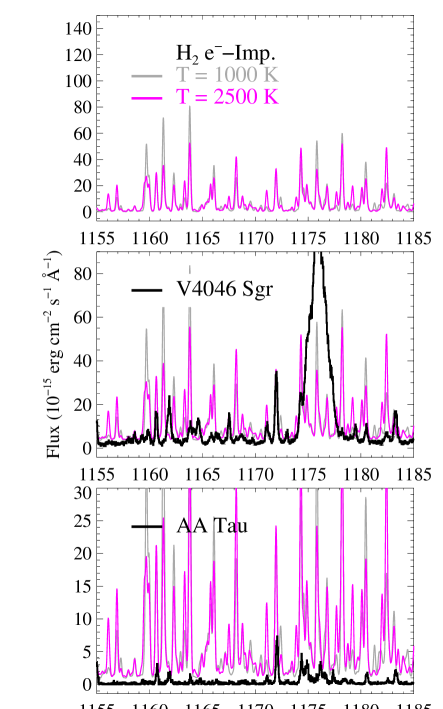
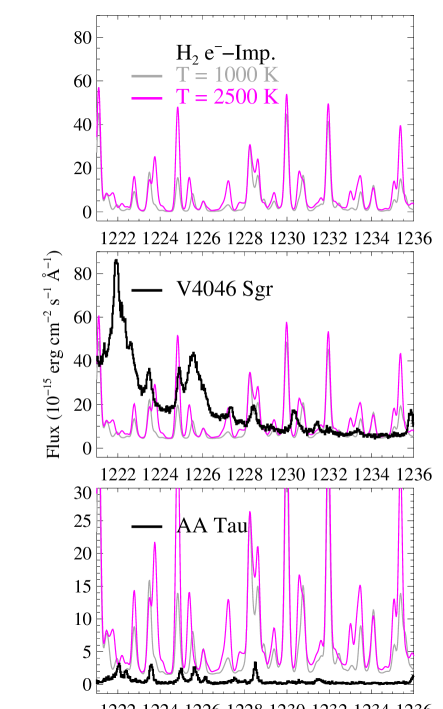
The assumed origin of the 1600 Å Bump before COS was electron-impact excitation of H2 (Bergin et al., 2004; Ingleby et al., 2009). Bergin et al. (2004) suggested that X-ray irradiation from the central source could produce hot photoelectrons capable of collisionally exciting H2 near the region of planet formation. This assumption has been used to constrain the mass surface density of CTTS disks and draw inferences about the planetary architectures found therein (Ingleby et al., 2009). Conclusions about the electron-impact excited H2 population have mainly relied on FUV spectra obtained with the low spectral resolution modes on (STIS G140L and ACS PR130L). CTTS observations with -COS have raised questions about this interpretation. Using the deepest UV spectral observations of a CTTS obtained to date, France et al. (2011b) analyzed the molecular continuum from the V4046 Sgr disk, finding that the peak in the dissociation continuum was shifted by 25 Å to the red from the nominal 1575 Å electron-impact dissociation peak observed in the well-studied Jovian aurorae (Yung et al., 1982; Ajello et al., 1984; Abgrall et al., 1997; Gustin et al., 2006).
The Bumps from two representative CTTSs (V4046 Sgr and AA Tau) are shown in Figure 9, compared with model electron-impact excited H2 dissociation continua at 1000 K and 2500 K gas temperature (assuming a 100 eV secondary electron energy distribution; France et al. 2011b); one immediately notes the offset between the observed continuum peak and the H2 dissociation continuum from electron-impact models (magenta and gray solid lines in Fig. 9). Deep COS observations have indicated that fluorescent emission of warm CO (mainly the higher lying rotational levels of the – (0 – 1) 1597 Å band pumped by the C IV 1548 Å line; France et al. 2011b, Schindhelm et al. 2012a) likely contributes to this feature, although CO alone is insufficient to account for the observed shape and flux of the Bump.
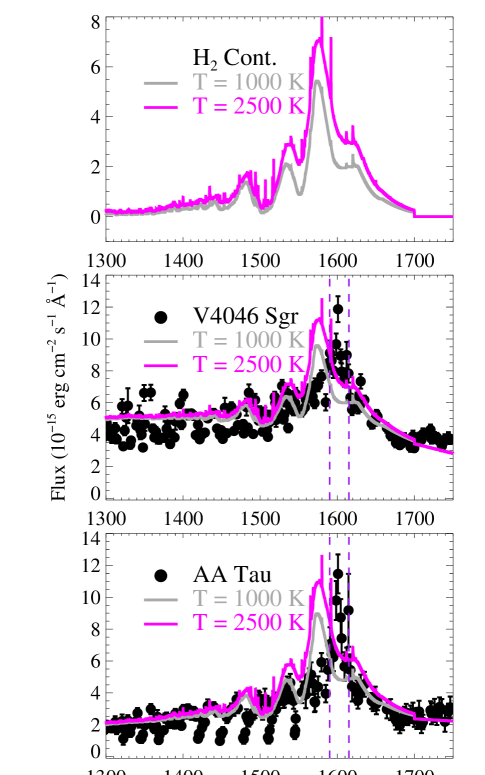
Our analysis of 20 disks with well-defined Bumps has shown that this wavelength offset is a generic property of the continuum spectra (Section 3.3). Perhaps more problematic for the electron-impact interpretation is that none of the bound-bound transitions resulting from electron-impact excitation of H2 have been unambiguously identified in the COS sample. If the 1600 Å Bump was attributable to electron-impact excitation, these discrete features should be easily observable: more than 80% of the emitted power from electron-impact excited H2 should be contained in the bound-bound lines, giving rise to a rich H2 emission spectrum at the resolution of -COS (Gustin et al., 2010). Assuming collisional excitation by hot electrons, we can compute the discrete and quasi-continuous FUV H2 emission spectrum and compare these synthetic spectra to the data. Normalizing the model H2 spectrum to the peak of the H2 dissociation continuum sets the predicted flux level for the discrete transitions that we would expect to observe across the 912 – 1650 Å bandpass. In Figure 10, we demonstrate that none of these features are observed for our example objects. In the remainder of this section, we propose a new mechanism that may explain the 1600 Å Bump: Ly-driven photodissociation of H2O in protoplanetary disks.
5.2. A Direct Probe of Water Dissociation in Protoplanetary Environments?
As described in the introduction, H2O has been shown to be abundant in CTTS disks (Carr & Najita, 2008; Pontoppidan et al., 2010). As with H2 and CO photoexcitation, H2O has photoexcitation and photodissociation routes driven by Ly photons. The FUV absorption spectrum of H2O consists of a broad continuum at long wavelengths (1400 – 1900 Å) associated with the electronic transition
. A second broad absorption is centered around 1280 Å, and the transitions below 1240 Å (Yi et al., 2007) overlap with Ly.
The possible channels for H2O excitation/dissociation by Ly photons are
| (1) |
| (2) |
| (3) |
The available spin-allowed channels for H2O photodissociation at 1216 Å are dominated (70 %) by H + OH( ) and H + OH( ) (Slanger & Black, 1982). The experiments of Slanger and Black (1982) showed that branching ratios for the process described in Equation (3) are 10% for () and 17% for () channels. Theoretical calculations444The fluorescence of OH fragments has been studied both experimentally and theoretically, but fluorescence from H2 fragments has never been studied in laboratory experiments to our knowledge. predict significant non-thermal rotational and vibrational excitation of H2 from this process (van Harrevelt & van Hemert 2008). Therefore, 10 % of the Ly-irradiated H2O population could end up as H2 molecules with a highly non-thermal population distribution. The () reaction in Equation 3, resulting in rovibrationally excited H2, can be followed by
| (4) |
This process will completely change the Lyman and Werner band excitation and emission during the Ly pumping process Equation 3. However, this mechanism has never been explored experimentally. This H2O H process may explain the observed shift in the molecular dissociation peak in CTTS environments. Furthermore, this process is a natural production mechanism for the [O I] 6300 Å emission believed to originate near the molecular disk surface and the surrounding circumstellar environment (e.g., Simon et al. 2016).
5.2.1 Calculations of the H2 Dissociation Continuum
Continuum fluorescence of H2 arises within Lyman and Werner band systems and involves transitions from the and electronically excited states to the continuum of the ground state above the dissociation limit. These transitions were first found in the laboratory by Dalgarno et al. (1970) and were subsequently interpreted by Stephens & Dalgarno (1972) in a model where the rotational contribution was treated independently of vibrational and electronic motions. Such a simple approximation has been shown to be incomplete when trying to reproduce experimental spectra obtained from electronic impact in the laboratory (Abgrall et al., 1997). Abgrall et al. (1993, 2000) have introduced the actual non-adiabatic couplings (radial and rotational) between the excited electronic states , , and as well as the Coriolis centrifugal term to solve the corresponding nuclear Schrodinger equations. They predict the theoretical FUV spectrum of H2 by using the ground state experimental energy levels of Dabrowski (1984), when available, complemented by ab-initio values for the remaining levels (Wolniewicz, 1995). The continuum emission probability is given by:
| (5) |
where is the energy of level (,), is the electric dipole matrix element linking the excited (,) and ground (,) levels and involves the dipole component responsible for P or R branches ( = - = -1, +1)555The Q branch, = 0, dissociation probabilities are very low.. The continuum emission probability is normalized over energy and is expressed in s-1 erg-1.
The wavefunction of the continuum ground state is labeled by the energy , measured above the dissociation threshold H(1) + H(1) and rotational quantum number , and is an oscillating function tending asymptotically to a Bessel function. Its normalization is performed over energy, which results in units of the emission probability in s-1 per energy interval. It should be noted that some quasi-bound states may occur for sufficiently large values of the rotational quantum number, giving rise to a well in the potential above the dissociation continuum. Such occurrences can produce resonances in the spectrum and theoretical calculations are required to predict the width and relative fluxes of such features. We refer the reader to previous work (e.g., Abgrall et al. 1993, 2000) to recover the full theoretical treatments.
We have revisited these calculations by extending the value of the rotational quantum number of the ground state up to its maximum value = 31, thanks to the recent highly accurate computations of energy level positions by Komasa et al. (2011). The energy transition wavenumbers and wavelengths are computed using these values for the ground state energy terms, and transition probabilities (matrix elements) are obtained with our wave functions computed from the ground state potential energy of Wolniewicz (1995). The maximum rotational quantum number of the upper excited level is then = 32. Comparison with high temperature plasma experiments (Gabriel et al., 2009) involving high rotational quantum numbers has shown satisfactory agreement with the theoretical computations of discrete H2, HD and D2 transitions. For the purpose of the present study, we have also carefully analyzed all possible quasi-bound levels in the ground state. The positions were previously reported by Schwenke (1988) and we have calculated the corresponding FUV emission probabilities from the upper electronic states with energy grid resolution corresponding to the width of the quasi-bound level. Then, we introduced the explicit dependence of the emission probability as a function of the wavelength instead of the energy, which simplifies the comparison with the observations. We consider all possible transitions emitted from a particular excited level and compute
| (6) |
where . We note that is negative with the origin located at the energy of H(2) level.
The fluorescence spectrum intensity depends on the population of the excited states:
| (7) |
in units of erg s-1 Å-1 molecule-1. The excited level population is derived from the excitation function of a given initial level through absorption of the Ly flux:
| (8) |
where N(H2) is the total column density, is the Ly flux, is the absorption profile, and is the fractional population in the [] state. The absorption cross section is expressed in cm2 Å as
| (9) |
In the following subsection, we compare the output of these new continuum calculations with the observed 1600 Å Bump spectra of our sources.
5.2.2 Comparison of the Synthetic H2O Dissociation Spectra with the FUV Data
The two primary discrepancies in the electron-impact H2 interpretation for the 1600 Å Bump are the shifted continuum emission peak and the non-detection of the predicted discrete line emission. In this subsection, we show rough quantitative agreement between H2 emission from highly non-thermal H2 ground state populations that result from H2O photodissociation by Ly photons (van Harrevelt & van Hemert, 2008). The results presented here strongly suggest that Ly pumping of highly non-thermal H2 can approximately reproduce the observed continuum shift, that many of the discrete emission lines predicted by Ly fluorescence from the H2O fragment electronic ground state distribution [,] predicted by van Harrevelt & van Hemert (2008) are detected in our CTTS spectra, and that the Bump emission fluxes are reasonable given typical abundances of H2O in the inner disk.
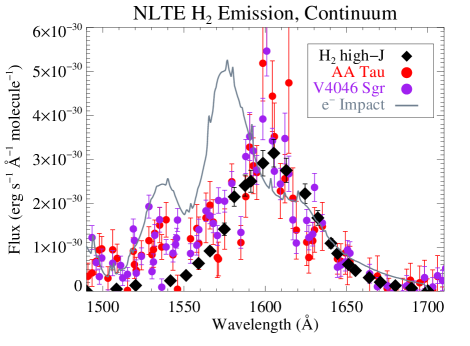
Continuum Emission – Figure 11 displays a comparison between our example CTTS Bump spectra (AA Tau and V4046 Sgr) and the H2 dissociation continuum from highly excited rovibrational levels of the state. This particular example shows emission from = 0 – 3 and = 19 – 35, although there are several combinations of rovibrational levels of the Lyman band ( = 0 – 7 and = 11 – 35) that reproduce this approximate shape and line strength. In order to compare the model continua with the data, we summed all of the continuum profiles from [,] levels in the state and then analyzed these model spectra in the same manner as the data, evaluating the continuum fluxes between sharp emission features. In this way, we avoid confusion with both the bound-bound emission lines and resonances at quasi-bound continuum levels stabilized by the H2 centrifugal potential barrier (Abgrall et al., 1997). Finally, we analyzed the model continuum spectrum with the same Gaussian profile fitting technique as presented in §3.1.1, finding = 1605.3 Å and = 53.4 Å.
It should be emphasized that while this example does not match the exact wavelength shift observed in the CTTS data (median = 1598.6 Å), the flat distribution of intermediate and high levels is the expected population distribution for non-thermal H2 water fragments (van Harrevelt & van Hemert, 2008), and the rotational level population should only increase as we go from cold (ground state, the only available calculations) to warm water more representative of the expected conditions in the warm molecular layer of protoplanetary disks. This population distribution and resultant dissociation continuum should be testable in laboratory experiments that irradiate a gas of warm water molecules with a broad Ly or scanning ultraviolet light source. As an example, we identify three rovibrational levels of the electronic state that have dissociation continua spectrally coincident with the Bump: [, ] = [4,18], [5,10], and [6,9]. These progressions, pumped by (4 – 0)P(19) 1217.41 Å, (5 – 3)R(9) 1219.11 Å, and (6 – 3)P(10) 1219.84 Å, have relatively large dissociation fractions (42%, 9%, and 17%, respectively) and produce continuum emission in a band consistent with the observations. In reality, there are a wide range of available = 0 – 7 and 10 levels that could be consistent with the observed continuum flux distribution, but identifying the exact subset of states that best reproduces the data will require continued molecular photoprocess modeling and laboratory experiments.
Discrete Line Emission – Using our reconstructed population distribution above, we can search for the strongest discrete emission lines (i.e., those with the largest branching ratios) of the most promising continuum-producing states listed above. Starting with a subsample of these levels (the [, ] = [4,18], [5,10], and [6,9] progressions), we searched through the data to see if these lines are observed in approximately the line-strength ratios predicted by the branching ratios from these upper levels. Indeed, we detect numerous discrete fluorescence lines from [4,18] in almost all of our CTTS sample with clear Bump emission. Similarly, we detect multiple discrete lines from both [5,10] and [6,9] in several sources, particularly those with broader red-wing Ly emission as would be expected.
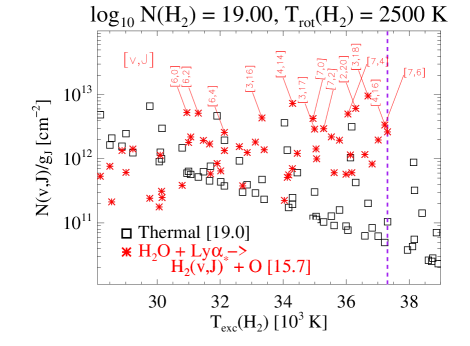
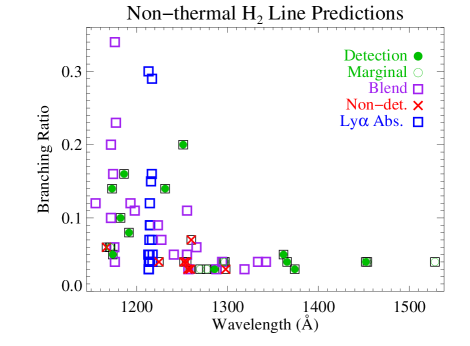
As a second, less biased, approach, we can use the calculated non-thermal H2 ground state levels predicted to have the largest fractional population () following H2O dissociation by Ly photons to determine if these levels are directly observable in our CTTS spectra. First, we identified the H2 [,] levels with the highest populations following H2O dissociation (Table 6 of van Harrevelt & van Hemert 2008). A comparison of the high excitation temperature ( 25 kK) thermal populations at a fiducial H2 column density of N(H2) = 1019 cm-2 (Schindhelm et al., 2012b), and the non-thermal H2 populations for a column of 1015.7 cm-2 (see Section 5.2.3 below) are displayed in Figure 12. A number of high-energy states display large abundances, as expected from the non-thermal excitation process. Analyzing the H2 states with significant overabundance relative to the primary thermal distribution, we identified strong absorption line ( 2.5 107 s-1) coincidences with Ly (within 4 Å of line-center) and excitation energies 25 kK. 21 candidate absorption lines were identified, and these are listed with the relevant transition information in Table 3.
We then searched for the brightest potential fluorescent emission lines from these states. For this calculation, we restricted the absorbing transitions to within 3 Å of Ly line center (1212.67 – 1218.67 Å; to consider only the peak of the Ly pumping flux for most CTTS), transition rates 2.5 107 s-1, and excitation energies 25 kK. 51 emission lines are identified (Table 4). Of these 51 predicted discrete emission lines, 12 (24%) are unambiguously detected in more than one of our CTTS our spectra, and 8 (16%) are marginally detected in at least one source. 23 (45%) are ambiguous due to blends with other atomic and molecular emission lines (mainly emission from high- lines on the tail of the thermal distribution at (H2) 2500 K), and only 8 are not detected (16%). These lines are shown as a function of their branching ratios, emission wavelengths, and detection status in Figure 13. Given the number of blends with emission from 2500K H2 emission lines, we conclude that thermally-populated H2 fluorescence and dissocation emission likely contribute at a low level to the Bump and to some of the bound-bound transitions associated with the Bump. However, neither Ly photoexcitation nor electron-impact collisional excitation of a thermal population of H2 appear to be capable of producing the observed 1600 Å Bump emission and all of the assocated discrete emission features.
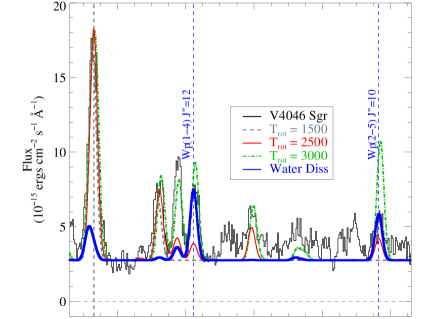
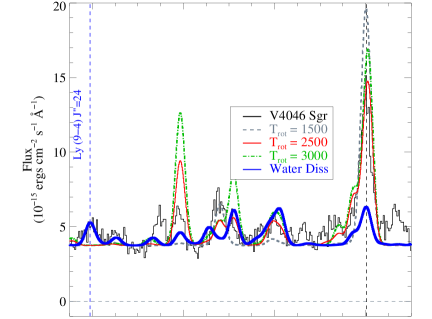
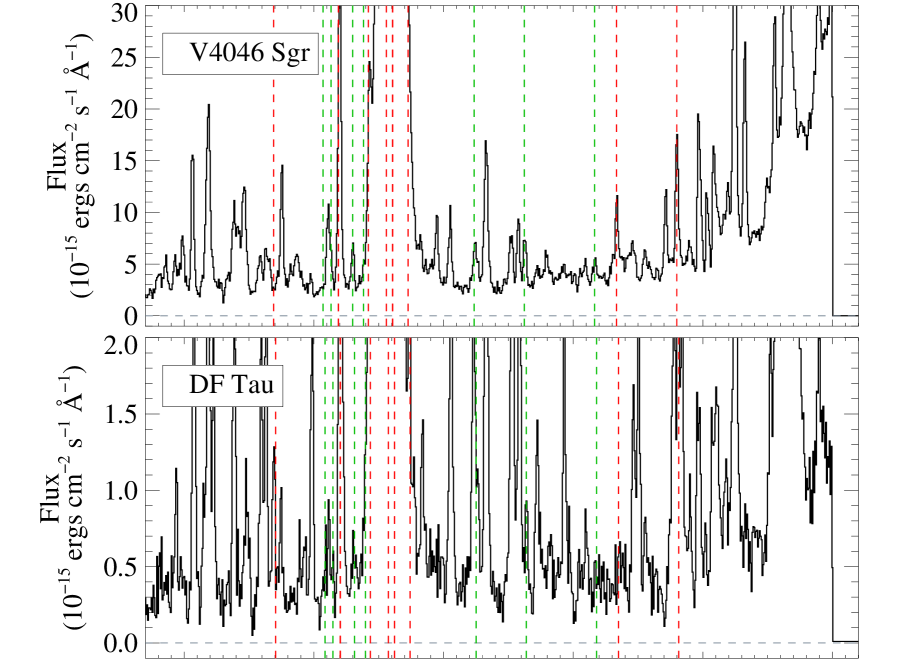
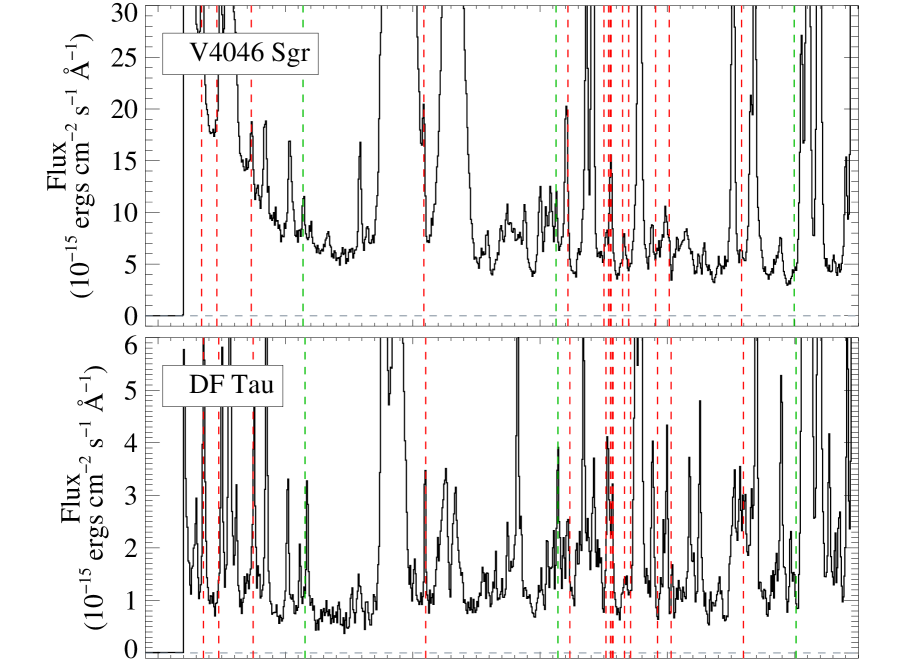
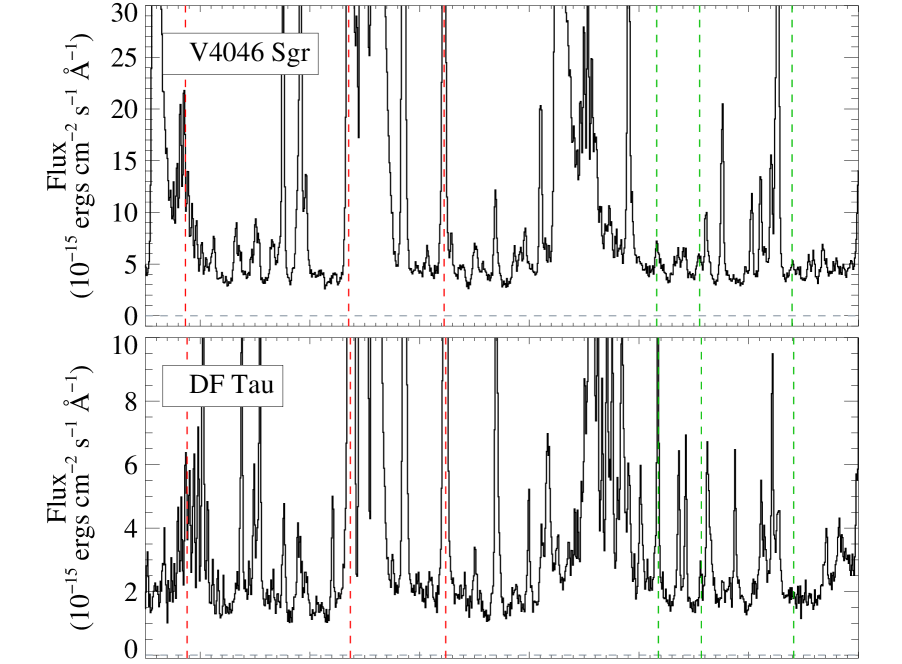
We present an example of two emission lines where H2O dissociation fragments are likely identifications for the observed emission in Figure 14. Figure 14, , shows the spectrum of V4046 Sgr in the region around the Werner band line H2 – (1 – 4) R(12) 1186.23 Å, and comparison with model fluorescence spectra using three thermal populations and the populations of van Harrevelt & van Hemert (2008). The models were created using the fluorescence code presented by McJunkin et al. (2016) and the reconstructed Ly line profiles from Schindhelm et al. (2012b). The model spectra are scaled to the flux in the strong (1 – 1) P(8) line. The thermal models at 1500 and 2500 K are unable to reproduce the flux in the (1 – 4) R(12) line. It appears that the 3000 K spectrum can approximately describe the line complex near 1186 Å, however this spectrum significantly overpredicts the observed data at other wavelengths, which is reflected in the results of previous fits to the H2 spectrum, (H2) 2000K for V4046 Sgr (Hoadley et al., 2015; McJunkin et al., 2016). Emission from non-thermal H2 is able to augment the dominant thermal population and present a better overall fit to the observed spectrum. A complementary example is given in Figure 14, , where no thermal H2 emission is predicted at the observed – (9 – 4) R(24) 1373.95 Å line. The thermal models are scaled to the flux in the (1 – 4) P(11) line, and only the non-thermal H2 population model predicts flux at the observed wavelengths. These criteria were employed for all of the lines tallied in Figure 13. Figure 15 shows larger swaths of spectra from V4046 Sgr and DF Tau, where non-thermally populated lines clearly or marginally detected are marked with a dashed green line, while non-detections or blends with stronger H2, CO, or atomic lines are marked with dashed red lines.
5.2.3 Estimated H2O Dissociation Rate and Inner Disk Origin
In this subsection, we present an estimate of the average Ly-driven H2O dissociation rate and attempt to constrain the spatial origin of the 1600 Å Bump. In Section 3.3, we measured an average Bump luminosity of log10(Bump) = 29.8, (Bump) = 6.7 1029 erg s-1, or 5.4 1040 photons s-1 at a fiducial wavelength of 1600 Å. We make an assumption that the Bump emission is optically thin and that the overlying dust does not contribute additional attenuation beyond what has been accounted for in the reddening correction. We note that the latter assumption may not be correct, and the formation region for the Bump could be closer to the AV = 1 surface in the disk, which would make the above flux estimates and the following column density calculation lower limits to the true conditions in the water-dissociation region. For example, taking a standard FUV extinction curve with ratio of total to selective reddening () of 4.0 to approximate some degree of grain growth, placing the emitting region at the AV = 1 surface would increase he calculated intrinsic photon arrival rate by a factor of 6.
Assuming an optically thin medium, the number of arriving photons represents the total number of participating molecules and we can define the non-thermal H2 dissociation rate as 5 1040 molecules s-1. The total number of non-thermal H2O fragments (H molecules) can be defined as , where = /. is the average dissociation fraction that results from transitions out of the non-thermal ground-state population (Table 3). Calculating we see that lower levels have higher dissociation fraction, such that 40% for all lines 107 s-1 and 10% for all lines 108 s-1. Taking an average of weighted by the the relative abundances of their ground state populations and their -value, we find that the dissociation is dominated by absorbing transitions in with (3 – 8) 107 s-1 and 30%. Therefore, we estimate 1.7 1041 H2 molecules s-1 produced by Ly dissociation of water. The total rate of dissociating water molecules responsible for the observed 1600 Å Bump is then (H2O)diss = / , where is the daughter-product fraction into H from the reaction H2O + Ly presented in Equation 3. has been experimentally measured to be 10% (Slanger & Black, 1982; Yi et al., 2007). The total water dissociation rate by Ly photons is (H2O)diss = 1.7 1042 molecules s-1.
The total dissociation rate from this process is large, with a rate of 2.8 1018 g s-1 of water destroyed, or 0.045 M⊙ Myr-1. This material is not lost to the system as the dissociation products go into heating the disk atmosphere (Ádámkovics et al., 2016), catalyzing additional molecular formation in the warm molecular zone (Tielens & Hollenbach, 1985; Woitke et al., 2016), and likely supplying a fraction of the thermalized molecular hydrogen found in the upper disk atmospheres of all CTTSs (e.g., France et al. 2012b). If we assume a steady state process of Ly-driven photodissociation balanced by water formation from neutral-neutral reactions of OH and H2, as well as dissociative recombination of H3O+, we can use the total number of water molecules to estimate the column and volume densities of the emitting region. Antonellini et al. (2015) model CTTS disks and find that the IR water emission (discussed in the following next subsection) is concentrated in the inner disk, with inner and outer radii of 0.1 – 0.15 and 0.35 – 0.5 AU, respectively, at a disk height of 0.15 – 0.2. Adopting average dissociation fractions, , 20 – 30%, we find that the total vertical column density of water undergoing Ly-driven dissociation is (1 –5) 1016 cm-2, or a few percent of the total water column density inferred from observations of CTTS (Carr & Najita, 2011). Under these assumptions about the spatial origin, the volume density of the emitting gas is (H2O) few 104 cm3, consistent with the upper vertical regions of high water concertation in the model of Antonellini et al. (2015).
Is an inner disk origin correct for the 1600 Å Bump? This is a challenging question to answer as the three primary mechanisms for determining the origin of atomic and molecular emission from the inner regions of protoplanetary disks, spectroastrometry (Pontoppidan et al., 2011), spectral line width modeling (Salyk et al., 2011b; Hoadley et al., 2015), and interferometry (Eisner et al., 2009, 2014) cannot be employed for the spatially and spectrally unresolved Bump emission. To obtain a rough empirical constraint on the origin of the emission, we look for unique astrophysical environments that can provide information on disk emission as a function of radius. Happily, the AA Tau system provided one such opportunity during the long-duration dimming event that began in 2011 (Bouvier et al., 2013). Schneider et al. (2015a) present a panchromatic study of the spatial and compositional characteristics of the “extra absorber” responsible for the dimming, an azimuthally asymmetric enhancement in the disk height located several AU from the central star that has rotated into view666The extra absorber is not related to the inner disk warp in the AA Tau inner disk.. Comparing -COS observations of the Bump before the dimming and during the dimming (using the 2011 and 2013 AA Tau data sets analyzed here), Schneider et al. (2015a) found that the Bump dimming was comparable to the dimming of the high-velocity wings of the Ly-pumped H2 emission lines. The H2 emission lines are broadened by Keplerian rotation, so the velocity-dependent flux decrement was used to show that only gas at 2 AU was being occulted by the extra absorber. Given the similar levels of dimming, the 1600 Å Bump likely also originates inside this radius. This picture is supported by the theoretical work of Ádámkovics et al. (2016), who describe results of a thermal-chemical disk atmosphere model indicating that Ly-driven photodissociation of water produces sufficient heating to explain the Ly-pumped H2 fluorescence observed in CTTSs. They find that photochemical heating of inner molecular disks inside of 0.5 AU is dominated by Ly-driven dissociation of H2O and OH. In this picture, the same process that produces the 1600 Å Bump as a minor dissociation fragment is predicted to dominate the gas heating of the molecular transition zone, warming the local H2 populations to temperatures that enable the Ly fluorescence mechanism to operate (1500 – 2500 K).
5.2.4 Comparison with Infrared Spectra
Water emission is detected in between one-third and one-half of CTTSs (with central star spectral types G, K, and M) observed with mid-IR spectroscopy (Pontoppidan et al., 2010), comparable to the detection rate of the 1600 Å Bump. These observations show strong peaks between 12 and 34 m, from which the vertical column density through the disk ((H2O) 1018 cm-2), the excitation temperature ((H2O) 500 – 1000 K), and the characteristic emitting radius ((H2O) 2 AU) can be derived (Carr & Najita, 2011). High-resolution water observations at near-IR wavelengths ( 3 m) have found similar results (Salyk et al., 2008; Mandell et al., 2012). Given the ubiquity of H2 and CO in the inner disks of accreting CTTSs (France et al., 2012b; Brown et al., 2013), it seems clear that H2O is equally as common with abundances between 0.1 – 1.0 times that of CO (Carr & Najita, 2008; Salyk et al., 2011a; Mandell et al., 2012).
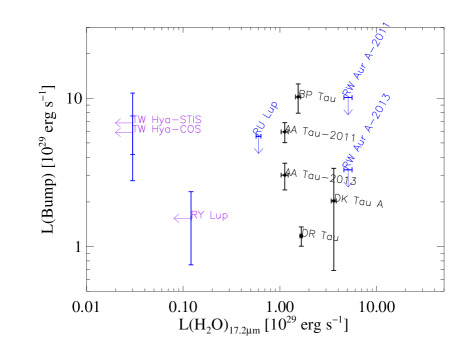
Based on our proposed origin for the 1600 Å Bump, one can imagine three potential relations between the Bump and the water emission in the mid-IR: 1) if the Bump is a byproduct of water dissociation, one could expect an anti-correlation between the Bump luminosity and the IR water luminosity, 2) a brighter bump might also indicate more water, and therefore one could expect a positive correlation, or 3) the IR water emission spectrum is produced in a region more embedded than the stellar Ly can reach effectively, meaning that the two spectral tracers are spatially independent and therefore uncorrelated. We attempted to distinguish between the above scenarios by comparing the observed water emission spectrum with the observed Bump emission for sources where both measurements were available. We selected the mid-IR water emission complex near 17.2 m, as it is the brightest mid-IR water band, and the -IRS archive provides the largest uniform water database for comparison. Extracting disk fluxes from Pontoppidan et al. (2010), Carr & Najita (2011), and Zhang et al. (2013), we identified 10 sources in common between the samples (AA Tau, BP Tau, DK Tau, DN Tau, DR Tau, HD 134344B, RU Lup, RW Aur, RY Lup, and TW Hya). Unfortunately, the overlap in the two samples is not sufficient for any conclusions to be drawn. Only AA Tau and BP Tau are strong detections in both mid-IR water emission and the FUV Bump (DR Tau and DK Tau have water detections but marginal Bump detections). RU Lup and RW Aur have strong water emission and no Bump. DN Tau, RY Lup, and TW Hya have intermediate Bump emission but no water detected, and HD134344B has neither. These are displayed in Figure 16, with each target labeled in the figure and upper limits plotted where appropriate.
5.2.5 Alternative Mechanisms for Producing Highly Non-thermal H2 Populations in Inner Disks
Previous studies have noted the presence of non-thermal H2 fluorescence features, in particular emission pumped out of the [,] = [5,18] level by C IV in the TW Hya disk (Herczeg et al., 2002) and others (Hoadley et al. – in prep.). The van Harrevelt & van Hemert (2008) calculations do not predict a significant population in the [,] = [5,18] level, however it should be emphasized that that work only presented model populations for H2O with ground rotational states of 000 (para-water) and 101 (ortho-water), respectively, a “cold” water population. Emission from warm ((H2O) 575 K, see references in §5.2.4), rotationally excited water has been observed in CTTS disks, therefore one expects that additional rovibrational H2 states are appreciably populated by Ly dissociation of warm water. H2O dissociation by Ly photons may then be a natural explanation for the highly excited H2 emission observed.
It has been shown that the process of “multiple pumping”777“Multiple pumping” refers to the situation where excitation by UV photons occurs at a rate faster than the molecules can decay via rovibrational emission lines or collisions. by FUV continuum photons at 1120 Å likely operates in protoplanetary disks (Nomura & Millar, 2005; France et al., 2012a). Pumping by the FUV continuum is still a relatively slow way to climb the rotational ladder because the transitions must obey the = 1, 0, +1 selection rules, and gas heating in these regions tends to thermalize the gas at 1000 K (Nomura & Millar, 2005; Ádámkovics et al., 2016), resulting in the highly excited vibrational populations that are weighted towards low rotational states. Models of UV pumping that incorporate X-ray irradiation and dust grain evolution (which regulates the penetration depth of FUV photons into the disk) show similar, high-, low- excitation diagrams (Nomura et al., 2007). H2 dissociation spectra in from these populations will be similar to the hot-star pumped H2 fluorescence spectrum observed in photodissociation regions, where the continuum peak is clearly established at 1575 – 1580 Å (Witt et al., 1989; France et al., 2005), in contrast to the observed spectra in our CTTS survey.
There may be other pathways to the formation of the highly non-thermal population distributions that give rise to the quasi-continuous and discrete emission lines observed in the CTTS sample, including the dissociation products of other molecular species and formation-pumping of H2 molecules newly formed on dust grains. Non-thermal H2 distributions have been observed in and Far-Ultraviolet Spectroscopic Explorer observations of comets (e.g., Feldman et al. 2009 and references therein), suggesting a potential common excitation mechanism. Initial modeling work argued that the majority of this population was produced by the dissociation of H2O via Ly photons (Liu et al., 2007), analogous to the process we describe for protoplanetary disks. More recent analyses by Feldman et al. (2009) and Feldman (2015) have demonstrated that both the H2 and the rovibrationally excited CO fluorescence spectra are better described as the fragments of formaldehyde (H2CO) dissociation. We do not favor the formaldehyde hypothesis for the T Tauri star case because while the population resulting from H2CO dissociation can produce highly excited vibrational levels (Zhang et al., 2005), the rotational populations peak at = 5 or 7 (Chambreau et al., 2006), whereas 15 is required to produce the observed 1600 Å Bump. Also, we (possibly naively) assume that the H2CO abundance in the inner regions of protoplanetary disks will be much lower than H2O.
An additional possibility is that H2 formation on dust grains in the inner disk is providing a source of non-thermal H2 – if this could be demonstrated it would constitute an exciting direct probe of molecular formation at planet-forming radii around young stars. Several authors have computed grain-formation rates for H2 under a variety of molecular cloud and PDR conditions (Jura, 1975; Black & van Dishoeck, 1987; Le Bourlot et al., 1995; Draine & Bertoldi, 1996), and the latter authors find the average rovibrational distribution of newly formed H2 to be [,] [5,9]. This is still relatively low rotational excitation compared to what is required to produce the 1600 Å Bump, however it should be noted that the calculations cited above were not carried out for the local conditions in a protoplanetary environment. Additional calculations of the H2 formation rates in disks and their nascent population distributions would be very useful.
6. Summary
We have extracted and analyzed the quasi-continuous 1600 Å Bump from a sample of 37 CTTSs observed with -COS, finding a detection rate of 50%. The widths and fluxes of these features have been measured, and we determine that this emission is inconsistent with electron-impact excitation of H2. The large total flux in this emission argues that the 1600 Å Bump is powered by Ly photons, and we argue for a new mechanism: H2O dissociation by Ly photons followed by photodissociation of the highly non-thermal water dissociation fragments. This water dissociation hypothesis provides qualitative agreement with both the discrete and continuous emission features observed in the T Tauri star sample.
We present new evidence demonstrating that water dissociation by the strong stellar+accretion Ly radiation field is a viable explanation for the Bump emission observed in the -COS T Tauri star sample. This conclusion is supported by several observational clues that match with the theory behind the water dissociation scenario, including the ability to account for the shifted, quasi-continuous emission spectrum of the Bump, being able to predict and verify observations of bound-bound H2 emission features, and finding plausible agreement with observed fluxes of these components and their expected disk densities. Therefore, the 1600 Å Bump may be a new probe of water chemistry in Ly-irradiated protoplanetary environments. The total emitted power in the Bump is between 10% and 90% of the underlying FUV continuum emission in protoplanetary disk spectra. In future work, we will build on this finding to constrain the spatial distribution of the emission and the physical conditions in the disk where the emission arises. This can be combined with disk models and water observations at IR and sub-mm wavelengths to develop a more complete picture of the H2O chemistry in protoplanetary environments. Laboratory experiments exploring the dissociation products of warm water vapor illuminated by Ly photons would also be very valuable for quantifying both the H2O dissociation mechanism and the resultant non-thermal H2 dissociation spectrum.
Appendix A -COS CTTS 1600 Å Bump Archive
Figures A.1a – A.1c display the 1600 Å Bump spectra for all 41 observations studied in this work.
References
- Abgrall et al. (2000) Abgrall, H., Roueff, E., & Drira, I. 2000, A&AS, 141, 297
- Abgrall et al. (1993) Abgrall, H., Roueff, E., Launay, F., Roncin, J. Y., & Subtil, J. L. 1993, Journal of Molecular Spectroscopy, 157, 512
- Abgrall et al. (1997) Abgrall, H., Roueff, E., Liu, X., & Shemansky, D. E. 1997, ApJ, 481, 557
- Ádámkovics et al. (2016) Ádámkovics, M., Najita, J. R., & Glassgold, A. E. 2016, ApJ, 817, 82
- Ajello et al. (1984) Ajello, J. M., Shemansky, D., Kwok, T. L., & Yung, Y. L. 1984, Phys. Rev. A, 29, 636
- Akeson et al. (2002) Akeson, R. L., Ciardi, D. R., van Belle, G. T., & Creech-Eakman, M. J. 2002, ApJ, 566, 1124
- Alencar et al. (2003) Alencar, S. H. P., Melo, C. H. F., Dullemond, C. P., Andersen, J., Batalha, C., Vaz, L. P. R., & Mathieu, R. D. 2003, A&A, 409, 1037
- Alexander et al. (2014) Alexander, R., Pascucci, I., Andrews, S., Armitage, P., & Cieza, L. 2014, Protostars and Planets VI, 475
- ALMA Partnership et al. (2015) ALMA Partnership, Brogan, C. L., Pérez, L. M., Hunter, T. R., Dent, W. R. F., Hales, A. S., Hills, R. E., Corder, S., Fomalont, E. B., Vlahakis, C., Asaki, Y., Barkats, D., Hirota, A., Hodge, J. A., Impellizzeri, C. M. V., Kneissl, R., Liuzzo, E., Lucas, R., Marcelino, N., Matsushita, S., Nakanishi, K., Phillips, N., Richards, A. M. S., Toledo, I., Aladro, R., Broguiere, D., Cortes, J. R., Cortes, P. C., Espada, D., Galarza, F., Garcia-Appadoo, D., Guzman-Ramirez, L., Humphreys, E. M., Jung, T., Kameno, S., Laing, R. A., Leon, S., Marconi, G., Mignano, A., Nikolic, B., Nyman, L.-A., Radiszcz, M., Remijan, A., Rodón, J. A., Sawada, T., Takahashi, S., Tilanus, R. P. J., Vila Vilaro, B., Watson, L. C., Wiklind, T., Akiyama, E., Chapillon, E., de Gregorio-Monsalvo, I., Di Francesco, J., Gueth, F., Kawamura, A., Lee, C.-F., Nguyen Luong, Q., Mangum, J., Pietu, V., Sanhueza, P., Saigo, K., Takakuwa, S., Ubach, C., van Kempen, T., Wootten, A., Castro-Carrizo, A., Francke, H., Gallardo, J., Garcia, J., Gonzalez, S., Hill, T., Kaminski, T., Kurono, Y., Liu, H.-Y., Lopez, C., Morales, F., Plarre, K., Schieven, G., Testi, L., Videla, L., Villard, E., Andreani, P., Hibbard, J. E., & Tatematsu, K. 2015, ApJ, 808, L3
- Andrews & Williams (2007) Andrews, S. M. & Williams, J. P. 2007, ApJ, 659, 705
- Andrews et al. (2011) Andrews, S. M., Wilner, D. J., Espaillat, C., Hughes, A. M., Dullemond, C. P., McClure, M. K., Qi, C., & Brown, J. M. 2011, ApJ, 732, 42
- Andrews et al. (2016) Andrews, S. M., Wilner, D. J., Zhu, Z., Birnstiel, T., Carpenter, J. M., Pérez, L. M., Bai, X.-N., Öberg, K. I., Hughes, A. M., Isella, A., & Ricci, L. 2016, ApJ, 820, L40
- Antonellini et al. (2016) Antonellini, S., Kamp, I., Lahuis, F., Woitke, P., Thi, W.-F., Meijerink, R., Aresu, G., Spaans, M., Güdel, M., & Liebhart, A. 2016, A&A, 585, A61
- Antonellini et al. (2015) Antonellini, S., Kamp, I., Riviere-Marichalar, P., Meijerink, R., Woitke, P., Thi, W.-F., Spaans, M., Aresu, G., & Lee, G. 2015, A&A, 582, A105
- Ardila et al. (2013) Ardila, D. R., Herczeg, G. J., Gregory, S. G., Ingleby, L., France, K., Brown, A., Edwards, S., Johns-Krull, C., Linsky, J. L., Yang, H., Valenti, J. A., Abgrall, H., Alexander, R. D., Bergin, E., Bethell, T., Brown, J. M., Calvet, N., Espaillat, C., Hillenbrand, L. A., Hussain, G., Roueff, E., Schindhelm, E. R., & Walter, F. M. 2013, ArXiv e-prints
- Banzatti & Pontoppidan (2015) Banzatti, A. & Pontoppidan, K. M. 2015, ApJ, 809, 167
- Banzatti et al. (2017) Banzatti, A., Pontoppidan, K. M., Salyk, C., Herczeg, G. J., van Dishoeck, E. F., & Blake, G. A. 2017, ApJ, 834, 152
- Bergin et al. (2004) Bergin, E., Calvet, N., Sitko, M. L., Abgrall, H., D’Alessio, P., Herczeg, G. J., Roueff, E., Qi, C., Lynch, D. K., Russell, R. W., Brafford, S. M., & Perry, R. B. 2004, ApJ, 614, L133
- Bertout et al. (1988) Bertout, C., Basri, G., & Bouvier, J. 1988, ApJ, 330, 350
- Bertout et al. (1999) Bertout, C., Robichon, N., & Arenou, F. 1999, A&A, 352, 574
- Black & van Dishoeck (1987) Black, J. H. & van Dishoeck, E. F. 1987, ApJ, 322, 412
- Bohlin et al. (1978) Bohlin, R. C., Savage, B. D., & Drake, J. F. 1978, ApJ, 224, 132
- Bouvier et al. (1999) Bouvier, J., Chelli, A., Allain, S., Carrasco, L., Costero, R., Cruz-Gonzalez, I., Dougados, C., Fernández, M., Martín, E. L., Ménard, F., Mennessier, C., Mujica, R., Recillas, E., Salas, L., Schmidt, G., & Wichmann, R. 1999, A&A, 349, 619
- Bouvier et al. (2013) Bouvier, J., Grankin, K., Ellerbroek, L. E., Bouy, H., & Barrado, D. 2013, A&A, 557, A77
- Brittain et al. (2015) Brittain, S. D., Najita, J. R., & Carr, J. S. 2015, Ap&SS, 357, 54
- Brown et al. (2013) Brown, J. M., Pontoppidan, K. M., van Dishoeck, E. F., Herczeg, G. J., Blake, G. A., & Smette, A. 2013, ApJ, 770, 94
- Calvet et al. (2005) Calvet, N., D’Alessio, P., Watson, D. M., Franco-Hernández, R., Furlan, E., Green, J., Sutter, P. M., Forrest, W. J., Hartmann, L., Uchida, K. I., Keller, L. D., Sargent, B., Najita, J., Herter, T. L., Barry, D. J., & Hall, P. 2005, ApJ, 630, L185
- Calvet et al. (2004) Calvet, N., Muzerolle, J., Briceño, C., Hernández, J., Hartmann, L., Saucedo, J. L., & Gordon, K. D. 2004, AJ, 128, 1294
- Carmona et al. (2011) Carmona, A., van der Plas, G., van den Ancker, M. E., Audard, M., Waters, L. B. F. M., Fedele, D., Acke, B., & Pantin, E. 2011, A&A, 533, A39
- Carr & Najita (2008) Carr, J. S. & Najita, J. R. 2008, Science, 319, 1504
- Carr & Najita (2011) —. 2011, ApJ, 733, 102
- Chambreau et al. (2006) Chambreau, S. D., Lahankar, S. A., & Suits, A. G. 2006, J. Chem. Phys., 125, 044302
- Cody et al. (2013) Cody, A. M., Tayar, J., Hillenbrand, L. A., Matthews, J. M., & Kallinger, T. 2013, AJ, 145, 79
- Coffey et al. (2004) Coffey, D., Bacciotti, F., Woitas, J., Ray, T. P., & Eislöffel, J. 2004, ApJ, 604, 758
- Comerón & Fernández (2010) Comerón, F. & Fernández, M. 2010, A&A, 511, A10
- Comerón et al. (2003) Comerón, F., Fernández, M., Baraffe, I., Neuhäuser, R., & Kaas, A. A. 2003, A&A, 406, 1001
- Dabrowski (1984) Dabrowski, I. 1984, Canadian Journal of Physics, 62, 1639
- Dalgarno et al. (1970) Dalgarno, A., Herzberg, G., & Stephens, T. L. 1970, ApJ, 162, L49
- Diplas & Savage (1994) Diplas, A. & Savage, B. D. 1994, ApJS, 93, 211
- Dong & Dawson (2016) Dong, R. & Dawson, R. 2016, ApJ, 825, 77
- Draine & Bertoldi (1996) Draine, B. T. & Bertoldi, F. 1996, ApJ, 468, 269
- Eisner et al. (2009) Eisner, J. A., Graham, J. R., Akeson, R. L., & Najita, J. 2009, ApJ, 692, 309
- Eisner et al. (2014) Eisner, J. A., Hillenbrand, L. A., & Stone, J. M. 2014, MNRAS, 443, 1916
- Espaillat et al. (2007) Espaillat, C., Calvet, N., D’Alessio, P., Bergin, E., Hartmann, L., Watson, D., Furlan, E., Najita, J., Forrest, W., McClure, M., Sargent, B., Bohac, C., & Harrold, S. T. 2007, ApJ, 664, L111
- Espaillat et al. (2010) Espaillat, C., D’Alessio, P., Hernández, J., Nagel, E., Luhman, K. L., Watson, D. M., Calvet, N., Muzerolle, J., & McClure, M. 2010, ApJ, 717, 441
- Feldman (2015) Feldman, P. D. 2015, ApJ, 812, 115
- Feldman et al. (2009) Feldman, P. D., Lupu, R. E., McCandliss, S. R., & Weaver, H. A. 2009, ApJ, 699, 1104
- France et al. (2005) France, K., Andersson, B.-G., McCandliss, S. R., & Feldman, P. D. 2005, ApJ, 628, 750
- France et al. (2012a) France, K., Burgh, E. B., Herczeg, G. J., Schindhelm, E., Yang, H., Abgrall, H., Roueff, E., Brown, A., Brown, J. M., & Linsky, J. L. 2012a, ApJ, 744, 22
- France et al. (2014a) France, K., Herczeg, G. J., McJunkin, M., & Penton, S. V. 2014a, ApJ, 794, 160
- France et al. (2010a) France, K., Linsky, J. L., Brown, A., Froning, C. S., & Béland, S. 2010a, ApJ, 715, 596
- France et al. (2014b) France, K., Schindhelm, E., Bergin, E. A., Roueff, E., & Abgrall, H. 2014b, ApJ, 784, 127
- France et al. (2011a) France, K., Schindhelm, E., Burgh, E. B., Herczeg, G. J., Harper, G. M., Brown, A., Green, J. C., Linsky, J. L., Yang, H., Abgrall, H., Ardila, D. R., Bergin, E., Bethell, T., Brown, J. M., Calvet, N., Espaillat, C., Gregory, S. G., Hillenbrand, L. A., Hussain, G., Ingleby, L., Johns-Krull, C. M., Roueff, E., Valenti, J. A., & Walter, F. M. 2011a, ApJ, 734, 31
- France et al. (2012b) France, K., Schindhelm, E., Herczeg, G. J., Brown, A., Abgrall, H., Alexander, R. D., Bergin, E. A., Brown, J. M., Linsky, J. L., Roueff, E., & Yang, H. 2012b, ApJ, 756, 171
- France et al. (2010b) France, K., Stocke, J. T., Yang, H., Linsky, J. L., Wolven, B. C., Froning, C. S., Green, J. C., & Osterman, S. N. 2010b, ApJ, 712, 1277
- France et al. (2011b) France, K., Yang, H., & Linsky, J. L. 2011b, ApJ, 729, 7
- Furlan et al. (2009) Furlan, E., Watson, D. M., McClure, M. K., Manoj, P., Espaillat, C., D’Alessio, P., Calvet, N., Kim, K. H., Sargent, B. A., Forrest, W. J., & Hartmann, L. 2009, ApJ, 703, 1964
- Gabriel et al. (2009) Gabriel, O., van den Dungen, J. J. A., Roueff, E., Abgrall, H., & Engeln, R. 2009, Journal of Molecular Spectroscopy, 253, 64
- Garcia Lopez et al. (2006) Garcia Lopez, R., Natta, A., Testi, L., & Habart, E. 2006, A&A, 459, 837
- Getman et al. (2011) Getman, K. V., Broos, P. S., Salter, D. M., Garmire, G. P., & Hogerheijde, M. R. 2011, ApJ, 730, 6
- Gizis & Bharat (2004) Gizis, J. E. & Bharat, R. 2004, ApJ, 608, L113
- Gómez de Castro (2009) Gómez de Castro, A. I. 2009, ApJ, 698, L108
- Gómez de Castro et al. (2013) Gómez de Castro, A. I., López-Santiago, J., Talavera, A., Sytov, A. Y., & Bisikalo, D. 2013, ApJ, 766, 62
- Gómez de Castro et al. (2016) Gómez de Castro, A. I., Loyd, R. O. P., France, K., Sytov, A., & Bisikalo, D. 2016, ApJ, 818, L17
- Grady et al. (2009) Grady, C. A., Schneider, G., Sitko, M. L., Williger, G. M., Hamaguchi, K., Brittain, S. D., Ablordeppey, K., Apai, D., Beerman, L., Carpenter, W. J., Collins, K. A., Fukagawa, M., Hammel, H. B., Henning, T., Hines, D., Kimes, R., Lynch, D. K., Ménard, F., Pearson, R., Russell, R. W., Silverstone, M., Smith, P. S., Troutman, M., Wilner, D., Woodgate, B., & Clampin, M. 2009, ApJ, 699, 1822
- Grady et al. (2004) Grady, C. A., Woodgate, B., Torres, C. A. O., Henning, T., Apai, D., Rodmann, J., Wang, H., Stecklum, B., Linz, H., Williger, G. M., Brown, A., Wilkinson, E., Harper, G. M., Herczeg, G. J., Danks, A., Vieira, G. L., Malumuth, E., Collins, N. R., & Hill, R. S. 2004, ApJ, 608, 809
- Green et al. (2012) Green, J. C., Froning, C. S., Osterman, S., Ebbets, D., Heap, S. H., Leitherer, C., Linsky, J. L., Savage, B. D., Sembach, K., Shull, J. M., Siegmund, O. H. W., Snow, T. P., Spencer, J., Stern, S. A., Stocke, J., Welsh, B., Béland, S., Burgh, E. B., Danforth, C., France, K., Keeney, B., McPhate, J., Penton, S. V., Andrews, J., Brownsberger, K., Morse, J., & Wilkinson, E. 2012, ApJ, 744, 60
- Güdel et al. (2007) Güdel, M., Briggs, K. R., Arzner, K., Audard, M., Bouvier, J., Feigelson, E. D., Franciosini, E., Glauser, A., Grosso, N., Micela, G., Monin, J.-L., Montmerle, T., Padgett, D. L., Palla, F., Pillitteri, I., Rebull, L., Scelsi, L., Silva, B., Skinner, S. L., Stelzer, B., & Telleschi, A. 2007, A&A, 468, 353
- Güdel et al. (2010) Güdel, M., Lahuis, F., Briggs, K. R., Carr, J., Glassgold, A. E., Henning, T., Najita, J. R., van Boekel, R., & van Dishoeck, E. F. 2010, A&A, 519, A113
- Güdel & Telleschi (2007) Güdel, M. & Telleschi, A. 2007, A&A, 474, L25
- Gullbring et al. (2000) Gullbring, E., Calvet, N., Muzerolle, J., & Hartmann, L. 2000, ApJ, 544, 927
- Gullbring et al. (1998) Gullbring, E., Hartmann, L., Briceño, C., & Calvet, N. 1998, ApJ, 492, 323
- Günther & Schmitt (2007) Günther, H. M. & Schmitt, J. H. M. M. 2007, Mem. Soc. Astron. Italiana, 78, 359
- Gustin et al. (2006) Gustin, J., Cowley, S. W. H., Gérard, J., Gladstone, G. R., Grodent, D., & Clarke, J. T. 2006, Journal of Geophysical Research (Space Physics), 111, 9220
- Gustin et al. (2004) Gustin, J., Feldman, P. D., Gérard, J., Grodent, D., Vidal-Madjar, A., Ben Jaffel, L., Desert, J., Moos, H. W., Sahnow, D. J., Weaver, H. A., Wolven, B. C., Ajello, J. M., Waite, J. H., Roueff, E., & Abgrall, H. 2004, Icarus, 171, 336
- Gustin et al. (2010) Gustin, J., Stewart, I., Gérard, J.-C., & Esposito, L. 2010, Icarus, 210, 270
- Hartigan et al. (1995) Hartigan, P., Edwards, S., & Ghandour, L. 1995, ApJ, 452, 736
- Hartigan & Kenyon (2003) Hartigan, P. & Kenyon, S. J. 2003, ApJ, 583, 334
- Hartmann et al. (1998) Hartmann, L., Calvet, N., Gullbring, E., & D’Alessio, P. 1998, ApJ, 495, 385
- Haworth et al. (2016) Haworth, T. J., Ilee, J. D., Forgan, D. H., Facchini, S., Price, D. J., Boneberg, D. M., Booth, R. A., Clarke, C. J., Gonzalez, J.-F., Hutchison, M. A., Kamp, I., Laibe, G., Lyra, W., Meru, F., Mohanty, S., Panić, O., Rice, K., Suzuki, T., Teague, R., Walsh, C., Woitke, P., & Community authors. 2016, PASA, 33, e053
- Herbst et al. (1994) Herbst, W., Herbst, D. K., Grossman, E. J., & Weinstein, D. 1994, AJ, 108, 1906
- Herczeg & Hillenbrand (2008) Herczeg, G. J. & Hillenbrand, L. A. 2008, ApJ, 681, 594
- Herczeg & Hillenbrand (2014) —. 2014, ApJ, 786, 97
- Herczeg et al. (2002) Herczeg, G. J., Linsky, J. L., Valenti, J. A., Johns-Krull, C. M., & Wood, B. E. 2002, ApJ, 572, 310
- Herczeg et al. (2005) Herczeg, G. J., Walter, F. M., Linsky, J. L., Gahm, G. F., Ardila, D. R., Brown, A., Johns-Krull, C. M., Simon, M., & Valenti, J. A. 2005, AJ, 129, 2777
- Herczeg et al. (2004) Herczeg, G. J., Wood, B. E., Linsky, J. L., Valenti, J. A., & Johns-Krull, C. M. 2004, ApJ, 607, 369
- Hoadley et al. (2015) Hoadley, K., France, K., Alexander, R. D., McJunkin, M., & Schneider, P. C. 2015, ApJ, 812, 41
- Hughes et al. (1994) Hughes, J., Hartigan, P., Krautter, J., & Kelemen, J. 1994, AJ, 108, 1071
- Ingleby et al. (2011a) Ingleby, L., Calvet, N., Bergin, E., Herczeg, G., Brown, A., Alexander, R., Edwards, S., Espaillat, C., France, K., Gregory, S. G., Hillenbrand, L., Roueff, E., Valenti, J., Walter, F., Johns-Krull, C., Brown, J., Linsky, J., McClure, M., Ardila, D., Abgrall, H., Bethell, T., Hussain, G., & Yang, H. 2011a, ArXiv e-prints
- Ingleby et al. (2009) Ingleby, L., Calvet, N., Bergin, E., Yerasi, A., Espaillat, C., Herczeg, G., Roueff, E., Abgrall, H., Hernández, J., Briceño, C., Pascucci, I., Miller, J., Fogel, J., Hartmann, L., Meyer, M., Carpenter, J., Crockett, N., & McClure, M. 2009, ApJ, 703, L137
- Ingleby et al. (2013) Ingleby, L., Calvet, N., Herczeg, G., Blaty, A., Walter, F., Ardila, D., Alexander, R., Edwards, S., Espaillat, C., Gregory, S. G., Hillenbrand, L., & Brown, A. 2013, ArXiv e-prints
- Ingleby et al. (2011b) Ingleby, L., Calvet, N., Hernández, J., Briceño, C., Espaillat, C., Miller, J., Bergin, E., & Hartmann, L. 2011b, AJ, 141, 127
- Ingleby et al. (2014) Ingleby, L., Calvet, N., Hernández, J., Hartmann, L., Briceno, C., Miller, J., Espaillat, C., & McClure, M. 2014, ApJ, 790, 47
- Johns-Krull & Valenti (2001) Johns-Krull, C. M. & Valenti, J. A. 2001, ApJ, 561, 1060
- Johns-Krull et al. (2000) Johns-Krull, C. M., Valenti, J. A., & Linsky, J. L. 2000, ApJ, 539, 815
- Jura (1975) Jura, M. 1975, ApJ, 197, 575
- Komasa et al. (2011) Komasa, J., Piszczatowski, K., Lach, G., & et al. 2011, Chem. Theory Comput., 7, 3105
- Kraus & Hillenbrand (2009) Kraus, A. L. & Hillenbrand, L. A. 2009, ApJ, 704, 531
- Lamzin (2006) Lamzin, S. A. 2006, Astronomy Letters, 32, 176
- Lawson et al. (2001) Lawson, W. A., Crause, L. A., Mamajek, E. E., & Feigelson, E. D. 2001, MNRAS, 321, 57
- Lawson et al. (2004) Lawson, W. A., Lyo, A.-R., & Muzerolle, J. 2004, MNRAS, 351, L39
- Le Bourlot et al. (1995) Le Bourlot, J., Pineau des Forets, G., Roueff, E., Dalgarno, A., & Gredel, R. 1995, ApJ, 449, 178
- Liu & Dalgarno (1996) Liu, W. & Dalgarno, A. 1996, ApJ, 462, 502
- Liu et al. (2007) Liu, X., Shemansky, D. E., Hallett, J. T., & Weaver, H. A. 2007, ApJS, 169, 458
- Loinard et al. (2007) Loinard, L., Torres, R. M., Mioduszewski, A. J., Rodríguez, L. F., González-Lópezlira, R. A., Lachaume, R., Vázquez, V., & González, E. 2007, ApJ, 671, 546
- López-Santiago et al. (2010) López-Santiago, J., Albacete Colombo, J. F., & López-García, M. A. 2010, A&A, 524, A97
- Luhman (2004) Luhman, K. L. 2004, ApJ, 602, 816
- Luhman & Steeghs (2004) Luhman, K. L. & Steeghs, D. 2004, ApJ, 609, 917
- Mamajek et al. (1999) Mamajek, E. E., Lawson, W. A., & Feigelson, E. D. 1999, PASA, 16, 257
- Mandell et al. (2012) Mandell, A. M., Bast, J., van Dishoeck, E. F., Blake, G. A., Salyk, C., Mumma, M. J., & Villanueva, G. 2012, ApJ, 747, 92
- Manset et al. (2009) Manset, N., Bastien, P., Ménard, F., Bertout, C., Le van Suu, A., & Boivin, L. 2009, A&A, 499, 137
- McJunkin et al. (2016) McJunkin, M., France, K., Schindhelm, E., Herczeg, G., Schneider, P. C., & Brown, A. 2016, ApJ, 828, 69
- McJunkin et al. (2014) McJunkin, M., France, K., Schneider, P. C., Herczeg, G. J., Brown, A., Hillenbrand, L., Schindhelm, E., & Edwards, S. 2014, ApJ, 780, 150
- Muzerolle et al. (2003) Muzerolle, J., Calvet, N., Hartmann, L., & D’Alessio, P. 2003, ApJ, 597, L149
- Najita et al. (2008) Najita, J. R., Crockett, N., & Carr, J. S. 2008, ApJ, 687, 1168
- Nomura et al. (2007) Nomura, H., Aikawa, Y., Tsujimoto, M., Nakagawa, Y., & Millar, T. J. 2007, ApJ, 661, 334
- Nomura & Millar (2005) Nomura, H. & Millar, T. J. 2005, A&A, 438, 923
- Osterman et al. (2011) Osterman, S., Green, J., Froning, C., Béland, S., Burgh, E., France, K., Penton, S., Delker, T., Ebbets, D., Sahnow, D., Bacinski, J., Kimble, R., Andrews, J., Wilkinson, E., McPhate, J., Siegmund, O., Ake, T., Aloisi, A., Biagetti, C., Diaz, R., Dixon, W., Friedman, S., Ghavamian, P., Goudfrooij, P., Hartig, G., Keyes, C., Lennon, D., Massa, D., Niemi, S., Oliveira, C., Osten, R., Proffitt, C., Smith, T., & Soderblom, D. 2011, Ap&SS, 306
- Pascucci et al. (2013) Pascucci, I., Herczeg, G., Carr, J. S., & Bruderer, S. 2013, ApJ, 779, 178
- Pontoppidan et al. (2011) Pontoppidan, K. M., Blake, G. A., & Smette, A. 2011, ApJ, 733, 84
- Pontoppidan et al. (2008) Pontoppidan, K. M., Blake, G. A., van Dishoeck, E. F., Smette, A., Ireland, M. J., & Brown, J. 2008, ApJ, 684, 1323
- Pontoppidan et al. (2010) Pontoppidan, K. M., Salyk, C., Blake, G. A., Meijerink, R., Carr, J. S., & Najita, J. 2010, ApJ, 720, 887
- Quast et al. (2000) Quast, G. R., Torres, C. A. O., de La Reza, R., da Silva, L., & Mayor, M. 2000, in IAU Symposium, Vol. 200, IAU Symposium, 28
- Ramsay Howat & Greaves (2007) Ramsay Howat, S. K. & Greaves, J. S. 2007, MNRAS, 379, 1658
- Raymond et al. (1997) Raymond, J. C., Blair, W. P., & Long, K. S. 1997, ApJ, 489, 314
- Ricci et al. (2010) Ricci, L., Testi, L., Natta, A., Neri, R., Cabrit, S., & Herczeg, G. J. 2010, A&A, 512, A15
- Rodriguez et al. (2010) Rodriguez, D. R., Kastner, J. H., Wilner, D., & Qi, C. 2010, ApJ, 720, 1684
- Salyk et al. (2009) Salyk, C., Blake, G. A., Boogert, A. C. A., & Brown, J. M. 2009, ApJ, 699, 330
- Salyk et al. (2008) Salyk, C., Pontoppidan, K. M., Blake, G. A., Lahuis, F., van Dishoeck, E. F., & Evans, II, N. J. 2008, ApJ, 676, L49
- Salyk et al. (2011a) Salyk, C., Pontoppidan, K. M., Blake, G. A., Najita, J. R., & Carr, J. S. 2011a, ApJ, 731, 130
- Salyk et al. (2011b) —. 2011b, ApJ, 731, 130
- Schindhelm et al. (2012a) Schindhelm, E., France, K., Herczeg, G., & Bergin, E. 2012a, ApJ
- Schindhelm et al. (2012b) Schindhelm, E., France, K., Herczeg, G. J., Bergin, E., Yang, H., Brown, A., Brown, J. M., Linsky, J. L., & Valenti, J. 2012b, ApJ, 756, L23
- Schneider et al. (2015a) Schneider, P. C., France, K., Günther, H. M., Herczeg, G., Robrade, J., Bouvier, J., McJunkin, M., & Schmitt, J. H. M. M. 2015a, A&A, 584, A51
- Schneider et al. (2015b) Schneider, P. C., Günther, H. M., Robrade, J., Facchini, S., Hodapp, K. W., Manara, C. F., Perdelwitz, V., Schmitt, J. H. M. M., Skinner, S., & Wolk, S. J. 2015b, A&A, 584, L9
- Schwenke (1988) Schwenke, D. W. 1988, Theoretica Chimica Acta, 74, 381
- Sicilia-Aguilar et al. (2016) Sicilia-Aguilar, A., Banzatti, A., Carmona, A., Stolker, T., Kama, M., Mendigutía, I., Garufi, A., Flaherty, K., van der Marel, N., & Greaves, J. 2016, PASA, 33, e059
- Simon et al. (2000) Simon, M., Dutrey, A., & Guilloteau, S. 2000, ApJ, 545, 1034
- Simon et al. (2016) Simon, M. N., Pascucci, I., Edwards, S., Feng, W., Gorti, U., Hollenbach, D., Rigliaco, E., & Keane, J. T. 2016, ApJ, 831, 169
- Skinner & Güdel (2013) Skinner, S. L. & Güdel, M. 2013, ApJ, 765, 3
- Slanger & Black (1982) Slanger, T. G. & Black, G. 1982, J. Chem. Phys., 77, 2432
- Stempels et al. (2007) Stempels, H. C., Gahm, G. F., & Petrov, P. P. 2007, A&A, 461, 253
- Stephens & Dalgarno (1972) Stephens, T. L. & Dalgarno, A. 1972, J. Quant. Spec. Radiat. Transf., 12, 569
- Tielens & Hollenbach (1985) Tielens, A. G. G. M. & Hollenbach, D. 1985, ApJ, 291, 747
- van Boekel et al. (2005) van Boekel, R., Min, M., Waters, L. B. F. M., de Koter, A., Dominik, C., van den Ancker, M. E., & Bouwman, J. 2005, A&A, 437, 189
- van den Ancker et al. (1998) van den Ancker, M. E., de Winter, D., & Tjin A Djie, H. R. E. 1998, A&A, 330, 145
- van Harrevelt & van Hemert (2008) van Harrevelt, R. & van Hemert, M. 2008, Jounal of Phys. Chem. A, 112, 3002
- van Leeuwen (2007) van Leeuwen, F. 2007, A&A, 474, 653
- Venuti et al. (2015) Venuti, L., Bouvier, J., Irwin, J., Stauffer, J. R., Hillenbrand, L. A., Rebull, L. M., Cody, A. M., Alencar, S. H. P., Micela, G., Flaccomio, E., & Peres, G. 2015, A&A, 581, A66
- Walter & Kuhi (1981) Walter, F. M. & Kuhi, L. V. 1981, ApJ, 250, 254
- Webb et al. (1999) Webb, R. A., Zuckerman, B., Platais, I., Patience, J., White, R. J., Schwartz, M. J., & McCarthy, C. 1999, ApJ, 512, L63
- White & Ghez (2001) White, R. J. & Ghez, A. M. 2001, ApJ, 556, 265
- Witt et al. (1989) Witt, A. N., Stecher, T. P., Boroson, T. A., & Bohlin, R. C. 1989, ApJ, 336, L21
- Woitke et al. (2016) Woitke, P., Min, M., Pinte, C., Thi, W.-F., Kamp, I., Rab, C., Anthonioz, F., Antonellini, S., Baldovin-Saavedra, C., Carmona, A., Dominik, C., Dionatos, O., Greaves, J., Güdel, M., Ilee, J. D., Liebhart, A., Ménard, F., Rigon, L., Waters, L. B. F. M., Aresu, G., Meijerink, R., & Spaans, M. 2016, A&A, 586, A103
- Wolniewicz (1995) Wolniewicz, L. 1995, J. Chem. Phys., 103, 1792
- Yi et al. (2007) Yi, W., Park, J., & Lee, J. 2007, Chemical Physics Letters, 439, 46
- Yung et al. (1982) Yung, Y. L., Gladstone, G. R., Chang, K. M., Ajello, J. M., & Srivastava, S. K. 1982, ApJ, 254, L65
- Zhang et al. (2013) Zhang, K., Pontoppidan, K. M., Salyk, C., & Blake, G. A. 2013, ApJ, 766, 82
- Zhang et al. (2005) Zhang, X., Rheinecker, J. L., & Bowman, J. M. 2005, J. Chem. Phys., 122, 114313
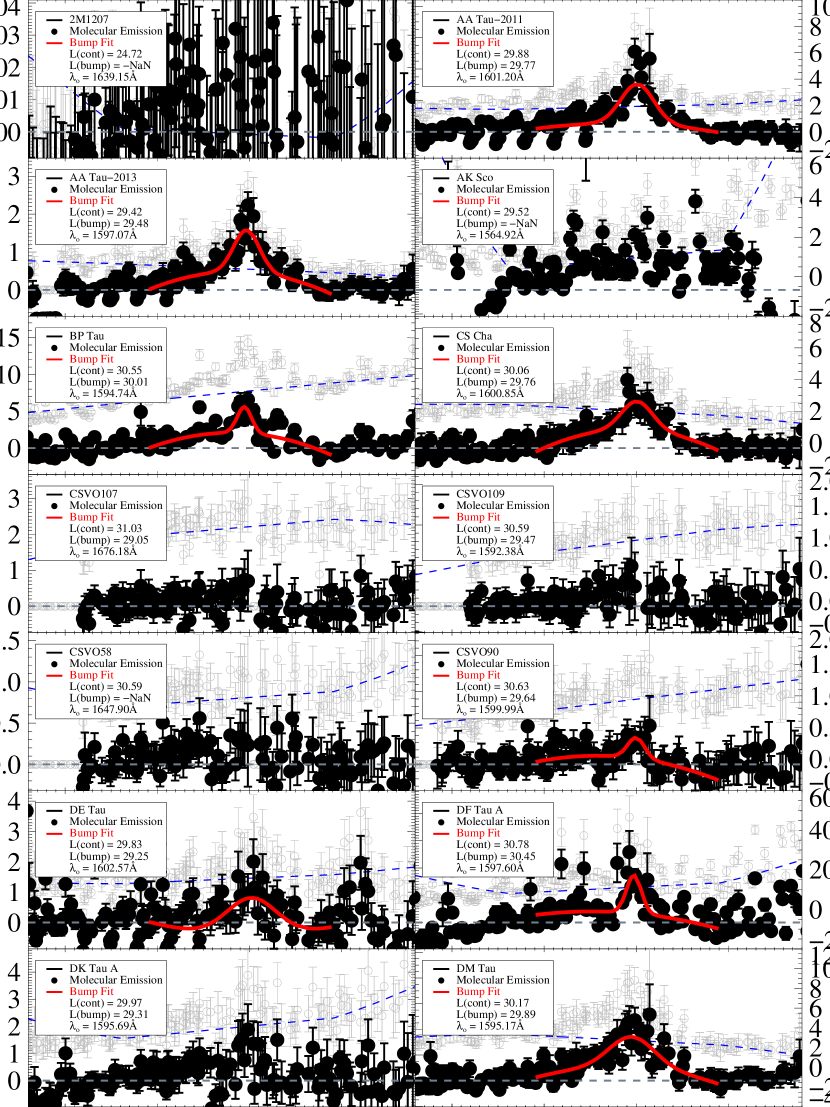
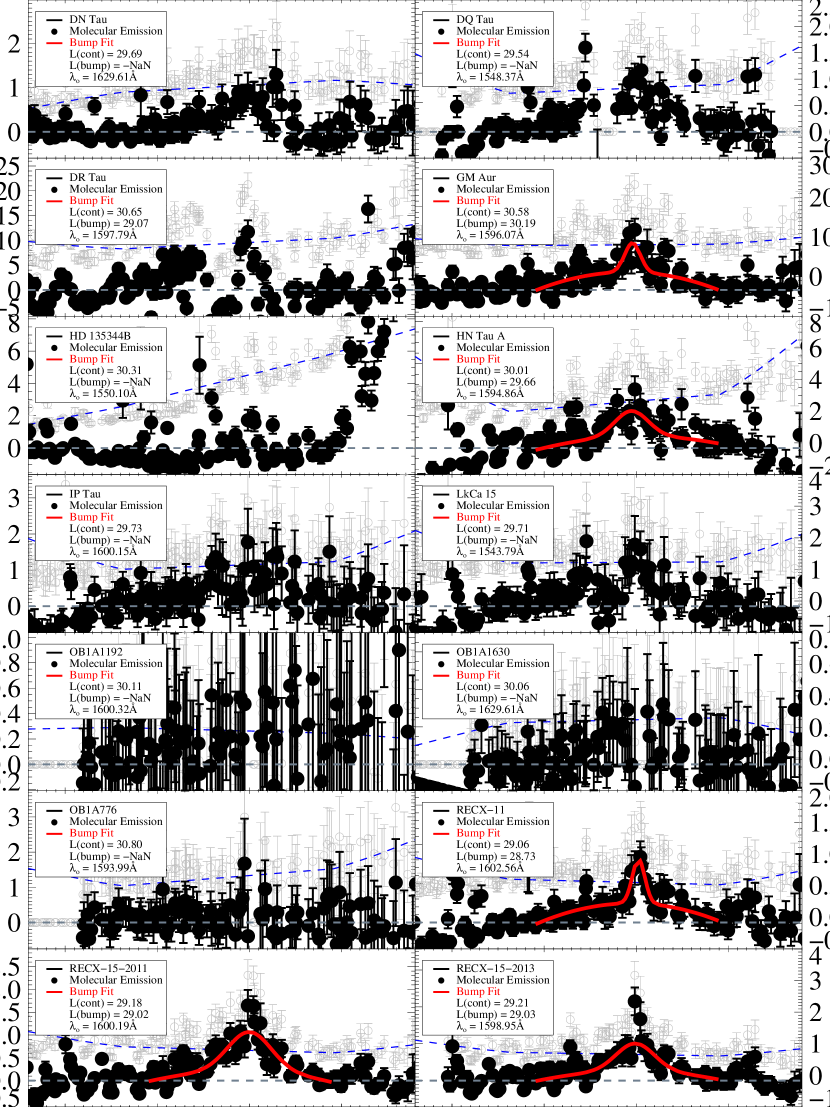
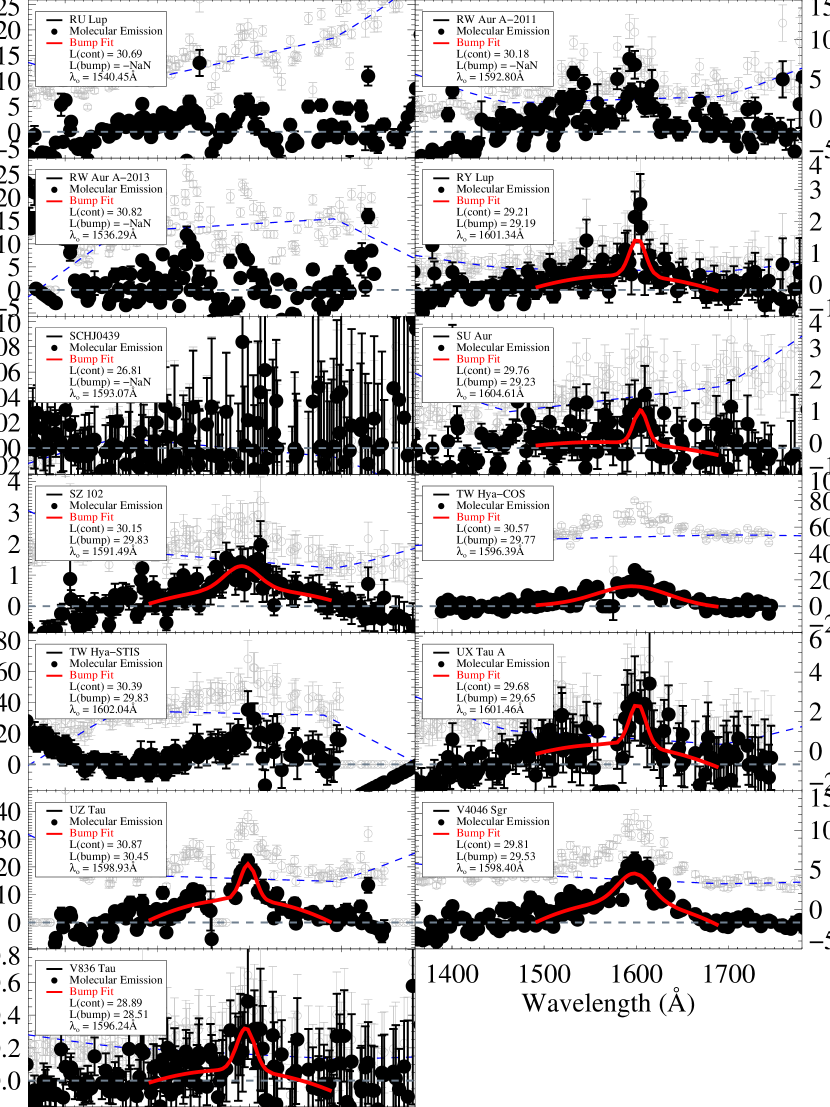
| Target | d | A | A | M∗ | aa (1) Akeson et al. (2002); (2) Andrews & Williams (2007); (3) Bertout et al. (1988); (4) Bouvier et al. (1999); (5) Pascucci et al. (2013); (6) France et al. (2011a); (7) Gullbring et al. (1998); (8) Gullbring et al. (2000); (9) Hartigan et al. (1995); (10) Johns-Krull & Valenti (2001); (11) Johns-Krull et al. (2000); (12) Kraus & Hillenbrand (2009); (13) Lawson et al. (2004); (14) Luhman & Steeghs (2004); (15) Ramsay Howat & Greaves (2007); (16) Ricci et al. (2010); (17) White & Ghez (2001); (18) van den Ancker et al. (1998); (19) van Boekel et al. (2005); (20) Alencar et al. (2003); (21) Calvet et al. (2005); (22) Ingleby et al. (2014); (23) Manset et al. (2009); (24) Lawson et al. (2001); (25) Herczeg et al. (2005); (26) Comerón & Fernández (2010); (27) Webb et al. (1999); (28) Quast et al. (2000); (29) Hartmann et al. (1998); (30) Herczeg & Hillenbrand (2008); (31) Garcia Lopez et al. (2006); (32) Andrews et al. (2011); (33) France et al. (2011b); (34) Gómez de Castro (2009); (35) Espaillat et al. (2007); (37) Comerón et al. (2003); (38) Simon et al. (2000); (39) Muzerolle et al. (2003); (40) Espaillat et al. (2010); (41) Stempels et al. (2007); (42) Pontoppidan et al. (2008); (43) Coffey et al. (2004); (44) Rodriguez et al. (2010); (45) Grady et al. (2004); (46) Najita et al. (2008); (47) Ingleby et al. (2011b); (48) Hughes et al. (1994); (58) Bertout et al. (1999); (59) Loinard et al. (2007); (60) Luhman (2004); (61) Mamajek et al. (1999); (62) van Leeuwen (2007); (64) Grady et al. (2009); (70) Güdel et al. (2007); (71) Schneider et al. (2015a); (72) Schneider et al. (2015b); (73) McJunkin et al. (2014); (74) Gómez de Castro et al. (2013); (75) Gizis & Bharat (2004); (76) Günther & Schmitt (2007); (77) López-Santiago et al. (2010); (78) Walter & Kuhi (1981); (79) Getman et al. (2011); (80) Skinner & Güdel (2013); (81) Güdel & Telleschi (2007); (82) Antonellini et al. (2016); (83) Güdel et al. (2010); (84) Ingleby et al. (2011a); | Ref.aa (1) Akeson et al. (2002); (2) Andrews & Williams (2007); (3) Bertout et al. (1988); (4) Bouvier et al. (1999); (5) Pascucci et al. (2013); (6) France et al. (2011a); (7) Gullbring et al. (1998); (8) Gullbring et al. (2000); (9) Hartigan et al. (1995); (10) Johns-Krull & Valenti (2001); (11) Johns-Krull et al. (2000); (12) Kraus & Hillenbrand (2009); (13) Lawson et al. (2004); (14) Luhman & Steeghs (2004); (15) Ramsay Howat & Greaves (2007); (16) Ricci et al. (2010); (17) White & Ghez (2001); (18) van den Ancker et al. (1998); (19) van Boekel et al. (2005); (20) Alencar et al. (2003); (21) Calvet et al. (2005); (22) Ingleby et al. (2014); (23) Manset et al. (2009); (24) Lawson et al. (2001); (25) Herczeg et al. (2005); (26) Comerón & Fernández (2010); (27) Webb et al. (1999); (28) Quast et al. (2000); (29) Hartmann et al. (1998); (30) Herczeg & Hillenbrand (2008); (31) Garcia Lopez et al. (2006); (32) Andrews et al. (2011); (33) France et al. (2011b); (34) Gómez de Castro (2009); (35) Espaillat et al. (2007); (37) Comerón et al. (2003); (38) Simon et al. (2000); (39) Muzerolle et al. (2003); (40) Espaillat et al. (2010); (41) Stempels et al. (2007); (42) Pontoppidan et al. (2008); (43) Coffey et al. (2004); (44) Rodriguez et al. (2010); (45) Grady et al. (2004); (46) Najita et al. (2008); (47) Ingleby et al. (2011b); (48) Hughes et al. (1994); (58) Bertout et al. (1999); (59) Loinard et al. (2007); (60) Luhman (2004); (61) Mamajek et al. (1999); (62) van Leeuwen (2007); (64) Grady et al. (2009); (70) Güdel et al. (2007); (71) Schneider et al. (2015a); (72) Schneider et al. (2015b); (73) McJunkin et al. (2014); (74) Gómez de Castro et al. (2013); (75) Gizis & Bharat (2004); (76) Günther & Schmitt (2007); (77) López-Santiago et al. (2010); (78) Walter & Kuhi (1981); (79) Getman et al. (2011); (80) Skinner & Güdel (2013); (81) Güdel & Telleschi (2007); (82) Antonellini et al. (2016); (83) Güdel et al. (2010); (84) Ingleby et al. (2011a); | |
|---|---|---|---|---|---|---|---|
| (pc) | (mag) | (mag) | (M⊙) | (10-8 M⊙ yr-1) | (1030 erg s-1) | ||
| 2M1207 | 52 | 0.00 | 0.00 | 0.04 | 0.00 | 0.00 | 75 |
| AA Tau-2011 | 140 | 0.50 | 0.34 | 0.80 | 0.33 | 1.00 | 2,4,7,12,16,58,59,83? |
| AA Tau-2013 | 140 | 0.50 | 0.34 | 0.80 | 0.33 | 0.22 | 2,4,7,12,16,58,59,71 |
| AK Sco | 103 | 0.50 | 0.08 | 1.35 | 0.09 | 0.10 | 18,20,34,62,74 |
| BP Tau | 140 | 0.50 | 0.17 | 0.73 | 2.88 | 1.40 | 7,12,38,58,59,83 |
| CS Cha | 160 | 0.80 | 0.16 | 1.05 | 1.20 | 2.57 | 21,35,60,73 |
| CSVO107 | 450 | 0.32 | 0.32 | 0.80 | 1.09 | -1.00 | 21,22,84 |
| CSVO109 | 450 | 0.00 | 0.00 | 0.60 | 2.52 | -1.00 | 21,22,84 |
| CSVO58 | 450 | 0.12 | 0.12 | 0.80 | 0.45 | -1.00 | 21,22,84 |
| CSVO90 | 450 | 0.00 | 0.00 | 0.50 | 1.77 | -1.00 | 21,22,84 |
| DE Tau | 140 | 0.60 | 0.31 | 0.59 | 2.64 | 0.90 | 7,10,12,58,59,78 |
| DF Tau A | 140 | 0.60 | 0.54 | 0.19 | 17.70 | 0.67 | 7,10,58,59,78 |
| DK Tau A | 140 | 0.80 | 0.46 | 0.71 | 3.79 | 0.84 | 7,10,12,58,59,83 |
| DM Tau | 140 | 0.00 | 0.48 | 0.50 | 0.29 | 2.00 | 16,29,32,58,59,83 |
| DN Tau | 140 | 1.90 | 0.18 | 0.60 | 0.35 | 1.10 | 7,16,32,39,58,59,83 |
| DQ Tau | 140 | 0.70 | 0.70 | 0.60 | 2.50 | 1.00 | 79 |
| DR Tau | 140 | 3.20 | 0.48 | 0.80 | 3.16 | 0.40 | 2,8,16,58,59,73 |
| GM Aur | 140 | 0.10 | 0.51 | 1.20 | 0.96 | 0.69 | 7,16,32,58,59,73 |
| HD 135344B | 140 | 0.30 | 0.12 | 1.60 | 0.54 | 0.28 | 19,31,42,64,73 |
| HN Tau A | 140 | 0.50 | 0.36 | 0.85 | 0.13 | 0.32 | 6,7,12,58,59,83 |
| IP Tau | 140 | 0.20 | 0.72 | 0.68 | 0.08 | 1.26 | 7,12,58,59,73 |
| LkCa 15 | 140 | 0.60 | 0.31 | 0.85 | 0.13 | 2.50 | 12,29,32,58,59,80 |
| OB1A1192 | 450 | 0.85 | 0.85 | 0.77 | 0.17 | 0.83 | 21,22,84 |
| OB1A1630 | 450 | 0.00 | 0.00 | 0.40 | 0.08 | 0.04 | 21,22,84 |
| OB1A776 | 450 | 0.60 | 0.60 | 0.80 | 0.74 | 0.13 | 21,22,84 |
| RECX-11 | 97 | 0.00 | 0.03 | 0.80 | 0.03 | 3.20 | 13,24,47,61,77 |
| RECX-15-2011 | 97 | 0.00 | 0.02 | 0.40 | 0.10 | 0.06 | 13,14,15,61,77 |
| RECX-15-2013 | 97 | 0.00 | 0.02 | 0.40 | 0.10 | 0.06 | 13,14,15,61,77 |
| RU Lup | 120 | 0.07 | 0.07 | 0.80 | 3.00 | 1.40 | 25,30,41,62,81 |
| RW Aur A-2011 | 140 | 1.60 | 0.11 | 1.40 | 3.16 | 0.39 | 5,9,11,12,17,58,59,73 |
| RW Aur A-2013 | 140 | 1.60 | 0.11 | 1.40 | 3.16 | 1.60 | 5,9,11,12,17,58,59,72 |
| RY Lup | 120 | 0.40 | 0.10 | 1.71 | 1.00 | 9.80 | 23, 82 |
| SCHJ0439 | 140 | 0.00 | 0.00 | 0.08 | 0.01 | -1.00 | 5 |
| SU Aur | 140 | 0.90 | 0.29 | 2.30 | 0.45 | 11.64 | 1,3,8,11,12,58,59,70 |
| SZ 102 | 200 | 1.13 | 0.24 | 0.75 | 0.08 | 0.18 | 26,37,43,48,83 |
| TW Hya-COS | 56 | 0.00 | 0.00 | 0.60 | 0.02 | 2.00 | 27,30,42,62,76 |
| TW Hya-STIS | 56 | 0.00 | 0.00 | 0.60 | 0.02 | 2.00 | 27,30,42,62,76 |
| UX Tau A | 140 | 0.20 | 0.51 | 1.30 | 1.00 | 2.00 | 12,32,58,59,73 |
| UZ Tau | 140 | 1.50 | 1.50 | 0.60 | 3.00 | 0.74 | 70 |
| V4046 Sgr | 83 | 0.00 | 0.00 | 0.86 | 1.30 | 2.00 | 28,33,44,76 |
| V836 Tau | 140 | 1.70 | 0.38 | 0.75 | 0.01 | 1.70 | 12,30,46,58,59,83 |
| Target | (Bump) | bbThe Bump spectra are parameterized by a Central Gaussian and a second-order polynomial, fitted over 1520 – 1670 Å bandpass. The central wavelength () and full-width at half-maximum () refer to the Central Gaussian component. | bbThe Bump spectra are parameterized by a Central Gaussian and a second-order polynomial, fitted over 1520 – 1670 Å bandpass. The central wavelength () and full-width at half-maximum () refer to the Central Gaussian component. | (Cont) | (C IV)bbThe Bump spectra are parameterized by a Central Gaussian and a second-order polynomial, fitted over 1520 – 1670 Å bandpass. The central wavelength () and full-width at half-maximum () refer to the Central Gaussian component. | (H2) | (Ly)ccIntrinsic Ly luminosity values with error bars were taken from the literature (Schindhelm et al., 2012b; France et al., 2014b). Ly values without error bars were extrapolated from direct H2 fluorescence measurements based on the (Ly) vs. (H2) relationship (see Section 3.1.2). |
|---|---|---|---|---|---|---|---|
| (1029 erg s-1) | (Å) | (Å) | (1029 erg s-1) | (1029 erg s-1) | (1029 erg s-1) | (1029 erg s-1) | |
| 2M1207 | 0.00 0.00 | 1639.15 2.75 | -8.60 8.03 | 0.00 | 0.01 | 0.01 0.00 | 0.21 |
| AA Tau-2011ddThe 24 spectra with visually-defined Bumps (stars with FWHM 0, except CSVO109, DK Tau, DR Tau, and TW Hya-STIS, plus DN Tau, DQ Tau, and LkCa15; Section 3.1.1). These spectra are the solid black diamonds in Figures 4, 5, 7, and 8. | 5.93 0.91 | 1601.20 1.62 | 42.17 4.82 | 7.52 | 4.34 | 24.15 1.60 | 385.32 69.01 |
| AA Tau-2013ddThe 24 spectra with visually-defined Bumps (stars with FWHM 0, except CSVO109, DK Tau, DR Tau, and TW Hya-STIS, plus DN Tau, DQ Tau, and LkCa15; Section 3.1.1). These spectra are the solid black diamonds in Figures 4, 5, 7, and 8. | 3.03 0.62 | 1597.07 2.07 | 32.91 4.99 | 2.61 | 0.44 | 18.67 0.89 | 247.42 |
| AK Sco | 6.68 1.15 | 1564.92 3.61 | -72.44 9.56 | 3.32 | 6.05 | 1.74 0.24 | 19.34 |
| BP TauddThe 24 spectra with visually-defined Bumps (stars with FWHM 0, except CSVO109, DK Tau, DR Tau, and TW Hya-STIS, plus DN Tau, DQ Tau, and LkCa15; Section 3.1.1). These spectra are the solid black diamonds in Figures 4, 5, 7, and 8. | 10.20 2.28 | 1594.74 1.47 | 18.29 3.28 | 35.80 | 18.60 | 18.18 1.98 | 159.10 28.20 |
| CS ChaddThe 24 spectra with visually-defined Bumps (stars with FWHM 0, except CSVO109, DK Tau, DR Tau, and TW Hya-STIS, plus DN Tau, DQ Tau, and LkCa15; Section 3.1.1). These spectra are the solid black diamonds in Figures 4, 5, 7, and 8. | 5.76 1.70 | 1600.85 3.07 | 38.95 8.55 | 11.50 | 4.47 | 12.81 0.87 | 131.32 |
| CSVO107 | 1.11 11.80 | 1676.18 0.49 | -0.80 2.00 | 189 | 24.50 | 50.99 2.41 | 742.57 |
| CSVO109 | 2.96 3.38 | 1592.38 11.12 | 104.28 63.07 | 38.60 | 23.60 | 18.39 1.07 | 267.81 |
| CSVO58 | 2.05 4.66 | 1647.90 1.08 | -3.06 2.52 | 38.90 | 11.10 | 12.40 0.82 | 180.57 |
| CSVO90ddThe 24 spectra with visually-defined Bumps (stars with FWHM 0, except CSVO109, DK Tau, DR Tau, and TW Hya-STIS, plus DN Tau, DQ Tau, and LkCa15; Section 3.1.1). These spectra are the solid black diamonds in Figures 4, 5, 7, and 8. | 4.42 3.09 | 1599.99 4.55 | 21.81 12.24 | 42.70 | 16.30 | 26.83 2.04 | 390.72 |
| DE TauddThe 24 spectra with visually-defined Bumps (stars with FWHM 0, except CSVO109, DK Tau, DR Tau, and TW Hya-STIS, plus DN Tau, DQ Tau, and LkCa15; Section 3.1.1). These spectra are the solid black diamonds in Figures 4, 5, 7, and 8. | 1.77 0.66 | 1602.57 4.55 | 63.62 17.81 | 6.78 | 3.96 | 5.99 0.89 | 91.32 26.80 |
| DF Tau AddThe 24 spectra with visually-defined Bumps (stars with FWHM 0, except CSVO109, DK Tau, DR Tau, and TW Hya-STIS, plus DN Tau, DQ Tau, and LkCa15; Section 3.1.1). These spectra are the solid black diamonds in Figures 4, 5, 7, and 8. | 28.10 3.93 | 1597.60 0.69 | 19.18 1.91 | 60.10 | 20.80 | 73.74 3.54 | 1041.73 |
| DK Tau A | 2.03 1.34 | 1595.69 3.38 | 14.24 7.00 | 9.25 | 2.14 | 4.72 0.27 | 58.53 |
| DM TauddThe 24 spectra with visually-defined Bumps (stars with FWHM 0, except CSVO109, DK Tau, DR Tau, and TW Hya-STIS, plus DN Tau, DQ Tau, and LkCa15; Section 3.1.1). These spectra are the solid black diamonds in Figures 4, 5, 7, and 8. | 7.80 2.33 | 1595.17 3.29 | 57.42 13.03 | 14.80 | 6.16 | 62.04 4.48 | 933.74 102.58 |
| DN TauddThe 24 spectra with visually-defined Bumps (stars with FWHM 0, except CSVO109, DK Tau, DR Tau, and TW Hya-STIS, plus DN Tau, DQ Tau, and LkCa15; Section 3.1.1). These spectra are the solid black diamonds in Figures 4, 5, 7, and 8. | 1.41 1.76 | 1629.61 0.47 | -1.73 1.87 | 4.91 | 4.69 | 0.05 0.01 | 0.40 |
| DQ TauddThe 24 spectra with visually-defined Bumps (stars with FWHM 0, except CSVO109, DK Tau, DR Tau, and TW Hya-STIS, plus DN Tau, DQ Tau, and LkCa15; Section 3.1.1). These spectra are the solid black diamonds in Figures 4, 5, 7, and 8. | 2.15 0.56 | 1548.37 0.72 | -4.21 0.57 | 3.47 | 2.59 | 5.45 1.50 | 79.36 |
| DR Tau | 1.18 0.18 | 1597.79 0.57 | 11.24 1.29 | 44.50 | 6.09 | 17.84 2.01 | 31.73 |
| GM AurddThe 24 spectra with visually-defined Bumps (stars with FWHM 0, except CSVO109, DK Tau, DR Tau, and TW Hya-STIS, plus DN Tau, DQ Tau, and LkCa15; Section 3.1.1). These spectra are the solid black diamonds in Figures 4, 5, 7, and 8. | 15.60 5.47 | 1596.07 2.12 | 19.83 5.36 | 38.10 | 20.50 | 93.67 9.11 | 1880.25 462.67 |
| HD 135344B | 1.87 0.54 | 1550.10 1.29 | -15.46 2.74 | 20.60 | 17.60 | 7.59 0.65 | 97.88 |
| HN Tau AddThe 24 spectra with visually-defined Bumps (stars with FWHM 0, except CSVO109, DK Tau, DR Tau, and TW Hya-STIS, plus DN Tau, DQ Tau, and LkCa15; Section 3.1.1). These spectra are the solid black diamonds in Figures 4, 5, 7, and 8. | 4.59 1.35 | 1594.86 3.39 | 42.24 9.57 | 10.20 | 1.89 | 10.71 0.62 | 158.68 31.15 |
| IP Tau | 2.47 3.87 | 1600.15 2.92 | -5.76 5.63 | 5.35 | 4.20 | 35.20 1.76 | 686.45 |
| LkCa 15ddThe 24 spectra with visually-defined Bumps (stars with FWHM 0, except CSVO109, DK Tau, DR Tau, and TW Hya-STIS, plus DN Tau, DQ Tau, and LkCa15; Section 3.1.1). These spectra are the solid black diamonds in Figures 4, 5, 7, and 8. | 1.93 1.25 | 1543.79 3.04 | -10.25 5.84 | 5.12 | 4.61 | 7.27 0.39 | 101.98 16.79 |
| OB1A1192 | 4.17 2.47 | 1600.32 1.33 | -5.66 4.37 | 12.80 | 9.53 | 17.64 1.84 | 256.89 |
| OB1A1630 | 1.91 36.70 | 1629.61 3.87 | -1.69 21.38 | 11.50 | 6.76 | 15.73 1.41 | 229.07 |
| OB1A776 | 2.48 7.59 | 1593.99 2.68 | -3.09 5.08 | 63.60 | 14.50 | 22.43 1.50 | 326.64 |
| RECX-11ddThe 24 spectra with visually-defined Bumps (stars with FWHM 0, except CSVO109, DK Tau, DR Tau, and TW Hya-STIS, plus DN Tau, DQ Tau, and LkCa15; Section 3.1.1). These spectra are the solid black diamonds in Figures 4, 5, 7, and 8. | 0.54 0.18 | 1602.56 1.52 | 16.09 3.53 | 1.16 | 1.88 | 2.11 0.11 | 66.28 4.43 |
| RECX-15-2011ddThe 24 spectra with visually-defined Bumps (stars with FWHM 0, except CSVO109, DK Tau, DR Tau, and TW Hya-STIS, plus DN Tau, DQ Tau, and LkCa15; Section 3.1.1). These spectra are the solid black diamonds in Figures 4, 5, 7, and 8. | 1.06 0.19 | 1600.19 2.20 | 55.34 7.52 | 1.51 | 0.38 | 5.80 0.32 | 142.24 19.39 |
| RECX-15-2013ddThe 24 spectra with visually-defined Bumps (stars with FWHM 0, except CSVO109, DK Tau, DR Tau, and TW Hya-STIS, plus DN Tau, DQ Tau, and LkCa15; Section 3.1.1). These spectra are the solid black diamonds in Figures 4, 5, 7, and 8. | 1.08 0.25 | 1598.95 2.72 | 48.63 8.40 | 1.61 | 0.43 | 5.14 0.59 | 75.96 |
| RU Lup | 5.54 1.59 | 1540.45 0.61 | -8.01 1.82 | 49.40 | 7.68 | 27.20 15.20 | 653.30 148.30 |
| RW Aur A-2011 | 10.10 3.51 | 1592.80 0.39 | -5.50 1.43 | 15.00 | 1.78 | 0.77 0.21 | 6.56 |
| RW Aur A-2013 | 3.29 0.30 | 1536.29 0.32 | -11.00 0.80 | 66.60 | 5.95 | 1.04 0.57 | 8.79 |
| RY LupddThe 24 spectra with visually-defined Bumps (stars with FWHM 0, except CSVO109, DK Tau, DR Tau, and TW Hya-STIS, plus DN Tau, DQ Tau, and LkCa15; Section 3.1.1). These spectra are the solid black diamonds in Figures 4, 5, 7, and 8. | 1.55 0.80 | 1601.34 2.65 | 20.52 7.20 | 1.61 | 1.22 | 3.05 0.36 | 36.47 |
| SCHJ0439 | 0.00 0.00 | 1593.07 0.84 | -1.83 1.32 | 0.01 | 0.02 | 0.10 0.01 | 1.46 |
| SU AurddThe 24 spectra with visually-defined Bumps (stars with FWHM 0, except CSVO109, DK Tau, DR Tau, and TW Hya-STIS, plus DN Tau, DQ Tau, and LkCa15; Section 3.1.1). These spectra are the solid black diamonds in Figures 4, 5, 7, and 8. | 1.70 1.05 | 1604.61 3.68 | 17.78 8.13 | 5.72 | 4.06 | 2.53 0.28 | 41.60 9.81 |
| SZ 102ddThe 24 spectra with visually-defined Bumps (stars with FWHM 0, except CSVO109, DK Tau, DR Tau, and TW Hya-STIS, plus DN Tau, DQ Tau, and LkCa15; Section 3.1.1). These spectra are the solid black diamonds in Figures 4, 5, 7, and 8. | 6.72 3.53 | 1591.49 5.61 | 42.99 18.09 | 14.10 | 7.36 | 3.55 0.25 | 35.01 |
| TW Hya-COSddThe 24 spectra with visually-defined Bumps (stars with FWHM 0, except CSVO109, DK Tau, DR Tau, and TW Hya-STIS, plus DN Tau, DQ Tau, and LkCa15; Section 3.1.1). These spectra are the solid black diamonds in Figures 4, 5, 7, and 8. | 5.88 1.71 | 1596.39 1.78 | 87.29 13.22 | 37.60 | 8.91 | 12.44 1.57 | 181.16 |
| TW Hya-STIS | 6.81 4.03 | 1602.04 1.60 | 10.09 3.79 | 24.70 | 17.20 | 16.80 2.00 | 199.60 34.30 |
| UX Tau AddThe 24 spectra with visually-defined Bumps (stars with FWHM 0, except CSVO109, DK Tau, DR Tau, and TW Hya-STIS, plus DN Tau, DQ Tau, and LkCa15; Section 3.1.1). These spectra are the solid black diamonds in Figures 4, 5, 7, and 8. | 4.44 3.17 | 1601.46 4.01 | 21.29 11.28 | 4.78 | 5.00 | 43.90 4.39 | 617.25 51.89 |
| UZ TauddThe 24 spectra with visually-defined Bumps (stars with FWHM 0, except CSVO109, DK Tau, DR Tau, and TW Hya-STIS, plus DN Tau, DQ Tau, and LkCa15; Section 3.1.1). These spectra are the solid black diamonds in Figures 4, 5, 7, and 8. | 28.30 5.09 | 1598.93 0.94 | 19.51 2.68 | 74.20 | 26.90 | 174.82 0.30 | 2545.92 |
| V4046 SgrddThe 24 spectra with visually-defined Bumps (stars with FWHM 0, except CSVO109, DK Tau, DR Tau, and TW Hya-STIS, plus DN Tau, DQ Tau, and LkCa15; Section 3.1.1). These spectra are the solid black diamonds in Figures 4, 5, 7, and 8. | 3.36 0.42 | 1598.40 1.34 | 42.24 3.85 | 6.50 | 4.55 | 19.80 0.90 | 383.30 42.10 |
| V836 TauddThe 24 spectra with visually-defined Bumps (stars with FWHM 0, except CSVO109, DK Tau, DR Tau, and TW Hya-STIS, plus DN Tau, DQ Tau, and LkCa15; Section 3.1.1). These spectra are the solid black diamonds in Figures 4, 5, 7, and 8. | 0.33 0.27 | 1596.24 5.55 | 22.86 14.78 | 0.77 | 0.76 | 0.12 0.01 | 1.18 0.00 |
| [,] | Electronic Bandaa ‘Ly’ refers to the – electronic transition system, ‘Wp’ and ‘Wm’ refer to the – electronic transition systems, where the ‘p’ and ‘m’ distinguish the and states, respectively. | ( – ) | bb is the molecular dissociation probability following absorption into the [,] level of the upper electronic state, = . | |||
|---|---|---|---|---|---|---|
| (Å) | (107 s-1) | (% ) | ||||
| 1217.72 | 5.43 | Ly | (5 – 0) | P(20) | 47.6 | |
| 1218.84 | 6.12 | Ly | (6 – 0) | P(21) | 51.8 | |
| 1214.94 | 7.77 | Ly | (9 – 0) | R(24) | 61.6 | |
| 1214.16 | 5.72 | Ly | (10 – 0) | P(24) | 60.9 | |
| 1212.92 | 4.08 | Ly | (10 – 2) | R(19) | 59.6 | |
| 1214.17 | 4.32 | Ly | (11 – 2) | R(20) | 61.6 | |
| 1213.52 | 4.85 | Ly | (11 – 3) | P(16) | 48.4 | |
| 1214.57 | 4.74 | Wp | (0 – 3) | P(16) | 5.5 | |
| 1213.33 | 2.94 | Ly | (12 – 3) | P(17) | 57.9 | |
| 1213.84 | 3.12 | Ly | (13 – 3) | P(18) | 61.4 | |
| 1216.70 | 17.85 | Wm | (0 – 3) | Q(18) | 0.0 | |
| 1213.32 | 2.59 | Ly | (11 – 4) | R(13) | 55.5 | |
| 1214.57 | 13.77 | Wp | (1 – 4) | P(14) | 1.1 | |
| 1216.93 | 32.07 | Wm | (1 – 4) | Q(16) | 0.0 | |
| 1219.45 | 3.94 | Ly | (11 – 5) | P(8) | 52.3 | |
| 1214.62 | 10.16 | Wp | (1 – 5) | R(8) | 13.4 | |
| 1213.39 | 4.06 | Ly | (12 – 5) | P(9) | 51.9 | |
| 1217.00 | 8.02 | Wp | (1 – 5) | R(9) | 1.7 | |
| 1217.37 | 3.68 | Ly | (13 – 5) | P(11) | 55.7 | |
| 1215.93 | 16.27 | Wp | (2 – 5) | P(12) | 6.7 | |
| 1213.07 | 32.75 | Wm | (2 – 5) | Q(13) | 0.0 |
| , (107 s-1) | Electronic Bandaa‘Ly’ refers to the – …see Table 3. | ( – ) | bbThe branching ratio is the ratio of the line transition probability to the total transition probability out of state [,], = | Detection | ||
|---|---|---|---|---|---|---|
| 1217.72 | 5.43 | Ly | (5 – 0) | P(20) | 0.05 | Ly-pump |
| 1176.07 | 5.08 | Ly | (5 – 0) | R(18) | 0.04 | C IIIccBlends with other atomic or molecular emission lines prevent reliable detection. C III is the 1175 Å multiplet, C II is the 1335 Å multiplet, and CO is the – (14 – 3) fluorescence band. ‘Thermal’ indicates that emission lines produced by Ly fluorescence from (H2) 2500 K. |
| 1265.82 | 6.79 | Ly | (5 – 1) | P(20) | 0.06 | ThermalccBlends with other atomic or molecular emission lines prevent reliable detection. C III is the 1175 Å multiplet, C II is the 1335 Å multiplet, and CO is the – (14 – 3) fluorescence band. ‘Thermal’ indicates that emission lines produced by Ly fluorescence from (H2) 2500 K. |
| 1223.42 | 10.30 | Ly | (5 – 1) | R(18) | 0.09 | ThermalccBlends with other atomic or molecular emission lines prevent reliable detection. C III is the 1175 Å multiplet, C II is the 1335 Å multiplet, and CO is the – (14 – 3) fluorescence band. ‘Thermal’ indicates that emission lines produced by Ly fluorescence from (H2) 2500 K. |
| 1361.61 | 5.21 | Ly | (5 – 3) | P(20) | 0.05 | Y |
| 1318.66 | 2.98 | Ly | (5 – 3) | R(18) | 0.03 | COccBlends with other atomic or molecular emission lines prevent reliable detection. C III is the 1175 Å multiplet, C II is the 1335 Å multiplet, and CO is the – (14 – 3) fluorescence band. ‘Thermal’ indicates that emission lines produced by Ly fluorescence from (H2) 2500 K. |
| 1365.53 | 4.49 | Ly | (5 – 4) | R(18) | 0.04 | Y |
| 1452.19 | 4.14 | Ly | (5 – 5) | P(20) | 0.04 | Y |
| 1453.80 | 4.23 | Ly | (5 – 6) | R(18) | 0.04 | Y/N |
| 1528.18 | 4.05 | Ly | (5 – 7) | P(20) | 0.04 | Y/N |
| 1260.14 | 6.20 | Ly | (9 – 0) | P(26) | 0.07 | N |
| 1214.94 | 7.77 | Ly | (9 – 0) | R(24) | 0.09 | Ly-pump |
| 1256.96 | 2.72 | Ly | (9 – 1) | R(24) | 0.03 | ThermalccBlends with other atomic or molecular emission lines prevent reliable detection. C III is the 1175 Å multiplet, C II is the 1335 Å multiplet, and CO is the – (14 – 3) fluorescence band. ‘Thermal’ indicates that emission lines produced by Ly fluorescence from (H2) 2500 K. |
| 1342.23 | 3.54 | Ly | (9 – 2) | P(26) | 0.04 | ThermalccBlends with other atomic or molecular emission lines prevent reliable detection. C III is the 1175 Å multiplet, C II is the 1335 Å multiplet, and CO is the – (14 – 3) fluorescence band. ‘Thermal’ indicates that emission lines produced by Ly fluorescence from (H2) 2500 K. |
| 1298.00 | 2.59 | Ly | (9 – 2) | R(24) | 0.03 | N |
| 1373.95 | 2.82 | Ly | (9 – 4) | R(24) | 0.03 | Y |
| 1214.16 | 5.72 | Ly | (10 – 0) | P(24) | 0.07 | Ly-pump |
| 1171.89 | 8.47 | Ly | (10 – 0) | R(22) | 0.10 | ThermalccBlends with other atomic or molecular emission lines prevent reliable detection. C III is the 1175 Å multiplet, C II is the 1335 Å multiplet, and CO is the – (14 – 3) fluorescence band. ‘Thermal’ indicates that emission lines produced by Ly fluorescence from (H2) 2500 K. |
| 1297.10 | 3.22 | Ly | (10 – 2) | P(24) | 0.04 | Y/N |
| 1255.02 | 3.73 | Ly | (10 – 2) | R(22) | 0.04 | N |
| 1333.54 | 3.27 | Ly | (10 – 4) | R(22) | 0.04 | C IIccBlends with other atomic or molecular emission lines prevent reliable detection. C III is the 1175 Å multiplet, C II is the 1335 Å multiplet, and CO is the – (14 – 3) fluorescence band. ‘Thermal’ indicates that emission lines produced by Ly fluorescence from (H2) 2500 K. |
| 1166.90 | 5.52 | Ly | (10 – 0) | P(21) | 0.06 | N |
| 1252.19 | 3.38 | Ly | (10 – 2) | P(21) | 0.04 | N |
| 1212.92 | 4.08 | Ly | (10 – 2) | R(19) | 0.05 | Ly-pump |
| 1295.68 | 3.50 | Ly | (10 – 4) | R(19) | 0.04 | Y/N |
| 1170.71 | 4.92 | Ly | (11 – 0) | P(22) | 0.06 | Y/N |
| 1214.17 | 4.32 | Ly | (11 – 2) | R(20) | 0.05 | Ly-pump |
| 1294.03 | 3.10 | Ly | (11 – 4) | R(20) | 0.04 | ThermalccBlends with other atomic or molecular emission lines prevent reliable detection. C III is the 1175 Å multiplet, C II is the 1335 Å multiplet, and CO is the – (14 – 3) fluorescence band. ‘Thermal’ indicates that emission lines produced by Ly fluorescence from (H2) 2500 K. |
| 1213.52 | 4.85 | Ly | (11 – 3) | P(16) | 0.05 | Ly-pump |
| 1171.88 | 21.99 | Wp | (0 – 2) | P(16) | 0.20 | ThermalccBlends with other atomic or molecular emission lines prevent reliable detection. C III is the 1175 Å multiplet, C II is the 1335 Å multiplet, and CO is the – (14 – 3) fluorescence band. ‘Thermal’ indicates that emission lines produced by Ly fluorescence from (H2) 2500 K. |
| 1214.57 | 4.74 | Wp | (0 – 3) | P(16) | 0.04 | Ly-pump |
| 1182.36 | 10.48 | Wp | (0 – 3) | R(14) | 0.10 | Y |
| 1224.62 | 4.72 | Wp | (0 – 4) | R(14) | 0.04 | N |
| 1213.33 | 2.94 | Ly | (12 – 3) | P(17) | 0.03 | Ly-pump |
| 1213.84 | 3.12 | Ly | (13 – 3) | P(18) | 0.04 | Ly-pump |
| 1259.07 | 2.73 | Ly | (13 – 5) | R(16) | 0.03 | N |
| 1176.08 | 37.68 | Wm | (0 – 2) | Q(18) | 0.34 | C III |
| 1216.70 | 17.85 | Wm | (0 – 3) | Q(18) | 0.16 | Ly-pump |
| 1256.48 | 3.76 | Wm | (0 – 4) | Q(18) | 0.03 | N |
| 1213.32 | 2.59 | Ly | (11 – 4) | R(13) | 0.03 | Ly-pump |
| 1285.78 | 2.51 | Ly | (11 – 5) | P(15) | 0.03 | Y |
| 1172.99 | 15.19 | Wp | (1 – 3) | P(14) | 0.14 | Y |
| 1214.57 | 13.77 | Wp | (1 – 4) | P(14) | 0.12 | Ly-pump |
| 1186.23 | 17.36 | Wp | (1 – 4) | R(12) | 0.16 | Y |
| 1255.51 | 5.65 | Wp | (1 – 5) | P(14) | 0.05 | Blend |
| 1227.32 | 8.07 | Wp | (1 – 5) | R(12) | 0.07 | ThermalccBlends with other atomic or molecular emission lines prevent reliable detection. C III is the 1175 Å multiplet, C II is the 1335 Å multiplet, and CO is the – (14 – 3) fluorescence band. ‘Thermal’ indicates that emission lines produced by Ly fluorescence from (H2) 2500 K. |
| 1177.27 | 24.92 | Wm | (1 – 3) | Q(16) | 0.23 | C III |
| 1216.93 | 32.07 | Wm | (1 – 4) | Q(16) | 0.29 | Ly-pump |
| 1255.58 | 11.72 | Wm | (1 – 5) | Q(16) | 0.11 | Blend |
| 1193.34 | 13.19 | Wp | (1 – 4) | P(10) | 0.12 | ThermalccBlends with other atomic or molecular emission lines prevent reliable detection. C III is the 1175 Å multiplet, C II is the 1335 Å multiplet, and CO is the – (14 – 3) fluorescence band. ‘Thermal’ indicates that emission lines produced by Ly fluorescence from (H2) 2500 K. |
| 1171.32 | 7.04 | Wp | (1 – 4) | R(8) | 0.06 | Y/N |
| 1214.62 | 10.16 | Wp | (1 – 5) | R(8) | 0.09 | Ly-pump |
| 1213.39 | 4.06 | Ly | (12 – 5) | P(9) | 0.04 | Ly-pump |
| 1277.23 | 2.93 | Ly | (12 – 7) | R(7) | 0.03 | Y/N |
| 1154.91 | 14.12 | Wp | (1 – 3) | P(11) | 0.12 | ThermalccBlends with other atomic or molecular emission lines prevent reliable detection. C III is the 1175 Å multiplet, C II is the 1335 Å multiplet, and CO is the – (14 – 3) fluorescence band. ‘Thermal’ indicates that emission lines produced by Ly fluorescence from (H2) 2500 K. |
| 1197.99 | 12.82 | Wp | (1 – 4) | P(11) | 0.11 | ThermalccBlends with other atomic or molecular emission lines prevent reliable detection. C III is the 1175 Å multiplet, C II is the 1335 Å multiplet, and CO is the – (14 – 3) fluorescence band. ‘Thermal’ indicates that emission lines produced by Ly fluorescence from (H2) 2500 K. |
| 1174.20 | 18.15 | Wp | (1 – 4) | R(9) | 0.16 | C III |
| 1240.87 | 6.12 | Wp | (1 – 5) | P(11) | 0.05 | ThermalccBlends with other atomic or molecular emission lines prevent reliable detection. C III is the 1175 Å multiplet, C II is the 1335 Å multiplet, and CO is the – (14 – 3) fluorescence band. ‘Thermal’ indicates that emission lines produced by Ly fluorescence from (H2) 2500 K. |
| 1217.00 | 8.02 | Wp | (1 – 5) | R(9) | 0.07 | Ly-pump |
| 1217.37 | 3.68 | Ly | (13 – 5) | P(11) | 0.04 | Ly-pump |
| 1175.59 | 6.42 | Wp | (2 – 4) | P(12) | 0.06 | C III |
| 1215.93 | 16.27 | Wp | (2 – 5) | P(12) | 0.15 | Ly-pump |
| 1191.65 | 8.31 | Wp | (2 – 5) | R(10) | 0.08 | Y |
| 1255.38 | 5.13 | Wp | (2 – 6) | P(12) | 0.05 | Blend |
| 1231.39 | 15.04 | Wp | (2 – 6) | R(10) | 0.14 | Y |
| 1269.95 | 3.14 | Wp | (2 – 7) | R(10) | 0.03 | Y/N |
| 1173.83 | 5.17 | Wm | (2 – 4) | Q(13) | 0.05 | Y |
| 1213.07 | 32.75 | Wm | (2 – 5) | Q(13) | 0.30 | Ly-pump |
| 1251.25 | 22.03 | Wm | (2 – 6) | Q(13) | 0.20 | Y |
| 1287.70 | 3.33 | Wm | (2 – 7) | Q(13) | 0.03 | ThermalccBlends with other atomic or molecular emission lines prevent reliable detection. C III is the 1175 Å multiplet, C II is the 1335 Å multiplet, and CO is the – (14 – 3) fluorescence band. ‘Thermal’ indicates that emission lines produced by Ly fluorescence from (H2) 2500 K. |