Onset of a Large Ejective Solar Eruption from a Typical Coronal-Jet-Base Field Configuration
Abstract
Utilizing multiwavelength observations and magnetic field data from SDO/AIA, SDO/HMI, GOES and RHESSI, we investigate a large-scale ejective solar eruption of 2014 December 18 from active region NOAA 12241. This event produced a distinctive “three-ribbon” flare, having two parallel ribbons corresponding to the ribbons of a standard two-ribbon flare, and a larger-scale third quasi-circular ribbon offset from the other two ribbons. There are two components to this eruptive event. First, a flux rope forms above a strong-field polarity-inversion line and erupts and grows as the parallel ribbons turn on, grow, and spread apart from that polarity-inversion line; this evolution is consistent with the tether-cutting-reconnection mechanism for eruptions. Second, the eruption of the arcade that has the erupting flux rope in its core undergoes magnetic reconnection at the null point of a fan dome that envelops the erupting arcade, resulting in formation of the quasi-circular ribbon; this is consistent with the breakout-reconnection mechanism for eruptions. We find that the parallel ribbons begin well before (12 min) circular ribbon onset, indicating that tether-cutting reconnection (or a non-ideal MHD instability) initiated this event, rather than breakout reconnection. The overall setup for this large-scale (circular-ribbon diameter 105 km) eruption is analogous to that of coronal jets (base size 104 km), many of which, according to recent findings, result from eruptions of small-scale “minifilaments.” Thus these findings confirm that eruptions of sheared-core magnetic arcades seated in fan-spine null-point magnetic topology happen on a wide range of size scales on the Sun.
1 Introduction
Solar flares, the most violent explosions on the Sun, are vigorous magnetic energy releases involving magnetic reconnection. The magnetic reconnection results in the formation of flare ribbons in the chromosphere and chromosphere-corona transition region, via the reconnection, a portion of the released energy is converted into kinetic energy of accelerated charged particles and another portion is converted directly into plasma thermal energy (see reviews by Benz, 2008; Shibata & Magara, 2011, and references cited therein). The reconnection starts in the corona, and flare-ribbon formation occurs in the chromosphere immediately after the onset of the reconnection. The ribbon emission results from heating of the chromospheric plasma by the impact of accelerated charged particles/electrons that stream downward from the reconnection region along newly-reconnected field lines, and from heat conduction from the coronal plasma directly heated by the reconnection (see review by Fletcher & Hudson, 2001, and references cited therein). Solar flares can be classified as “confined” or “eruptive/ejective,” based respectively on whether they are or are not produced in tandem with a coronal mass ejection (CME). Several numerical simulation studies investigating the magnetic configuration/topology and the initiation/triggering processes of solar flares have been performed in two-dimensions (2D) and three-dimensions (3D)(see reviews by Schmieder et al., 2015; Janvier et al., 2015, and references cited therein).
One of the well-accepted models for ejective flares is based on a 2D picture and is called “CSHKP,” because it is due to a combination of investigations by Carmichael (1964), Sturrock (1966), Hirayama (1974), and Kopp & Pneuman (1976); this concept, sometimes augmented with additional findings, is also sometimes referred to as “the standard model for solar ejective flares/eruptions.” (In referring to this models for ejective flares/eruptions, we will use the terms “CSHKP” and “standard model” interchangeably in the remainder of the text.) According to this model, the flare reconnection occurs at a vertical current sheet underneath an erupting solar filament/flux rope in the core of a magnetic arcade. As the eruption and reconnection continue, the erupting filament/flux rope becomes progressively more magnetically unleashed from the photosphere and blows out the enveloping arcade to make a CME, while newly-reconnected field below the reconnection region forms strongly-emitting flare loops. Charged particles are accelerated at the reconnection site, and move upward and downward from that site. Those particles directed upward are in reconnected field added to the erupting flux rope. Downward-directed particles flow along the reconnected field lines forming the flare loops, and the chromospheric material in the flare-loop feet impacted by accelerated particles gets heated and appears as bright parallel flare ribbons on either side of the magnetic polarity inversion line (PIL) of the pre-eruption arcade. This kind of flare is commonly referred to as a “two-ribbon solar flare.” Flare events have been observed showing various featurs of this model (e.g., Tsuneta et al., 1997; Shibata, 1999; Benz, 2008; Joshi et al., 2013, 2016b, and references cited therein). This 2D CSHKP model alone however does not explain several 3D characteristics of solar flares, including the sigmoid structure of the erupting region, what initiates the eruption of the flux rope, the evolution of the flare loops from being initially nearly aligned with the PIL to being nearly normal to it, and other aspects. To explain these features, several 3D scenarios have been proposed (Moore & Labonte, 1980; Shibata et al., 1995; Moore et al., 2001; Priest & Forbes, 2002; Shibata & Magara, 2011; Janvier et al., 2015).
Apart from the parallel two-ribbon flares, flares with circular ribbons have also been observed and studied (e.g., Masson et al., 2009; Su et al., 2009; Reid et al., 2012; Wang & Liu, 2012; Sun et al., 2013; Jiang et al., 2013; Wang & Liu, 2014; Jiang et al., 2014; Vemareddy & Wiegelmann, 2014; Joshi et al., 2015). This type of ribbon is believed to result from reconnection at the magnetic null in a typical fan-spine magnetic configuration. This configuration consists of inner and outer fan shells, with the inner shell being a closed dome of loops having one foot in a minority-magnetic-polarity region, and the outer shell being a dominant-magnetic-polarity canopy of far-reaching field sheathing the dome and forming a magnetic spine field that is open or connects to the solar surface at a remote location. These inner and outer fan regions are separated by a separatrix layer, resulting in a magnetic null between the top of the closed inner shell and the open outer shell (see Figure 1 of Pariat et al. (2009) and Sun et al. (2013)). As we will discuss further below, reconnection at the null plausibly results in the circular ribbon. Possibilities for driving magnetic reconnection at this null include eruption of an underlying filament/flux rope from low along the PIL of the closed-field dome (Sun et al., 2013; Jiang et al., 2013, 2014; Joshi et al., 2015, 2016a); and shearing of the dome field lines, making the dome field press on the null (e.g., Vemareddy & Wiegelmann, 2014). Some studies also suggest that quasi-separatrix-layer reconnection in the top of the separatrix layer also can make circular-ribbon flares (e.g., Reid et al., 2012). There are only a few papers that deal with simulations of these kinds of eruptions and null-point reconnections (Masson et al., 2009; Török et al., 2009; Pariat et al., 2009; Jiang et al., 2013).
From observations, we know that the eruption of a filament, sigmoid, and/or flux-rope structure plays a crucial role in driving solar flares. Several models have been suggested for this aspect of solar eruptions and flares. In the “tether-cutting” scenario (Moore & Labonte, 1980; Sturrock et al., 1984; Moore et al., 2001), it was suggested that, initially, shearing and converging photospheric flow brings opposite-polarity legs of a sheared magnetic arcade into contact at a PIL to initiate runaway tether-cutting reconnection. This reconnection forms and/or grows a flux rope above the reconnection location, and this flux rope immediately starts erupting outward. As it does so, the region of the magnetic reconnection above the PIL and below the outward-moving flux rope continues to grow larger and move higher; this is the flare reconnection in the above description of the CSHKP model. Observational events have been observed and interpreted using this model (e.g. Liu et al., 2012, 2013; Chen et al., 2014; Joshi et al., 2014; Xue et al., 2017, and references cited therein).
Another eruption model, called “magnetic breakout” (Antiochos et al., 1999), assumes an initial quadrupolar magnetic configuration, where a flux rope erupts from the PIL of a “core” sheared magnetic arcade embedded in an opposite-direction larger arcade. The model argues that reconnection at the magnetic null above the sheared arcade initiates the eruption of the sheared arcade; the strongest flare reconnection then occurs at a current sheet at, again, the same location as in the CSHKP model: above the PIL of the sheared core field and below the erupting flux rope. Various observational features of this model have been observed in observational events (e.g. Aulanier et al., 2000; Sterling & Moore, 2001b, 2004; Aurass et al., 2013; Chen et al., 2016, and references cited therein).
Other ideas have also been put forth for the onset of the magnetic eruptions that make flares and CMEs, including the ideal magnetohydrodynamic instabilities known as the “kink instability”(Török et al., 2004; Török & Kliem, 2005) and the “torus instability”(Kliem & Török, 2006). Also, recently there have been other proposed 3D models based on both observations and simulations, such as the “standard model in three dimension” (Aulanier et al., 2012; Janvier et al., 2014; Li & Zhang, 2015; Gou et al., 2016; Dudík et al., 2016). This MHD model includes the eruption of a torus-unstable magnetic flux rope via the torus instability, and reconnection at a current sheet that forms underneath the erupting flux rope. The current layers are regions of high magnetic field gradient, known as “quasi-separatrix layers” (QSLs; Priest & Démoulin, 1995; Demoulin et al., 1996). The slipping-reconnection concept has also been proposed as a mechanism to initiate solar flares/eruptions (Aulanier et al., 2006; Dudík et al., 2014). Moreover, the slipping reconnection itself has been proposed to be the tether-cutting mechanism (Dudík et al., 2016). Models such as the “slipping reconnection” model (e.g. Dudík et al., 2016) or the “Standard solar flare model in 3D,” (e.g. Aulanier et al., 2012) incorporate the 2D CSHKP model in a 3D view.
The field configurations and initiation of three-ribbon flares, with two parallel ribbons and a third circular ribbon occurring in the same flux-rope-eruption episode, have not been investigated extensively. In one recent such study, Joshi et al. (2015) discussed the magnetic topology and triggering of such a three-ribbon flare; they suggested a possible scenario for the event they observed, and recently Carley et al. (2016) presented support for that scenario based on solar radio data. In the present work, we present observations of a different example of a similar three-ribbon-flare eruption. It is an ejective eruption of a sigmoid flux rope, and occurred on 2014 December 18 in a large-scale fan-spine type magnetic configuration. Our main aim in this study is to determine how the eruption was initiated and how it produced the three-ribbon flare. We will also discuss similar eruptions that occur on a much smaller size scale in the form of coronal jets; recently it has been recognized that many such jets result from small-scale “minifilament” eruptions, which appear to be scaled-down versions of larger sheared-core arcade eruptions that make flares and CMEs (Sterling et al., 2015). The magnetic geometry we describe for our large-scale three-ribbon flare is also present in the jets produced by minifilament eruptions, and those jets also have a similar pattern of three flare ribbons.
We construct this paper in the following sections. Section 2 explains about the observational data sets used. Source region location information and overlying magnetic topology are discussed in Section 3. Multiwavelength analysis are presented in Section 4, with GOES and RHESSI flux temporal evolution (Section 4.1), parallel ribbon formation dynamics (Section 4.2), circular ribbon formation dynamics (Section 4.3), discussion about ribbons formation timings (Section 4.4), and associated CME (Section 4.5). A comparision with the coronal jet topology is presented in Section 5. The main results and their discussions are presented in Section 6.
2 Instrumentation
We use data from several space-based instruments: SDO/AIA and HMI, GOES and RHESSI. The Atmospheric Imaging Assembly (AIA; Lemen et al., 2012) is an instrument on board the Solar Dynamics Observatory (SDO) that observes the Sun in visible, ultraviolet (UV), and extreme ultraviolet (EUV) wavelengths. For the present work we have examined AIA observations at all available EUV channels: 304, 131, 171, 193, 211, 335, and 94 Å, and also in UV at 1600 and 1700 Å, and in visible light at 4500 Å. AIA has temporal cadences of 12 s for EUV and 24 s for UV, and pixel size of . The Helioseismic and Magnetic Imager (HMI; Schou et al., 2012) is another instrument on board SDO. It provides line-of-sight magnetic field maps of the whole face of the Sun with a temporal cadence of 45 s and with pixel size of . For observing the X-ray-coronal and footpoint sources during the flare we use data from the Reuven Ramaty High-Energy Solar Spectroscopic Imager (RHESSI; Lin et al., 2002), where we used the PIXON algorithm for image reconstruction with an integration time of around 20 s.
3 Source Region Location, Morphology and Magnetic Field Structure
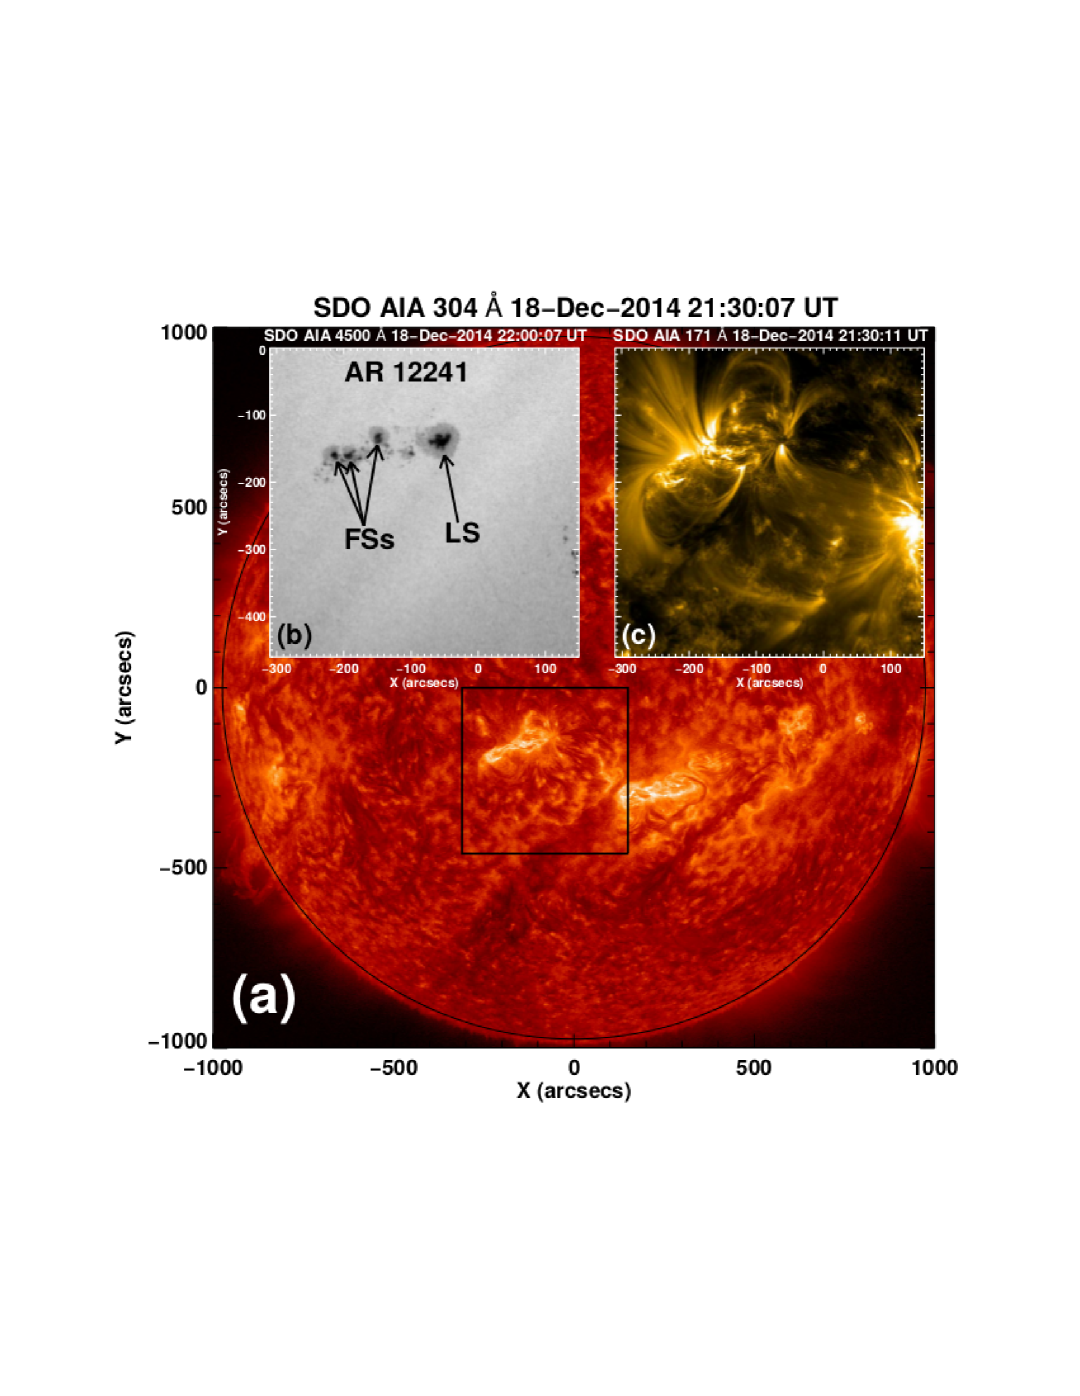
Figure 1 is a montage of SDO/AIA 304, 171 and 4500 Å images showing an overview of the active region (AR) that was the source of the event, NOAA AR 12241. The background image is a SDO/AIA 304 Å full disk image from 21:30:07 UT on 2014 December 18 (Figure 1(a)). The black box in Figure 1(a) shows the location of AR 12241, with closeup images in SDO/AIA 4500 Å and 171 Å respectively in Figures 1(b) and 1(c). These images show that AR 12241 is located near disk center, and the SDO/AIA 4500 Å image shows that the AR consists a group of several sunspots, with one leading sunspot and three relatively small following sunspots (arrows in Figure 1(b)). The magnetic class of the active region was on 2014 December 18.
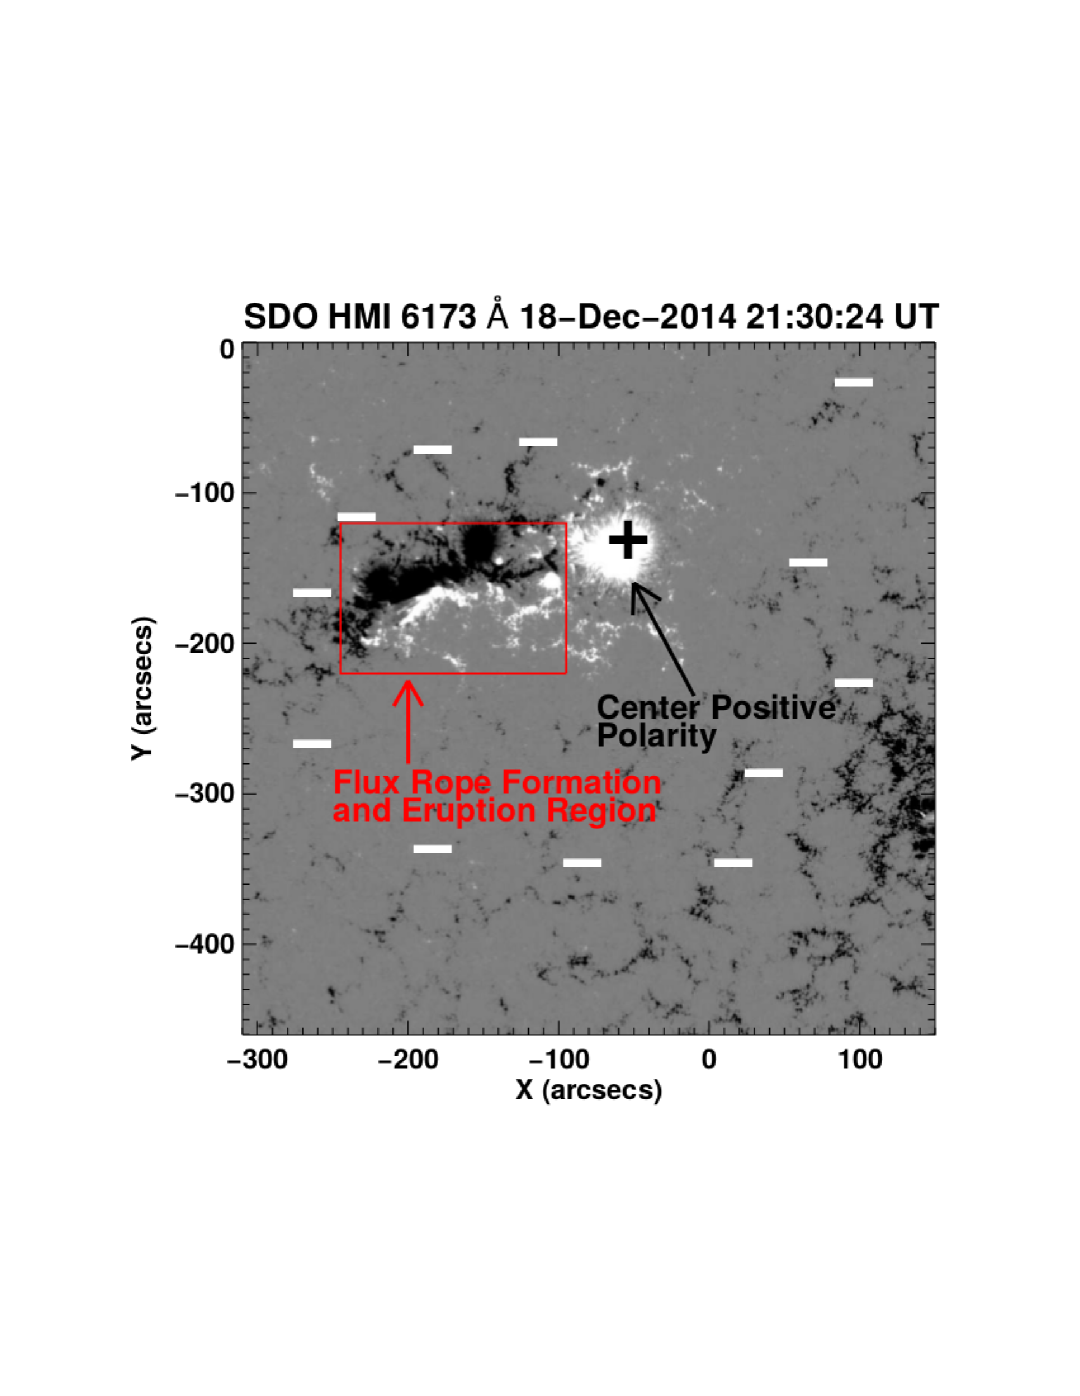
Figure 2 shows the line-of-sight photospheric magnetogram corresponding to the area shown in the black box of Figure 1(a). This magnetogram is from 21:30:24 UT on 2014 December 18, and shows that the active region is bipolar with much of its positive-polarity magnetic flux in the large leading sunspot and much of its negative flux in the three following sunspots, and has a long PIL between its positive and negative flux domains. Also marked in the figure is an extensive region of negative polarity that surrounds the positive flux domain region. This photospheric magnetic distribution suggests that there should be a large-scale fan-spine type configuration with a shell of open or far-reaching field outside of the AR that is rooted in the surrounding negative-polarity region and extending far above and away from the AR; thus the AR would be inside of this shell, and so will call this shell the “outer shell.” There is also a portion of the fan field inside of that outer shell, i.e. an “inner shell,” which is an anemone-shaped ring of field loops having one foot in the positive flux domain and the other foot in the surrounding negative domain. As we will see shortly, the strip along the PIL in the red box is the site of formation of a flux rope that erupts; it is that eruption and its interaction with the shells of the fan that produce the three flare ribbons.
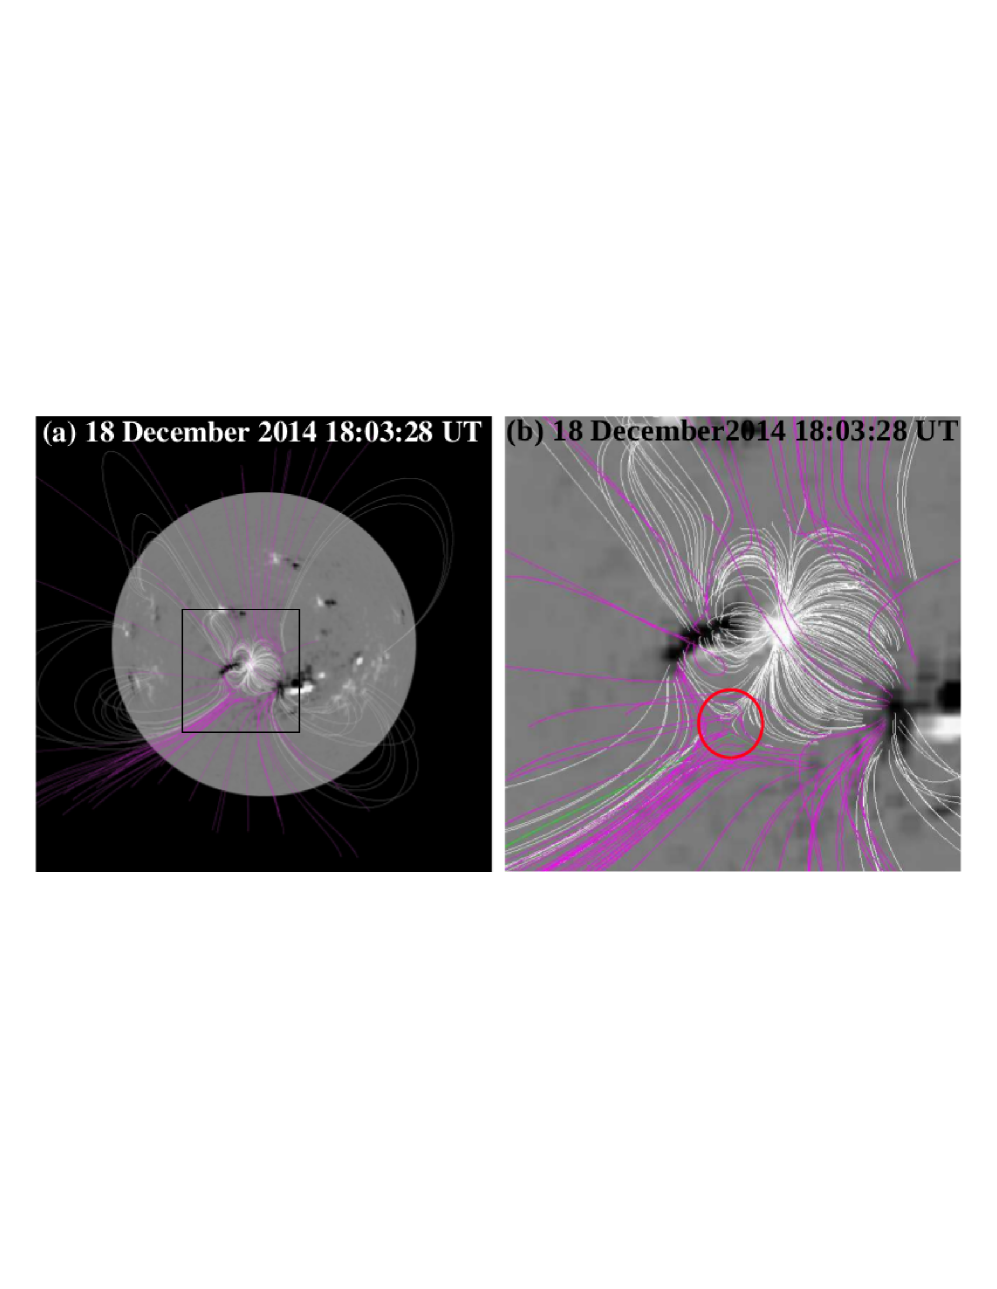
In Figure 3 we confirm the existence of a huge fan-spine structure using a potential-field source-surface (PFSS, Schrijver & De Rosa, 2003) extrapolation in the neighborhood of the AR, where we accessed the PFSS package with the Interactive Data Language (IDL) using the Solar Software (SSW) package (Freeland & Handy, 1998). Figure 3(a) shows a full disk magnetogram from 18:03:28 UT on 2014 December 18 with the extrapolated potential field lines overplotted, and Figure 3(b) shows a closeup of the active region corresponding to the region of the black box in Figure 3(a). The closed field lines (shown in white) are the field lines of the inner fan dome, while the open field lines (pink) represent the field lines of the outer shell of the fan dome. The inner (closed) and outer (open) fan-dome fields are expected to be separated by a separatrix layer in 3D. As we will show below, this configuration is well-matched with the SDO/AIA observations (see Sections 3, and 5). Later (Section 5), we will show that this configuration is similar to a typical coronal-jet-base field configuration with an inferred fan-dome field topology in the corona (Sterling et al., 2015).
4 Multiwavelength Analysis of the Ejective Eruption and Flare Dynamics
4.1 GOES and RHESSI X-ray Intensity Profiles
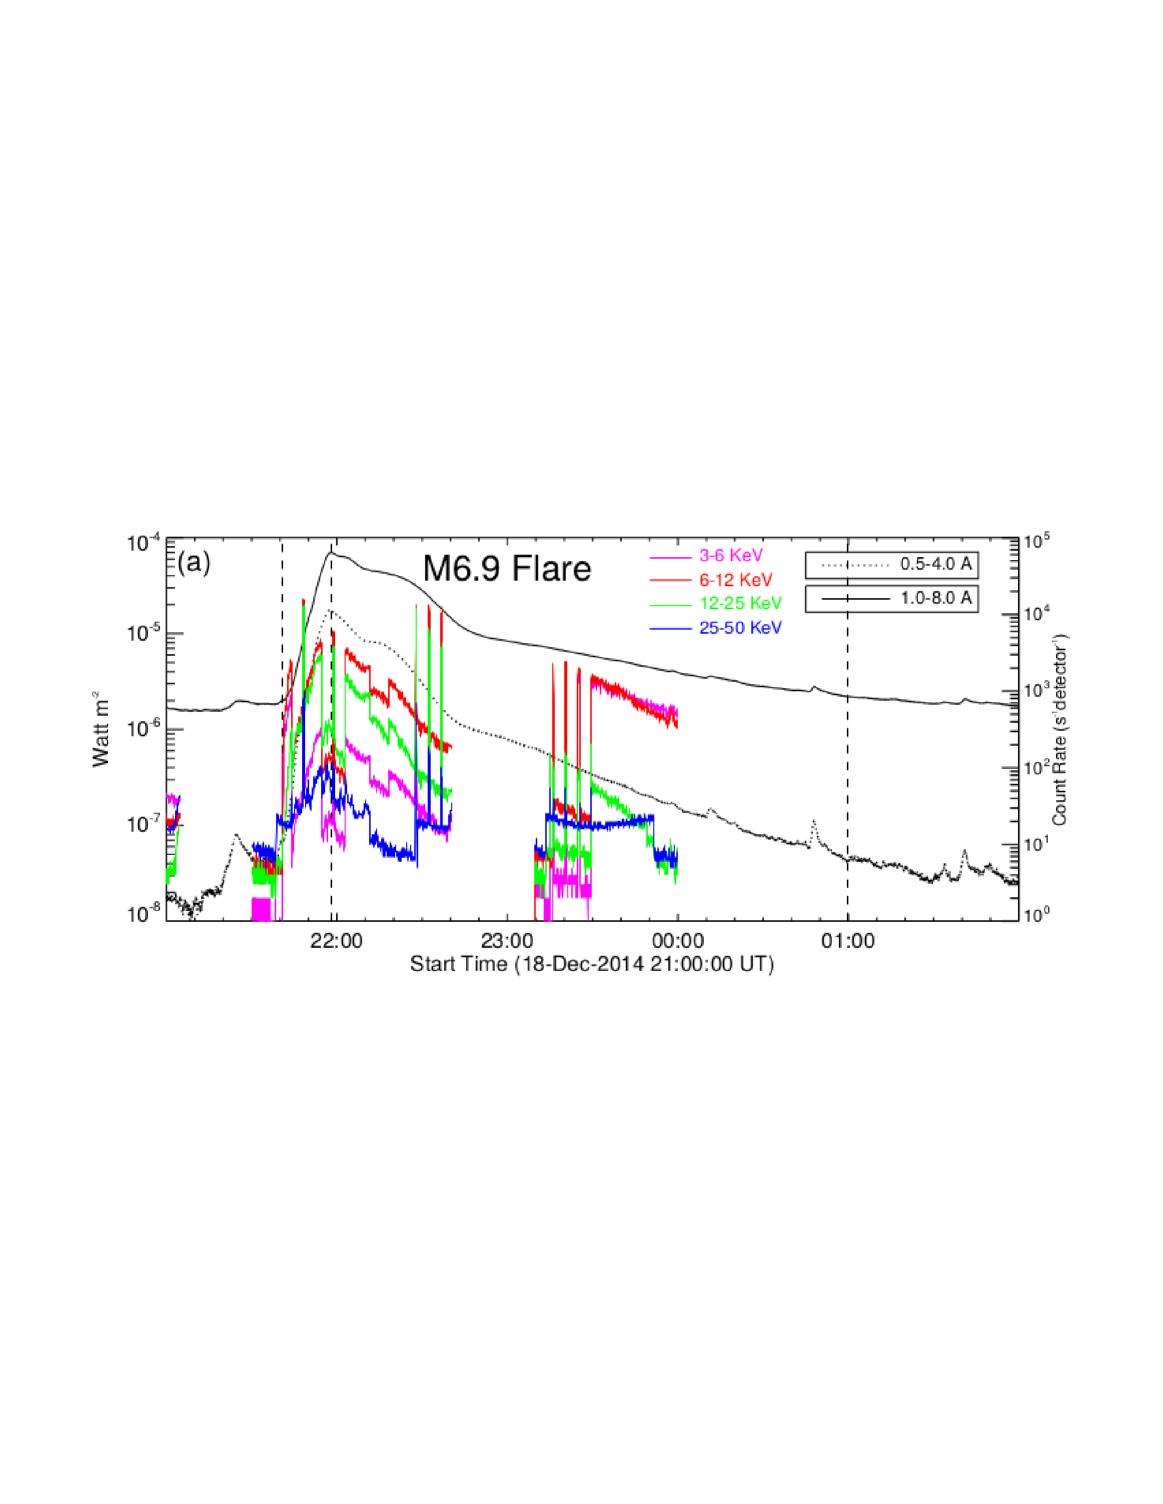
Figure 4 shows the Geostationary Operational Environmental Satellite (GOES) and RHESSI X-ray time profiles of the flare. The black solid and dashed curves are the GOES X-ray profiles for 1–8 Å and 0.5–4 Å respectively, and the RHESSI X-ray profiles at 3-6 keV (pink), 6-12 keV (red), 12-25 keV (green), and 25-50 (blue) keV are overplotted. This flare was class M6.9 on the GOES X-ray scale. From the GOES profiles we see that the flare started at 21:41 UT and peaked at 21:58 UT, and had an extended decay phase that continues until 02:00 UT on 2014 December 19. The overall variation of the RHESSI X-ray profiles matches with that of the GOES profiles.
4.2 Two-Ribbon Component: Standard Reconnection and Parallel Ribbons Formation
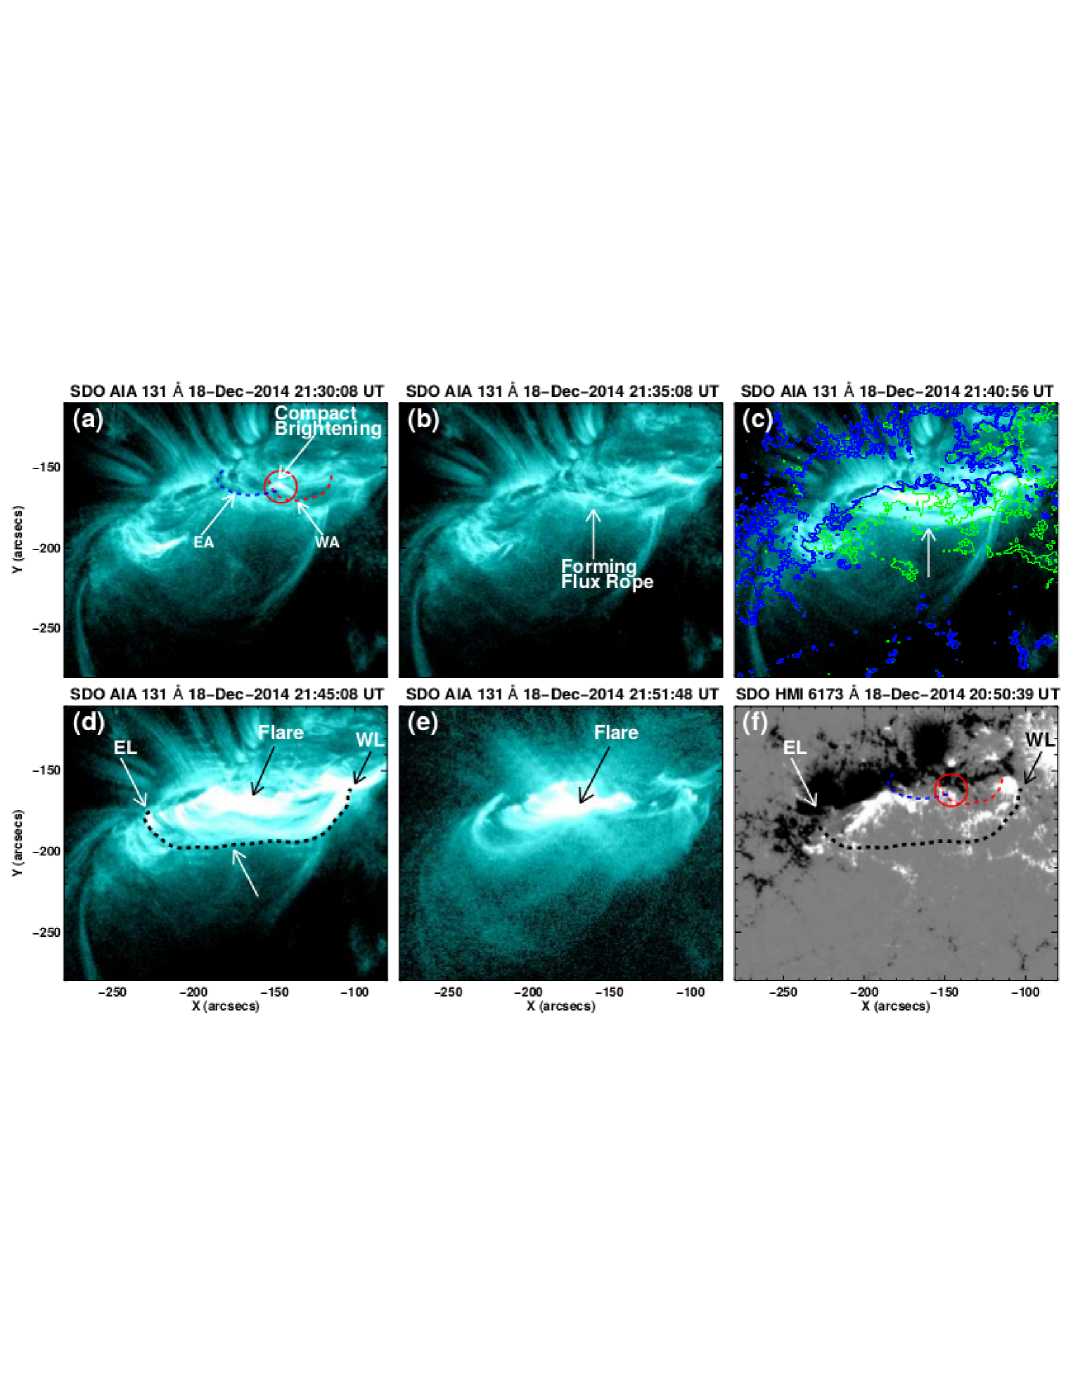
The event consists of two different aspects, or “components.” One component is a standard sheared-core-arcade flux-rope eruption, including the standard CSHKP-type flare reconnection and parallel ribbon formation discussed above, all occurring inside of (and perhaps initiated independently of) the large-scale fan-spine structure. Figures 5((a)–(e)) present a sequence of SDO/AIA 131 Å images during the time of dynamic evolution of the flux rope, including its formation, eruption, and triggering of CSHKP-type flare reconnection. The first indication of the flare onset in these images seems to be at 21:30 UT, with a compact brightening at the location of the red circle in Figure 5(a). This brightening may be due to tether-cutting reconnection occurring between low-lying sheared arcade loops with the footpoints of their legs anchored in opposite-polarity footpoint regions. We can identify candidates for these loops as dark arch-like structures on the eastern and western sides of the red circle; they are shown as red- and blue-dashed curves in Figure 5(a), and respectively labeled “WA” and “EA” for western and eastern loops of a highly-sheared arcade. We further examine the anchoring of the arcade loops as well as the location of the compact brightening by comparing the AIA 131 Å images with SDO/HMI photospheric magnetogram, by overplotting WA and EA of Figure 5(a) onto the magnetogram of Figure 5(f). This shows that the far ends of the WA and EA arcade loops are anchored in negative and positive polarity regions, respectively. The location of the initial compact brightening region (red circles in Figs. 5(a) and 5(f)) is near the junction of the two arcades.
Inspection of the SDO/HMI photospheric magnetic field movie (see animation accompanying Figure 5) of the area shows rapid evolution, with continuous flux cancellation and shearing motions; in particular, the red-circled area in Figure 5(f) shows cancelation occurring in the hours prior to the onset of flaring, with an episode of cancelation between the positive-polarity patch with adjacent negative-polarity flux starting at about 20:15 UT. This rapid flux cancelation is a strong candidate for driving pre-eruption tether-cutting reconnection that could build a pre-eruption core flux rope. That is, this pre-eruption tether-cutting reconnection is apparently driven by flux cancelation resulting from evolutionary photospheric motions.
Soon after the initial brightening, we observe the formation and appearance of long thread-like structures over the flux-cancellation region (Figures 5(b)–(e)). These are perhaps best visible in 131 Å and 94 Å wavelengths, from about 21:35 UT (or even earlier in 94 Å), where they appear in emission; they are faintly visible in 193 Å images, but more difficult to see or invisible at this early stage (when they are low down in the core region) in other wavelengths. These newly-formed long structures are consistent with them being a component of the flux rope expected to result from tether-cutting reconnection below. Thus, similar to some other cases (e.g., Cheng et al., 2013; Sterling et al., 2014), the erupting flux rope tends to be visible in (some) hotter AIA EUV channels, but faint or invisible in the cooler AIA channels.
In this case, although a cool-material filament is clearly visible along the PIL, there is no clear evidence that any of this filament material is ejected along with the hotter flux rope. (A strand of this filament is ejected from the west side of the filament at 21:51 UT, but this is a secondary aspect of the flux-rope eruption, in the sense that it occurs well after the two parallel ribbons start to separate; we do not consider here whether this strand ejection is a connected to the null-point reconnection (Section 4.3) that begins at about the same time.) Ribbon-like brightenings from the eruption start parallel to the filament along either side of the filament; these features are perhaps most apparent in the 304 Å images (not included here), but they can also be seen in the movie accompanying Figure 5(a). This suggests that the suspected tether-cutting reconnection occurred among fields overlying the filament (e.g., Moore & Sterling, 2007), and therefore the flux-rope formed and was expelled from a location above the filament, leaving the filament inside the flare arcade.
In Figure 5(d) we trace the observed front of the newly-formed flux rope with a dotted black line, and in Figure 5(f)) we overplot that trace onto an SDO/HMI photospheric magnetogram. This shows that the eastward leg of the observed flux rope is anchored in a negative-polarity region, and the westward leg is anchored in a positive-polarity region. This configuration supports that this observed outward-moving bright feature is indeed a flux rope that forms from runaway tether-cutting reconnection early in the eruption. (By “runaway tether cutting,” we mean a situation whereby the tether-cutting reconnection promotes further tether-cutting reconnection through a positive-feedback process for an extended period of time.) We also observe flare brightening along the PIL location below the erupting flux rope in all AIA EUV wavelengths as the flux rope moves outward (see Figures 5(d) and (e), and accompanying video). This flaring is expected as the legs of the arcade enveloping the erupting flux rope partake in the CSHKP-type reconnection.
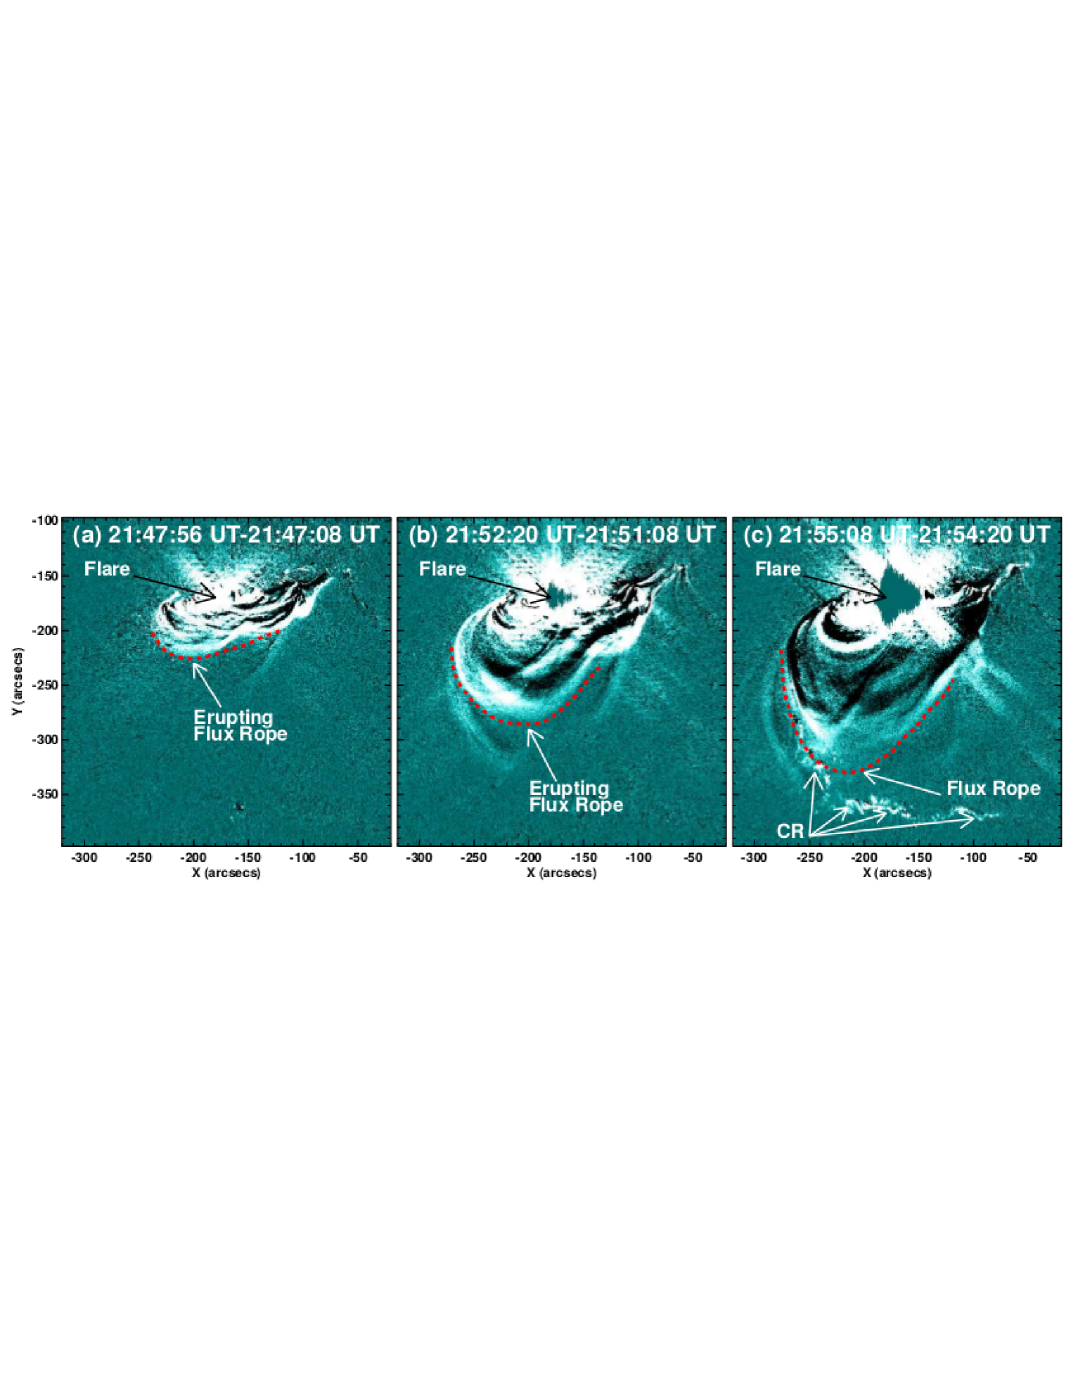
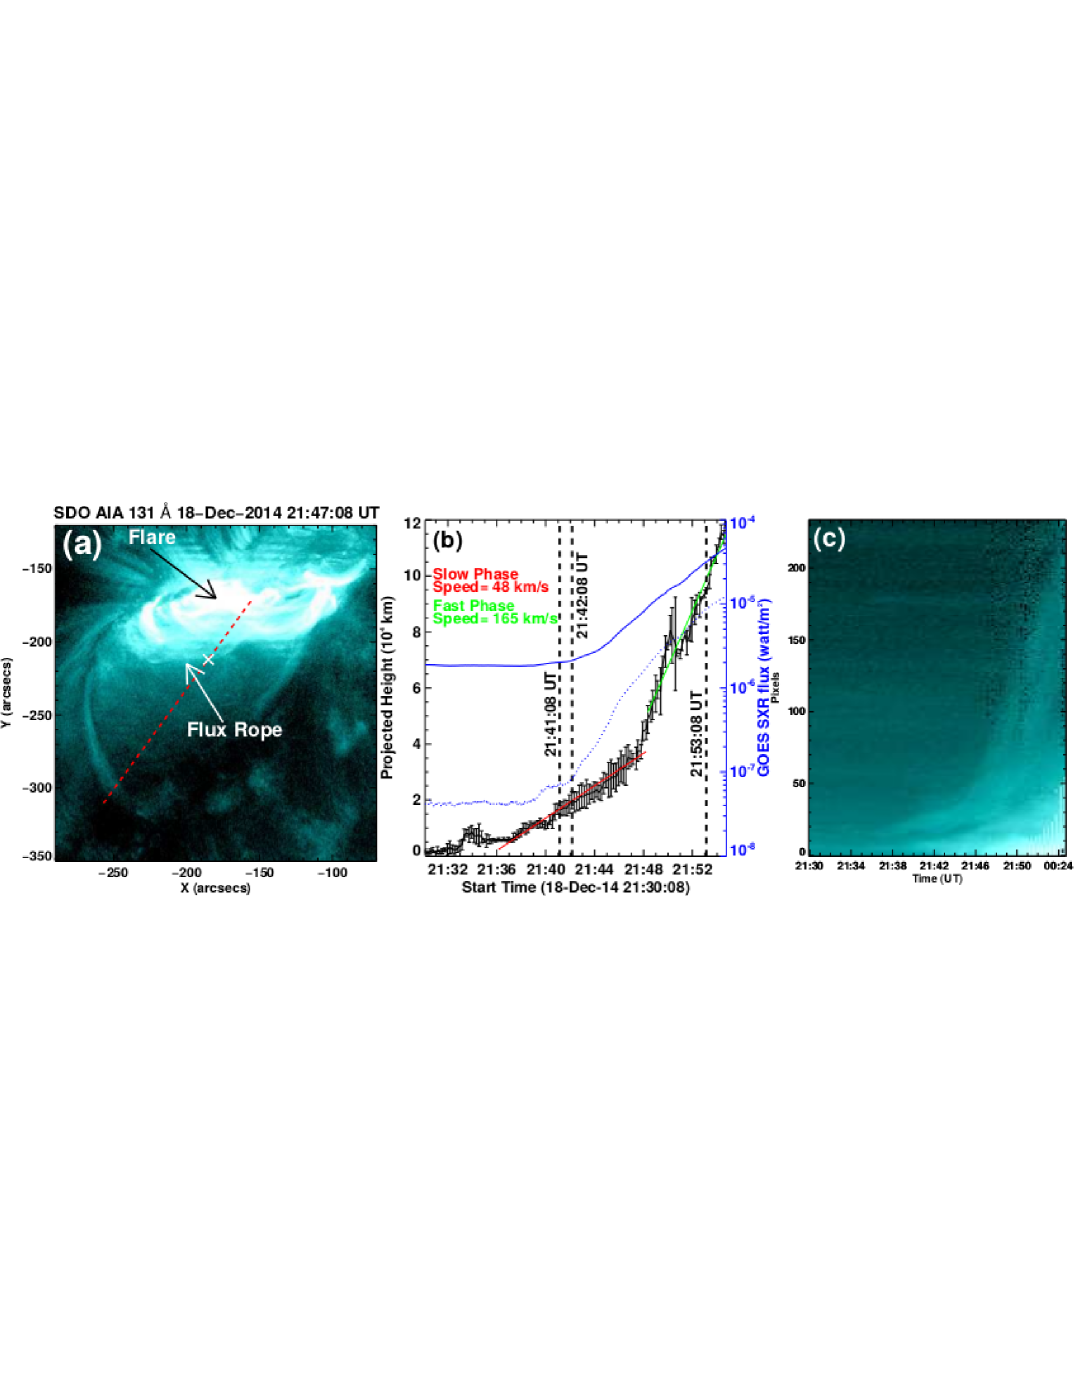
Figure 6 shows the outward propagation of the flux rope in SDO/AIA 131 Å running-difference images, where we highlight the approximate front of the flux rope by the dashed red lines. We can gain insight into the temporal relation between the erupting flux rope, the flare brightening, and the formation of the ribbons by comparing the height-time profile of the erupting flux rope’s leading edge with the GOES X-ray profiles (Figure 7).
The left panel of Figure 7 shows an SDO/AIA 131 Å image at 21:47:08 UT and the red dashed line along which the projected height of the erupting flux rope has been measured. The height-time profile is shown in the right panel of Figure 7. To determine the height-time data points, we tracked the leading edge of the erupting flux rope along the red dashed line in Figure 7(a), where the bottom-most point of the line is used as a reference point for the height measurements. To estimate the uncertainty in the height-time locations we repeated the same analysis three times, and the average of three values has been used as a final value of height-time measurements and the error bars are the 1 standard deviations resulting from those three repeated measurements. The speeds are calculated using linear fits to the different time intervals. The height-time profile reveals a two-phase evolution of the eruption: The first phase is during 21:36 UT to 21:48 UT, with an average speed of around , while the second phase is from 21:48 UT to 21:55 UT with a relatively higher average speed of around . The first and second phases are shown by the red and green fitted lines in Figure 7(b), respectively. We also overplotted the GOES 1-8 and 0.5-4 Å flux profiles with the height-time profile (shown by blue thick and dotted lines, respectively, in Figure 7(b)). It can be seen that the GOES X-ray flux enhancement is well matched with the height-time profile, suggesting that the flux rope’s upward motion is correlated with runaway tether-cutting reconnection underneath it. Two-step rise profiles (slow-rise and fast-rise phases) have commonly been seen for filament eruptions (e.g., Tandberg-Hanssen et al., 1980; Sterling & Moore, 2005; McCauley et al., 2015), and in some cases accelerations in the filament trajectory have been also found to correspond to peaks in brightenings in GOES fluxes (e.g. Sterling et al., 2007, 2011). Thus, the flux-rope eruption behavior here is in agreement with those observations of erupting filaments (which are believed to be cool material riding on erupting flux ropes). The time-distance map of the eruption have also been shown in Figure 7(c).
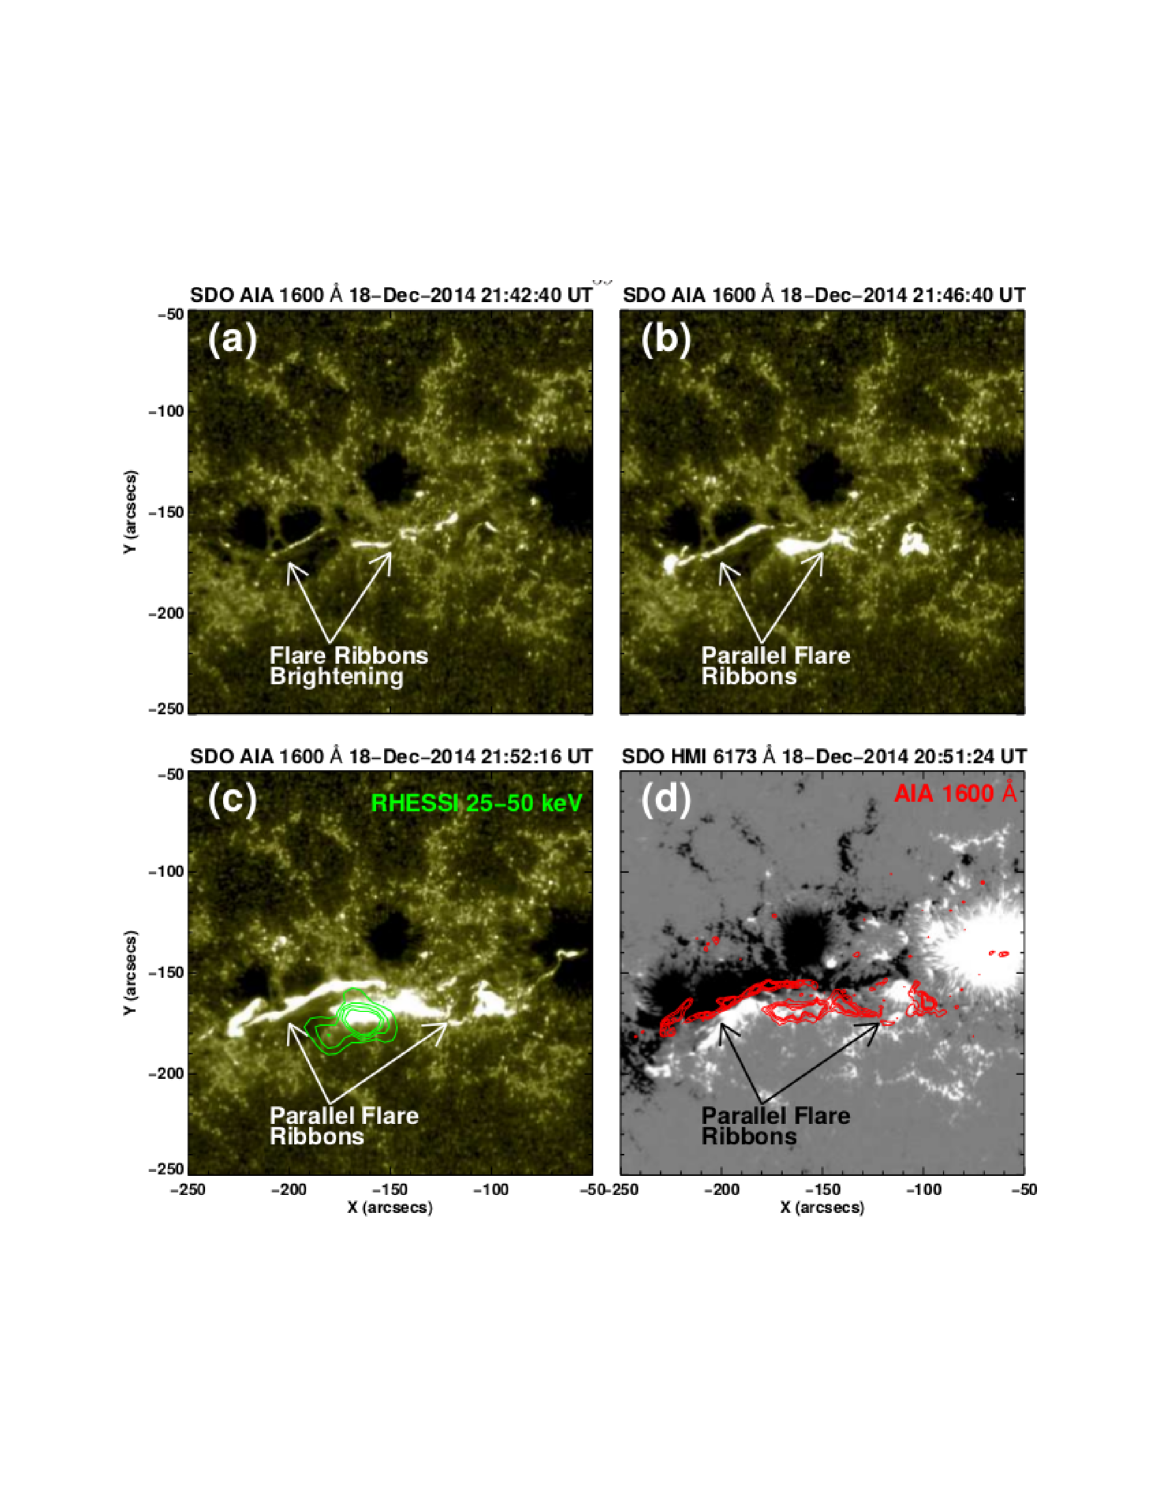
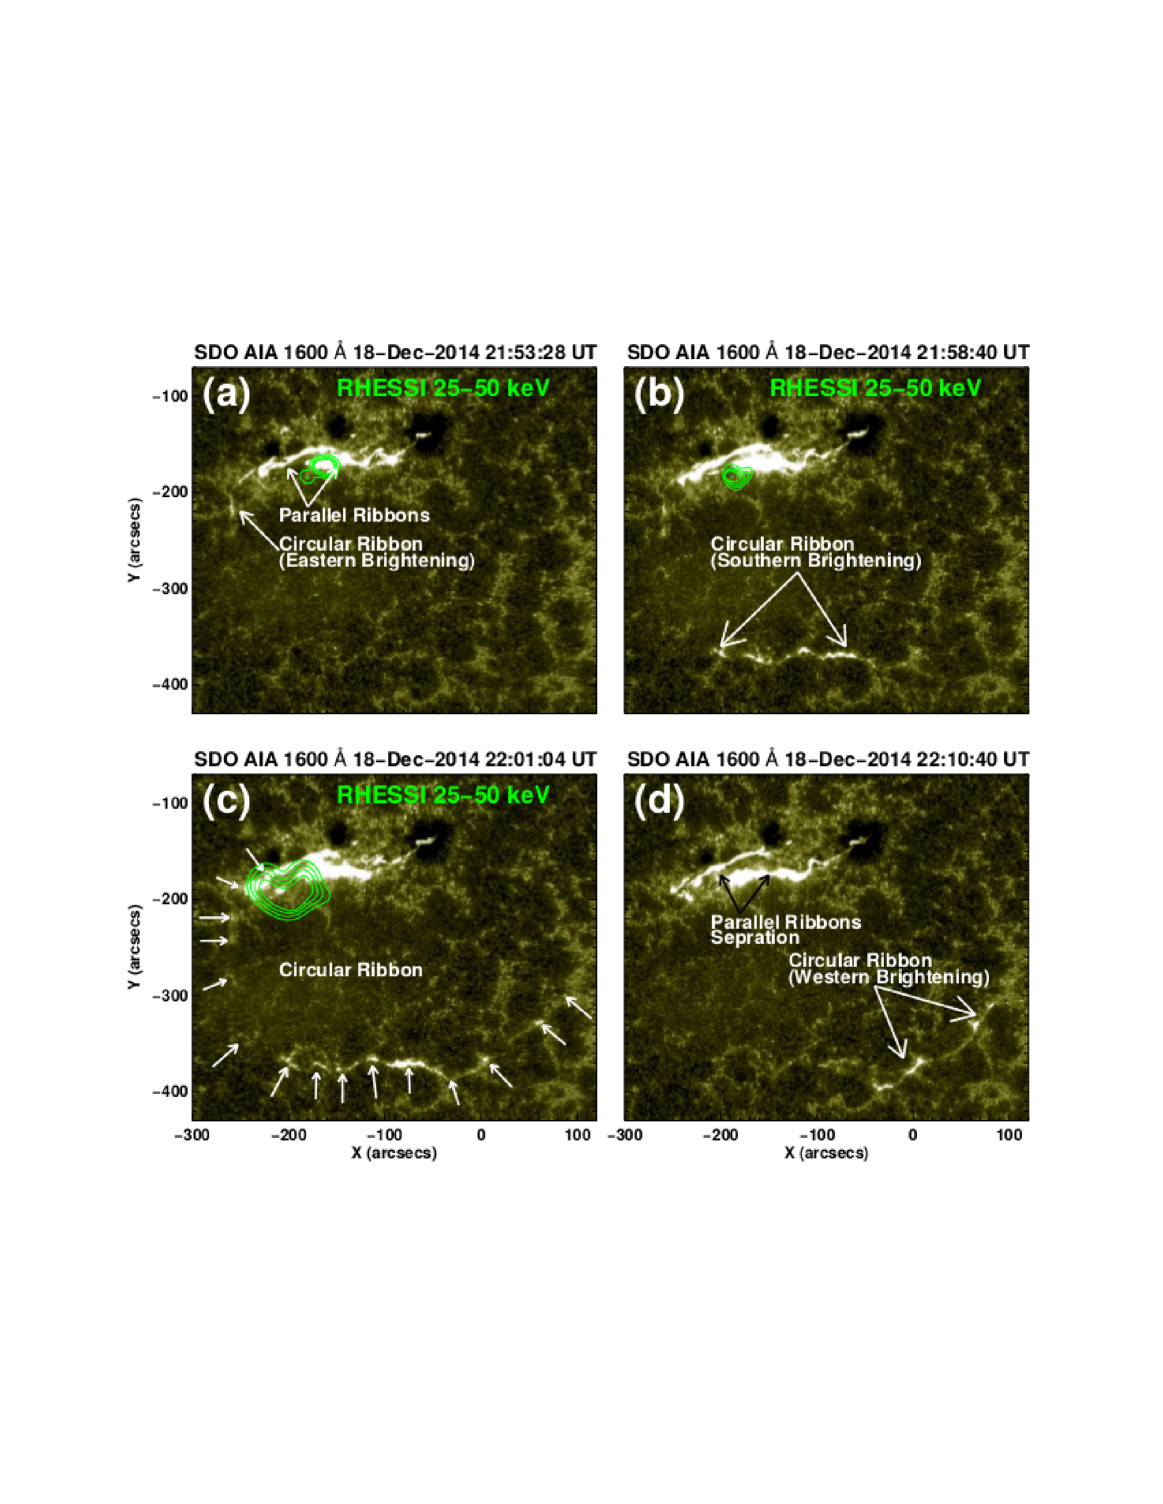
The morphology of the parallel ribbons formation can be seen in the SDO/AIA 1600 Å observations (Figure 8). The initial ribbon brightening is observed over 21:41—21:42 UT (Figure 8(a)). Early in the evolution of the flux rope, e.g. at about 21:47 UT (Figure 8(b)), we see multiple ribbons, broadly consistent with the four-ribbon configuration expected during the earliest stages of the tether-cutting scenario (see top-right panel of Fig. 1 in Moore et al., 2001). Later (e.g., 22:10 UT), these ribbons evolve into the standard parallel ribbons (see Figure 10(d)) along both sides of the PIL; the overall dynamics can be seen in the SDO/AIA 1600 Å movie (see animation accompanying Figure 10). Contours of the standard parallel ribbons observed in SDO/AIA 1600 Å are overplotted on line-of-sight HMI magnetogram in Figure 8(d), showing that the northern and southern parallel ribbons are located in negative and positive polarity regions, respectively. The ribbons extend in the east-west direction and move apart in the north-south direction as the flux rope moves outward. Moreover, we also observed RHESSI 25–50 keV X-ray source on one of the two ribbons (see green contours in Figure 8(c)). These observations are consistent with the standard flare model, with runaway tether-cutting reconnection occurring below the erupting flux rope and with charged particles accelerated at the reconnection site and flowing downward along the magnetic field lines and striking the lower chromosphere to emit hard X-rays and heat the flare ribbons.
Figure 9 presents a schematic based on the observations in the various AIA EUV and 1600 Å channels and these discussions. We emphasize that all of these early-stage dynamics (erupting flux rope and two-ribbon flare) are occurring inside of the northeastern lobe of the huge fan-dome magnetic-field configuration (see red box in Figure 2).
4.3 Circular-Ribbon Component: Null point Reconnection and Circular Ribbon Formation
This component of the eruption is a consequence of the null-point reconnection, which results in the circular ribbon. It occurs because of the interaction of the erupting flux rope and the arcade containing it (where that arcade is the northeast side of the inner fan field prior to its eruption) described in Section 4.2 with the null of the fan-spine magnetic structure. The formation and dynamics of the circular ribbon can be understood by analyzing the SDO/AIA observations in different wavelengths (Figures 10 and 11).
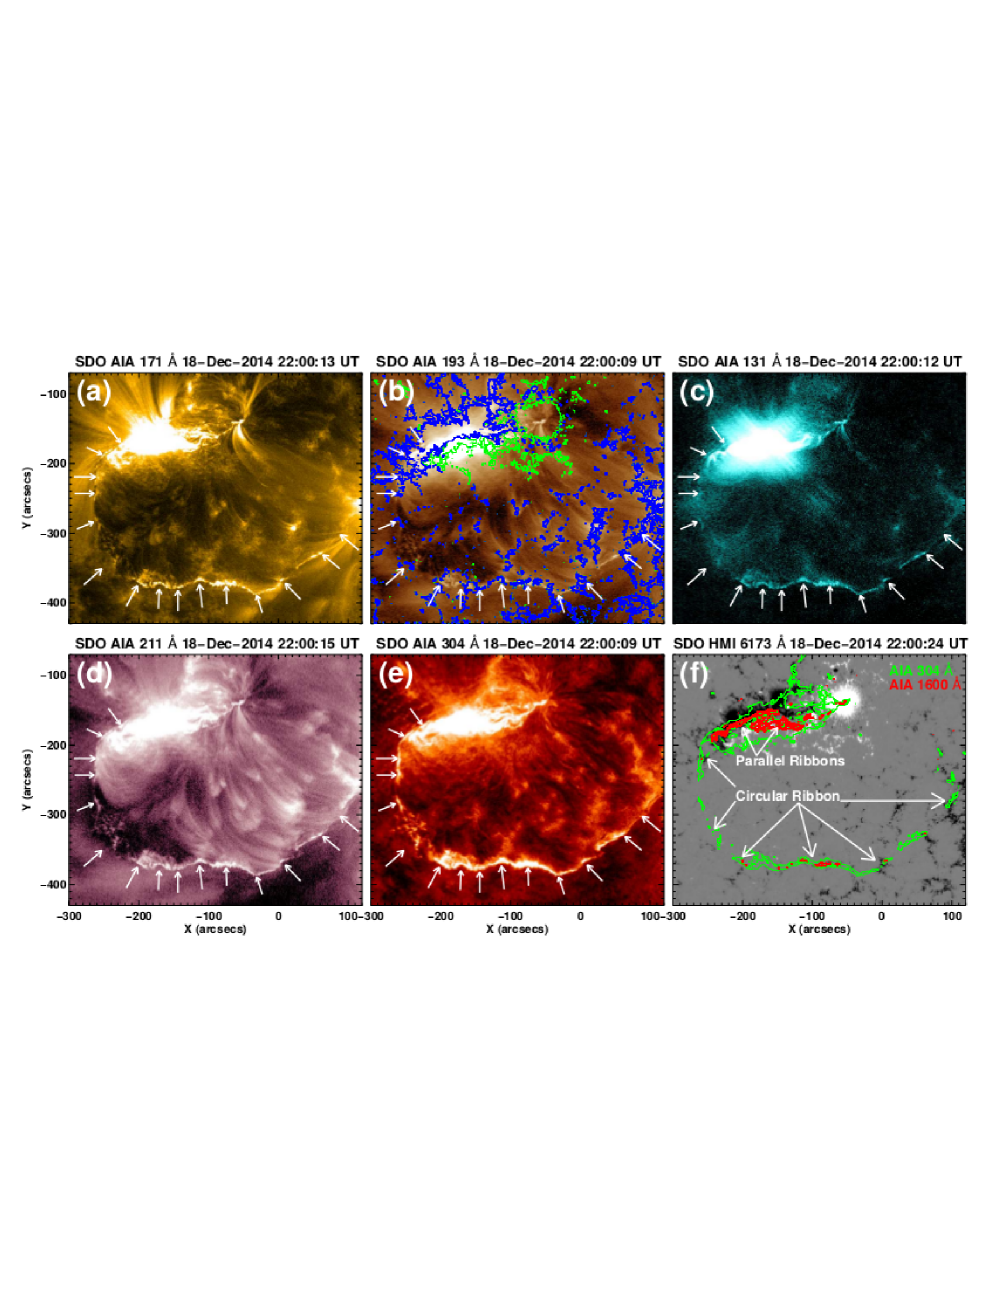
Figure 10 shows a sequence of selected SDO/AIA 1600 Å images over 21:53 UT to 22:10 UT. The first appearance of the circular ribbon is between 21:52 UT and 21:53 UT, starting near the eastern end of the northern parallel ribbon (Figure 10(a)). The brightening in the circular ribbon then moves sequentially in a counterclockwise direction, first to the east and then to the south and then the west. The brightness reaches the far-southern extreme, opposite the parallel ribbons, at around 21:55 UT, with a quasi-circular ribbon visible at around 22:00 UT (Figure 10(c)). The brightness then continues moving further west, forming a near-circle at around 22:10 UT (Figure 10(d)). This circular ribbon was visible in all of the SDO/AIA channels; Figures 11(a)–(e) respectively show the circular ribbon in SDO/AIA 171, 193, 131, 211, and 304 Å wavelengths. Figure 11(f) shows the circular ribbon overlaid onto an SDO/HMI line-of-sight photospheric magnetogram, with the ribbon in SDO/AIA 304 and 1600 Å displayed in green and red contours, respectively. This shows that the circular ribbon is situated in a negative-polarity region.
The RHESSI X–ray sources have also been observed during this phase in the region between the parallel ribbons (see Figures 8(a)–(c)). This suggest that the standard reconnection underneath the erupting flux rope remains ongoing.
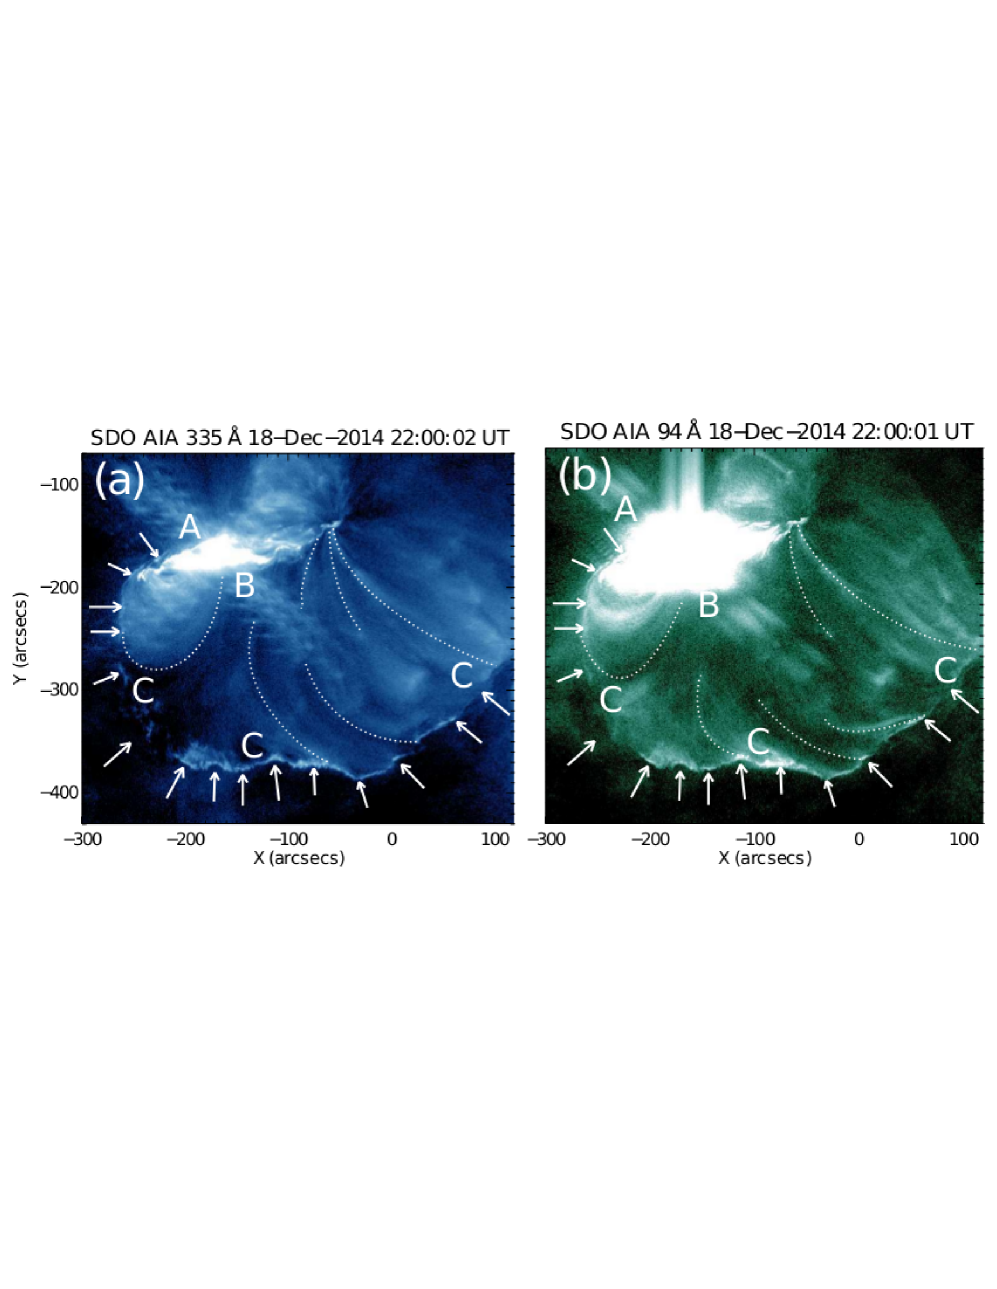
The null-point reconnection also heats a ring of new inner fan loops that are visible in hotter AIA channels. Figure 12 shows examples of these structures in SDO/AIA 335 and 94 Å images. Evidently, the erupting flux rope drives its enveloping arcade to reconnect at the null point in the higher corona, heating this circular ribbon. Figure 14 shows a schematic for this interpretation, and will be discussed further in Section 5.
4.4 Ribbon Timings
In reconnection-initiated eruption-onset models, there are (at least) two different mechanisms by which reconnection can initiate the eruption of a flux rope: In the first case, the release of tension force below the flux rope initiates and grows the eruption; this is the runaway tether-cutting idea (Moore et al., 2001). As we have seen above (Section 2), it appears that such tether cutting produces the parallel flare ribbons under the erupting flux rope in our event. In the second mechanism, it is the removal of flux overlying the flux rope via reconnection at a fan null that initiates the flux rope’s eruption; this is the idea of the magnetic breakout mechanism (Antiochos et al., 1999). In our event, breakout reconnection evidently produces the circular ribbon at locations remote from the location from which the flux rope erupts.
As mentioned in Section 1, a third mechanism that may initiate eruptions is an ideal MHD instability not involving reconnection. We do not address this option directly here, in part because it is difficult to detect the earliest eruptive magnetic motion, since a distinct erupting filament that can often be used as a tracer of such early magnetic motion is not available in this event. We do however observe signatures of both tether cutting and breakout, and so here we address directly which of these two mechanisms shows the best evidence for initiating the eruption.
To decide which of these two scenarios best fits our event, we use the relative timing of the onset of the two different flare ribbons. If the parallel ribbons in the immediate vicinity of the flux rope brightened prior to the onset of brightening of the remote circular ribbon, that would be an indication that tether cutting precedes breakout. Should the order be reversed, that is if the circular ribbon started prior to the parallel ribbons, this would indicate that breakout precedes tether cutting. At least several previous attempts to address this question of tether cutting or breakout based on relative timing of two-ribbon flare brightening and remote brightening have been inconclusive, due to insufficient cadence of the observations for the features being studied (e.g., Moore & Sterling, 2006).
SDO/AIA 1600 Å images show that the parallel ribbons began no latter than 21:38 UT, and they were essentially fully developed by 21:50 UT. The circular ribbon on the other hand did not start until 21:52 UT, and was not fully developed prior to 21:55 UT. That is, the null-point reconnection began about 12 min later than the flux rope started to erupt in step with runaway tether-cutting reconnection and flare heating below (see Figure 7(b)). Therefore, in this case, the evidence unambiguously supports that the runaway tether-cutting reconnection under the rising flux rope preceded the breakout reconnection at the null point. Hence, in our case we conclude that the tether-cutting reconnection is more probable than breakout for the initiation of flux-rope eruption (see Figure 5 and accompanying animation).
4.5 Accompanying CME
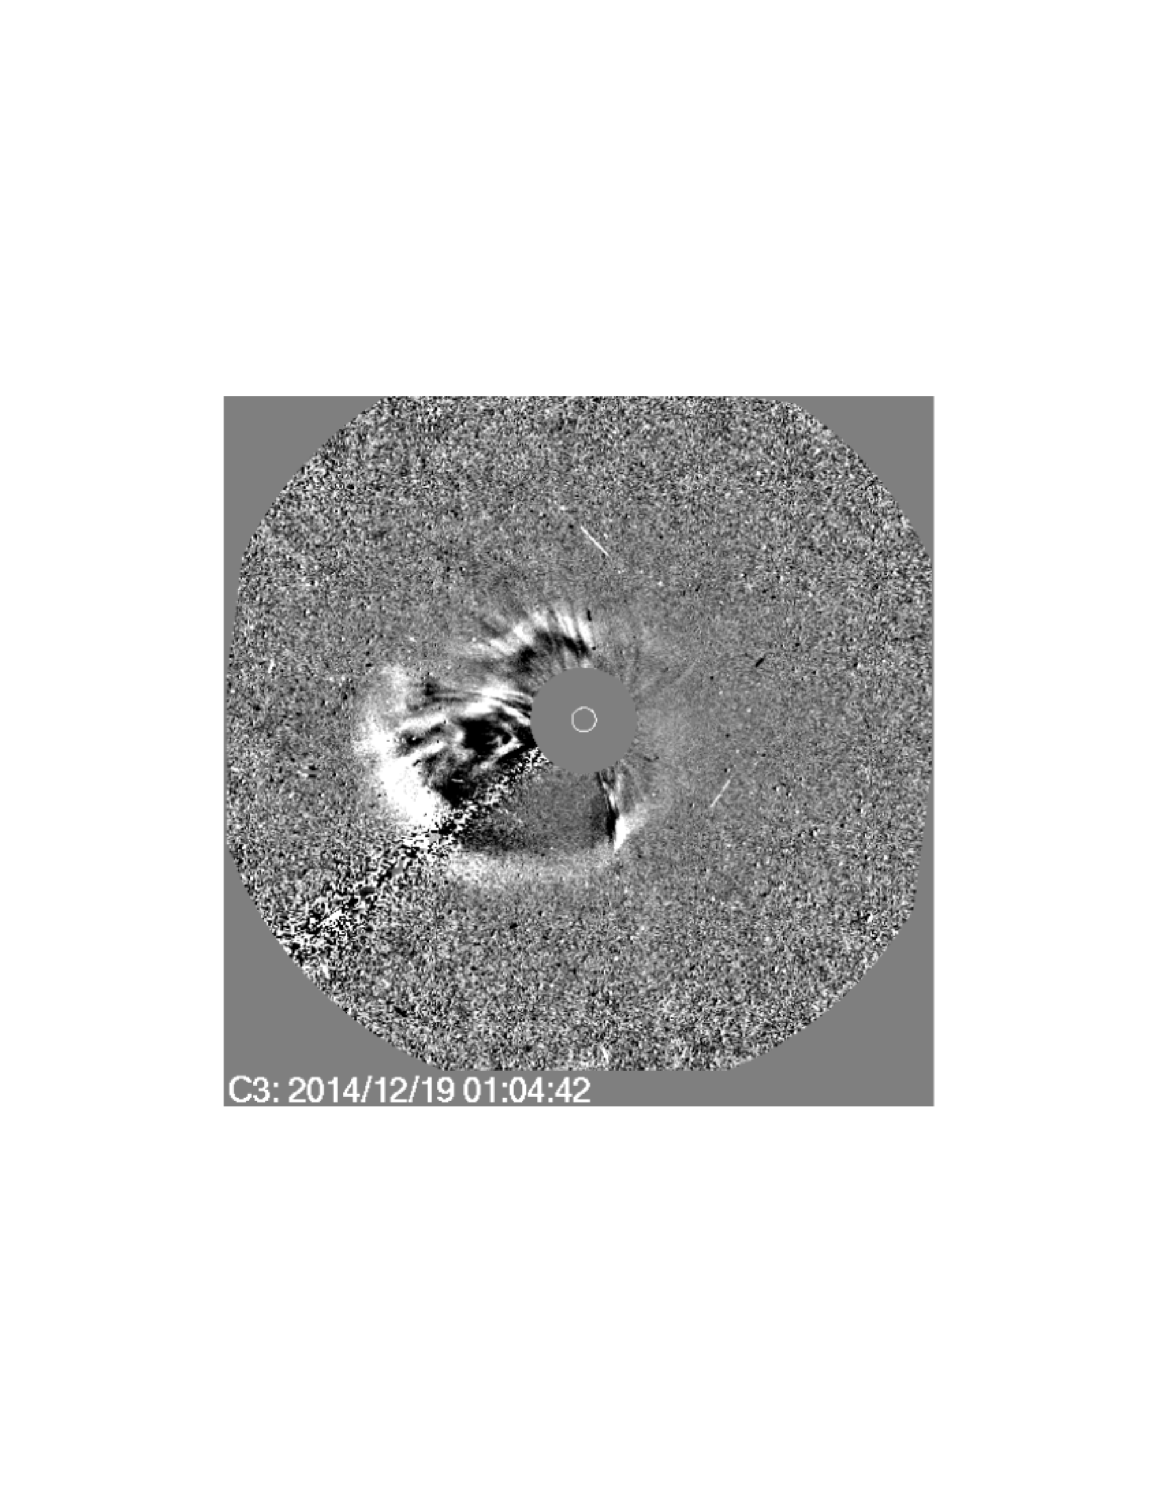
This eruption is ejective in that it is accompanied by a CME. Figure 13 shows a SOHO/LASCO white light coronagraph image of the CME at 01:04:42 UT on 2014 December 19. Unfortunately, due to a data gap, only a few images are available and so the CME was not observed at full cadence. This image shows that the CME accompanying the eruption was a halo CME, with the outer approximately-circular leading edge of the CME visible in this image.
5 Schematic and Comparison with Coronal Jet Topology
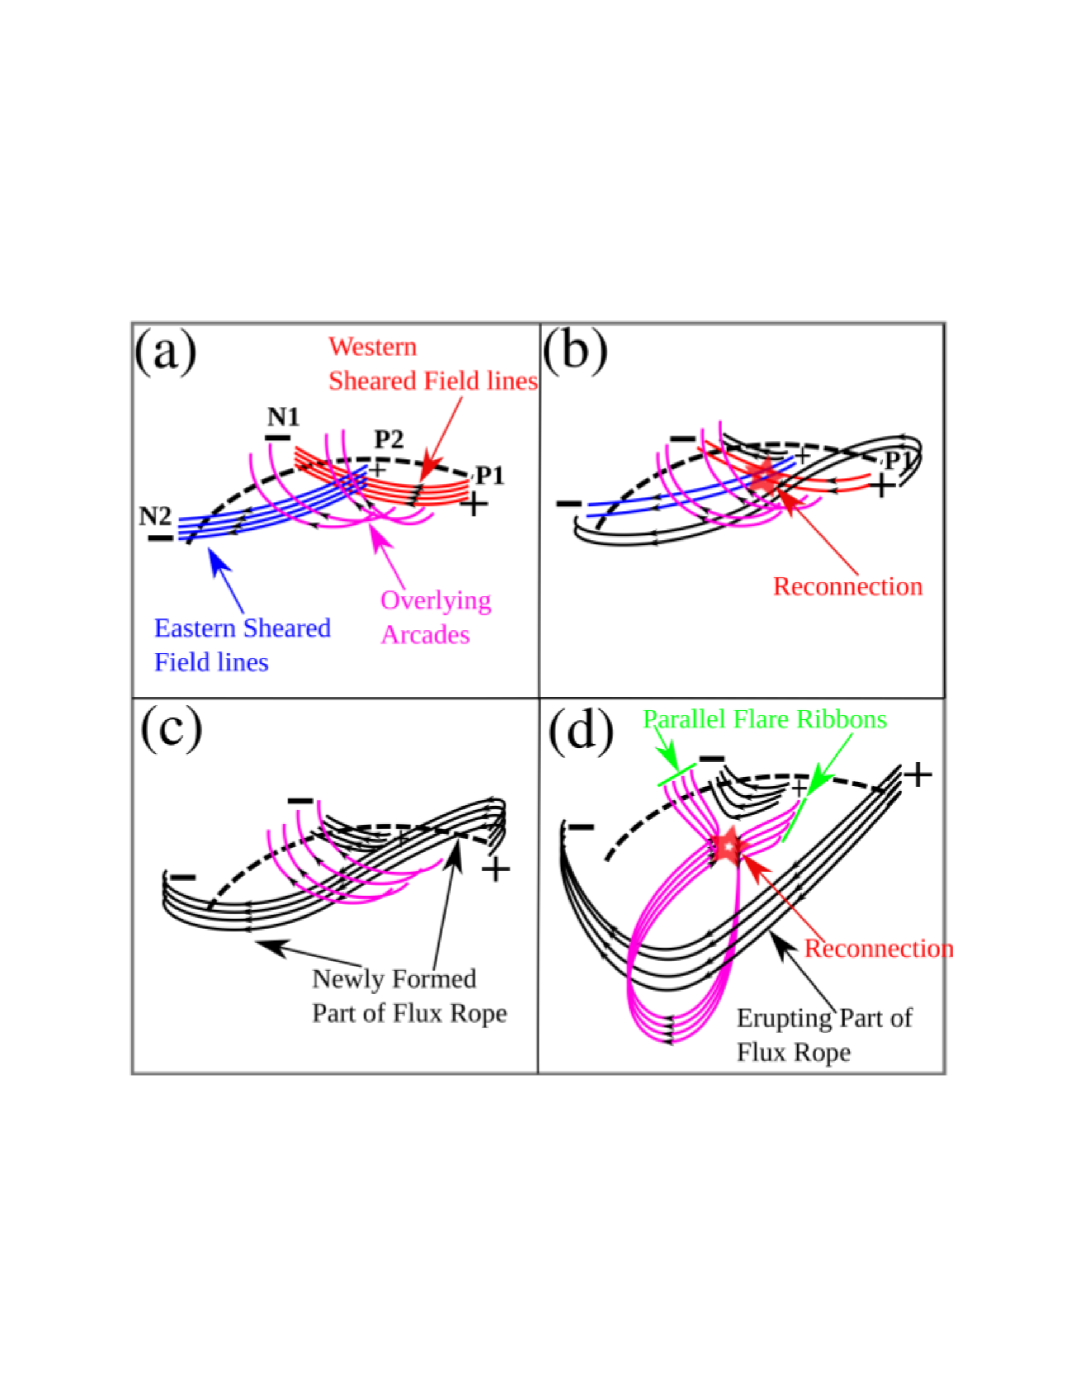
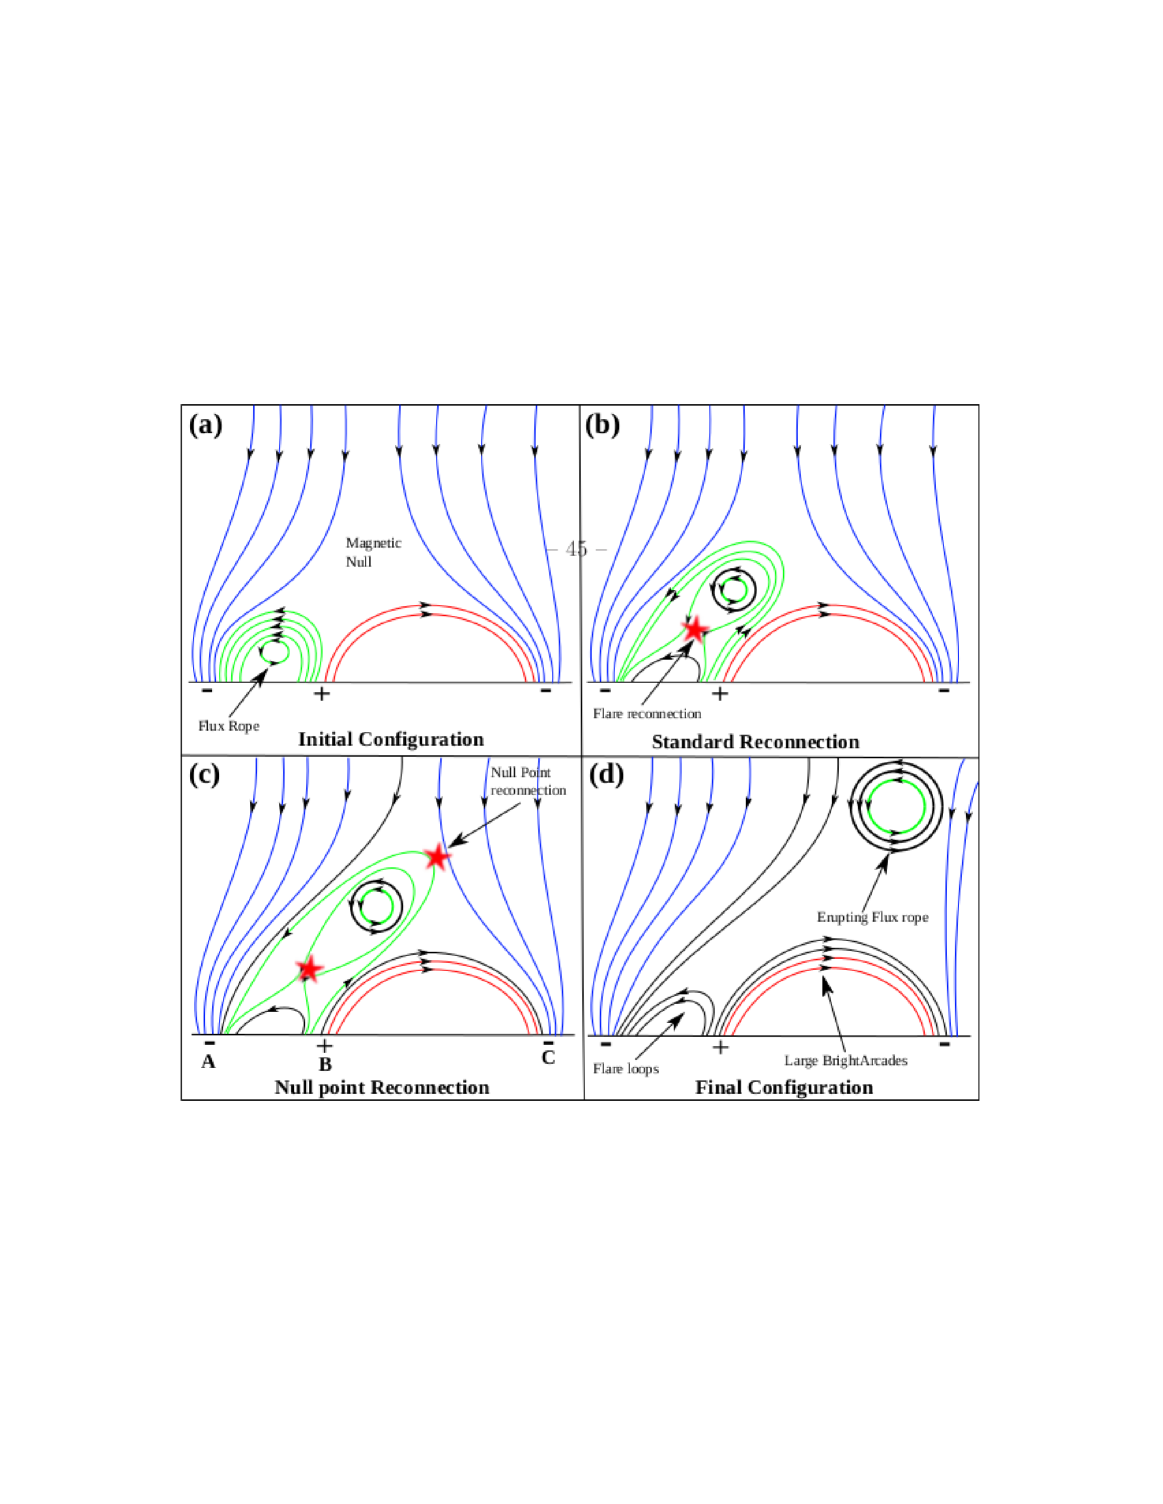
In our interpretation, this flux rope eruption and accompanying three-ribbon flare followed the two-component process outlined in Sections 4.2 and 4.3. The schematic of Figure 9, discussed above, describes the onset of the two-ribbon component. The schematic in Figure 14 describes the overall evolution of the event, including the circular-ribbon-component null-point reconnection.
Figures 14(a) and (b) show the situation as the flux rope formed in the two-ribbon component of the event erupts outward from the surface. This flux-rope eruption occurs inside the smaller (i.e. more compact) lobe of the inner fan dome. Because we have learned that the two-ribbon component of the eruption precedes the circular-ribbon component, we infer that the circular-ribbon component of the event starts when the erupting flux rope induces reconnection of its arcade envelope at the null point between the closed (inner) and far-reaching (outer) portions of the fan structure. The null-point reconnection results in the circular ribbon when particles from the null-point reconnection travel along the new dome field lines and impinge upon the chromosphere, heating that plasma to create the circular flare ribbon (Figure 14(c)). The circular ribbon structure can be seen clearly in several wavelength channels (Figures 10 and 11).
Several additional factors support our interpretation outlined in Figure 14: (1) the existence of null-point-like structure in the PFSS extrapolation; (2) the observation that the eruption of the flux rope is directed towards the null point; (3) the formation of the circular ribbon; and (4) the bserved RHESSI X–ray sources below the erupting flux rope, which is consistent with the geometry of Figure 14. Thus the erupting flux rope plays a key role in driving both the standard flare reconnection (e.g., Liu et al., 2007) that results in the parallel ribbons, and the null-point breakout reconnection (e.g., Sun et al., 2013; Joshi et al., 2015) that results in the circular ribbon.
The schematic in Figure 14 for our event is essentially the same as the schematic in Sterling et al. (2015) for X-ray jets in polar coronal holes (and similar schematics for active region coronal jets in Sterling et al., 2016, 2017). The field configuration we observe for the large-scale three-ribbon event studied here has a base size of 105 km, as determined by the approximate diameter of the circular ribbon. For the coronal jets, the same configuration occurs on a substantially smaller size scale, with a base size of 104 km.
Other than size scale, the eruption in our event has two main differences from the jet eruptions of Sterling et al. (2015). First, the erupting flux rope in our event, as pointed out in Section 4.2, carried no trackable dark filament of cool plasma, whereas the erupting flux rope in each of the jets studied by Sterling et al. (2015) did carry a trackable minifilament of cool plasma. Second, the erupting sheared-core arcade with the erupting flux rope in its core in our event blows out into the high corona and solar wind as a CME (that is, in this case most of the erupting arcade is not opened by the breakout reconnection), whereas in the coronal jets of Sterling et al. (2015) that are blowout jets, all of the blown-out arcade, including its minifilament-carrying core, is opened by the null-point reconnection and becomes part of the spire of the jet.
Figure 14 shows a variation of the jet schematic given in Sterling et al. (2016) where the cool minifilament, which would reside inside of the curled field lines on the left-hand-side bipole in panel (a), is omitted; thus, in this case the curled field lines indicate a minifilament-flux rope field that does not carry cool material. This is a better match than the schematic in Sterling et al. (2016) for the situation studied here with the large-scale eruption that does not include an obvious erupting cool filament. Even in the case of coronal jets though, even without the minifilament the minifilament-flux rope field could erupt, just as the large-scale event studied here had an erupting flux rope that did not carry a filament. Such minifilament flux ropes without cool minifilament material may erupt to cause jets in some cases (Sterling et al., 2017).
In Figure 14(b), reconnection is occurring beneath the erupting minifilament field, producing a brightening at the jet’s base (jet-base bright point, or JBP); this corresponds to the two-ribbon flare that we observe in the large-scale event here. Figure 14(c) shows the arcade envelope of the erupting minifilament during reconnection at the null, and this makes new hot loops on top of the larger bipole. The jet spire initially forms at the location of the null, and it can spread horizontally away from the JBP depending on the subsequent evolution of the erupting flux rope.
Comparing this jet picture with the large-scale eruption studied here, the JBP located between locations A and B of Figure 14(c) corresponds to the two-ribbon flare of Figure 9, and the large loop between locations B and C of Figure 14(c) corresponds to the illuminated inner fan dome. Comparing the jet schematics with the large-scale eruption in Figures 12, 14(c), and 14(d) shows well how the two circumstances are analogous: The JBP of jet is corresponds to the bright flare loops on the north side of the erupting region in Figures 12, and 14(c), and the new (red) field line over the larger lobe in Figure 14(c) corresponds to the heated and illuminated inner-fan loops of Figure 12.
Because Sterling et al. (2015) observed jets near the limb, remote flare brightenings in the form of a circular ribbon were not well situated for visual detection. Some studies of on-disk jets in active regions however observed such circular ribbons (e.g., Wang & Liu, 2012, 2014; Jiang et al., 2015; Sterling et al., 2016; Zhang et al., 2016; Li et al., 2017). Similar circular ribbons are also apparent, but often with lower intensity, in quiet Sun jets (Panesar et al., 2016). Partial circles of illumination at the bases of surges have also been observed (e.g., Öhman, 1972; Wang & Liu, 2012; Sterling et al., 2016; Hong et al., 2017).
According to the schematic of Sterling et al. (2015) (Figure 2 of that paper), a variation of which is the Figure 14 schematic, the implication is that in jets the JBP-producing flare reconnection occurs prior to the null-point reconnection, which in Figure 14 does not occur until panel (c). Actually however, whether the JBP-producing reconnection or the null-point reconnection occurs first in jets is so far an unexplored question. Our work here in Section 4.4 indicates that, at least for the large-scale eruptions presented here, the flare reconnection precedes the null-point reconnection.
Regarding the longer-term evolution, in the case of the jet, the erupting minifilament-flux-rope field moves out in a columnated fashion to form the jet. Typically however the erupting minifilament flux rope completely reconnects with the surrounding open (or far-reaching) field, and thus tends to have a highly-columnated jet structure. In the large-scale eruption, the flux rope contains enough flux so that the reconnection with the surrounding field does not consume much of the flux rope, and so the erupting arcade with the flux rope in it largely escapes intact to become the CME with a flux-rope core.
Therefore, the magnetic conditions resulting in the double-ribbon eruption of 2014 December 18 studied here happen across the wide range of size scales of solar eruptive events.
6 Discussion
We have presented a detailed analysis of an ejective eruption accompanying a GOES M6.9 class flare, using multi-wavelength data sets from SDO/AIA, RHESSI and GOES. The eruption produced three flare ribbons: two parallel ribbons that form according to the standard eruption/flare model as a flux rope forms and erupts, and a circular ribbon resulting from null-point reconnection between the arcade envelope of that erupting flux rope with a fan canopy of open field. The main results of the work are as follows:
-
1.
The observations as well as the PFSS extrapolation calculations clearly show the existence of a large-scale fan-spine type magnetic configuration over and around the eruption region. The northeast side of the inner fan lobe contains a strong neutral line on its inside.
-
2.
The whole event has two aspects, or components: The “two-ribbon” component starts along the strong neutral line of the closed inner fan dome, and produces a flux rope and flare with parallel flare ribbons in accordance with the standard model for eruptions. The “circular-ribbon” component occurs when the enveloping arcade of the erupting flux rope undergoes reconnection at the null point of the overlying fan; this results in formation of a quasi-circular flare ribbon at the locations where the newly-closed fan field is rooted in the lower atmosphere.
-
3.
The erupting flux rope therefore drives the production of all three flare ribbons. Standard flare tether-cutting reconnection is responsible for the formation of the two parallel ribbons, while the null-point reconnection is responsible for the large-scale quasi-circular ribbon.
-
4.
Leading to the eruption onset, flux cancelation occurs along the main PIL from which the flux rope erupts, and at the location where the initial flare brightenings (pre-flare brightenings) occur. This is consistent with tether cutting from evolutionary photospherically-driven flux cancelation at the PIL triggering the eruption, and with runaway tether-cutting reconnection initiating the eruption and growing the flux rope.
-
5.
A timing analysis shows that in this event the parallel ribbons unambiguously brightened prior to the onset of brightening of the circular ribbon. This is consistent with runaway tether-cutting reconnection starting prior to the start of the null-point “breakout” reconnection at the fan-dome magnetic null.
-
6.
The observed magnetic topology and overall morphology is consistent with this eruption being a large-scale version of the same processes occurring in coronal jets that occur according to the minifilament-eruption picture.
There have been previous observational studies of eruptions resulting in circular ribbons, based on magnetic configurations similar to that we study here: a fan dome with an erupting bipolar region inside it. These studies encompass both relatively-small-scale (Sun et al., 2013; Jiang et al., 2013), as well as relatively-large-scale (Joshi et al., 2015) eruptions. Joshi et al. (2015) investigated a configuration similar to that here in a different large-scale eruption. The observed results in this eruptive event confirms the earlier proposed scenario by Joshi et al. (2015) for a similar kind of eruption and multiple ribbons flare. These studies show that the eruptions inside of fan structures is a common occurrence on the Sun. Remote flare brightenings (analogous to the circular ribbons observed here) and transient fan-like-loop heating can also occur in somewhat different magnetic geometries, such as when the arcade envelope of an erupting flux rope rams into nearby coronal hole field (Sterling & Moore, 2001a).
In addition to studies suggesting that a flux rope (or sigmoid) eruption from the base of the fan dome drives null-point reconnection, and hence produces the circular ribbon flare (Sun et al., 2013; Jiang et al., 2014; Joshi et al., 2015), other studies suggest that shearing motion of the feet of the closed fan field by photospheric flow may drive the reconnection at the null point (Vemareddy & Wiegelmann, 2014). In our case here though it is very clear that the eruption of flux rope drives the null-point reconnection (see Section 4.2).
Also however, the sequential circular-ribbon brightening from east to west (see Figure 10 and accompanying animations) may provide some evidence of slip-running type reconnection at the null point. Similar sequential ribbon brightening has previously been observed and discussed (Masson et al., 2009; Reid et al., 2012; Sun et al., 2013).
The eruption of flux ropes to produce both a set of standard-flare parallel ribbons and a circular ribbon has only recently started to be studied in detail; our study here provides another example of such an event. These studies, together with those of jets and other phenomena, are helping to put together a coherent picture of various solar eruptions. Observational studies such as these promise to provide important input for numerical simulations of eruptions in various magnetic geometries. More observational studies as well as simulations are needed to refine the understanding of such events. Moreover, the study of events such as the one here occurring near solar-disk center will provide important inputs for improving space weather forecasting.
References
- Antiochos et al. (1999) Antiochos, S. K., DeVore, C. R., & Klimchuk, J. A. 1999, ApJ, 510, 485
- Aulanier et al. (2000) Aulanier, G., DeLuca, E. E., Antiochos, S. K., McMullen, R. A., & Golub, L. 2000, ApJ, 540, 1126
- Aulanier et al. (2012) Aulanier, G., Janvier, M., & Schmieder, B. 2012, A&A, 543, A110
- Aulanier et al. (2006) Aulanier, G., Pariat, E., Démoulin, P., & DeVore, C. R. 2006, Sol. Phys., 238, 347
- Aurass et al. (2013) Aurass, H., Holman, G., Braune, S., Mann, G., & Zlobec, P. 2013, A&A, 555, A40
- Benz (2008) Benz, A. O. 2008, Living Reviews in Solar Physics, 5, 1
- Carley et al. (2016) Carley, E. P., Vilmer, N., & Gallagher, P. T. 2016, ArXiv e-prints
- Carmichael (1964) Carmichael, H. 1964, NASA Special Publication, 50, 451
- Chen et al. (2014) Chen, H., Zhang, J., Cheng, X., Ma, S., Yang, S., & Li, T. 2014, ApJ, 797, L15
- Chen et al. (2016) Chen, Y., et al. 2016, ApJ, 820, L37
- Cheng et al. (2013) Cheng, X., Zhang, J., Ding, M. D., Olmedo, O., Sun, X. D., Guo, Y., & Liu, Y. 2013, ApJ, 769, L25
- Demoulin et al. (1996) Demoulin, P., Henoux, J. C., Priest, E. R., & Mandrini, C. H. 1996, A&A, 308, 643
- Dudík et al. (2014) Dudík, J., Janvier, M., Aulanier, G., Del Zanna, G., Karlický, M., Mason, H. E., & Schmieder, B. 2014, ApJ, 784, 144
- Dudík et al. (2016) Dudík, J., et al. 2016, ApJ, 823, 41
- Fletcher & Hudson (2001) Fletcher, L., & Hudson, H. 2001, Sol. Phys., 204, 69
- Freeland & Handy (1998) Freeland, S. L., & Handy, B. N. 1998, Sol. Phys., 182, 497
- Gou et al. (2016) Gou, T., Liu, R., Wang, Y., Liu, K., Zhuang, B., Chen, J., Zhang, Q., & Liu, J. 2016, ApJ, 821, L28
- Hirayama (1974) Hirayama, T. 1974, Sol. Phys., 34, 323
- Hong et al. (2017) Hong, J., Jiang, Y., Yang, J., Li, H., & Xu, Z. 2017, ApJ, 835, 35
- Janvier et al. (2014) Janvier, M., Aulanier, G., Bommier, V., Schmieder, B., Démoulin, P., & Pariat, E. 2014, ApJ, 788, 60
- Janvier et al. (2015) Janvier, M., Aulanier, G., & Démoulin, P. 2015, Sol. Phys., 290, 3425
- Jiang et al. (2013) Jiang, C., Feng, X., Wu, S. T., & Hu, Q. 2013, ApJ, 771, L30
- Jiang et al. (2014) Jiang, C., Wu, S. T., Feng, X., & Hu, Q. 2014, ApJ, 780, 55
- Jiang et al. (2015) Jiang, F., Zhang, J., & Yang, S. 2015, PASJ, 67, 78
- Joshi et al. (2016a) Joshi, N. C., Filippov, B., Schmieder, B., Magara, T., moon, Y.-J., & Uddin, W. 2016a, ApJ, 825, 123
- Joshi et al. (2015) Joshi, N. C., Liu, C., Sun, X., Wang, H., Magara, T., & Moon, Y.-J. 2015, ApJ, 812, 50
- Joshi et al. (2014) Joshi, N. C., Magara, T., & Inoue, S. 2014, ApJ, 795, 4
- Joshi et al. (2016b) Joshi, N. C., Schmieder, B., Magara, T., Guo, Y., & Aulanier, G. 2016b, ApJ, 820, 126
- Joshi et al. (2013) Joshi, N. C., Srivastava, A. K., Filippov, B., Uddin, W., Kayshap, P., & Chandra, R. 2013, ApJ, 771, 65
- Kliem & Török (2006) Kliem, B., & Török, T. 2006, Physical Review Letters, 96, 255002
- Kopp & Pneuman (1976) Kopp, R. A., & Pneuman, G. W. 1976, Sol. Phys., 50, 85
- Lemen et al. (2012) Lemen, J. R., et al. 2012, Sol. Phys., 275, 17
- Li et al. (2017) Li, H., Jiang, Y., Yang, J., Yang, B., Xu, Z., Hong, J., & Bi, Y. 2017, ApJ, 836, 235
- Li & Zhang (2015) Li, T., & Zhang, J. 2015, ApJ, 804, L8
- Lin et al. (2002) Lin, R. P., et al. 2002, Sol. Phys., 210, 3
- Liu et al. (2013) Liu, C., Deng, N., Lee, J., Wiegelmann, T., Moore, R. L., & Wang, H. 2013, ApJ, 778, L36
- Liu et al. (2012) Liu, C., et al. 2012, ApJ, 745, L4
- Liu et al. (2007) Liu, C., Lee, J., Yurchyshyn, V., Deng, N., Cho, K.-s., Karlický, M., & Wang, H. 2007, ApJ, 669, 1372
- Masson et al. (2009) Masson, S., Pariat, E., Aulanier, G., & Schrijver, C. J. 2009, ApJ, 700, 559
- McCauley et al. (2015) McCauley, P. I., Su, Y. N., Schanche, N., Evans, K. E., Su, C., McKillp, S., & Reeves, K. K. 2015, Sol. Phys., 290, 1703
- Moore & Labonte (1980) Moore, R. L., & Labonte, B. J. 1980, In: in IAU Symp. 91, Solar and interplanetary dynamics; Proceedings of the Symposium, Cambridge, Mass., August 27-31, 1979. (A81-27626 11-92), 207
- Moore & Sterling (2006) Moore, R. L., & Sterling, A. 2006, In: Geophysical Monograph Series - Volume 165 - Title: Solar Eruptions and Energetic Particles), 43
- Moore & Sterling (2007) Moore, R. L., & Sterling, A. C. 2007, ApJ, 661, 543
- Moore et al. (2001) Moore, R. L., Sterling, A. C., Hudson, H. S., & Lemen, J. R. 2001, ApJ, 552, 833
- Öhman (1972) Öhman, Y. 1972, Sol. Phys., 23, 134
- Panesar et al. (2016) Panesar, N. K., Sterling, A. C., Moore, R. L., & Chakrapani, P. 2016, ApJ, 832, L7
- Pariat et al. (2009) Pariat, E., Antiochos, S. K., & DeVore, C. R. 2009, ApJ, 691, 61
- Priest & Démoulin (1995) Priest, E. R., & Démoulin, P. 1995, J. Geophys. Res., 100, 23443
- Priest & Forbes (2002) Priest, E. R., & Forbes, T. G. 2002, A&A Rev., 10, 313
- Reid et al. (2012) Reid, H. A. S., Vilmer, N., Aulanier, G., & Pariat, E. 2012, A&A, 547, A52
- Schmieder et al. (2015) Schmieder, B., Aulanier, G., & Vršnak, B. 2015, Sol. Phys., 290, 3457
- Schou et al. (2012) Schou, J., et al. 2012, Sol. Phys., 275, 229
- Schrijver & De Rosa (2003) Schrijver, C. J., & De Rosa, M. L. 2003, Sol. Phys., 212, 165
- Shibata (1999) Shibata, K. 1999, Ap&SS, 264, 129
- Shibata & Magara (2011) Shibata, K., & Magara, T. 2011, Living Reviews in Solar Physics, 8, 6
- Shibata et al. (1995) Shibata, K., Masuda, S., Shimojo, M., Hara, H., Yokoyama, T., Tsuneta, S., Kosugi, T., & Ogawara, Y. 1995, ApJ, 451, L83
- Sterling et al. (2007) Sterling, A. C., Harra, L. K., & Moore, R. L. 2007, ApJ, 669, 1359
- Sterling & Moore (2001a) Sterling, A. C., & Moore, R. L. 2001a, ApJ, 560, 1045
- Sterling & Moore (2001b) Sterling, A. C., & Moore, R. L. 2001b, J. Geophys. Res., 106, 25227
- Sterling & Moore (2004) Sterling, A. C., & Moore, R. L. 2004, ApJ, 602, 1024
- Sterling & Moore (2005) Sterling, A. C., & Moore, R. L. 2005, ApJ, 630, 1148
- Sterling et al. (2015) Sterling, A. C., Moore, R. L., Falconer, D. A., & Adams, M. 2015, Nature, 523, 437
- Sterling et al. (2014) Sterling, A. C., Moore, R. L., Falconer, D. A., & Knox, J.-M. 2014, ApJ, 788, L20
- Sterling et al. (2016) Sterling, A. C., Moore, R. L., Falconer, D. A., Panesar, N.-K., Akiyama, S., Yashiro, S., & Gopalswamy, N. 2016, ApJ, 821, 100
- Sterling et al. (2017) Sterling, A. C., Moore, R. L., Falconer, D. A., Panesar, N.-K., & Martinez, F. 2017, ApJ, submitted
- Sterling et al. (2011) Sterling, A. C., Moore, R. L., & Freeland, S. L. 2011, ApJ, 731, L3
- Sturrock (1966) Sturrock, P. A. 1966, Nature, 211, 695
- Sturrock et al. (1984) Sturrock, P. A., Kaufman, P., Moore, R. L., & Smith, D. F. 1984, Sol. Phys., 94, 341
- Su et al. (2009) Su, Y., van Ballegooijen, A., Schmieder, B., Berlicki, A., Guo, Y., Golub, L., & Huang, G. 2009, ApJ, 704, 341
- Sun et al. (2013) Sun, X., Hoeksema, J. T., Liu, Y., Aulanier, G., Su, Y., Hannah, I. G., & Hock, R. A. 2013, ApJ, 778, 139
- Tandberg-Hanssen et al. (1980) Tandberg-Hanssen, E., Martin, S. F., & Hansen, R. T. 1980, Sol. Phys., 65, 357
- Török et al. (2009) Török, T., Aulanier, G., Schmieder, B., Reeves, K. K., & Golub, L. 2009, ApJ, 704, 485
- Török & Kliem (2005) Török, T., & Kliem, B. 2005, ApJ, 630, L97
- Török et al. (2004) Török, T., Kliem, B., & Titov, V. S. 2004, A&A, 413, L27
- Tsuneta et al. (1997) Tsuneta, S., Masuda, S., Kosugi, T., & Sato, J. 1997, ApJ, 478, 787
- Vemareddy & Wiegelmann (2014) Vemareddy, P., & Wiegelmann, T. 2014, ApJ, 792, 40
- Wang & Liu (2012) Wang, H., & Liu, C. 2012, ApJ, 760, 101
- Wang & Liu (2014) Wang, H., & Liu, C. 2014, ApJ, 781, L23
- Xue et al. (2017) Xue, Z., Yan, X., Yang, L., Wang, J., & Zhao, L. 2017, ApJ, 840, L23
- Zhang et al. (2016) Zhang, Q. M., Li, D., Ning, N. J., Su, Y.-N., Ji, H. S., & Guo, Y. 2016, ApJ, 827, 27