Galaxy: center – Galaxy: kinematics and dynamics – Galaxy: halo – ISM: atoms – radio lines: ISM – radio continuum: ISM
Giant HI Hole inside the 3-kpc Ring and the North Polar Spur – The Galactic Crater –
Abstract
Applying a newly developed tangent-circle method (TCM), we derive a volume density map of HI gas in the inner Galaxy as a function of galacto-centric distance and height . The HI hole around the Galactic Center (GC) is shown to have a crater-shaped wall, which coincides with the brightest ridge of the North Polar Spur and emanates from the 3-kpc expanding ring. The crater structure is explained by sweeping of the halo gas by a shock-wave from the GC. The unperturbed HI halo outside 3 kpc is shown to be in hydrostatic equilibrium, obeying the sech density law with a scale height pc.
1 Introduction
Among the number of expanding features in the Galactic disk, the most massive object is known as the 3-kpc ring in the HI- and CO-line observations (Cohen and Davies 1976; Bania 1977; Oort 1977 for review; Dame and Thaddeus 2008; Garcia et al. 2014). The near-side arm of the ring is approaching, and therefore, expanding at velocity of km s-1(Cohen and Davies 1976; Oort 1977), and the far-side is receding at km s-1(Dame and Thaddeus 2008). For such a motion the ring has been interpreted as an expanding shock front driven by an explosion at the Galactic Center (GC) (Sanders and Prendergast 1974; Oort 1977; Sofue 1976, 1977; 1984). Coinciding with the ring, a giant HI hole has been found in the halo around the GC, which was interpreted as a void swept by the nuclear wind associated with the Fermi Bubbles (Lockman 1984; Lockman and McClure-Griffiths 2016).
As the Milky Way is evidenced to be a barred galaxy, the ring’s motion has been more widely believed to be due to an oval flow in the bar potential (Binney et al. 1991; Rodriguez-Fernandez and Combes 2008). On the other hand, the explosion hypothesis has recently been highlighted according to accumulating evidences and arguments for energetic phenomena in the GC such as the high-temperature plasma (Uchiyama et al. 2013), bipolar hyper shells (BHS) in radio and X-rays (Sofue 1994, 2000, 2017; Bland-Hawthorn and Cohen 2003; Sofue et al. 2016; and the literature therein for observations), and the Fermi Bubbles in -rays (Su et al. 2010; Bordoloi et al. 2017). Also, if the Galaxy is barred, the activity in the GC is inevitable as the consequence of bar-shocked gas accretion.
In this paper, we investigate the relationship of the HI hole discovered by Lockman and McClure-Griffiths (2016) with the 3-kpc HI ring and the North Polar Spur, and discuss their origin based on the GC explosion model.
2 Radio and HI Spurs
Lockman and McClure-Griffiths (2016) showed that the HI hole has a clear wall at kpc, recognized as a remarkable change of vertical extent in the channel maps at km s-1at tangent longitude of . The integrated intensity (column density) map along the tangent circle showed a bipolar void surrounding the Fermi Bubbles, and they explained the structure as due to galactic wind-driven HI hole.
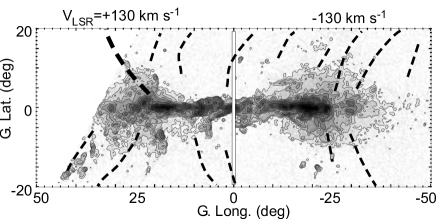
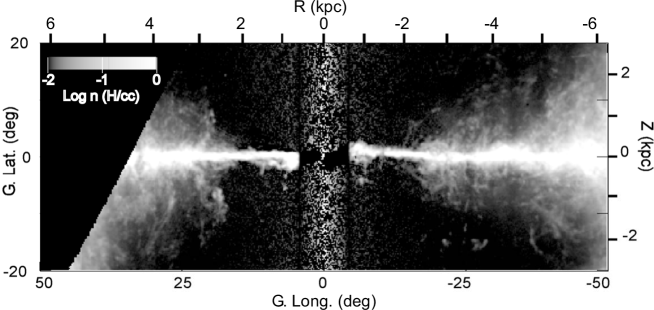
Figure 1 shows mosaic channel maps at km s-1produced from the HI Galactic All-Sky Survey (GASS; McClure-Griffiths et al. 2009; Kalberla et al. 2010). Symmetric HI spurs emanate from the tangential directions of the 3-kpc ring at . Using the GASS HI survey data, we measured the brightness of the wall to be K, less bright than the main disk, but the latitudinal extension is as large as , reaching altitudes kpc.
In the figure we indicate the radio continuum spurs by the dashed lines, which show the North Polar Spur (NPS), NPS-West, South Polar Spur (SPS), and SPS-West as identified by Sofue (2000). The spurs are commonly traced in galactic surveys of the synchrotron radio emission (Haslam et al. 1982; Reich et al. 2001; Planck Collaboration et al. 2016).
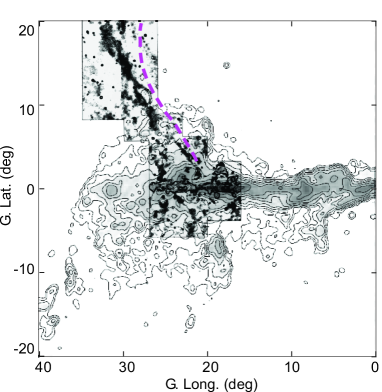
Figure 2 enlarges the same at km s-1, where we overlay the background-filtered 1420 MHz radio continuum map taken from Sofue and Reich (1979). Also shown is the X-ray ridge in the R7 (1.4 keV) band as obtained from a ROSAT image (Snowden et al. 1997), which coincides with the radio NPS, located slightly inside. The figure demonstrates a remarkable coincidence of the NPS with the 3-kpc HI ring and the wall of the HI hole.
3 Vertical Density Profile
Figure 3 shows vertical (-directional) cross sections of the HI brightness at different radial velocities, which show two components with narrow and wide scale heights. We fit the distribution by two gas layers in gravitational equilibrium in the direction expressed as
| (1) |
where is the hydrostatic scale height of the layer (Spitzer 1942). Accordingly, the brightness temperature of the HI emission at a given is expressed by
| (2) |
where and are the temperature at the midplane and the scale height of the -th components, respectively. Here, and 2 represent the disk and halo components, respectively.
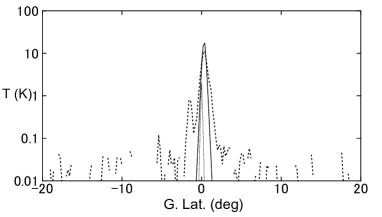
km s-1
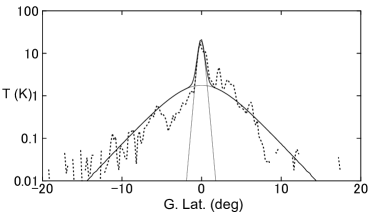
km s-1
By the method we determined and at each longitude. In the inner region with terminal velocity higher than km s-1, the profiles are fitted by one-disk with small scale height. On the other hand at lower velocities than km s-1, or at larger longitude than , the profiles are fitted by two components with narrow and wide scale heights. The midplane temperature and scale heights toward the 3-kpc ring are determined to be K and (74 pc) for the disk, and K and (450 pc) for the halo component. The halo component is thus well fitted by the sech2 function, indicating that the gas is in gravitational equilibrium. The tight disk component, having pc, represents the main HI disk in the current galactic studies (e.g. Nakanishi and Sofue 2003, 2005, 2015), corresponding to a velocity dispersion of km s-1.
The halo component, showing large scale height of pc, has an order of magnitude less intensity compared to the disk, and is well represented by the hydrostatic equilibrium profile. In order for the gas to be vertically extended to this height, the velocity dispersion must be as large as km s-1. The HI halo can be traced up to above the detection limit of K, indicating that the outskirt is extending to height of kpc
4 Volume Density Map by Tangent-Circle Method (TCM)
The column density of HI and H2 gases is related to the velocity integrated intensity of the brightness temperature by
| (3) |
and to the local volume density by
| (4) |
where is the conversion factor for HI () and CO (). We here consider the gas distribution along the tangent circle, which traces the gas having radial velocities equal to the terminal velocities. Using the relation , , and at the tangent points, we obtain
| (5) |
We here assume that the HI gas is optically thin, as we are interested in the halo gas.
We can thus transform the observed brightness temperature on the LV diagram along the terminal velocity ridge into the local volume density as a function of the radius . We call this method the tangent-circle method (TCM). The method can avoid the degenerate depth problem at the tangent points when calculating the volume density from the intensity (column density).
We applied the TCM to the HI line data from the GASS (McClure-Griffiths et al. 2009; Kalberla et al. 2010), Leiden-Argentine-Bonn (LAB) HI survey (Kalberla et al. 2005), and CO line data from the Columbia galactic plane CO-line survey (Dame et al. 2001). In order to calculate , we adopt the most recent Galactic constants ( kpc and km s-1: Honma et al. 2015) and rotation curve (Sofue 2016). The conversion factors are taken to be H cm-2 and H2 cm-2 H cm-2.
Figure 4 shows the distribution map of the H density, , along the tangent circle in the and plane. Thereby, the TCM was applied to the terminal velocity ridge approximated by a straight line in the LV diagram parallel to the tangent ridge around . By this approximation, the map is not accurate at and . The map is essentially the same as the column density map obtained by Lockman and McClure-Griffiths (2016). However, it gives the volume density distribution, which exhibits a sharper and clearer-cut wall thanks to the pin-pointing nature of the solar-circle gas by the TCM.
In figure 5 we compare the HI density profiles at fixed latitudes with those of the CO-line and radio continuum emissions. Panels (a)-(c) show:
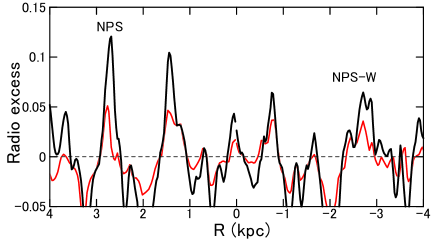
(a) Radio continuum excess at 408 (Haslam et al. 1982) and 1420 MHz (Reich et al. 2001) at . The radio excess is defined by , where is the brightness temperature and is the smoothed intensity in an area around each data point.
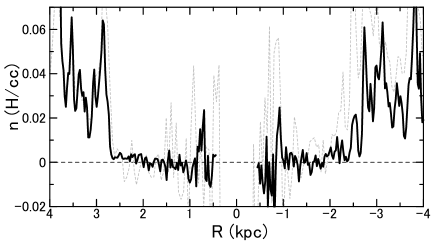
(b) HI density profiles at , where the full and dashed lines show the results for the GASS and LAB data, respectively. The difference between the two results are due to the difference in the beam widths as well as the noise levels. The increasing scatter toward the GC is due to the cot effect in equation 5 on the errors.
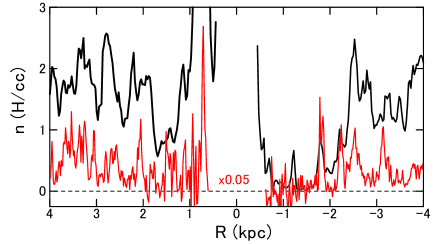
(c) HI and molecular hydrogen densities along the galactic plane at from GASS and Columbia CO survey data.
(a) Radio conti. excess at
(b) HI at
(c) HI and CO at
The HI crater is now evident in the profiles at pc). It is remarkable that the crater edges exactly coincide with the radio continuum peaks of the NPS and NPS-W. About the same HI profiles were obtained at as well as at negative latitudes except for the decreasing density with .
The HI density inside the hole is as low as . At the edge of the hole, the intensity suddenly increases to a sharp peak at kpc, making a clear-cut wall. The peak density in the wall is . The full radial width at half-density of the wall is measured to be kpc in the first quadrant ().
The HI profile in the galactic plane () is similar, but much milder. The intensity peaks representing the 3-kpc ring appear at kpc, coinciding with the HI walls. The peak HI density is , and the full width of the ring is kpc. It is found that the peak of the 3-kpc ring is more evident at negative longitudes.
The molecular disk is clumpy (figure 5(a) red lines), while it still exhibits peaks at kpc with density of . The molecular fraction (molecular density/total density) in the peaks (wall) is , lower than that in the surrounding regions with , in agreement with the variation of molecular fraction in the inner Galaxy obtained by Sofue and Nakanishi (2016).
Using the measured parameters we calculated the total mass of the 3-kpc ring, assuming a perfect circle around the GC with a constant peak density. We also calculated the kinetic energy, assuming that the expansion velocity is km s-1. The derived quantities are listed in table 1.
| CO ring | HI ring | HI wall | HI hole | Total | |
| Radius†, (kpc) | 2.7 | 2.8 | 2.9 | 2.8 | — |
| Scale height, (kpc) | 0.07 | 0.07 | 0.4 | — | |
| Width, (kpc) | 0.15 | 0.3 | 0.15 | — | — |
| Density, () | 13 | 2.5 | 0.1 | — | |
| Mass, () | — | ||||
| Expa. vel‡, (km s-1) | 53 | 53 | 53 | — | — |
| Kin. Energy, (erg) | — | ||||
| for kpc; Cohen and Davies (1976) |
5 A Model for the HI Crater
We now examine if the crater structure in the HI halo can be explained by sweeping of the halo gas by an explosive event in the GC based on the bipolar-hyper-shell (BHS) model of the NPS (Sofue 2000; Sofue et al. 2016). The propagation of a shock wave from the Center is calculated using the Sakashita’s (1971) method to trace radial ray paths of an adiabatic shock wave.
The unperturbed gas disk and halo are assumed to be composed of stratified layers with density distributions represented by the hydrostatic equilibrium in the direction (Spitzer 1942). It is assumed that the disks are further embedded in an intergalactic gas with uniform, low-density gas. We express the density distribution as
| (6) |
Here, and 3 represent the disk, HI halo, and a constant background. We here take and H cm-3, and pc, and .
Figure 6 shows the calculated result for an initial injection energy erg. The shock front is drawn in the plane every 1 My up to 10 My. As the shock wave expands, the front shape becomes elongated in the vertical direction due to the steep pressure gradient toward the halo. As the shock wave is blown off into the halo, the front shape gets dumbbell shaped, making a BHS. The dumbbell’s equator is sharply pinched by the dense disk at the galactic plane. At elapsed time of My, the BHS front approximately mimics the NPS, SPS, NPS-W and SPS-W.
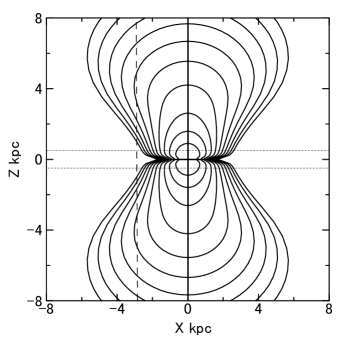
The expanding velocity of the front at intermediate latitudes corresponding to the main NPS ridge is km s-1. This velocity is coincident with the required velocity to heat the shocked gas to a temperature K responsible for the observed X-ray emission in the NPS (Snowden et at al. 1997; Sofue et al. 2016). Note, however, the shock-heated gas inside the shock front is no more neutral (HI), but is ionized to X-ray temperatures, and is not observed in the HI line emission. The HI wall outside the shock front is in a pre-shock compression stage, and is observed as the expanding HI ring. The ring’s expansion is still slow, as observed to be expanding at km s-1, and approximately obeys the normal galactic rotation.
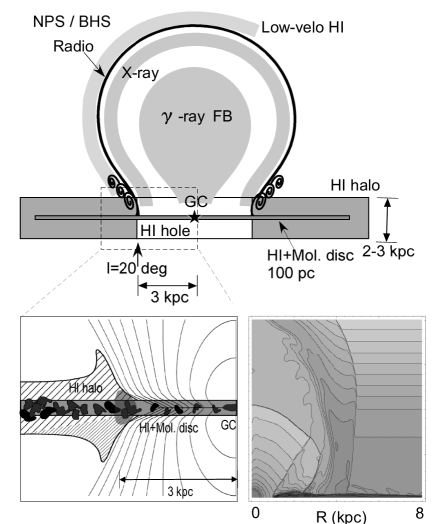
In figure 7 we schematically summarize the view about the radio and X-ray NPS (BHS), 3-kpc ring, HI hole and wall, HI halo, and the dense main (HI+H2) disk. The enlarged illustration is drawn by referring to the hydrodynamical BHS model, showing that the dense disk is kept unperturbed inside the global front. The view is consistent with the hydrodynamic simulation shown by the inserted reproduction from Sofue et al. (2016) at 10 My. In the present model, the Fermi Bubble is considered to be a younger object of a few My related to the innermost expanding ring in the GC (Sofue 2017).
6 Discussion
6.1 Summary
We derived the volume density map of HI gas along the tangent circle, and showed that the HI halo has a large crater-shaped structure around the GC. Thereby, we developed the TCM for pin-pointing the solar-circle gas without suffering from the kinematically degenerate depth problem in the tangent-circle direction.
The wall of the HI crater positionally coincides with the brightest emission ridge of the NPS and the tangential direction of the 3-kpc expanding ring. While the HI hole inside the crater is almost empty, the outside halo is not disturbed, being kept in hydrostatic equilibrium (sech) with a scale height kpc.
The origin of the crater structure is explained by a shock wave model based on the giant explosion hypothesis at the GC. Figure 7 summarizes the observed structures in HI, CO, radio, X-ray, and rays.
6.2 Some difficulties in the models
In our model the shock front expands into the halo, whereas the dense galactic disk is not strongly disturbed. In order to accelerate the 3 kpc ring to the observed velocity, Sanders and Prendergast (1974) had to assume an energy as large as erg, but such a huge explosion totally destroyed the disk. Therefore, the hydrodynamical models cannot reproduce the expanding motion of the 3-kpc ring. Such a local acceleration could be possible by refraction of waves transmitting the halo and focusing onto the disk as suggested by the MHD wave propagation model (Sofue 1977, 1984).
This kinematics problem is not encountered by the bar hypothesis (e.g. Binney et al. 1991), where no energetic explosion is required to produce the non-circular motion. On the other hand, the largely extended vertical structure of the HI wall and the empty hole in the HI halo might not be easy to explain by the bar.
6.3 Low-velocity HI shell
It has been suggested that low-velocity HI gas at km s-1apparently surrounds the NPS (Heiles et al. 1980). However, it is not clear if the HI is indeed related, because the low velocity HI map is full of bright, often much brighter, local HI shells and filaments, making it difficult to confirm their true relation.
If the HI outer shell is indeed associated with the NPS, the following scenario would be possible. The swept-up gas by the BHS is compressed to form high-temperature X-ray gas, while the densest front cools down to neutral gas and drops toward the disk. Since the snow-plowed gas has not enough angular momentum, the galactic rotation is somehow canceled by the dropping gas. A dynamical model taking account of the cooling of compressed gas to HI temperature remains as a subject for future consideration.
Acknowledgements
The author is grateful to the authors of the GASS and LAB HI surveys and the Columbia CO survey for providing us with the archival data cubes.
References
- Bania (1977) Bania T. M., 1977, ApJ, 216, 381
- Binney et al. (1991) Binney J., Gerhard O. E., Stark A. A., Bally J., Uchida K. I., 1991, MNRAS, 252, 210
- Bland-Hawthorn and Cohen (2003) Bland-Hawthorn, J., and Cohen, M. 2003, ApJ, 582, 246
- Bordoloi et al. (2017) Bordoloi R., et al., 2017, ApJ, 834, 191
- Cohen & Davies (1976) Cohen R. J., Davies R. D., 1976, MNRAS, 175, 1
- Crocker et al. (2015) Crocker R. M., Bicknell G. V., Taylor A. M., Carretti E., 2015, ApJ, 808, 107
- (7) Dame, T. M., Hartman, D., Thaddeus, P. 2001, ApJ 547, 792.
- Dame & Thaddeus (2008) Dame T. M., Thaddeus P., 2008, ApJ, 683, L143
- García et al. (2014) García P., Bronfman L., Nyman L., Dame T. M., Luna A., 2014, ApJS, 212, 2
- Haslam et al. (1982) Haslam, C. G. T., Salter, C. J., Stoffel, H., & Wilson, W. E. 1982, AAS, 47, 1
- Heiles et al. (1980) Heiles C., Chu Y.-H., Troland T. H., Reynolds R. J., Yegingil I., 1980, ApJ, 242, 533
- Honma, Nagayama, & Sakai (2015) Honma M., Nagayama T., Sakai N., 2015, PASJ, 67, 70
- Kalberla et al. (2005) Kalberla, P. M. W., Burton, W. B., Hartmann, D., et al. 2005, AA, 440, 775
- Kalberla et al. (2010) Kalberla P. M. W., et al., 2010, A&A, 521, A17 , 722, 367
- Lallement et al. (2016) Lallement R., Snowden S., Kuntz K. D., Dame T. M., Koutroumpa D., Grenier I., Casandjian J. M., 2016, A&A, 595, A131
- Lockman (1984) Lockman F. J., 1984, ApJ, 283, 90
- Lockman & McClure-Griffiths (2016) Lockman F. J., McClure-Griffiths N. M., 2016, ApJ, 826, 215
- McClure-Griffiths et al. (2009) McClure-Griffiths N. M., et al., 2009, ApJS, 181, 398
- Nakanishi & Sofue (2016) Nakanishi H., Sofue Y., 2016, PASJ, 68, 5
- Oort (1977) Oort J. H., 1977, ARAA, 15, 295
- Planck Collaboration et al. (2016) Planck Collaboration, et al., 2016, A&A, 594, A25
- Reich, Testori, & Reich (2001) Reich P., Testori J. C., Reich W., 2001b, A&A, 376, 861
- Sakashita (1971) Sakashita S., 1971, ApSS, 14, 431
- Sanders & Prendergast (1974) Sanders R. H., Prendergast K. H., 1974, ApJ, 188, 489
- Snowden et al. (1997) Snowden S. L., et al., 1997, ApJ, 485, 125
- Sofue (1976) Sofue Y., 1976, PASJ, 28, 19
- Sofue (1977) Sofue, Y. 1977, AA 60, 327.
- Sofue (1984) Sofue Y., 1984, PASJ, 36, 539
- (29) Sofue, Y. 1994, ApJ.L., 431, L91
- Sofue (2000) Sofue, Y. 2000, ApJ, 540, 224
- Sofue (2016) Sofue Y., 2016, PASJ, 68, 2
- Sofue (2017) Sofue, Y. 2017, MNRAS, in press.
- Sofue et al. (2016) Sofue Y., Habe A., Kataoka J., Totani T., Inoue Y., Nakashima S., Matsui H., Akita M., 2016, MNRAS, 459, 108
- Sofue & Nakanishi (2016) Sofue Y., Nakanishi H., 2016, PASJ, 68, 63
- Sofue, Reich (1979) Sofue, Y. and Reich, W. 1979 AAS 38, 251
- Spitzer (1942) Spitzer L., Jr., 1942, ApJ, 95, 329
- Su et al. (2010) Su, M., Slatyer, T. R., and Finkbeiner, D. P. 2010, ApJ, 724, 1044
- Uchiyama et al. (2013) Uchiyama H., Nobukawa M., Tsuru T. G., Koyama K., 2013, PASJ, 65, 19