Blueprint for nanoscale NMR
Abstract
Nitrogen vacancy (NV) centers in diamond have been used as ultrasensitive magnetometers to perform nuclear magnetic resonance (NMR) spectroscopy of statistically polarized samples at 1 - 100 nm length scales. However, the spectral linewidth is typically limited to the kHz level, both by the NV sensor coherence time and by rapid molecular diffusion of the nuclei through the detection volume which in turn is critical for achieving long nuclear coherence times. Here we provide a blueprint for a set-up that combines a sensitivity sufficient for detecting NMR signals from nano- to micron-scale samples with a spectral resolution that is limited only by the nuclear spin coherence, i.e. comparable to conventional NMR. Our protocol detects the nuclear polarization induced along the direction of an external magnetic field with near surface NV centers using lock-in detection techniques to enable phase coherent signal averaging. Using NV centers in a dual role of NMR detector and optical hyperpolarization source to increase signal to noise, and in combination with Bayesian interference models for signal processing, nano/microscale NMR spectroscopy can be performed on sub-millimolar sample concentrations, several orders of magnitude better than the current state of the art.
Introduction — Nuclear magnetic resonance (NMR) and magnetic resonance imaging (MRI) are technologies whose applications in organic chemistry, biology, medicine and material science have enabled fundamental scientific breakthroughs and continue to be drivers of scientific and technological progress [1]. Despite these successes, it is recognized that nuclear magnetic resonance applications has limitations due to the minute nuclear magnetization of analytes which leads to limited sensitivity in comparison to other analytic techniques such as mass spectrometry.
Strategies that are being pursued to overcome this challenge include an evolution towards larger applied magnetic fields which improves sensitivity due to the resulting increase of thermal equilibrium polarization and signal frequency [2]. The approximately linear growth in the magnetic field that has been achieved over the last decades comes at the cost of growing size, purchase and operating costs of these devices, which limit portability and challenge their integration with desired applications. More compact magnets lead to smaller usable detection volumes and thus limit sensitivity. A promising alternative strategy is the reduction in size of the radio frequency coils used to excite and detect the NMR signals [3] as this results in a sensitivity enhancement with decreasing coil-diameter and promises the development of portable on-chip NMR spectrometers [5]. Limitations and challenges in this approach include the homogeneity of the system which limit resolution and the thermal noise in the readout coil, i.e. thermal Johnson noise, which, together with the low sample volume, limits sensitivity. A further avenue towards improved NMR sensitivity is to increase the nuclear spin polarization beyond its thermal equilibrium value by means of techniques such as dynamical nuclear polarization [6]. Despite promising results, the integration of these approaches with NMR involve significant challenges, as they typically require low temperatures and dissolution of the sample - significantly reducing its concentration.
Addressing these challenges in a single device to simultaneously achieve improved sensitivity, ideally at the sub-millimolar level, portability and the ability to vary sample volumes from the nano- to the millimeter scale would decisively enhance a broad range of applications thus offering the potential for new ground breaking insights. These include NMR studies of single cells and neurons [8], the study of catalysis at smallest volumes, NMR studies of surfaces and on-chip NMR based metabolic fingerprinting with applications in personalized medicine [9, 4].
Here we present a novel physical platform for NMR detection that we show is capable of overcoming these challenges for samples ranging from the nano- to the millimeter-scale. We introduce an NMR protocol that permits spectroscopy of such volumes with chemical resolution and micromolar sensitivity and demonstrate signal processing algorithms that allow for a significant reduction in signal acquisition time, thereby yielding sample analysis with dramatic speed-up. The feasibility of this approach is demonstrated by detecting magnetic signals applied to a single NV center in diamond. The signal dynamics are obtained from atomistic simulations of a diffusive nanoscale nuclear sample, with a signal intensity scaled to correspond to an NV depth of 6.2 nm.
Background and key design elements — High-resolution NMR spectroscopy makes use of several properties of bulk matter in resolving chemical shifts and J-couplings for molecular structure determination. The rapid molecular diffusion and rotation leads to the suppression of internuclear interaction down to the Hz-level while not limiting the signal coherence due to the large volume from which the signal is collected. Furthermore, for bulk samples, the thermal polarization (scaling with the sample volume V) greatly exceeds the statistical polarization fluctuations (scaling with ). This allows on the one hand for the controlled initialization of the signal and therefore phase coherent signal accumulation resulting in a rapid growth of the signal to noise ratio (SNR) and on the other hand long signal coherence times and therefore high spectral resolution.
However, for of water in a 1 Tesla field, the statistical polarization of the hydrogen nuclei is comparable to the thermal polarization and becomes dominant at the nanoscale. This observation has motivated successful experimental efforts towards NMR detection of statistical polarization of nanoscale samples [10]. However, the stochastic nature and random phase of the observed statistical polarization prevent phase coherent signal averaging and the impact of diffusion limits signal coherence time and thus spectral resolution [18]. Overcoming these limitations calls for new modes of observation.
Here we will consider, perhaps counter-intuitively, the detection of the signal originating from the thermal polarization, even for nanoscale samples for which the statistical component is expected to dominate. We use three key features to compensate for this apparent shortcoming, namely, (i) the signal phase can be controlled by an initializing -pulse to allow for phase coherent accumulation across subsequent measurements, (ii) because the thermal polarization component is uniform across the entire sample beyond the immediate detection region, the signal coherence time becomes essentially independent of diffusion allowing for high spectral resolution, (iii) and for the same reasons the signal is uniform across the sample which allows for the use of multiple NV-centers for simultaneous signal acquisition thus further improving SNR.
The platform and protocols described in the following leverage the unique characteristics of color centers in diamond [11] to make use of these three key features. First, we use optically detected magnetic resonance in either individual or ensembles of color centers [12, 13] to detect small magnetic fields emanating from the sample which, by making use of a recently developed lock-in technique, Qdyne, which allows for spectral resolution in the Hz range [14, 15, 16]. This substitutes the electrical detection via rf-microcoils which is accompanied by thermal Johnson noise by optical detection which is only limited by the non-thermal photon shot noise. Secondly, the ability to bring color centers to within nanoscale distance of the sample allows for their use as a source of nuclear hyerpolarization even under ambient conditions using laser induced polarization of the electron spin native to the color center and the subsequent microwave assisted transfer to the sample nuclei [17, 19, 20]. This obviates the need for a strong magnetic field and holds the potential for an orders of magnitude increase in signal strength, thus bringing sub-millimolar sensitivities into reach while at the same time reducing nuclear spin polarization fluctuations induced by diffusion. Thirdly, in order to reduce averaging times required for achieving sub-millimolar sensitivities, we employ signal processing methods based on Bayesian inference algorithms that allow for orders of magnitude reduction of measurements required for the identification of signal components due to chemical shifts. The remainder of this work will describe these key elements and present theoretical and experimental results that demonstrate the feasibility of the approach.
Qdyne for nuclear magnetic resonance — The recently developed Qdyne method introduces a quantum lock-in spectroscopy technique [14, 15, 16] whose spectral resolution is independent of the sensor coherence time. Using Qdyne, a coherent external oscillating radiofrequency (RF) field, could be measured with a spectral linewidth of 607 Hz [14], thereby making the technique promising for realizing true nanoscale NMR via shallow NV centers.
In Qdyne, the sensor qubit is tailored to collect a signal that depends not only on the amplitude and frequency of the detected field, but also on the phase with respect to the start of each measurement. Performing measurements each of length , a different phase is accumulated in each measurement due to the difference between and period of the oscillatory field. As shown in Ref. [14], for an XY8 measurement sequence when the excitation and detection pulses are perpendicular to each other, the detected signal is given by
| (1) |
where is the interaction strength, the interaction time, is an arbitrary initial phase of the RF field, and denotes the frequency of the accumulated phase.
As with most NV sensing schemes, when using a shallow NV for detection, due to the small number of spins in the vicinity of the NV, the signal detected by Qdyne is dominated by the statistical polarization of the nuclear spins in the sensing volume - , with denoting the coupling of the NV center to the -th nuclear spin.
Diffusion of molecules into and out of this volume leads to random fluctuations of the detected signal, which is governed by a correlation function , where is the correlation time. Thus, the phase in Eq.(1) becomes a stochastic variable, , which denotes the instantaneous phase of the statistical nuclear spin polarization within the NV detection region [21].
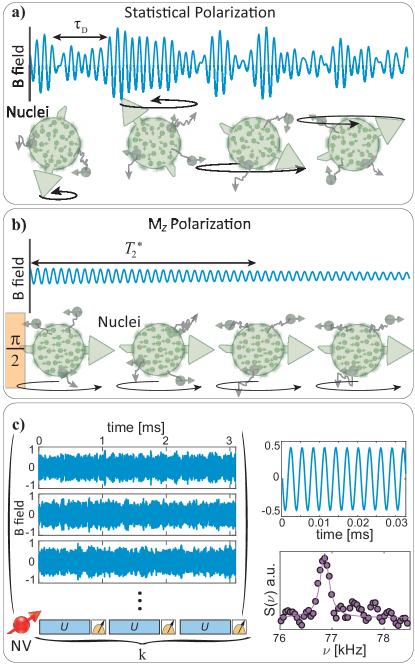
This stochastic variable ties the observed Qdyne signal to the molecular diffusion of the moving molecules, leading to a stringent limitation on the minimal observable line-width, thereby obscuring small but important details such as chemical shift and quadrupole information. See figure 1(a) for an illustration of a statistical magnetization detected by a Qdyne measurement, and the diffusion effect on the phase of the detected signal.
To solve this issue, and decouple the Qdyne signal from molecular diffusion, we modify the sequence to detect thermal nuclear magnetization along the z-axis of the applied magnetic field. This modified Qdyne sequence consists of measurements, and, at the beginning of the sequence, a pulse which rotates the nuclear z magnetization to the x-y plane, where it can be detected by the XY dynamical decoupling measurement with the correct filter function, similar to a free induction decay (FID) in traditional NMR. Importantly, at the beginning of each of the sequences, the initial phase of the z magnetization on the x-y plane is known and identical. Moreover, as the phase is identical for all nuclear spins across the sample, the diffusion of molecules in or out of the NV center detection region has no effect on the signal phase, and the detected linewidth becomes limited only by the nuclear coherence times, see Fig. 1(b).
In a realistic NMR scenario using a 5 – 100 nm deep NV center, both the statistical and sample magnetizations contribute to the detected signal, with the statistical polarization generally dominating the z-magnetization. However, the summation of repeated measurements can be used to reduce the statistical signal by a factor of due to its random phase and magnitude, while locking-in to the phase of -magnetization so as to prevent its cancellation. Thus, especially when combined with hyperpolarization, the detection of magnetization is feasible even with relatively shallow NV centers, and therefore even sub-micron detection volumes. Figure 1(c) shows the magnetization produced by an atomistic simulation of diffusing hyperpolarized () nuclear spins [22] near a nm deep NV center. Clearly the statistical polarization is larger than the hyperpolarized signal in this regime as the FID is not visible. However, when averaging the signal over runs, the smaller polarization can be clearly seen due to the reduction of the contribution from the statistical polarization. The magnetic field produced by an ensemble of nuclear spins as calculated by atomistic simulations was applied to a single NV center by a current carrying wire (see Ref. [14] for experimental details) for . The amplitude of the signal is calibrated by fitting the accumulated phase due to the statistical polarization to that measured by a nm deep NV center [23]. A measured signal due to the polarization is clearly visible with Hz linewidth, limited only by the 5.6 ms length of the detected signal. For comparison, with the chosen diffusion parameter the linewidth due to the statistical polarization would exceed kHz.
An additional advantage of Qdyne due to the averaging of measurements is better statistical information on each measured point. This improves the low photon collection efficiency inherent in NV-based detection, with the statistical detection process becoming a Poissonian distribution rather than a Bernoulli process. Moreover, as the -polarization is uniform across the entire sample, different NV centers now detect the same phase , which allows the measurement to be performed with ensembles of NV centers. The accumulated fluorescence from the different NV centers acts identically to repeated measurements of the single NV center, i.e. improving statistical information and averaging out the statistical polarization. Thus, the number of statistical averages is given by , where is the number of NV centers used as sensors.
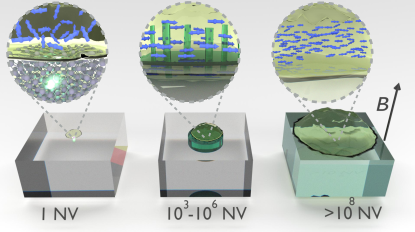
Qdyne unlocks the potential of NV-based NMR, allowing for volumes ranging from nanometric to macroscopic scales. However, as the nuclear thermal polarization is very weak, especially at lower magnetic fields, achieving a good signal to noise (SNR) in this regime requires macroscopic diamonds with densely packed NV centers and roughly 1 samples (1 mm3) for practical NMR applications (r.h.s. of fig 2). Pushing the limits of this regime to even large micro-scale would require averaging of several hours of measurement time for acquiring a sufficient SNR, due to the small signal produced by thermal polarization. Thus, in this regime the NV ensemble in the diamond serves as a “classical” macroscopic NMR sensor, similar to currently used micro-coils, albeit with the advantage of different noise processes which could lead to improved sensitivity. To push the application into the micro- and nano-scale regimes, the polarization needs to be enhanced, in a manner which still allows fast repetitive measurements. Fortuitously, optically polarized NV centers have been demonstrated to be superb polarization sources for nuclear spin hyperpolarization either inside the diamond [26, 25, 24, 27] or in external molecules [17, 19, 20]. Thus by using the NV centers in a dual role of hyperpolarization sources and NMR detectors, with shallow NVs used for polarization and deeper ones for detection, the NMR SNR of each measurement can be increased over 10,000-fold, without the need for shuttling between polarization and detection zones and without suffering other detrimental side-effects of dissolution DNP (e.g. cooling the sample to , reduction of analyte concentration upon dissolution). Thus, using interleaved hyperpolarization / detection sequences on the NV centers (the Hyperdyne protocol) one can achieve true NMR applicability on the (sub)microscale, see middle of fig. 2.
On the extreme nanometric scale (l.h.s. of fig 2), one may implement Hyperdyne NMR with a single NV center. However, the single NV center needs to be close to the surface for sufficient efficiency in the hyperpolarization cycle, which leads to the disadvantage that many of the polarized nuclei will diffuse outside the small NV detection region, and thus produce a much smaller net gain in the NMR sensitivity.
Signal Analysis of Hyperdyne: From FFT to Bayesian inference — In this section we provide expressions for the signal to noise ratio for large numbers of detection events, either due to high detection efficiency or large number of phase coherent averages, and then present Bayesian inference methods to improve signal detection for when these conditions are not met to allow for a significant order of magnitude reduction in measurement time. For shot noise limited detection,
| (2) |
with being the number of detected photons, the the length of a single XY measurement, the total detection volume, () the interaction strength (time) for an individual NV center, the number of independent measurements (which is the product of runs with NV centers), the nuclear spin concentration and the average polarization. There are two regimes to be considered when aiming to maximize SNR in a given total experiment time here. Firstly, when it is most advantageous to increase while keeping constant, i.e. increase the time over which the signal is accumulated coherently. In this case the total measurement time scales as the first case of eq. (3). If however, we cannot increase any further without suffering an exponential in loss in signal (for we lose the ability to identify the phase). Hence we are reduced to increase , that is averaging over independent runs. In this case the total measurement time scales as the second case of eq. (3) benefiting more from an increase in polarization of the sample.
| (3) |
where is the total measurement time for achieving a fixed SNR value, is the NV concentration, and enlarging is assumed to be achieved by increasing the surface cross section, thereby scaling linearly with the number of NV centers.
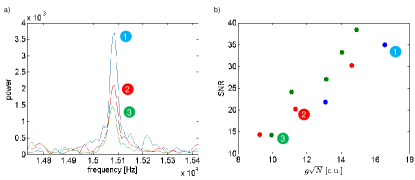
Figure 3(a) shows the Fourier transform of the acquired Qdyne signal by a 6.2 nm deep NV center for three scenarios with different polarization, molecular concentration and number of measurements . All scenarios were produced by atomistic simulation of the detection process for diffusing nuclei at the density of water. One can see a difference in the SNR between the three scenarios, due to a difference in and . As shown in figure 3(b), the scaling of the SNR is proportional to , as expected from Eq. 2 [34].
As noted above, the statistical polarization can be larger than the polarization as it is reduced by the averaging of the signal. The statistical polarization does limit the accumulation time in the XY sequences for shallow NV centers, as the condition needs to be fulfilled to ensure that the -signal is not fully randomized by the statistical polarization. As hyperpolarization enhances the to statistical polarization ratio, a larger signal can be accumulated by shallow NV centers, enabling the sensing of nano-scale volumes. It is important to note that the shot noise in the detection process scales as , as does the statistical polarization signal, which in turn implies that the fluctuations due to the statistical polarization signal are never larger than the shot noise, and are typically negligible.
It is interesting to note the comparison to microcoils. When scaling the diamond to the macroscopic regime (e.g. 1 l), the expected sensitivity will be similar to that achieved with state of the art micro-coils. However, due to the ohmic contribution to the noise becoming dominant at small diameters [39], microcoil sensitivity per unit volume starts scaling as instead of when m [3], where is the coil diameter, equivalent to . Therefore, even for large micrometric samples NV detection starts may become superior to microcoil detection, even without combining with hyperpolarization.
The measured Hyperdyne photon count signal is acquired by photo detectors with a detection scheme similar to that of [30] and suffers from several loss sources that make the acquired signal very noisy. On the one hand the detection is extremely lossy, leading to a very sparse time series of photon counts with less than a detection event per signal period. On the other hand each NV emits with a finite probability a photon in the state, leading to just a small net difference in detection probability between -state () and -state () [35]. In the framework of Fourier NMR spectroscopy, this setting leads to rapidly decaying SNR.
In this challenging, low SNR settings, approximating the parameters of an underlying, hidden model by Bayesian inference has shown great benefit in other experimental scenarios (e.g. in astro- or particle-physics [32, 31] and recently in NV center measurements [38]). Similar to FFT the Bayesian method operates on the raw signal vector without any preprocessing or reconstruction, but at the same time reducing the measurement time by at least one order of magnitude in typical settings. It relies on a probabilistic graphical model (PGM) capturing the hierarchical nature of the Rabi oscillation, photon emission and detection. This parametric model allows to incorporate prior knowledge of the problem into the analysis of the sparse signal. By using Bayesian inference NMR spectroscopy can be interpreted as fitting the distribution of parameters of an underlying harmonic model. The fit is guided by measured data and an informed choice of priors of the parameters . The priors which go into the population probability in eq. (1) are determined by a normally distributed , the uniform oscillation frequency and an uniform free phase parameter . Descending from the measurement is modeled by , where is the Poisson distribution for the photon counts. It’s rate parameter is determined by the parent emission process. The resulting distributions after the fit are called posteriors.
is a vector of stochastic random variables (RVs) as it depends on parents in the PGM. The parents could either be constants or random according to a specified probability distribution. The value of the vector is determined by the measured photon counts. It’s up to the inference mechanism to estimate the posterior model parameters such, that the posterior distribution approximates the measured values best. The adjustment of the posteriors is done by drawing many samples from a proposal distribution using Markov Chain Monte Carlo (MCMC) and either keeping the current with a certain probability if the likelihood of the measured data is increased, or rejecting the sample. The MCMC sampling takes the form of a Markov-Chain which means the position of step is dependent only upon the position of step , and is otherwise independent of all other steps. The walk around the joint proposal distribution happens in a semi-random manner. The step-size and direction are decided according to specific rules of the sampling method, including randomness (the Monte-Carlo aspect) and gradient-seeking and momentum (Hamilton Monte Carlo [29]) for efficiency. If the MCMC algorithm has converged sufficiently well, the samples drawn approximate the respective posterior distributions of the RVs. The whole procedure can be seen as a stochastic simulation of the experiment and adjustment of the parameters until measured and simulated data is statistically equivalent. To implement the inference algorithm we relied on recent software techniques [36].
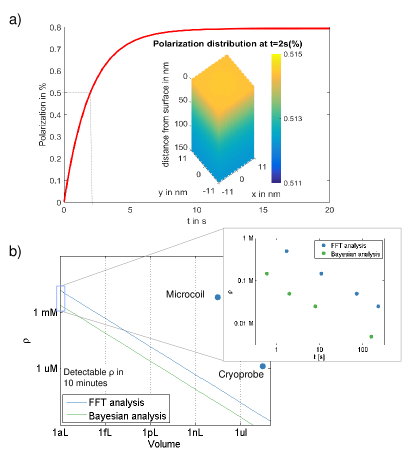
The benefit of a Bayesian analysis can be seen in Fig 4b where, in this specific setting, the inset demonstrates that the Bayesian analysis allows for an order of magnitude reduction in the minimal detectable concentration.
Achieving sub-millimolar detection limit in the (sub)micro scale — Hyperdyne achieves excellent SNR with a relatively small . Thus, the key question is whether a diamond-based setup can combine high nuclear polarization with Qdyne to achieve applicable NMR spectrometry on the nano-micro scale.
We propose the following setup for nano-micro scale NMR (fig. 2(b))- an analyte with M-mM concentration in a solution is placed on top of a nanostructured diamond for improved surface ratio, e.g. nanoslits [37]. The wide nanoslits are filled with NV centers with concentration of , including near the surface (5-20 nm deep). The Hyperdyne sequence is then composed of alternations of hyperpolarization and Qdyne sequence. The hyperpolarization, driven by the shallow NV centers (5-20 nm deep) significantly enhances the measured signal.
Since NV centers can be optically polarized to over 90% polarization with microsecond-long laser pulses [40], shallow NVs provide a unique resource for polarizing nuclear spins in nearby molecules. The polarization efficiency depends on , where is the correlation time, and is the total flip-flop coupling between the nuclear spins and the NV center, the number of nuclear spins in the detection region, and the average coupling to these nuclear spins. When , the typical scenario, the polarization efficiency does not depend on the analyte concentration [19].
As the distance between slits is 150 nm, and with the chosen NV concentration the average distance between NV centers is 22 nm, to calculate the achieved polarization, on needs to consider the polarization buildup in a region for each NV. Assuming , nuclear s, using robust polarization pulses [42] and experimentally verified polarization transfer rates [19], we obtain 0.5% polarization of the analytes in the nanoslit solution after 2 seconds of polarization, as shown in figure 4(a). the diffusion of the analyte is assumed to be around , either due to large analytes (e.g. proteins) or a viscous solution. The polarization simulation takes into account the polarization rate, the nuclear relaxation process and the molecular diffusion.
For thermal polarization the duty cycle for the measurements is limited by the time required to build up the thermal polarization, on the order of several times. Unsurprisingly, as the nuclear is the limiting time also for the polarization buildup, replacing nuclear thermalization by NV-based DNP does not change the duty cycle of the NMR experiments.
The achieved NMR sensitivity now depends on the volume of material probed, as scales linearly with the volume (the solution is assumed to reside mainly in the nanoslits, but the diamond surface cross section can be enlarged). Fig. 4(b) shows the detectable analyte concentration within 10 minutes of measurement time (taking into account the time for polarization and the experimental photon detection efficiency) when varying the probe size, for the achieved polarization of in each hyperpolarization cycle, with spectral and Bayesian analysis. As a comparison, best achieved sensitivity for microcoil and cryogenic probe NMR are noted [37]. For NMR spectroscopy we see that for a volume of less than 1 femtoliter (1 nanoliter), detection with a few Hz resolution of mM (M) concentrations is feasible with Hyperdyne within 10 minutes, corresponding to spins/ ( spins/), paving the way for applicable diamond-based NMR spectroscopy. Even with hyperpolarization, these regimes would not be possible with standard microcoils due to the scaling. Note that at very low concentrations, additional noise will be produced by the spatial location of the individual number of nuclear spins at the NV detection region.
Regarding the minimal linewidth detectable by the setup, due to the small width of the slits (300 nm), all nuclear spins are within relatively close proximity of to the NV center sensors. Integrating the total deviation to the nuclear Larmor frequency due to the Z-Z coupling with the NV centers leads to Hz. The presence of NV centers on both sides of the slit actually improves the homogeneity, as the deviation of the Larmor becomes more homogeneious spatially[41]. This deviation might cause some broadening in high-resolution NMR, but does not inhibit the acquisition of precise spectra to within 1 Hz resolution.
Discussion – The ability to use NV centers as a hybrid quantum-classical detector together with hyperpolarization and signal processing based on Bayesian inference opens up new possibilities for (sub)micro scale NMR. It is interesting to note the uniqueness of the system - the NMR detection is based on individual electron spins, accumulating phase independently, very differently from other methods of NMR detection (e.g. induction in tuned coils). The fact that these same electron spins (at least the shallow ones) can also be optically polarized and serve as a source for suprathermal dynamic nuclear polarization for the investigated nuclear spins is a fortuitous coincidence for the hybrid polarizer/micro-NMR system, and enables achieving remarkable sensitivities. The achieved polarization of the molecules will depend on the molecular relaxation time and diffusion, and can be optimized for specific molecules.
Regarding the analysis of the Qdyne signal, the introduced Bayesian analysis was shown to dramatically improve the detection sensitivity. It is worth exploring how well this analysis could also improve non- hyperpolarized Qdyne, as it could push the limits (concentration, time, volume) of the regimes where it is applicable.
Summary and Conclusions — In this work we have presented a blueprint for nanoscale NMR. Our approach builds on earlier work that demonstrates experimental feasibility of the required magnetic field detection scheme [14], on theoretical and experimental work that developed and demonstrated polarization transfer from color centers to liquids [17, 19, 20] and signal processing methods [33, 32].
Acknowledgements — The authors would like to thank Jochen Scheuer and Julen Simon Pedernales for discussions and support. This work was supported by the EU projects HYPERDIAMOND and DIADEMS, the ERC Synergy grant BioQ and a PhD fellowship of the Integrated Center for Quantum Science and Technology (IQST).
References
- [1] M. Findeisen, S. Berger, 50 and More Essential NMR Experiments: A Detailed Guide, Wiley-VCH,Weinheim, 2014.
- [2] V. Badilita, R. Ch. Meier, N. Spengler, U. Wallrabe, M. Utz, and J.G. Korvink, Microscale nuclear magnetic resonance: a tool for soft matter research. Soft Matt. 8, 10583 (2012).
- [3] A.G. Webb, Radiofrequency microcoils in magnetic resonance. Prog. Nuc. Magn. Res. Spectrosc. 31, 1 (1997).
- [4] H.W. Spiess, 50th Anniversary Perspective: The Importance of NMR Spectroscopy to Macromolecular Science. Macromolecules 50, 1761 (2017).
- [5] S.S. Zalesskiy, E. Danieli, B. Blümich, and V.P. Ananikov, Miniaturization of NMR Systems: Desktop Spectrometers, Microcoil Spectroscopy, and “NMR on a Chip” for Chemistry, Biochemistry, and Industry. Chem. Rev. 114, 5641 (2014).
- [6] J.H. Ardenkjaer-Larsen, B. Fridlund, A. Gram, G. Hansson, L. Hansson, M.H. Lerche, R. Servin, M. Thaning, and K. Golman, Increase in signal-to-noise ratio of ¿ 10,000 times in liquid-state NMR. Proc. Natl. Acad. Sci. USA. 100, 10158 (2003).
- [7] S.B. Duckett and R.E. Mewis, Application of Parahydrogen Induced Polarization Techniques in NMR Spectroscopy and Imaging. Acc. Chem. Res. 45, 1247 (2012).
- [8] M. Grisi, F. Vincent, B. Volpe, R. Guidetti, N. Harris, A. Beck and G. Boero, NMR spectroscopy of single sub-nL ova with inductive ultra-compact single-chip probes. Sci. Rep. 7, 44670 (2017).
- [9] J.L. Markley, R. Brüschweiler, A.S. Edison, H.R. Eghbalnia, R. Powers, D. Raftery and D.S. Wishart, The future of NMR-based metabolomics. Curr. Opin. Biotech. 43, 34 (2017).
- [10] T. Staudacher, F. Shi, S. Pezzagna, J. Meijer, J. Du, C.A. Meriles, F. Reinhard and J. Wrachtrup, Nuclear magnetic resonance spectroscopy on a (5-nanometer)3 sample volume, Science 339, 561 (2013).
- [11] Y. Wu, F. Jelezko, M.B. Plenio and T. Weil, Diamond Quantum Devices in Biology. Angewandte Chemie – International Edition Minireview 55, 6586 (2016).
- [12] A. Gruber, A. Dräbenstedt, C. Tietz, L. Fleury, J. Wrachtrup and C. von Borczyskowski, Scanning Confocal Optical Microscopy and Magentic Resonance on Single Defect Centers in Diamond. Science 276, 2012 (1997).
- [13] E. van Oort, P. Stromer and M. Glasbeek, Low-field optically detected magnetic resonance of a coupled triplet-doublet defect pair in diamond. Phys. Rev. B 42, 8605 (1990).
- [14] S. Schmitt, T. Gefen, F.M. Stürmer, T. Unden, G. Wolff, Ch. Müller, J. Scheuer, B. Naydenov, M. Markham, S. Pezzagna, J. Meijer, I. Schwarz, M. B. Plenio, A. Retzker, L.P. McGuinness, and F. Jelezko, Sub-millihertz magnetic spectroscopy performed with a nanoscale quantum sensor. Science 351, 832 (2017).
- [15] J.M. Boss, K.S. Cujia, J. Zopes, and C.L. Degen, Quantum Sensing with arbitrary frequency resolution. Science 351, 837 (2017).
- [16] D.B. Bucher, D.R. Glenn, J. Lee, M.D. Lukin, H. Park, and R.L. Walsworth, High Resolution Magnetic Resonance Spectroscopy Using Solid-State Spins. E-print arXiv:1705.08887.
- [17] Q. Chen, I. Schwarz, F. Jelezko, A. Retzker and M.B. Plenio, Resonance-inclined optical nuclear polarization of liquids in diamond structures. Phys. Rev. B 93, 060408(R)(2016).
- [18] X. Kong, A. Stark, J.F. Du, L.P. McGuinness and F. Jelezko, Towards Chemical Structure Resolution with Nanoscale Nuclear Magnetic Resonance Spectroscopy. Phys. Rev. Appl. 4, 024004 (2015)
- [19] P. Fernandez-Acebal, O. Rosolio, J. Scheuer, I. Schwarz, B. Tratzmiller, Q. Chen, C. Müller, B. Naydenov, A. Retzker, M.B. Plenio, and F. Jelezko. Polarisation of oil molecules via nitrogen-vacancy centers in diamond. In preparation.
- [20] D. Abrams, M.E. Trusheim, D.R. Englund, M.D. Shattuck, and C.A. Meriles, Dynamic nuclear spin polarization of liquids and gases in contact with nanostructured diamond. Nano Lett. 5, 2471 (2014).
- [21] Some fluctuations in are still expected due to spatial deviations of the molecule locations, however, this is expected to be negligible even for shallow NVs. would also fluctuate due to the density and spin fluctuations, but to a much lesser extent than .
- [22] The diffusion coefficient was chosen to be , similar to oil molecules.
- [23] Linh M. Pham, Stephen J. DeVience, Francesco Casola, Igor Lovchinsky, Alexander O. Sushkov, Eric Bersin, Junghyun Lee, Elana Urbach, Paola Cappellaro, Hongkun Park, Amir Yacoby, Mikhail Lukin, and Ronald L. Walsworth NMR technique for determining the depth of shallow nitrogen-vacancy centers in diamond. Physical Review B 93.4 (2016): 045425.
- [24] J. Scheuer, I. Schwarz, Q. Chen, D. Schulze-Sünninghausen, P. Carl, P. Höfer, A. Retzker, H. Sumiya, J. Isoya, B. Luy, M.B. Plenio, B. Naydenov, and F. Jelezko. Optically induced dynamic nuclear spin polarisation in diamond. New J. Phys. 18, 013040 (2016).
- [25] G.A. Álvarez, C.O. Bretschneider, R. Fischer, P. London, H. Kanda, S. Onoda, J. Isoya, D. Gershoni, and L. Frydman. Local and bulk 13C hyperpolarization in nitrogen-vacancy-centred diamonds at variable fields and orientations. Nature Comm. 6, (2015).
- [26] J.P. King, K. Jeong, C.C. Vassiliou, C.S. Shin, R.H. Page, C.E. Avalos, H.-J. Wang, and A. Pines. Room-temperature in situ nuclear spin hyperpolarization from optically pumped nitrogen vacancy centres in diamond. Nature Comm. 6, (2015).
- [27] J. Scheuer, I. Schwartz, S. Müller, Q. Chen, I. Dhand, M.B. Plenio, B. Naydenov, and F. Jelezko. Robust techniques for polarization and detection of nuclear spin ensembles. E-print arXiv:1706.01315
- [28] J. Salvatier, T. V. Wiecki, Ch. Fonnesbeck. Probabilistic programming in Python using PyMC3. PeerJ Computer Science 2 (2016): e55.
- [29] M. Hoffman, A. Gelman. The No-U-turn sampler: adaptively setting path lengths in Hamiltonian Monte Carlo. Journal of Machine Learning Research 15.1 (2014): 1593-1623.
- [30] T. Gaebel, M. Domhan, I. Popa, C. Wittmann, P. Neumann, F. Jelezko, …, J. Meijer. Room-temperature coherent coupling of single spins in diamond. Nature Physics, 2(6), 408-413. (2006)
- [31] F. Feroz, M. Hobson, M. Bridges. MultiNest: an efficient and robust Bayesian inference tool for cosmology and particle physics. Monthly Notices of the Royal Astronomical Society 398.4 (2009): 1601-1614.
- [32] J. Hilbe, R. de Souza, E. Ishida. Bayesian Models for Astrophysical Data: Using R, JAGS, Python, and Stan. Cambridge University Press, 2017.
- [33] J. Flegal, G. Jones Implementing MCMC: estimating with confidence. Handbook of Markov chain Monte Carlo, Boca Raton, Florida: Chapman & Hall/CRC, 175-197. (2011).
- [34] Due to large deviations in the SNR caused by the Poissoninan photon detection, we do not expect an exact linear line, but only a trend.
- [35] The detection efficiency can be significantly increased to almost 100% by using single-shot readout.
- [36] Practically the performance of the sampling highly depends on it’s initial starting value [33]. Therefore an as good as possible a posteriori (MAP) estimate is used as a starting point. Recently tools for probabilistic programming (PP), automatic differentiation frameworks and advances in MCMC methods made automatic Bayesian inference on PGMs easy to formulate and perform. The tool used in this work is called PyMC3 [28]. The framework automatically derives a likelihood function for the model and repeats the sampling and evaluation for a a defined upper bound. This reduces implementation effort and make quick model changes possible.
- [37] P. Kehayias, et al. Solution nuclear magnetic resonance spectroscopy on a nanostructured diamond chip. arXiv preprint arXiv:1701.01401 (2017).
- [38] I. Hincks, C. Granade, and D.G. Cory, Statistical Inference with Quantum Measurements: Methodologies for Nitrogen Vacancy Centers in Diamond. E-print arXiv:1705.10897
- [39] Peck, Timothy L., Richard L. Magin, and Paul C. Lauterbur. Design and analysis of microcoils for NMR microscopy. Journal of Magnetic Resonance, Series B 108.2 (1995): 114-124.
- [40] N.B. Manson, J.P. Harrison,and M.J. Sellars. Nitrogen-vacancy center in diamond: Model of the electronic structure and associated dynamics. Physical Review B. 74, 104303 (2006).
- [41] See supplementary information.
- [42] I. Schwartz, J. Scheuer, B. Tratzmiller, S. Müller, Q. Chen, C. Müller, B. Naydenov, F. Jelezko and M.B. Plenio. Pulsed Polarisation for Robust DNP. In preparation