Influence of the Void Environment on Chemical Abundances in Dwarf Galaxies and Implications for Connecting Star Formation and Halo Mass
Abstract
We study how the void environment affects the chemical evolution of galaxies in the universe by comparing the oxygen and nitrogen abundances of dwarf galaxies in voids with dwarf galaxies in denser regions. Using spectroscopic observations from the Sloan Digital Sky Survey Data Release 7, we estimate the oxygen, nitrogen, and neon abundances of 889 void dwarf galaxies and 672 dwarf galaxies in denser regions. We use the Direct method for calculating the gas-phase chemical abundances in the dwarf galaxies because it is best suited for low-metallicity, low-mass (dwarf) galaxies. A substitute for the [O II] doublet is developed, permitting oxygen abundance estimates of SDSS dwarf galaxies at all redshifts with the Direct method. We find that void dwarf galaxies have about the same oxygen abundance and Ne/O ratio as dwarf galaxies in denser environments. However, we find that void dwarf galaxies have slightly higher neon (10%) abundances than dwarf galaxies in denser environments. The opposite trend is seen in both the nitrogen abundance and N/O ratio: void dwarf galaxies have slightly lower nitrogen abundances (5%) and lower N/O ratios (7%) than dwarf galaxies in denser regions. Therefore, we conclude that the void environment has a slight influence on dwarf galaxy chemical evolution. Our mass–N/O relationship shows that the secondary production of nitrogen commences at a lower stellar mass in void dwarf star-forming galaxies than in dwarf star-forming galaxies in denser environments. We also find that star-forming void dwarf galaxies have higher H I masses than the star-forming dwarf galaxies in denser regions. Our star-forming dwarf galaxy sample demonstrates a strong anti-correlation between the sSFR and N/O ratio, providing evidence that oxygen is produced in higher-mass stars than those which synthesize nitrogen. The lower N/O ratios and smaller stellar mass for secondary nitrogen production seen in void dwarf galaxies may indicate both delayed star formation as predicted by CDM cosmology and a dependence of cosmic downsizing on the large-scale environment. A shift toward slightly higher oxygen abundances and higher H I masses in void dwarf galaxies could be evidence of larger ratios of dark matter halo mass to stellar mass in voids compared with denser regions.
1 Introduction
Galactic redshift surveys have revealed that the large-scale distribution of galaxies is similar to a three-dimensional cosmic web (Bond et al., 1996), with thin filaments of galaxies connecting galaxy clusters separated by voids (large, underdense areas that fill more than 60% of space). The voids first identified in early surveys (e.g., Gregory & Thompson, 1978; Kirshner et al., 1981; de Lapparent et al., 1986) have proven to be a universal feature of large-scale structure. Analyses of the Sloan Digital Sky Survey (Abazajian et al., 2009; Ahn et al., 2012) have produced catalogs of voids (Pan et al., 2012; Sutter et al., 2014). Cosmic voids are an essential component for understanding the role of a galaxy’s environment on its formation and evolution (see van de Weygaert & Platen, 2011, for a review).
Extensive studies have been performed to understand the role of the environment in galaxy formation. A strong relationship was found between a galaxy’s morphology and the local density (Dressler, 1980; Postman & Geller, 1984), where the fraction of early-type galaxies increases with density. A galaxy’s luminosity was found to also contribute to this morphology–luminosity–density relation (Park et al., 2007). While much of this early work focused on trends of galaxy properties in the densest regions of space, evidence was found that the same trends persist into the voids, where galaxies are found to be bluer (Grogin & Geller, 1999; Rojas et al., 2004; Patiri et al., 2006; von Benda-Beckmann & Müller, 2008; Hoyle et al., 2012), to be of a later morphological type (Grogin & Geller, 2000; Rojas et al., 2004; Park et al., 2007), and to have higher specific star formation rates (sSFR; Rojas et al., 2005; von Benda-Beckmann & Müller, 2008; Moorman et al., 2015; Beygu et al., 2016). These trends are attributed to the availability of cool gas to feed star formation in the void regions. Hoyle et al. (2005) and Moorman et al. (2015) showed that there is a shift toward fainter objects in the void galaxy luminosity function. This shift is consistent with the predicted shift of the dark matter halo mass function (Goldberg et al., 2005). Investigations into the H I properties of void galaxies have also been performed (Kreckel et al., 2012; Moorman et al., 2014), where void galaxies tend to have lower H I masses than galaxies in denser environments. All these observations are consistent with predictions from the CDM cosmology that void galaxies have lower masses and are retarded in their star formation when compared to those in denser environments (e.g., Gottlöber et al., 2003; Goldberg et al., 2005; Cen, 2011).
Given that the sSFR and evolutionary history are different for galaxies in voids, it follows that their chemical evolution might also be influenced by the environment. The metallicity of a galaxy (a measure of the integrated star formation history) is an estimate of the percentage of the galaxy’s gas that has been processed in stars (Guseva et al., 2009). We would expect void galaxies to have lower metallicities than those in denser regions if they have only recently commenced forming stars or have recently accreted unprocessed gas. Observations by Cooper et al. (2008); Deng (2011); Filho et al. (2015); Pustilnik et al. (2006, 2011b, 2011a, 2013); Pustilnik (2014), and Pilyugin et al. (2017) support the hypothesis that void galaxies have lower metallicities than galaxies in denser regions. However, Kreckel et al. (2015) and Douglass & Vogeley (2017a) find no influence from the large-scale environment on the metallicity, and Douglass & Vogeley (2017b) find that void dwarf galaxies have higher metallicities than dwarf galaxies in denser regions. It is obvious that a study of a statistically significant large sample of galaxies is required to understand how the large-scale environment influences the chemical evolution of galaxies.
Environmental effects should be the most obvious on dwarf galaxies, since they possess small gravitational potential wells. As a result, they are more sensitive to astrophysical effects such as cosmological reionization, internal feedback from supernova and photoheating from star formation, external effects from tidal interactions and ram pressure stripping, small-scale details of dark matter halo assembly, and properties of dark matter. The main galaxy sample of SDSS DR7 covers a large enough volume to identify more than 1000 voids (Pan et al., 2012), along with a statistically significant sample of dwarf galaxies () in voids. SDSS also provides spectroscopy that permits metallicity estimates of this large sample of dwarf galaxies.
Numerous methods to estimate the metallicity of an object have been developed over the years, as a result of the availability of various spectral features. All methods except the direct method are calibrated on galaxies with various characteristics, making it unwise to apply them to galaxies outside the groups from which these calibrations were derived. The commonly used methods are not calibrated for low-mass galaxies, so we carefully chose to use the Direct method because we are focusing on only dwarf galaxies. A detailed explanation of this and other method classes can be found in Douglass & Vogeley (2017a). With this estimator, Douglass & Vogeley (2017a, b) have looked at the gas-phase chemical abundances of 135 star-forming dwarf galaxies. They found that the large-scale environment has very little influence on the oxygen and nitrogen abundances in star-forming dwarf galaxies. However, their sample does indicate that star-forming void galaxies have lower N/O ratios than star-forming dwarf galaxies in denser regions. This is attributed to delayed star formation in void galaxies, along with a possible environmental influence on cosmic downsizing. They also argue that the very slight shift toward higher oxygen abundances in star-forming void dwarf galaxies could be due to a larger ratio of dark matter halo mass to stellar mass in void dwarf galaxies.
We look to expand on the work by Douglass & Vogeley (2017a, b) by substantially increasing their sample size of dwarf galaxies. The main limiting factor in their sample was due to the required detection of the [O II] 3727 doublet, which is needed to estimate the amount of singly ionized oxygen present. We present a new approach to the O+ abundance estimation, which removes the need for this emission line. This calculation is used in conjunction with the Direct method to estimate the total gas-phase oxygen abundance in galaxies. We also examine the relationship between the chemical abundance and H I mass of star-forming dwarf galaxies. For reasons previously described, this work only examines the chemical evolution of star-forming dwarf galaxies. As a result of this sample, the known influences of the environment on the morphology and luminosity have already been taken into account, since we concentrate only on star-forming dwarf galaxies.
2 Estimation of gas-phase chemical abundances from optical spectroscopy
We study a galaxy’s oxygen and nitrogen abundances for several key reasons. These two elements are relatively abundant and emit strong lines in the optical, including for several ionization states in oxygen, making them relatively easy to observe (Kewley & Dopita, 2002). In addition, a ratio of oxygen’s lines provides a good estimate of the electron temperature, allowing for reliable measurements of a galaxy’s gas-phase chemical abundances. The following is an explanation of the theory and methods we employ to estimate the oxygen and nitrogen abundances in dwarf galaxies.
2.1 Direct method
We use the Direct method described in Izotov et al. (2006) to estimate the gas-phase abundances of oxygen, nitrogen, and neon in our sample of dwarf galaxies, because this method is often regarded as the most accurate estimate of element abundances. It can be difficult to use due to the nature of the [O III] 4363 auroral line (for a more detailed discussion, see Douglass & Vogeley, 2017a). Since the strength of [O III] 4363 is inversely proportional to the metallicity of a galaxy, it is best suited for low-redshift, low-metallicity galaxies. At metallicities , [O III] 4363 becomes too weak to detect in the SDSS spectra. With the mass-metallicity (MZ) relation by Tremonti et al. (2004), this metallicity limit corresponds to a maximum stellar mass of
The MZ relation by Andrews & Martini (2013) estimates that this maximum metallicity translates to a maximum stellar mass of
Even though it is dangerous to compare metallicity values calculated with different methods, both of these upper limits on the galaxy stellar masses correspond to the maximum mass of a dwarf galaxy (). Therefore, we can expect to estimate the chemical abundances of only dwarf galaxies in SDSS DR7 with the Direct method (of course, there are exceptions to this; see Izotov et al., 2015, for example). Higher resolution spectra are necessary to probe higher-mass, higher-metallicity galaxies.
After solving for the temperature of the gas, we can calculate the amount of each element present in each of the ionization stages. The total gas-phase oxygen abundance is equal to the sum of the abundances of each of the ionized populations:
| (1) |
We use an ionization correction factor (ICF) to account for the missing stages of neon and nitrogen, since we can observe these elements in only one of their main ionization stages. The total abundance for a particular element is
| (2) |
For nitrogen, we employ the ICFs used in Douglass & Vogeley (2017b). We use the ICFs in Izotov et al. (2006) for neon.
2.2 O+ abundance approximation
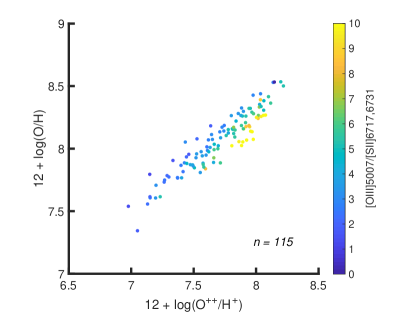
We derive an ICF for oxygen to overcome some limitations on the observations of dwarf galaxies in SDSS to bolster our sample size. Because we are studying dwarf galaxies, the [O II] doublet necessary for estimating the abundance of O+ is only available for objects within the redshift range (see Sec. 3.1 and Douglass & Vogeley, 2017a, for more details). To be able to study SDSS galaxies at redshifts less than 0.02, we need to find an alternate way to estimate the abundance of O+. While it is theoretically possible to estimate the O+ abundance from the [O II] emission line doublet, Izotov et al. (2006) show that the resulting abundances are not very accurate because [O II] is extremely weak. Another possibility is to use an ICF to approximate the missing ionization stage, as outlined in Sec. 2.1 for the nitrogen abundance. Because the [O II] emission line is commonly available for analysis, the oxygen abundance can be found with Eqn. 1. To construct an ICF for oxygen appropriate for our entire dwarf galaxy sample to include those with non-observed [O II] , we compare to as calculated by the Direct method for the star-forming dwarf galaxies in SDSS from Douglass & Vogeley (2017a).
The scatter seen in Fig. 1 is a result of the ionization parameter. A good proxy for the ionization parameter is found with the ratio of two different ionization stages of the same element; [O III] / [O II] is traditionally used (Kewley & Dopita, 2002). However, if the flux of [O II] is unknown, we must find an alternate proxy for the ionization ratio. Both oxygen and sulfur are alpha elements, so the relative amounts of them should remain fairly constant. Therefore, we find that replacing [O II] with [S II] produces a suitable proxy for the ionization parameter (L. Kewley, 2018, private communication).
We fit a polynomial model to the data that incorporates both and the ratio of [O III] to [S II] , defined as
| (3) |
where , , , , , , and for star-forming dwarf galaxies.
For those star-forming dwarf galaxies for which [O II] 3727 is not observed in the SDSS spectra, we use the coefficients for the star-forming dwarf galaxies with Eqn. 3 to calculate the total oxygen abundance in the galaxy based on the amount of doubly ionized oxygen found in Eqn. 4 of Douglass & Vogeley (2017a).
3 SDSS data and galaxy selection
The SDSS Data Release 7 (DR7; Abazajian et al., 2009) is a wide-field multiband imaging and spectroscopic survey employing a drift scanning technique to map approximately one quarter of the northern sky. Photometric data in the five-band SDSS system — , , , , and — are taken with a dedicated 2.5 m telescope at the Apache Point Observatory in New Mexico (Fukugita et al., 1996; Gunn et al., 1998). Follow-up spectroscopic analysis is performed on galaxies with a Petrosian -band magnitude (Lupton et al., 2001; Strauss et al., 2002). The spectra are taken using two double fiber-fed spectrometers and fiber plug plates with a minimum fiber separation of 55”; the observed wavelength range is 3800–9200Å with a resolution 1800 (Blanton et al., 2003). We use emission-line flux data from the MPA-JHU value-added catalog,111Available at http://www.mpa-garching.mpg.de/SDSS/DR7/ which is based on the SDSS DR7 sample of galaxies; as described at http://www.sdss.org/dr12/spectro/galaxy_mpajhu/ and in Tremonti et al. (2004), this catalog’s emission line analysis includes a subtraction of the best-fitting stellar population model of the continuum, thus accounting for the underlying stellar absorption features. All flux values have been corrected for dust reddening with the Cardelli et al. (1989) extinction curve as implemented in pyNeb (Luridiana et al., 2015); we assume the theoretical ratio H/H at 10,000 K and 100 cm-3 (Osterbrock, 1989). As shown in López-Sánchez et al. (2015), the magnitude of this ratio is mildly dependent on the electron temperature. This ratio varies by 7% over the range of temperatures seen in this sample, which translates to a difference in the metallicity of less than 0.003 dex, well within the uncertainty in the metallicity estimates due to the fluxes.
We use the stellar mass estimates from the NASA-Sloan Atlas (Blanton et al., 2011). The H I mass estimates are from the 70% complete ALFALFA catalog (Giovanelli et al., 2005); H I detections were matched to the SDSS galaxies by locating the nearest optical counterpart identified in the catalog within 1 arcmin. Absolute magnitudes, colors, and all other additional data are from the KIAS value-added galaxy catalog (Blanton et al., 2005; Choi et al., 2010). Galaxy colors are rest-frame colors that have been -corrected to a redshift of 0.1; they are corrected for galactic extinction and calculated with model magnitudes. All galaxies have been visually inspected to remove any galaxy fragments or duplicates.
3.1 Spectroscopic selection
We employ most of the same requirements for our sample as in Douglass & Vogeley (2017a, b). All galaxies must have
-
1.
(dwarf galaxies);
-
2.
a minimum detection of H;
-
3.
a minimum detection of [O III] ;
-
4.
a flux for [O II] , [O III] , and [N II] ;
-
5.
;
-
6.
a star-forming BPT classification by Brinchmann et al. (2004).
For those galaxies with a redshift , we use the oii_flux value from the MPA-JHU catalog in place of their [O II] flux measurement. See Douglass & Vogeley (2017a) for further details on each of these requirements.
We require the estimated electron temperature for a few reasons. Nicholls et al. (2014) explain that temperatures above this value estimated from the direct method as prescribed by Izotov et al. (2006) are not reliable because the data used to derive these equations do not extend beyond . Physically, one does not typically find H II regions with temperatures higher than because the equilibrium temperature between photoelectric heating and cooling due to recombination, free-free emission, and collisionally excited line radiation is often below this temperature. However, some extremely metal-deficient galaxies are found with temperatures higher than (Guseva et al., 2017, for example); by eliminating these metal-poor galaxies, we are introducing a sample bias. We examine the significance of this bias in Sec. 4.3.
3.2 Void classification
The large-scale environment of the galaxies is determined using the void catalog compiled by Pan et al. (2012), which was constructed using galaxies in the SDSS DR7 catalog. The VoidFinder algorithm of Hoyle & Vogeley (2002) (based on the algorithm described by El-Ad & Piran, 1997) removes all isolated galaxies (defined as having the third nearest neighbor more than 7 Mpc away), using only galaxies with absolute magnitudes . After applying a grid to the remaining galaxies, spheres are grown from all cells containing no galaxies until it encounters four galaxies on its surface. A sphere must have a minimum 10 Mpc radius to be classified as a void (or part of one). If two spheres overlap by more than 50%, they are considered part of the same void. See Hoyle & Vogeley (2002) for a more detailed description of the VoidFinder algorithm. Those galaxies that fall within these void spheres are classified as voids. Galaxies that lie outside the spheres are classified as wall galaxies. Because we cannot identify the center of any void within 5 Mpc of the edge of the survey, we classify those galaxies within this border region as “Uncertain.”
Of the 800,000 galaxies with spectra available in SDSS DR7, 9519 are dwarf galaxies. Applying the spectroscopic cuts, our sample includes 993 void dwarf galaxies and 759 wall dwarf galaxies.
4 Abundance analysis and results
Our primary objective is to perform a relative measurement of gas-phase abundances of dwarf galaxies to discern how their chemical evolution is affected by the large-scale environment.
All line ratios listed are ratios of the emission-line fluxes. Galaxies with low metallicities have (Pustilnik et al., 2006); galaxies with high metallicities have (Pilyugin et al., 2006). The solar metallicity (Asplund et al., 2009).
4.1 Dwarf galaxy abundances
| IndexaaKIAS-VAGC galaxy index number | R.A. | Decl. | Redshift | Void/Wall | ||||||||||
|---|---|---|---|---|---|---|---|---|---|---|---|---|---|---|
| 40726 | 112552.10 | -00°39’41”.76 | 0.0187 | 8.15 | 0.09 | 6.72 | 0.06 | 7.44 | 0.12 | -1.43 | 0.11 | -0.71 | 0.15 | Wall |
| 41257 | 124112.41 | -00°45’24”.55 | 0.0113 | 8.16 | 0.24 | 6.96 | 0.16 | 7.35 | 0.31 | -1.20 | 0.29 | -0.81 | 0.40 | Wall |
| 42296 | 143950.03 | -00°42’22”.85 | 0.0060 | 7.93 | 0.12 | 6.72 | 0.08 | 7.30 | 0.16 | -1.21 | 0.14 | -0.63 | 0.20 | Wall |
| 42829 | 154018.50 | -00°48’45”.04 | 0.0125 | 8.10 | 0.36 | 6.92 | 0.25 | 7.41 | 0.48 | -1.18 | 0.43 | -0.68 | 0.60 | Wall |
| 44522 | 114700.73 | -00°17’39”.22 | 0.0049 | 8.10 | 0.25 | 6.91 | 0.17 | 7.53 | 0.33 | -1.19 | 0.30 | -0.58 | 0.42 | Wall |
Note. — Five of the 1561 dwarf galaxies analyzed from SDSS DR7. The flux values for all required emission lines can be found in the MPA-JHU value-added catalog. Abundance values are calculated using the direct method and the O+ approximation defined in Sec. 2.2, with error estimates via a Monte-Carlo method. The void catalog of Pan et al. (2012) is used to classify the galaxies as either Void or Wall. If a galaxy is located too close to the boundary of the SDSS survey to identify whether or not it is inside a void, it is labeled as uncertain. Table 1 is published in its entirety online in a machine-readable format. A portion is shown here for guidance regarding its form and content.
The abundances estimated using the direct method for our dwarf galaxy sample are listed in Table 1. Also included are other significant characteristics and identification for the galaxies, including their large-scale environmental classification.
4.1.1 Oxygen, nitrogen, and neon abundances
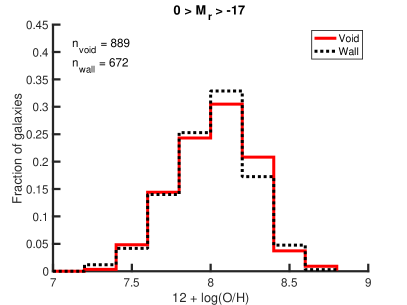
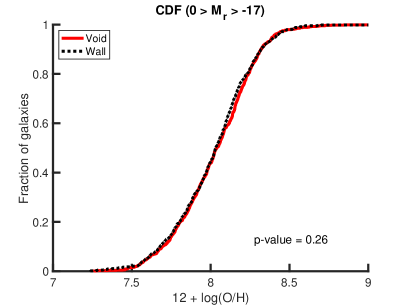
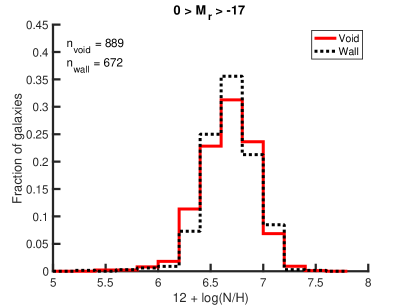
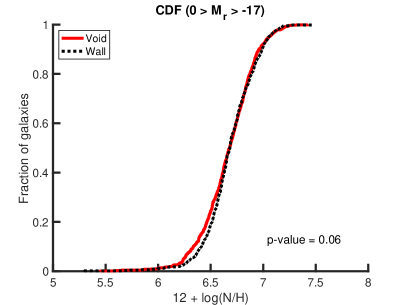
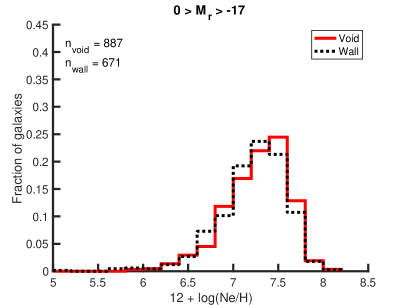
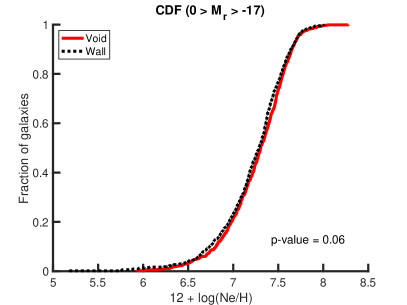
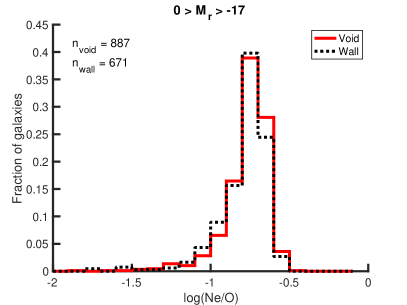
The distributions of oxygen, nitrogen, and neon abundances for dwarf galaxies as a function of large-scale environment are shown in Figures 2–4, respectively. All three histograms show a slight shift between voids and walls in the chemical abundances of dwarf galaxies. A two-sample Kolmogorov–Smirnov (K-S) test quantifies this observation: a test statistic of 0.05 for oxygen, 0.07 for nitrogen, and 0.07 for neon are produced, corresponding to a probability of 26%, 5.8%, and 5.5%, respectively, that a test statistic greater than or equal that observed will be measured if the void sample was drawn from the wall sample. The cumulative distribution function (CDF) for each of these elements can be seen on the right in Figures 2–4; they show that void dwarf galaxies have roughly the same oxygen abundances, slightly higher neon abundances, and slightly lower nitrogen abundances than dwarf galaxies in more dense regions. The K-S test quantifies the visual interpretation of these figures that the distribution of oxygen is not significantly different for star-forming dwarf galaxies in voids and walls, while the distributions of nitrogen and neon abundances do differ slightly.
The average and median values of the dwarf galaxy abundances also indicate either a slight shift or no shift as a result of the large-scale environment. The average oxygen abundance for void dwarf galaxies is and the median is 8.04, and the average oxygen abundance for wall dwarf galaxies is with a median value of 8.03. This implies that there is no significant difference in the oxygen abundances between void and wall dwarf galaxies (average shift of ; median shift of 0.01). The average nitrogen abundance for void dwarf galaxies is only with a median of 6.68, while the wall dwarf galaxies have an average nitrogen abundance of and a median of 6.68. The void dwarf galaxies have slightly lower nitrogen abundances by about 5% (an average shift of and a median shift of 0.00) relative to wall dwarf galaxies. In contrast, the average neon abundance for void dwarf galaxies is and the median is 7.30, while the average neon abundance for wall dwarf galaxies is with a median value of 7.28. The void dwarf galaxies have slightly higher neon abundances by about 10% (an average shift of ; a median shift of 0.02) relative to the wall dwarf galaxies. A tabular version of this analysis can be found in Table 2.
4.1.2 Ratio of nitrogen, neon to oxygen
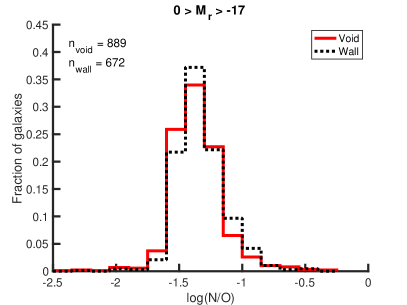
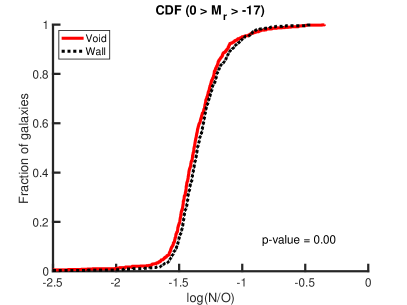
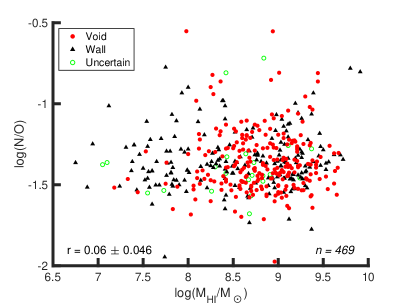
The ratio of nitrogen to oxygen is also important to investigate, as it communicates the nucleosynthesis history of the galaxies. As seen in Fig. 5, the N/O abundance ratio indicates a slight large-scale environmental influence on the chemical evolution of dwarf galaxies — void dwarf galaxies have slightly lower N/O ratios than dwarf galaxies in denser regions. This difference is quantified in the K-S test: the test returned a probability of only 0.4% that a test statistic greater than or equal to 0.09 will be measured if the void sample was drawn from the wall sample. The distribution of N/O abundance ratios for void dwarf galaxies is lower by about 7% (an average shift of and a median shift of 0.03) relative to the distribution of N/O ratios in wall dwarf galaxies.
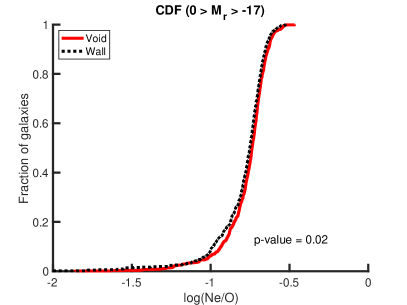
In contrast, the ratio of neon to oxygen serves as a diagnostic of the accuracy of the abundance estimates. Because neon and oxygen are both synthesized via processes in the same mass stars, they should always be produced in the same fixed ratio, assuming that the ratio of the IMF-averaged Ne and O yields does not depend on stellar metallicities. Even if the void environment influences the chemical evolution of dwarf galaxies, there should exist only a minor (if any) shift in the Ne/O ratio. As can be seen in Fig. 6, there is very little difference in the distributions of the Ne/O ratio between the two populations. The K-S test quantifies this difference: the test returns a probability of 2% that a test statistic greater than or equal to 0.077 will be measured if the void sample was drawn from the wall sample. Unlike the shifts measured in the distributions of nitrogen, neon, and N/O, the average shift of in the Ne/O abundance ratio is within the uncertainty of the shift. As physically expected, the void environment has almost no influence on the relative synthesis of neon and oxygen in star-forming dwarf galaxies.
| Environment | Average | Median | Average ShiftaaWall/Void (Positive shifts indicate that the wall values are greater than the void values; negative shifts indicate that the void values are greater than the wall values.) | Median ShiftaaWall/Void (Positive shifts indicate that the wall values are greater than the void values; negative shifts indicate that the void values are greater than the wall values.) | -value | K-S Test Statistic |
|---|---|---|---|---|---|---|
| Void | 8.04 | -0.01 | 0.259 | 0.0513 | ||
| Wall | 8.03 | |||||
| Void | 6.68 | 0.00 | 0.0575 | 0.0677 | ||
| Wall | 6.68 | |||||
| Void | 7.30 | -0.02 | 0.0554 | 0.0681 | ||
| Wall | 7.28 | |||||
| Void | -1.38 | 0.03 | 0.00364 | 0.0902 | ||
| Wall | -1.36 | |||||
| Void | -0.74 | -0.01 | 0.0199 | 0.0772 | ||
| Wall | -0.75 | |||||
Note. — Statistics on the gas-phase oxygen, nitrogen, neon, nitrogen relative to oxygen, and neon relative to oxygen abundances in dwarf void and wall galaxies. Combined with the histograms in Figures 2–6, these results indicate an influence on the chemical evolution of galaxies by the large-scale environment, especially on the relative abundance of nitrogen to oxygen. Void galaxies have slightly higher neon abundances and slightly lower nitrogen abundances and N/O ratios than wall galaxies. There is no significant shift in the oxygen abundance or the Ne/O ratio between void and wall dwarf galaxies.
4.2 Estimation of uncertainties
Uncertainties in the computed abundances are estimated using a Monte-Carlo method. Using the measured line fluxes and scaled uncertainty estimates, we calculate 100,000 abundance estimates. For each abundance estimate, a new positive “fake” line flux is drawn from a normal distribution. We use the standard deviation in these sets of 100,000 calculated abundance values for the error in our abundance estimate. See Douglass & Vogeley (2017a) for a more in-depth description of this process.
4.3 Sources of systematic error
Many physical properties of galaxies exhibit a radial dependence (Bell & de Jong, 2000). As a result, abundance estimates can depend on where the spectroscopic fiber is placed on the galaxy. The estimated abundance will not necessarily be representative of a global abundance value if not all of the galaxy’s light is contained within the fiber. Belfiore et al. (2017) show that both the metallicity and N/O ratio gradients are relatively flat for lower mass galaxies () and steepen with increasing stellar mass. In SDSS DR7, the spectroscopic fiber diameter is 3”; this corresponds to a minimum physical diameter of 1.31 kpc at a redshift . For most of the dwarf galaxies in this study, this contains the majority of their angular size. Assuming the abundance gradients remain flat for dwarf galaxies, as suggested by the results of Belfiore et al. (2017), then our estimates of the gas-phase chemical abundances for our sample of dwarf galaxies are independent of the location of the spectral fiber on the galaxies’ surfaces.
The selection criteria outlined in Section 3.1 limit our sample to only star-forming dwarf galaxies. As a result, this is not a representative sample of the entire dwarf galaxy population. We are only able to discuss the influence of the large-scale environment on star-forming dwarf galaxies in this study. Unfortunately, it is impossible to estimate the chemical abundances of red dwarf galaxies with the direct method because the UV photons from young stars are needed to excite the interstellar gas. In addition, our temperature requirement eliminates extremely metal-poor galaxies. To examine the influence of this bias on our results, we repeat the analysis with a maximum allowed temperature of and (the maximum allowed temperature in the work by Douglass & Vogeley, 2017a, b). The resulting shifts in each abundance ratio are listed in Table 3. There is no difference in the measured shifts seen with temperature cutoffs of and , but a significant number of low-metallicity galaxies are removed from the sample when we require temperatures no higher than . While we still see shifts in the various abundance distributions, their statistical significance is reduced.
| Max [O III] | |||
|---|---|---|---|
| 2×10^4 K | -0.01±0.013 (2%) | 0.03±0.016 (7%) | -0.02±0.023 (5%) |
| 2.5×10^4 K | -0.02±0.013 (5%) | 0.04±0.016 (10%) | -0.03±0.023 (7%) |
| 3×10^4 K | -0.02±0.013 (5%) | 0.04±0.016 (10%) | -0.03±0.023 (7%) |
Note. — Magnitude of the average shifts between the void and wall dwarf galaxies, with samples limited by the maximum temperature listed on the left. Positive shifts indicate that the wall values are greater than the void values; negative shifts indicate that the void values are greater than the wall values. These shifts change very little with the different maximum temperatures, so the bias toward higher metallicities introduced with the maximum allowed temperature of reduces the significance of our results.
4.4 Comparison to previously published oxygen abundance estimates
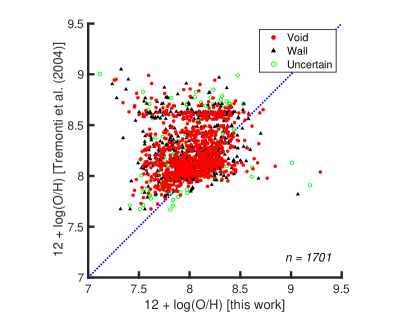
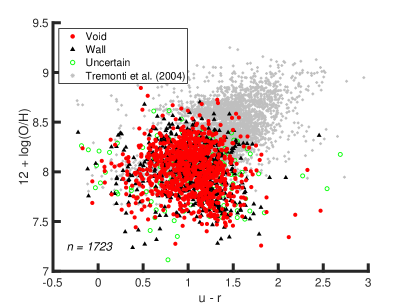
While no estimates of the nitrogen or N/O abundances have been made on a large selection of the SDSS galaxies, we can compare our oxygen abundance estimates to the metallicity values measured by Tremonti et al. (2004). While we both use data from the MPA-JHU value-added catalog, Tremonti et al. (2004) employs an empirical method to calculate the metallicity that is based on calibrated relationships between direct methods and strong-line ratios. The results of this comparison are shown in Fig. 7. While the majority of our abundance estimates agree reasonably well with the values calculated by Tremonti et al. (2004), it is also clear that our estimates often predict abundances lower than those previously published. This is especially true for the low-metallicity regime ( ). Methods that are based on calibrations rarely use low-metallicity galaxies in their source for calibrating. As a result, empirical methods will often overestimate the abundance values, especially in the low-metallicity regime. Kennicutt et al. (2003) show that strong-line methods (methods which make extreme use of the strong emission lines) can overestimate the metallicity abundances by as much as 0.3 dex. Therefore, we are not surprised at the apparent lack of correlation between our oxygen abundance estimates and those of Tremonti et al. (2004).
4.5 N/O versus O/H
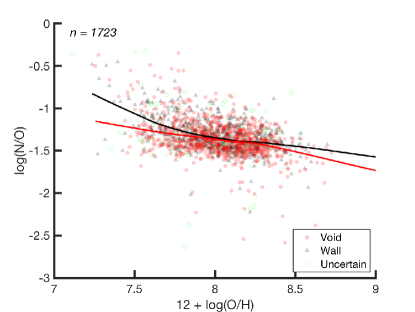
Studying how the N/O ratio depends on the metallicity (gas-phase oxygen abundance) probes the nucleosynthetic production of nitrogen in stars within the galaxies. It is believed that nitrogen can be produced as both a primary and secondary element, depending on the initial metallicity of the stars. If there are enough of the heavy elements available when the stars are created (oxygen, carbon, etc.), then the CNO cycle can commence much earlier in the star’s lifetime, resulting in a higher production of nitrogen than if the star is originally created with very few heavy elements. If this is the case, then we should see no relationship between the N/O ratio and the oxygen abundance below a certain metallicity value (the primary nitrogen production phase); above this threshold metallicity, the N/O value should increase linearly with the oxygen abundance (the secondary nitrogen production phase).
As we see in Fig. 8, there is no evidence of a secondary nitrogen production phase in our sample of dwarf galaxies. This is in contrast with the evidence of secondary nitrogen production seen in Fig. 11 of Sec. 4.7; the source of this discrepancy is unclear. The relationship between metallicity and the N/O ratio instead shows a large scatter, where the N/O ratio is roughly independent of the metallicity. This relationship between the N/O ratio and metallicity has been observed many times (e.g., Garnett, 1990; Vila Costas & Edmunds, 1993; Thuan et al., 1995; Izotov & Thuan, 1999; Henry et al., 2000; Pilyugin et al., 2002; Lee et al., 2004; Pilyugin et al., 2004; Nava et al., 2006; van Zee & Haynes, 2006; Pérez-Montero & Contini, 2009; Amorín et al., 2010; Berg et al., 2012; Sánchez Almeida et al., 2016), and it has been interpreted to represent the production of primary nitrogen. As listed in Table 2, we find that the void dwarf galaxies have a median N/O value of -1.38 and the wall dwarf galaxies have a median N/O value of -1.36. These values fall within the previously reported N/O ratio averages for the plateau.
Also shown in Fig. 8 are local linear regressions of the void (red) and wall (black) dwarf galaxy samples. The local linear regressions in this and the following figures are calculated at each point using a window containing 50% of the nearest data. These non-parametric approximations successfully represent the central trend of the data, but they exaggerate the sparse scatter in the tails. Here they exhibit a slight negative correlation between the N/O ratio and the oxygen abundance. This would indicate a constant value of nitrogen being synthesized in the galaxies, independent of the amount of oxygen being produced. A negative correlation similar to this was also observed by Andrews & Martini (2013) and Douglass & Vogeley (2017b). In a footnote, Andrews & Martini (2013) note that they measure a slope of -0.21 for their stellar mass-binned galaxies with metallicities , while Douglass & Vogeley (2017b) find a slope of for dwarf galaxies. Linear fits to the local linear regressions find slopes of and for the void and wall dwarf galaxies, respectively. We attribute these negative correlations to the significant scatter in the distributions and do not believe them to be physically relevant.
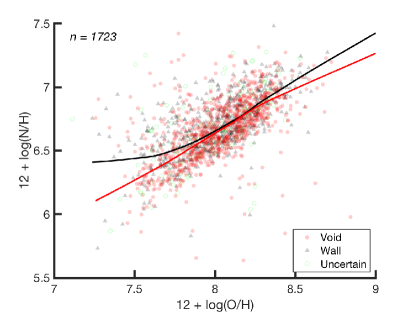
Similar evidence of the nitrogen production phases can also be observed when looking at the relationship between the nitrogen and oxygen abundances relative to hydrogen. Fig. 9 depicts a positive relationship between the nitrogen and oxygen abundances. Linear fits to the central segments of the local linear regressions of the void and wall dwarf galaxy samples exhibit slopes of and , respectively, larger than the slope of found by Douglass & Vogeley (2017b). These slopes indicate that nitrogen is produced at a slower rate than oxygen in dwarf galaxies. A nitrogen plateau in Fig. 8 would manifest itself as a relationship between the N/H and O/H ratios (shown in Fig. 9) with a linear slope of 1. Secondary nitrogen production, a positive relationship in Fig. 8, would correspond to a relationship between N/H and O/H in Fig. 9 with a slope greater than 1.
The slopes of the local linear regressions in both Figs. 8 and 9 show that there is no significant difference in the abundance ratio relationships between void dwarf galaxies and dwarf galaxies in denser regions. This supports the results found by Douglass & Vogeley (2017b) and Vincenzo & Kobayashi (2018). The large-scale environment does not appear to have an influence in the nucleosynthesis of nitrogen in dwarf galaxies.
4.6 Ne/O versus O/H
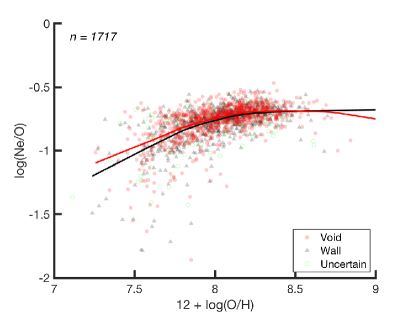
To serve as a diagnostic for the abundance estimates, we also look at the relationship between the metallicity and the Ne/O ratio. Because both neon and oxygen are synthesized in processes, their relative abundance should not depend on a galaxy’s metallicity. As Fig. 10 shows, there is no significant relationship between the oxygen abundance and the Ne/O ratio. This matches the results of Kobulnicky & Skillman (1996); Izotov & Thuan (1999); Lee et al. (2004); Izotov et al. (2006); van Zee & Haynes (2006) and Pérez-Montero et al. (2007). We note an increase in the scatter of this relationship with decreasing metallicity, which the local linear regressions shown in Fig. 10 emphasize. Since both the [O III] 4363 and the [Ne III] 3869 emission lines are relatively weak, the quality of their detection decreases with the metallicity and therefore increases the scatter in this relationship. The local linear regressions of the void and wall dwarf galaxies in Fig. 10 do not show a difference in the abundance ratio relationship between void dwarf galaxies and dwarf galaxies in denser regions. As expected from stellar nucleosynthesis, the void environment does not appear to influence the relative abundances of -process particles in dwarf galaxies.
4.7 Stellar mass–Abundance relations
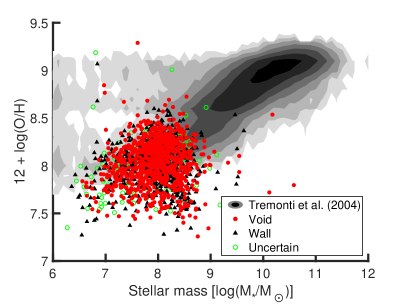
Expanding on the mass-metallicity relation investigated in Douglass & Vogeley (2017a), we look at the correlation between stellar mass and the oxygen abundance in our now substantially larger sample of dwarf galaxies. The mass-metallicity relation for our dwarf galaxies can be seen in the left panel of Fig. 11. We also include those galaxies from the MPA-JHU catalog with metallicity estimates from Tremonti et al. (2004) to place our sample in context. The majority of our dwarf galaxies follow the expected mass-metallicity trend. There is no discernible influence from the large-scale environment on the mass-metallicity relation for dwarf galaxies.
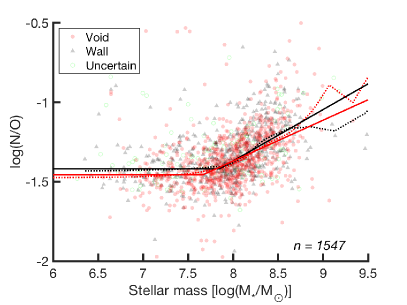
We also look at the N/O ratio as a function of stellar mass (Fig. 11, right panel). Similar to the O/H–N/O relation studied in Sec. 4.5, the N/O ratio is predicted to be constant below some critical mass; above this, the N/O ratio should increase linearly with the stellar mass. Unlike the relation seen in Fig. 8, we see both the N/O plateau and the positive correlation on the right in Fig. 11. To better investigate the influence of the void environment on the relationship between the stellar mass and the N/O ratio, we include local linear regressions of the two dwarf galaxy populations in Fig. 11. We observe a difference in this relation as a function of the large-scale environment: piecewise linear functions fit to the local linear regressions reveal that the critical mass for void galaxies is around , while the galaxies in denser regions exhibit a critical mass of 7.8. This difference suggests that void galaxies begin to synthesize secondary nitrogen at lower stellar masses than galaxies in more dense regions, consistent with the statistically insignificant shift seen in Fig. 2 where void dwarf galaxies may have slightly higher oxygen abundances than dwarf galaxies in more dense environments.
4.8 H I mass–Abundance relations
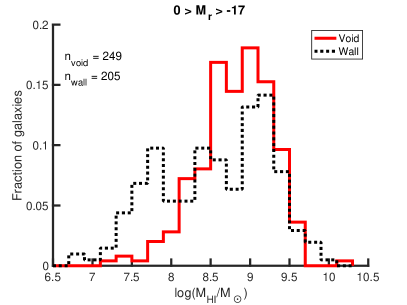
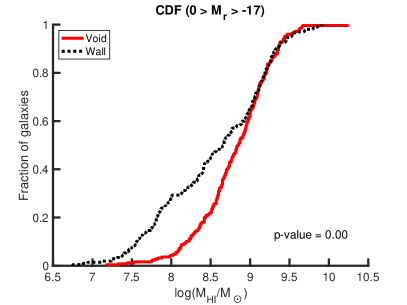
In addition to looking at the stellar mass, we also investigate the relationship between the amount of neutral hydrogen and the gas-phase chemical abundances in our sample of star-forming dwarf galaxies. As shown in Moorman et al. (2014), void galaxies typically have lower H I masses than galaxies in more dense regions, consistent with the overall shift of the luminosity or stellar mass function to lower luminosity or mass in voids. In the fixed range of luminosity of our dwarf galaxy sample, as Fig. 12 shows, our sample of void dwarf galaxies have higher H I masses than the dwarf galaxies in denser regions. The gas in the void environment is cooler than that found in denser regions (due to less events like shock heating, etc.), which permits void galaxies to have higher H I masses for a given stellar mass. Therefore, because we are fixing the stellar mass in our sample of galaxies (by only studying dwarf galaxies), we should find that the void dwarf galaxies have higher H I masses than for those dwarf galaxies in denser environments.
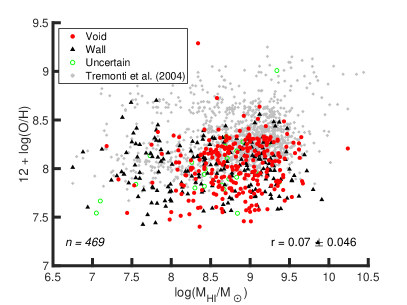
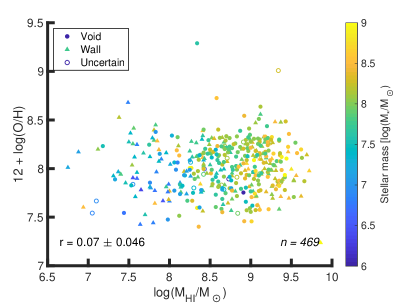
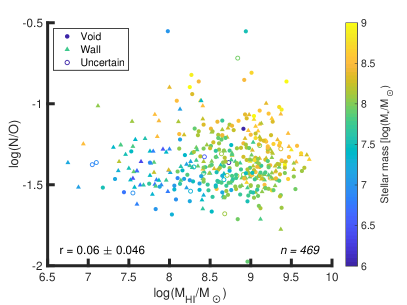
The H I mass–metallicity and H I mass–N/O relations can be seen in Fig. 13, extending the results of Bothwell et al. (2013) down to . Unlike the correlation between the stellar mass and the chemical abundances, there is very little correlation between the abundances and the H I mass. There is no significant relationship between the H I mass and the metallicity of a galaxy — the correlation coefficient for the dwarf galaxies shown in the upper left panel of Fig. 13 is only . This is not surprising, as our sample of star-forming dwarf galaxies probes the low-metallicity range of the MZ relation where there is no strong relationship between the metallicity and stellar mass. We also see no significant relationship between a dwarf galaxy’s H I mass and its N/O ratio; the correlation coefficient for the galaxies shown in the upper right panel of Fig. 13 is only .
Due to the time delay in the production of nitrogen relative to oxygen, we expect the N/O ratio to decrease with increasing H I mass, since more evolved galaxies have higher N/O ratios and will have used up most of their neutral hydrogen. Bothwell et al. (2013) demonstrates the existence of this relationship at a fixed stellar mass. The first row of Fig. 13 shows little, if any, relationship between the H I mass and the chemical abundances. However, the bottom row of Fig. 13 shows that there is an inverse relationship between the chemical abundance and the H I mass for fixed stellar mass (indicated by the colors of the points).
4.9 Color–Abundance relations
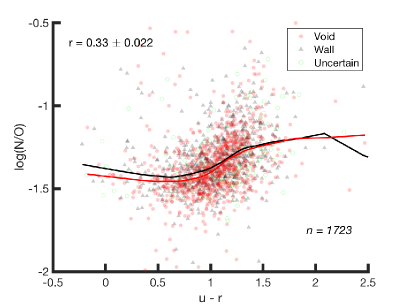
The gas-phase chemical abundance is expected to have a positive correlation with a galaxy’s color. Older galaxies have had more time to convert their gas into heavier elements through star formation, increasing their metallicities. The color–metallicity and color–N/O relations for our sample of star-forming dwarf galaxies can be seen in Figures 14 and 15. As we see, bluer galaxies have lower O/H and N/O ratios when we look at both the and colors.
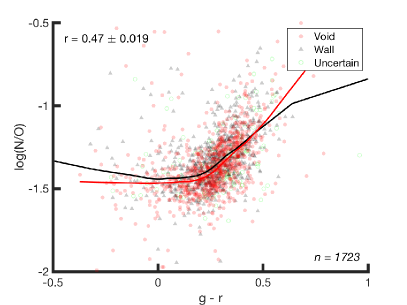
The presence of a relationship between the N/O ratio and the color of a galaxy can indicate a time delay between the release of nitrogen and oxygen (van Zee & Haynes, 2006; Berg et al., 2012). If higher-mass stars are the main source of oxygen, then the oxygen will be released on a shorter time scale than nitrogen for a given star formation episode (since higher-mass stars turn off the main sequence earlier than the intermediate-mass stars that synthesize nitrogen). Therefore, the amount of nitrogen relative to oxygen should increase as the hotter, more massive stars burn out and the galaxy becomes redder. This trend can be seen in the star-forming dwarf galaxies on the right of Figures 14 and 15, matching the trends seen in Douglass & Vogeley (2017b); van Zee & Haynes (2006); Berg et al. (2012).
There does not appear to be any influence from the large-scale environment on the relationship between the color and chemical abundances for star-forming dwarf galaxies. There is no obvious difference between the void and wall dwarf galaxies in the left-hand panels of Figures 14 and 15, when we concentrate on the oxygen abundance as a function of color. To help discern any influence from the environment on the N/O ratio as a function of color, we show the local linear regressions on the right-hand plots of Figures 14 and 15. The shift toward higher N/O ratios seen in the wall bins in both figures is the same shift identified in the histograms in Fig. 5. Any variation in the color–abundance relationship between the void and wall populations except a vertical shift would be evidence of the large-scale environment influencing the relationship. The scatter of the redder galaxies prohibits us from being able to make any assertions about differences in the slopes of these local linear regressions.
4.10 (s)SFR–Abundance relations
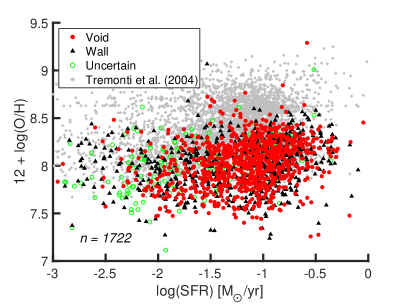
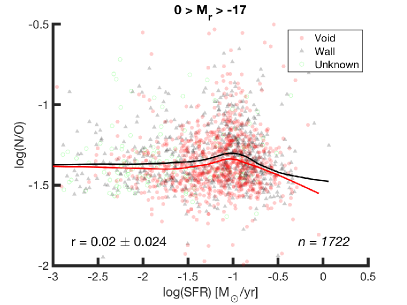
There is thought to be a fundamental relationship between the stellar mass, star formation rate (SFR), and metallicity of a galaxy (Lara-López et al., 2010; Mannucci et al., 2010; Andrews & Martini, 2013); the metallicity of a galaxy should increase with stellar mass and decrease as a function of the SFR. Henry et al. (2013) observe an inverse relationship between the metallicity and SFR of low-mass galaxies. However, as was seen in Douglass & Vogeley (2017a), Fig. 16 shows very little correlation between the SFR and metallicity or N/O ratio of the star-forming dwarf galaxies. When we separate the dwarf galaxies by their large-scale environment, we see no difference in the correlation coefficients between the two environments; there is no discernible influence on the relationship between the SFR and the chemical abundances by the large-scale environment.
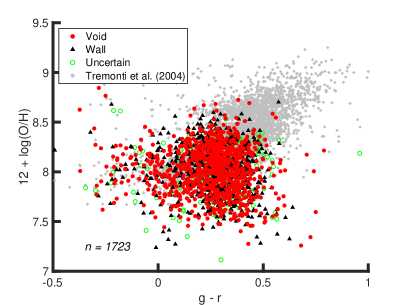
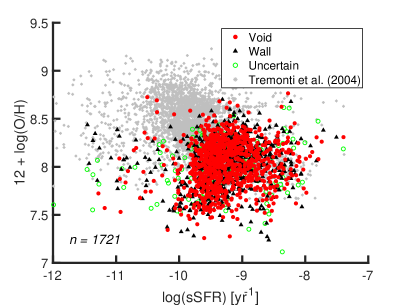
We also inspect the relationship between the sSFR and the gas-phase chemical abundances in star-forming dwarf galaxies. As shown in Fig. 17, there is a stronger correlation between the sSFR of a dwarf galaxy and its metallicity and N/O ratio. The left-hand panel of Fig. 17 shows the relationship between the gas-phase oxygen abundance and the sSFR for star-forming dwarf galaxies; to place our results in context, we also include (gray stars) those dwarf galaxies in SDSS DR7 for which Tremonti et al. (2004) was able to estimate metallicities. In the metallicity regime we are able to probe (), the star-forming dwarf galaxies display relatively little relationship between their sSFR and metallicity.
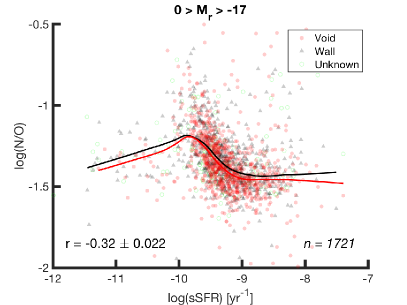
As we see on the right in Fig. 17, though, there is a strong anti-correlation between the sSFR and N/O ratio for the star-forming dwarf galaxies. Galaxies with higher sSFRs may be producing more massive stars than galaxies with lower sSFRs. If oxygen is produced in more massive stars than those which produce nitrogen, then the galaxies with higher sSFRs will produce more oxygen earlier than those galaxies with lower sSFRs. Increasing the gas-phase oxygen abundance relative to nitrogen will decrease the N/O ratio in these galaxies with higher sSFRs. Therefore, an anti-correlation between the sSFR and N/O ratio is further evidence that oxygen is produced in higher-mass stars than those which synthesize nitrogen. A large-scale environmental influence on the relationship between the sSFR and the N/O ratio would manifest as a difference in the slopes of the local linear regressions. With the influence of the scatter on these approximations, it is apparent that there is no significant influence from the large-scale environment on the relationship between N/O and sSFR.
5 Large-scale environmental influence
We see small, statistically significant shifts in the nitrogen and neon gas-phase abundances and the N/O ratio studied as a function of the large-scale environment, implying that the large-scale environment has a minor influence on the chemical abundances of star-forming dwarf galaxies. Previous work by Douglass & Vogeley (2017b) suggests that the oxygen abundance (O/H), nitrogen abundance (N/H), and N/O ratio depend on a galaxy’s environment. Work by Shields et al. (1991) finds no shift in the N/O ratio between cluster and field galaxies, though they do find that cluster galaxies have higher metallicities than field galaxies. Contini et al. (2002) and Pilyugin et al. (2002) find a statistically insignificant shift in the N/O ratio between cluster and field galaxies, where cluster galaxies have lower N/O ratios than field spiral galaxies. The shifts seen in each of these latter three sources are opposite to what we observe in this paper, though these previous studies concentrate on the galaxies in the Virgo cluster, which are more massive than our dwarf galaxy () sample. On average, we find that star-forming void dwarf galaxies have 10% higher neon abundances, 5% lower nitrogen abundances, and 7% lower N/O ratios than star-forming dwarf galaxies in denser regions.
As outlined in Douglass & Vogeley (2017a), there have been numerous previous studies that investigate the influence of the environment on the metallicity of a galaxy, resulting in mixed conclusions. When a difference in the metallicity was attributed to the environment (as in Pustilnik et al., 2006; Cooper et al., 2008; Pustilnik et al., 2011a; Pustilnik, 2014; Sánchez Almeida et al., 2016, for example), it was found that those galaxies with lower metallicities preferentially reside in less dense regions. This is the opposite of the insignificant shift seen in Fig. 2 in the star-forming dwarf galaxies, although our results are not a direct comparison with their conclusions. (Due to our requirement of the [O III] 4363 auroral line, we are not able to probe the high-metallicity regime.) We observe that there is a statistically insignificant shift toward higher average metallicities in void dwarf galaxies compared to dwarf galaxies in denser regions.
5.1 Higher metallicities in void dwarf galaxies
We posit that if the shift toward slightly higher metallicities in the star-forming void dwarf galaxies was significant, it would be due to a large-scale environmental effect on the ratio of a galaxy’s dark matter halo mass to stellar mass (). Goldberg & Vogeley (2004) show that gravitational clustering within a void proceeds as if in a very low-density universe, where the growth of gravitationally bound dark matter halos ends relatively early. Afterwards, there is relatively little interaction between the void galaxies because of the lower density and faster local Hubble expansion. Simulations by Jung et al. (2014) and Tonnesen & Cen (2015) show that, for a fixed dark matter halo mass, the stellar masses of central galaxies located in voids are smaller than those of central galaxies living in denser regions. The CDM cosmology predicts that galaxies formed in voids will be retarded in their star formation when compared to those in denser environments. Therefore, void dwarf galaxies could have higher ratios than dwarf galaxies in denser regions. Indeed, Tojeiro et al. (2017) find that the ratio of stellar mass to halo mass increases with the large-scale environmental density.
If this were the case, then the potential well and virial radius of the void galaxies would be large enough to retain more of the heavy elements that are blown from the ISM to the CGM of a galaxy (e.g., from a supernova). The simulation results of Tonnesen & Cen (2015) find that, for central galaxies with halo masses between and , void galaxies have 10% larger ratios of dark matter halo mass to stellar mass compared with wall galaxies at . In wall galaxies, more of these heavy elements can escape the dwarf galaxy, while in void galaxies they are confined to the CGM and eventually fall back onto the galaxy’s ISM. If star-forming void dwarf galaxies are able to retain more oxygen relative to their hydrogen abundance, then they will reach the critical value of O/H for secondary nitrogen production (via the CNO cycle) earlier than the star-forming wall dwarf galaxies, for a given stellar mass. We see evidence of this in Fig. 11, where the N/O plateau for the void dwarf galaxies exists for stellar masses . In contrast, the N/O plateau for the wall dwarf galaxies exists for stellar masses .
If void dwarf galaxies have higher ratios than dwarf galaxies in denser environments, we would expect to see an environmental influence on other characteristics of these galaxies. First, the ratio of neutral hydrogen mass to stellar mass of the dwarf galaxies would be higher in star-forming void galaxies than star-forming wall galaxies, under the assumption that neutral hydrogen traces dark matter. We see this effect both in Fig. 9 of Moorman et al. (2016) and in Fig. 12. Second, the H I mass function should shift less from wall to void galaxies than the shift seen in the luminosity function. Indeed, Moorman et al. (2016) finds a shift of characteristic H I mass by a factor of 1.4 in the H I mass function, while Hoyle et al. (2005) measures a shift by a factor of 2.5 in luminosity in the luminosity function between these two environments. The fact that we find an insignificant shift in the metallicity of dwarf galaxies between the void and denser environments indicates that the difference in the ratios between the two environments is not that significant (or it does not have much affect on the chemical composition of a galaxy’s ISM).
5.2 Lower N/O ratios in void dwarf galaxies
As we see in Fig. 5, star-forming void dwarf galaxies have a lower N/O ratio than wall dwarf galaxies. This strengthens the preliminary results found in Douglass & Vogeley (2017b) and the simulation results of Cen (2011), indicating that void galaxies are retarded in their star formation and that cosmic downsizing might depend on the large-scale environment. As suggested by van Zee & Haynes (2006), a galaxy with a declining SFR at late times (a wall galaxy) will have a higher N/O ratio than a galaxy with a constant SFR (a void galaxy); the ongoing star formation in the void galaxies will release more oxygen into the ISM, decreasing their N/O ratio relative to the galaxies with declining SFRs. This concept is supported by the color–N/O diagram in Figures 14 and 15, where the bluer galaxies have lower N/O ratios. The correlations between color and the N/O ratio found in van Zee & Haynes (2006), Berg et al. (2012), Douglass & Vogeley (2017b), and this work are a result of declining SFRs (van Zee & Haynes, 2006). The average lower N/O ratios that we see in star-forming void dwarf galaxies may be observational evidence that cosmic downsizing is environmentally dependent.
5.3 Extremely low-metallicity dwarf galaxies
Previous studies have either hypothesized (Pustilnik et al., 2006, 2011a, 2013) or concluded (Filho et al., 2015; Sánchez Almeida et al., 2016) that low-metallicity objects preferentially reside in low-density environments. Douglass & Vogeley (2017a) find that, out of 135 dwarf galaxies studied, there is no difference in the fraction of low-metallicity dwarf galaxies that reside in voids and denser regions. Of the 1722 dwarf galaxies we analyze, 82 have extremely low metallicity values ( ). Of these 82 low-metallicity dwarf galaxies, 46 are found in voids (approximately 5% of the star-forming void dwarf galaxy population studied) and 36 are located in denser regions (5% of the star-forming wall dwarf galaxy population studied). These population fractions do not support the existence of a special population of extremely metal-poor dwarf galaxies in voids.
We find that these 82 extremely metal-poor galaxies have comparably lower nitrogen abundances when compared to the total star-forming dwarf galaxy population studied. From Figures 14 and 15, it is apparent that these extremely metal-poor star-forming dwarf galaxies cover the entire color range of dwarf galaxies in this study. Fig. 16 also shows that the sSFRs and sSFRs conform with the observed relationship between the N/O ratio and the sSFR.
One possible interpretation of these extremely metal-poor dwarf galaxies is that they are green pea galaxies. A class of luminous compact galaxies, Cardamone et al. (2009) identified these objects to be star-bursting galaxies at higher redshifts. (Their color is a result of unusually large [O III] emission line fluxes redshifted into the -band of SDSS.) These galaxies are found to have low metallicities for their stellar mass; their N/O ratios are high for their estimated metallicities. They typically have sSFRs between and yr-1 (Izotov et al., 2011). While some of the extremely metal-poor galaxies we identify also have high N/O ratios for their metallicities, they have sSFRs between and yr-1, so only some of them might be green pea galaxies.
The few extremely metal-poor galaxies with high N/O ratios could be H II regions contaminated by shock waves. As described by Peimbert et al. (1991), shock waves will increase the intensities of auroral lines. Since we estimate the temperature of the H II regions with the ratio of [O III] 4363 to [O III] 4959,5007, this would result in an overestimation of the temperature and an underestimate of the oxygen abundance. The nitrogen abundance would also be underestimated, but to a lesser extent (as it is less sensitive to the electron temperature); this combination results in an overestimate of the N/O ratio. We would see evidence of shock waves dominating the spectra of these galaxies in the BPT diagram; because each of these galaxies resides in the star-forming region of the BPT diagram, shock waves are an unlikely explanation for those extremely metal-poor dwarf galaxies with high N/O ratios.
6 Conclusions
We estimate the gas-phase oxygen, nitrogen, and neon abundances and the N/O and Ne/O ratios of star-forming dwarf galaxies in SDSS DR7 using the direct method and spectroscopic line flux measurements as reprocessed in the MPA-JHU catalog. We expand upon the previous work of Douglass & Vogeley (2017a, b) by deriving a relation between the doubly ionized oxygen and total oxygen abundance in star-forming dwarf galaxies; removing the dependence on the [O III] 3727 doublet, this relation allows us to probe those dwarf galaxies at in SDSS DR7. The 1722 dwarf galaxies analyzed indicate that the large-scale environment only slightly influences their chemical evolution: star-forming void dwarf galaxies have 10% higher neon abundances, lower nitrogen abundances by an average of 5%, and 7% lower N/O ratios compared to star-forming dwarf galaxies in denser regions. The large-scale (10 Mpc) environment has a small impact on the chemical evolution of star-forming dwarf galaxies.
In addition, we also look at the relationship between the metallicity and the N/O and Ne/O ratios and other physical characteristics of our star-forming dwarf galaxy sample. There is very little relationship between the Ne/O ratio and the metallicity of the star-forming dwarf galaxies, matching expectations since both neon and oxygen are produced in processes. In the relationship between N/O and O/H, all our dwarf galaxies reside on the so-called “nitrogen plateau,” where the N/O ratio is predicted to be independent of the gas-phase oxygen abundance for metallicities . We also find a plateau in our relationship between the stellar mass and N/O ratio. Most of our star-forming dwarf galaxies follow the typical mass-metallicity relation. There is no relationship between the metallicity and H I mass of the galaxies, but the N/O ratio decreases with increasing H I mass for fixed stellar mass. The star-forming dwarf galaxies exhibit an increase in the metallicity (O/H) and N/O ratio with increasing color (both and ). We see very little correlation with SFR for either metallicity (O/H) or N/O ratio of dwarf galaxies, but the metallicity and N/O ratio decrease with increasing sSFR. Beyond the slight large-scale environmental influence on the chemical abundance distributions in the sample of star-forming dwarf galaxies, we do not observe any significant differences in the star-forming void and wall dwarf galaxies of any of these relationships.
We surmise that the difference in the distribution of the N/O ratio seen in the sample of star-forming dwarf galaxies is due to a slight large-scale environmental influence on their formation history and evolution. The slight shifts in the gas-phase oxygen and neon abundance distributions could be observational evidence for delayed star formation in void galaxies when compared to those in denser regions. This would result in a smaller ratio of stellar mass to dark matter halo mass in void galaxies than in wall dwarf galaxies, as predicted in simulations by Jung et al. (2014) and Tonnesen & Cen (2015). Simulations looking at how the retention fraction of supernovae ejecta depends on the halo mass or dark matter potential would be useful in understanding how significant the ratio of dark matter to stellar mass is on the gas-phase chemical abundances of a galaxy. If the void galaxies are retaining more oxygen as a result of their deeper potential wells, then they will be able to commence the synthesis of secondary nitrogen earlier, as is seen in the mass–N/O relation in Fig. 11. In addition, the shift toward lower N/O ratios in the star-forming void dwarf galaxies may be evidence that cosmological downsizing is environmentally dependent. Our results provide evidence for delayed, ongoing star formation in void dwarf galaxies whose dark matter halos ceased coalescing earlier than for dwarf galaxies in denser regions.
No special population of extremely metal-poor star-forming dwarf galaxies is found in the voids, as we note an equal fraction of low-metallicity dwarf galaxies in both the voids and denser regions.
References
- Abazajian et al. (2009) Abazajian, K. N., Adelman-McCarthy, J., Agueros, M. A., et al. 2009, ApJS, 182, 543
- Ahn et al. (2012) Ahn, C. P., Alexandroff, R., Allende Prieto, C., et al. 2012, ApJS, 203, 21
- Amorín et al. (2010) Amorín, R. O., Pérez-Montero, E., & Vílchez, J. M. 2010, ApJL, 715, L128
- Andrews & Martini (2013) Andrews, B. H., & Martini, P. 2013, ApJ, 765, 140
- Asplund et al. (2009) Asplund, M., Grevesse, N., Sauval, A. J., & Scott, P. 2009, ARA&A, 47, 481
- Belfiore et al. (2017) Belfiore, F., Maiolino, R., Tremonti, C., et al. 2017, MNRAS, 469, 151
- Bell & de Jong (2000) Bell, E. F., & de Jong, R. S. 2000, MNRAS, 312, 497
- Berg et al. (2012) Berg, D. A., Skillman, E. D., Marble, A. R., et al. 2012, ApJ, 754, 98
- Beygu et al. (2016) Beygu, B., Kreckel, K., van der Hulst, J. M., et al. 2016, MNRAS, 458, 394
- Blanton et al. (2011) Blanton, M. R., Kazin, E., Muna, D., Weaver, B. A., & Price-Whelan, A. 2011, AJ, 142, 31
- Blanton et al. (2003) Blanton, M. R., Lin, H., Lupton, R. H., et al. 2003, AJ, 125, 2276
- Blanton et al. (2005) Blanton, M. R., Schlegel, D. J., Strauss, M. A., et al. 2005, AJ, 129, 2562
- Bond et al. (1996) Bond, J. R., Kofman, L., & Pogosyan, D. 1996, Nature, 380, 603
- Bothwell et al. (2013) Bothwell, M. S., Maiolino, R., Kennicutt, R., et al. 2013, MNRAS, 433, 1425
- Brinchmann et al. (2004) Brinchmann, J., Charlot, S., White, S. D. M., et al. 2004, MNRAS, 351, 1151
- Cardamone et al. (2009) Cardamone, C., Schawinski, K., Sarzi, M., et al. 2009, MNRAS, 399, 1191
- Cardelli et al. (1989) Cardelli, J. A., Clayton, G. C., & Mathis, J. S. 1989, ApJ, 345, 245
- Cen (2011) Cen, R. 2011, ApJ, 741, 99
- Choi et al. (2010) Choi, Y.-Y., Han, D.-H., & Kim, S. S. 2010, JKAS, 43, 191
- Contini et al. (2002) Contini, T., Treyer, M. A., Sullivan, M., & Ellis, R. S. 2002, MNRAS, 330, 75
- Cooper et al. (2008) Cooper, M. C., Tremonti, C. A., Newman, J. A., & Zabludoff, A. I. 2008, MNRAS, 390, 245
- de Lapparent et al. (1986) de Lapparent, V., Geller, M. J., & Huchra, J. P. 1986, ApJL, 302, L1
- Deng (2011) Deng, X.-F. 2011, AJ, 141, 162
- Douglass & Vogeley (2017a) Douglass, K. A., & Vogeley, M. S. 2017a, ApJ, 834, 186
- Douglass & Vogeley (2017b) —. 2017b, ApJ, 837, 42
- Dressler (1980) Dressler, A. 1980, ApJ, 236, 351
- El-Ad & Piran (1997) El-Ad, H., & Piran, T. 1997, ApJ, 491, 421
- Filho et al. (2015) Filho, M. E., Sánchez Almeida, J., Muñoz-Tuñón, C., et al. 2015, ApJ, 802, 82
- Fukugita et al. (1996) Fukugita, M., Ichikawa, T., Gunn, J. E., et al. 1996, AJ, 111, 1748
- Garnett (1990) Garnett, D. R. 1990, ApJ, 363, 142
- Giovanelli et al. (2005) Giovanelli, R., Haynes, M. P., Kent, B. R., et al. 2005, AJ, 130, 2598
- Goldberg et al. (2005) Goldberg, D. M., Jones, T. D., Hoyle, F., et al. 2005, ApJ, 621, 643
- Goldberg & Vogeley (2004) Goldberg, D. M., & Vogeley, M. S. 2004, ApJ, 605, 1
- Gottlöber et al. (2003) Gottlöber, S., Łokas, E. L., Klypin, A., & Hoffman, Y. 2003, MNRAS, 344, 715
- Gregory & Thompson (1978) Gregory, S. A., & Thompson, L. A. 1978, ApJ, 222, 784
- Grogin & Geller (1999) Grogin, N. A., & Geller, M. J. 1999, AJ, 118, 2561
- Grogin & Geller (2000) —. 2000, AJ, 119, 32
- Gunn et al. (1998) Gunn, J. E., Carr, M., Rockosi, C., et al. 1998, AJ, 116, 3040
- Guseva et al. (2009) Guseva, N., Papaderos, P., Meyer, H., Izotov, Y., & Fricke, K. 2009, A&A, 505, 63
- Guseva et al. (2017) Guseva, N. G., Izotov, Y. I., Fricke, K. J., & Henkel, C. 2017, A&A, 599, A65
- Henry et al. (2013) Henry, A., Martin, C. L., Finlator, K., & Dressler, A. 2013, ApJ, 769, 148
- Henry et al. (2000) Henry, R. B. C., Edmunds, M. G., & Köppen, J. 2000, ApJ, 541, 660
- Hoyle et al. (2005) Hoyle, F., Rojas, R. R., Vogeley, M. S., & Brinkmann, J. 2005, ApJ, 620, 618
- Hoyle & Vogeley (2002) Hoyle, F., & Vogeley, M. S. 2002, ApJ, 566, 641
- Hoyle et al. (2012) Hoyle, F., Vogeley, M. S., & Pan, D. 2012, MNRAS, 426, 3041
- Izotov et al. (2015) Izotov, Y. I., Guseva, N. G., Fricke, K. J., & Henkel, C. 2015, MNRAS, 451, 2251
- Izotov et al. (2011) Izotov, Y. I., Guseva, N. G., & Thuan, T. X. 2011, ApJ, 728, 161
- Izotov et al. (2006) Izotov, Y. I., Stasińska, G., Meynet, G., Guseva, N. G., & Thuan, T. X. 2006, A& A, 448, 955
- Izotov & Thuan (1999) Izotov, Y. I., & Thuan, T. X. 1999, ApJ, 511, 639
- Jung et al. (2014) Jung, I., Lee, J., & Yi, S. K. 2014, ApJ, 794, 74
- Kennicutt et al. (2003) Kennicutt, Jr., R. C., Bresolin, F., & Garnett, D. R. 2003, ApJ, 591, 801
- Kewley & Dopita (2002) Kewley, L. J., & Dopita, M. A. 2002, ApJS, 142, 35
- Kirshner et al. (1981) Kirshner, R. P., Oemler, Jr., A., Schechter, P. L., & Shectman, S. A. 1981, ApJL, 248, L57
- Kobulnicky & Skillman (1996) Kobulnicky, H. A., & Skillman, E. D. 1996, ApJ, 471, 211
- Kreckel et al. (2015) Kreckel, K., Croxall, K., Groves, B., van de Weygaert, R., & Pogge, R. W. 2015, ApJL, 798, L15
- Kreckel et al. (2012) Kreckel, K., Platen, E., Aragon-Calvo, M., et al. 2012, AJ, 144, 16
- Lara-López et al. (2010) Lara-López, M. A., Bongiovanni, A., Cepa, J., et al. 2010, A&A, 519, A31
- Lee et al. (2004) Lee, J. C., Salzer, J. J., & Melbourne, J. 2004, ApJ, 616, 752
- López-Sánchez et al. (2015) López-Sánchez, Á. R., Westmeier, T., Esteban, C., & Koribalski, B. S. 2015, MNRAS, 450, 3381
- Lupton et al. (2001) Lupton, R., Gunn, J. E., Ivezić, Z., Knapp, G. R., & Kent, S. 2001, in Astronomical Society of the Pacific Conference Series, Vol. 238, Astronomical Data Analysis Software and Systems X, ed. F. R. Harnden, Jr., F. A. Primini, & H. E. Payne, 269
- Luridiana et al. (2015) Luridiana, V., Morisset, C., & Shaw, R. A. 2015, A&A, 573, A42
- Mannucci et al. (2010) Mannucci, F., Cresci, G., Maiolino, R., Marconi, A., & Gnerucci, A. 2010, MNRAS, 408, 2115
- Moorman et al. (2016) Moorman, C. M., Moreno, J., White, A., et al. 2016, ApJ, 831, 118
- Moorman et al. (2014) Moorman, C. M., Vogeley, M. S., Hoyle, F., et al. 2014, MNRAS, 444, 3559
- Moorman et al. (2015) —. 2015, ApJ, 810, 108
- Nava et al. (2006) Nava, A., Casebeer, D., Henry, R. B. C., & Jevremovic, D. 2006, ApJ, 645, 1076
- Nicholls et al. (2014) Nicholls, D. C., Dopita, M. A., Sutherland, R. S., Jerjen, H., & Kewley, L. J. 2014, ApJ, 790, 75
- Osterbrock (1989) Osterbrock, D. E. 1989, Astrophysics of gaseous nebulae and active galactic nuclei (University Science Books)
- Pan et al. (2012) Pan, D. C., Vogeley, M. S., Hoyle, F., Choi, Y.-Y., & Park, C. 2012, MNRAS, 421, 926
- Park et al. (2007) Park, C., Choi, Y.-Y., Vogeley, M. S., et al. 2007, ApJ, 658, 898
- Patiri et al. (2006) Patiri, S. G., Prada, F., Holtzman, J., Klypin, A., & Betancort-Rijo, J. 2006, MNRAS, 372, 1710
- Peimbert et al. (1991) Peimbert, M., Sarmiento, A., & Fierro, J. 1991, PASP, 103, 815
- Pérez-Montero & Contini (2009) Pérez-Montero, E., & Contini, T. 2009, MNRAS, 398, 949
- Pérez-Montero et al. (2007) Pérez-Montero, E., Hägele, G. F., Contini, T., & Díaz, Á. I. 2007, MNRAS, 381, 125
- Pilyugin et al. (2004) Pilyugin, L. S., Contini, T., & Vílchez, J. M. 2004, A&A, 423, 427
- Pilyugin et al. (2017) Pilyugin, L. S., Grebel, E. K., Zinchenko, I. A., Nefedyev, Y. A., & Mattsson, L. 2017, MNRAS, 465, 1358
- Pilyugin et al. (2002) Pilyugin, L. S., Mollá, M., Ferrini, F., & Vílchez, J. M. 2002, A&A, 383, 14
- Pilyugin et al. (2006) Pilyugin, L. S., Thuan, T. X., & Vílchez, J. M. 2006, MNRAS, 367, 1139
- Postman & Geller (1984) Postman, M., & Geller, M. J. 1984, ApJ, 281, 95
- Pustilnik (2014) Pustilnik, S. A. 2014, ArXiv e-prints, 1412.1316
- Pustilnik et al. (2006) Pustilnik, S. A., Engels, D., Kniazev, A. Y., et al. 2006, AstL, 32, 228
- Pustilnik et al. (2013) Pustilnik, S. A., Martin, J.-M., Lyamina, Y. A., & Kniazev, A. Y. 2013, MNRAS, 432, 2224
- Pustilnik et al. (2011a) Pustilnik, S. A., Martin, J.-M., Tepliakova, A. L., & Kniazev, A. Y. 2011a, MNRAS, 417, 1335
- Pustilnik et al. (2011b) Pustilnik, S. A., Tepliakova, A. L., & Kniazev, A. Y. 2011b, Astrophysical Bulletin, 66, 255
- Rojas et al. (2004) Rojas, R. R., Vogeley, M. S., Hoyle, F., & Brinkmann, J. 2004, ApJ, 617, 50
- Rojas et al. (2005) —. 2005, ApJ, 624, 571
- Sánchez Almeida et al. (2016) Sánchez Almeida, J., Pérez-Montero, E., Morales-Luis, A. B., et al. 2016, ApJ, 819, 110
- Shields et al. (1991) Shields, G. A., Skillman, E. D., & Kennicutt, Jr., R. C. 1991, ApJ, 371, 82
- Strauss et al. (2002) Strauss, M. A., Weinberg, D. H., Lupton, R. H., et al. 2002, AJ, 124, 1810
- Sutter et al. (2014) Sutter, P. M., Lavaux, G., Wandelt, B. D., et al. 2014, MNRAS, 442, 3127
- Thuan et al. (1995) Thuan, T. X., Izotov, Y. I., & Lipovetsky, V. A. 1995, ApJ, 445, 108
- Tojeiro et al. (2017) Tojeiro, R., Eardley, E., Peacock, J. A., et al. 2017, MNRAS, 470, 3720
- Tonnesen & Cen (2015) Tonnesen, S., & Cen, R. 2015, ApJ, 812, 104
- Tremonti et al. (2004) Tremonti, C. A., Heckman, T. M., Kauffmann, G., et al. 2004, ApJ, 613, 898
- van de Weygaert & Platen (2011) van de Weygaert, R., & Platen, E. 2011, International Journal of Modern Physics Conference Series, 1, 41
- van Zee & Haynes (2006) van Zee, L., & Haynes, M. P. 2006, ApJ, 636, 214
- Vila Costas & Edmunds (1993) Vila Costas, M. B., & Edmunds, M. G. 1993, MNRAS, 265, 199
- Vincenzo & Kobayashi (2018) Vincenzo, F., & Kobayashi, C. 2018, MNRAS, 478, 155
- von Benda-Beckmann & Müller (2008) von Benda-Beckmann, A. M., & Müller, V. 2008, MNRAS, 384, 1189