Cold Molecular Gas Along the Merger Sequence in Local Luminous Infrared Galaxies
Abstract
We present an initial result from the 12CO (=1–0) survey of 79 galaxies in 62 local luminous and ultra-luminous infrared galaxy (LIRG and ULIRG) systems obtained using the 45 m telescope at the Nobeyama Radio Observatory. This is the systematic 12CO (=1–0) survey of the Great Observatories All-sky LIRGs Survey (GOALS) sample. The molecular gas mass of the sample ranges within the central several kiloparsecs subtending beam. A method to estimate a size of a CO gas distribution is introduced, which is combined with the total CO flux in the literature. The method is applied to a part of our sample and we find that the median CO radius is 1–4 kpc. From the early stage to the late stage of mergers, we find that the CO size decreases while the median value of the molecular gas mass in the central several kpc region is constant. Our results statistically support a scenario where molecular gas inflows towards the central region from the outer disk, to replenish gas consumed by starburst, and that such a process is common in merging LIRGs.
Subject headings:
galaxies: ISM — galaxies: starburst — ISM: molecules — radio lines: galaxies1. INTRODUCTION
Luminous infrared galaxies (LIRGs, infrared luminosity , Sanders & Mirabel, 1996) are known to be very important for understanding the cosmic evolution of galaxies. The contribution from LIRGs to the cosmic star formation rate density rises from to 1, amounting to more than at (Elbaz et al., 2002; Le Floc’h et al., 2005; Caputi et al., 2007; Magnelli et al., 2009, 2013; Goto et al., 2010). Since LIRGs are powered by intense starbursts and can also harbor buried active galactic nuclei (AGN) (e.g., Armus et al. 2007; Petric et al. 2011; Stierwalt et al. 2013, hereafter ST13; Stierwalt et al. 2014), they are excellent local sources in which to study the build up of stellar mass and the growth of central black holes in rapidly evolving galaxies. The investigation of star formation in local LIRGs is an initial step towards understanding more distant LIRGs.
In local LIRGs, star formation is responsible for most of the infrared (IR) radiation (Petric et al., 2011). The contribution from AGN to the bolometric power output in LIRGs is low, but it is know to increase with IR luminosity (Kim et al. 1998; Petric et al. 2011; ST13). Local LIRGs are observed at a full range of galaxy-galaxy interaction and merger stages from pre-mergers to final stage mergers (Haan et al. 2011; Petric et al. 2011; ST13). Therefore galaxy interactions/mergers, which can induce violent star-forming activities, are important events for the local LIRGs because they induce starbursts (SBs) and fuel the central black holes which may become AGNs.
Mergers and interactions can efficiently drive radial gas flows towards the galactic center (Barnes & Hernquist, 1996; Mihos & Hernquist, 1996), and such fueling of gas into the central region is also important for igniting the SB or/and growth of the black-hole. Many ultra-luminous infrared galaxies (ULIRGs, ) are often observed as advanced-stage mergers (ULIRGs of early or mid-stage mergers are also found by Dinh-V-Trung et al. 2001). In the advanced-mergers, concentrated molecular gas disks in the central sub-kpc region are found by interferometric observations (Downes & Solomon, 1998; Bryant & Scoville, 1999; Imanishi & Nakanishi, 2013; Xu et al., 2014). This is consistent with the models where galaxy interactions and mergers drive radial flows of gas and accumulate gas in the central several kpc regions (Barnes & Hernquist, 1996; Mihos & Hernquist, 1996; Iono et al., 2004). In only two early stage mergers, the characteristic feature of inflowing molecular gas has been found (Iono et al., 2004, 2005). It is generally difficult to observe direct characteristics of gas-inflows in interacting/merging galaxies, because the timescale of inflow is as short as yr (Iono et al., 2004) and the velocity fields are quite complicated (Saito et al., 2015). Therefore, it is still uncertain whether radial gas inflow is a “common” phenomenon through the merger sequence of LIRGs, particularly even at intermediate stages of mergers.
Previous surveys exclusively employed small diameter telescopes with a large beam to derive the total flux of the whole galaxy. Gao & Solomon (1999, hereafter GS99) presented CO observations of merging U/LIRGs with large beam telescopes (mainly NRAO 12m) and found that total CO luminosities decrease with decreasing projected separations between nuclei of merging galaxies. This decrement is interpreted that the total molecular gas in merging U/LIRGs is depleted with advancing stages of mergers by their high star-forming activities. In the meantime, if there are the common gas-inflows, in the central regions, the molecular gas mass of merging U/LIRGs are replenished by gas-inflows contrary to the gas-depletion by star formation. Thus the molecular gas mass in the central regions should apparently increase or not change. Studies on both the gas depletion in a whole galaxy and the gas supply in a central region help us to understand the properties and evolution of merger-induced activities such as the distribution and contents of molecular gas at the late and post stages of mergers, and nuclear activities requiring the gas-fueling. Selective measurements of gas in the central several kpcs in interacting/merging galaxies can provide information on gas that has undergone such inflow. Such observations can be realized by large aperture single dish telescopes. Of course, ALMA is already providing information on the sub-kpc gas content in local U/LIRGs (e.g., Ueda et al., 2014; Xu et al., 2014, 2015; Scoville et al., 2014), but single-dish telescopes can still provide valuable information on the gas properties of large samples of local LIRGs, covering wide swaths of phase space and highlighting individual sources for ALMA follow-up (at least for those sources near or below the Celestial equator). The beam size of the Nobeyama Radio Observatory 45 m Telescope111Nobeyama Radio Observatory is a branch of the National Astronomical Observatory of Japan, National Institutes of Natural Sciences. (NRO45), at the frequency of CO(1–0), corresponds to a projected scale of kpc radius at 94 Mpc which is a median distance of our sample. The central region of galaxies is also the site of intense activities characterizing local LIRGs, such as nuclear SB and/or AGN. The mid-infrared (MIR) sizes of local LIRGs are indeed seen to be a few kpc in size, with this decreasing as the IR luminosity and dust temperature increase (Díaz-Santos et al., 2010, 2011). Selectively observing the central regions can help us understand the properties of the gas flow and the fueling of the powerful central starbursts and AGN.
Local LIRGs are recognized to be rich in molecular gas from previous CO observations (Sanders & Mirabel, 1996). Large surveys of IR bright galaxies in CO with single-dish telescopes, including local LIRGs and ULIRGs, have been conducted extensively to date (Sanders & Mirabel, 1985; Sanders et al., 1986; Young et al., 1986, 1989, 1995; Mirabel et al., 1990; Sanders et al., 1991; Mazzarella et al., 1993; Downes et al., 1993; Elfhag et al., 1996; Solomon et al., 1997; Curran et al., 2000; Yao et al., 2003; Gao & Solomon, 2004; Saintonge et al., 2011; García-Burillo et al., 2012). In addition to their employed small-diameter telescopes which provide the total flux over the whole galaxy, however, the sample selection criteria of these surveys are divided among observers, e.g., biases towards IR- or CO-luminous sources (Gao & Solomon, 2004). This has prevented us from obtaining a homogeneous CO dataset of local LIRGs that spans a range in luminosity, energy source, and merger stage, which is required to infer on the general characteristics of LIRGs concerning cold molecular gas and star formation, in an unbiased manner.
Interferometric observations of CO emission lines have also been conducted for individual LIRGs. Downes & Solomon (1998) presented CO imaging of ten merging ULIRGs and found the concentrated molecular gas in their central regions. Bryant & Scoville (1999) performed CO imaging of five merging and two interacting LIRGs. They also found massive and concentrated molecular gas in cores of mergers, but found an extended distribution of molecular gas comparable to its optical disk in one interacting LIRG. Gao et al. (1997a) observed ten LIRGs at various stages of mergers and found a trend that, in their sample, the early merger-stage LIRGs show relatively large sizes of molecular gas comparing to the advanced merging LIRGs. Although the samples and interferometers are diverse between observations, these interferometric observations provide important knowledges to us regarding behavior of molecular gas in merging LIRGs.
In order to establish a large CO data set of local LIRGs using the NRO45 telescope, we have conducted a CO survey of the northern sub-sample of the Great Observatories All-sky LIRG Survey (GOALS, Armus et al., 2009) sample. The GOALS sample is itself a flux-completed sub-set of the IRAS Revised Bright Galaxy Sample (RBGS, Sanders et al., 2003) with flux densities of more than 5.24 Jy and Galactic latitude of more than 5 degree, and consists of 180 LIRGs and 22 ULIRGs. In this paper of our CO survey, we present the results from CO observations of 79 individual galaxies in 62 GOALS LIRG systems. The CO was observed with a single beam towards the central regions corresponding to their brightest mid-infrared (MIR) position. Detailed results of mapping observations and studies of the relation between the cold molecular gas and the star formation rate (SFR) or the presence of AGN will be presented in a following paper (Paper II).
This paper is organized as follows. We describe the sample and the CO measurement in Section 2. In Section 3, we present the CO spectra, the CO luminosity, the molecular gas mass, and the velocity width. Our CO flux is compared with previous observations and an estimate of the extent of CO emitting regions is presented here. In Section 4, we examine the mass and the extent of molecular gas along merger processes, which give implications on merger-driven gas-inflow. The summary and conclusion are given in Section 5. Throughout this paper we adopt the cosmology parameters of , , and .
2. OBSERVATION
2.1. Target Sample
Of the 202 full GOALS LIRGs (Armus et al., 2009), 161 systems have declination of above degrees, making them observable from the NRO45 (the Northern GOALS LIRGs). Out of this sample, we have performed pointing-observations towards 79 galaxies in 62 systems (54 LIRGs and 8 ULIRGs), based solely on source availability at the assigned LST range and weather conditions. Here, we refer to a number of galaxies of mapping observations. For 31 LIRGs whose MIR distributions ( of IRAC/Spitzer) are more extended than the beam of the NRO45, mapping observations have been performed. Out of those, 11 galaxies are not overlap with the pointing-observation sample. Thus, a number of the total sample is 90 galaxies.
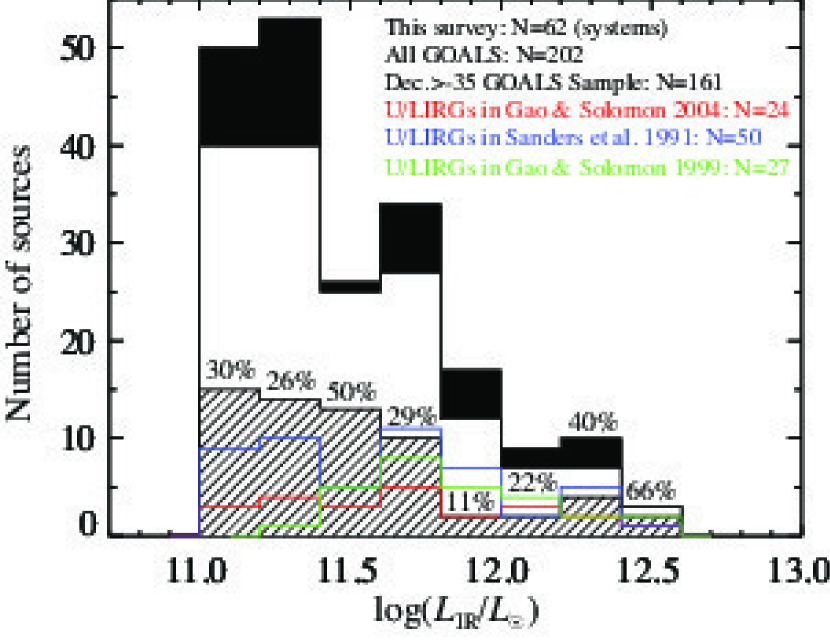
The IR luminosities of the 62 systems range from to . The number distribution of the systems of this sample with a bin of is shown in Figure 1. We compare this with three of the largest CO studies, Sanders et al. (1991, hereafter SSS91), Gao & Solomon (1999, hereafter GS99), and Gao & Solomon (2004, hereafter GS04). SSS91 conducted a CO survey for 50 local U/LIRGs with the NRAO 12 m and the FCRAO 14 m telescopes. GS99 presented CO luminosities of merging U/LIRGs with projected separations between nuclei. Twenty-seven galaxies out of their entire sample belong to the IRAS RBGS. GS04 conducted a survey of CO and HCN for 24 local U/LIRGs with IRAM 30 m. The four samples of SSS91, GS99, GS04, and ours are subsets of the IRAS RBGS. All the three comparing samples have the systematically higher IR luminosity range, whereas our sample contains significantly more lower luminosity sources, and a better representation of the entire GOALS sample.
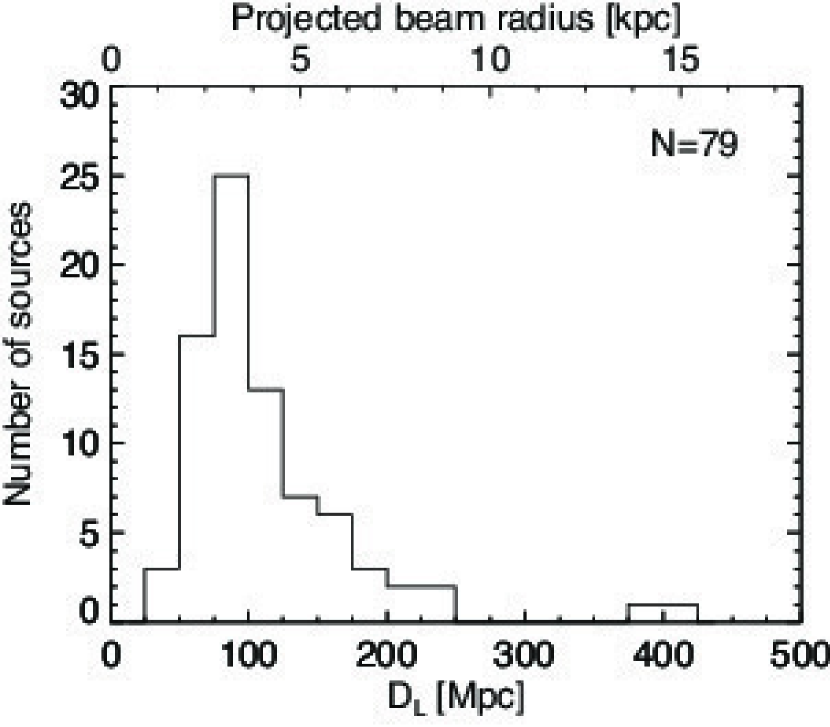
Some LIRGs are known to be groups of two or more galaxies. Our sample includes the 33 individual galaxies in 16 systems. The individual IR luminosities of these galaxies are taken from Díaz-Santos et al. (2010) and Howell et al. (2010) who allocated the IR luminosities using the MIR flux density ratios. For four pair galaxies (NGC 1797, IRASF10173+0828, NGC 4418, and MCG+04-48-002), we estimate the individual IR luminosities in the same method using MIPS 24 µm flux density ratios. Fifteen sources have the individual IR luminosities lower than and drop out to “sub-LIRGs” (Howell et al., 2010). Using the conversion factor of Kennicutt (1998) from the IR luminosity to the SFR, the individual SFRs are 0.07 – 630 and the median value is 36 for all of the targeted sources. For sources with , the SFRs are 18 – 630 and the median value is 44 . The heliocentric velocity and the luminosity distance of the sample are taken from Armus et al. (2009). The luminosity distances range from 37 Mpc to 400 Mpc (), and the median value is (Figure 2).
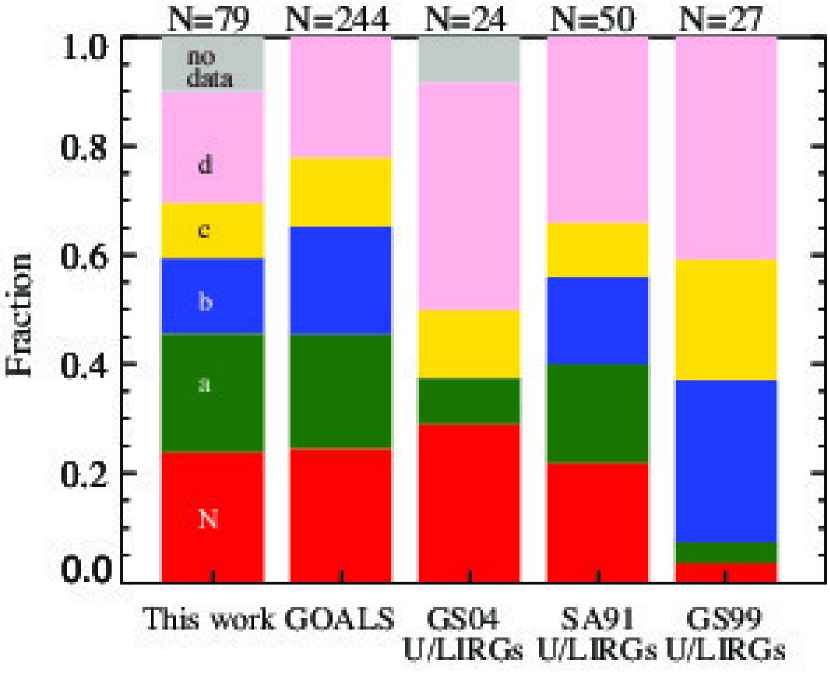
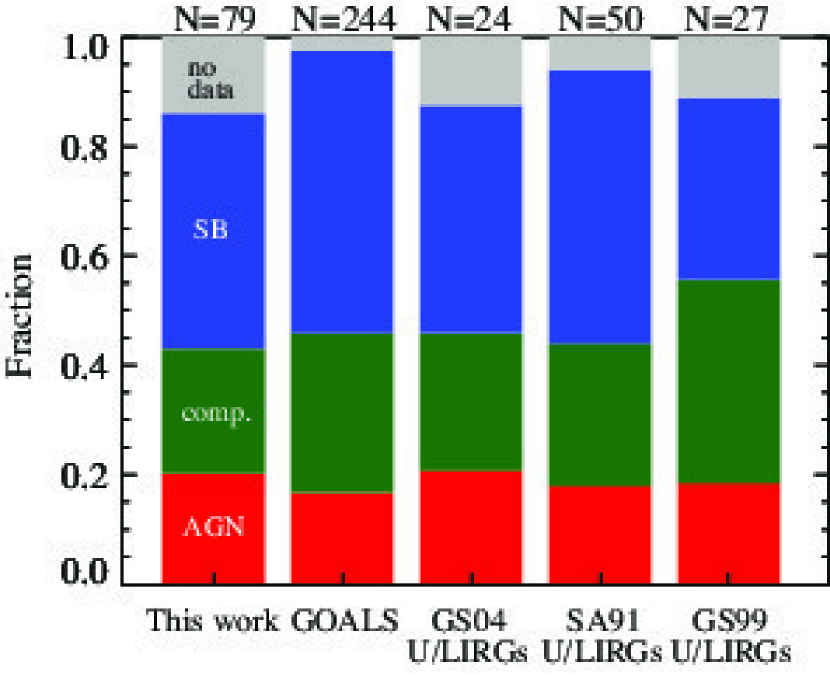
ST13 categorize the GOALS LIRGs into five stages of mergers: non-mergers with no sign of merger activities or massive neighbors, pre-mergers which are pair galaxies prior to its first encounter, early stage mergers which show symmetric disks but tidal tails, mid-stage mergers showing amorphous disks and tidal tails, and late-stage mergers with two nuclei in a common envelope (see ST13 for details). Our sample includes all the stages of the merger process, with a distribution similar to the GOALS sample (Figure 3). The U/LIRGs in GS04, however, are biased towards late stage mergers. In the sample of GS99, the number of galaxies at the non-merger and pre-merger is extremely low. The nuclear energy sources are categorized into SB-dominated, AGN-dominated, and composite galaxies, in a manner identical to Petric et al. (2011), using the polycyclic aromatic hydrocarbon equivalent widths (PAH EQW) in ST13. The dominant nuclear energy source of our sample is similar to the GOALS sample and U/LIRGs in SSS91, and also to GS99 and GS04 which are limited in sample size (Figure 4). Therefore, our sample is not biased towards specific phases of galactic interaction/merger or the dominant source of energy (SB or AGN). The target sample is tabulated in Table 1 with their properties and the observing coordinates.
2.2. Nobeyama 45 m Survey
The 12CO () line emission was observed using the NRO45 over four semesters from January 2010 to February 2013. The CO emission from the sources were measured with a single beam at the coordinates of the brightest points in their of MIPS/Spitzer images. The rest frequency of 12CO () emission is . The main beam size of the telescope at is . The projected beam radius ranges 1.3 – 15 kpc (see Figure 2) and the median value is at the median distance of the sample, . Sixty-two objects () out of the sample have the projected radii of less than 5 kpc.
The observations employed two types of dual-polarization two sideband-separating SIS mixer systems, T100H/V (Nakajima et al., 2008) and TZ (Nakajima et al., 2013), as a front-end, depending on availability. As the backend spectrometer in the first run, the wide-band-mode acousto-optical spectrometer (AOS-W) and the digital autocorrelator (AC45) were employed. AOS-W and AC45 have the frequency bandwidths of and , corresponding to and velocity bandwidths at , respectively. The frequency resolutions are and , corresponding to velocity resolutions and , for AOS-W and AC45 respectively. From the second run to the fourth, we utilized a broad bandwidth spectrometer, SAM45 (Kamazaki et al., 2012), which enables us to obtain spectra in a broader bandwidth than those in the previous run. We used SAM45 with a frequency coverage of (=) and a frequency resolution of (). For some galaxies whose spectra were obtained with several spectrometers, the one with the higher signal-to-noise (S/N) ratio is used for analysis. Consequently, eighteen galaxies are observed by AOS-W, six by AC45, and fifty-five by SAM45 (see also Table 2).
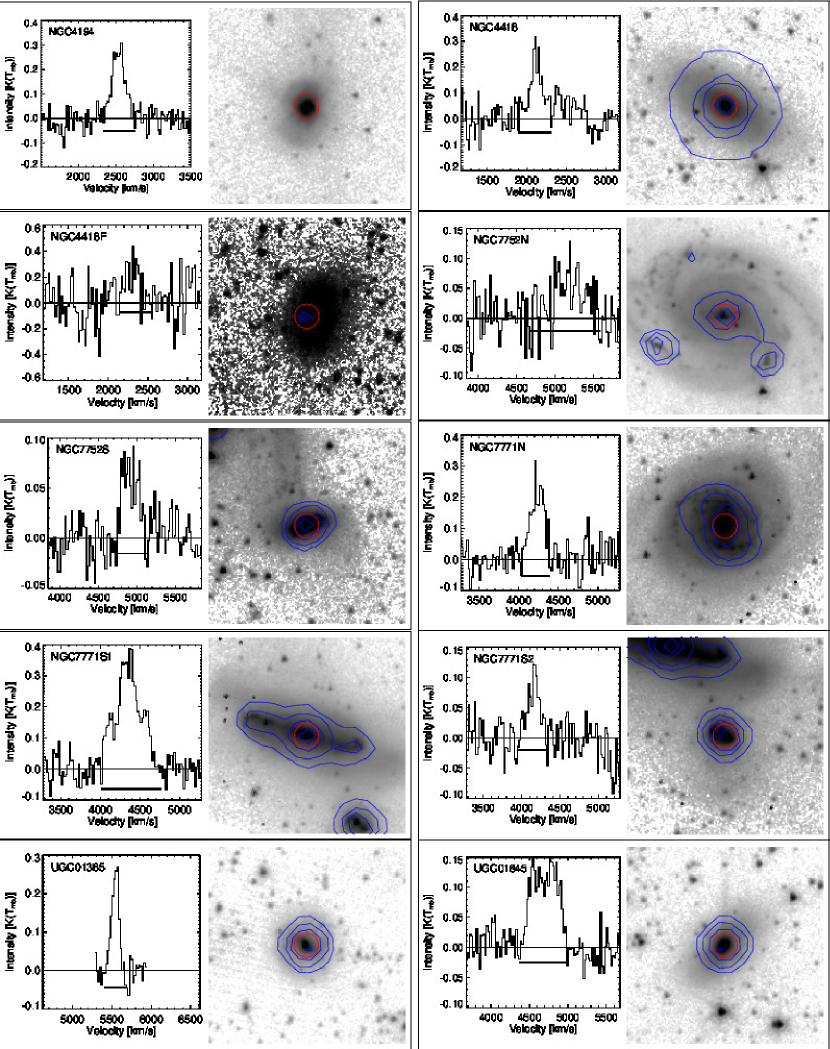
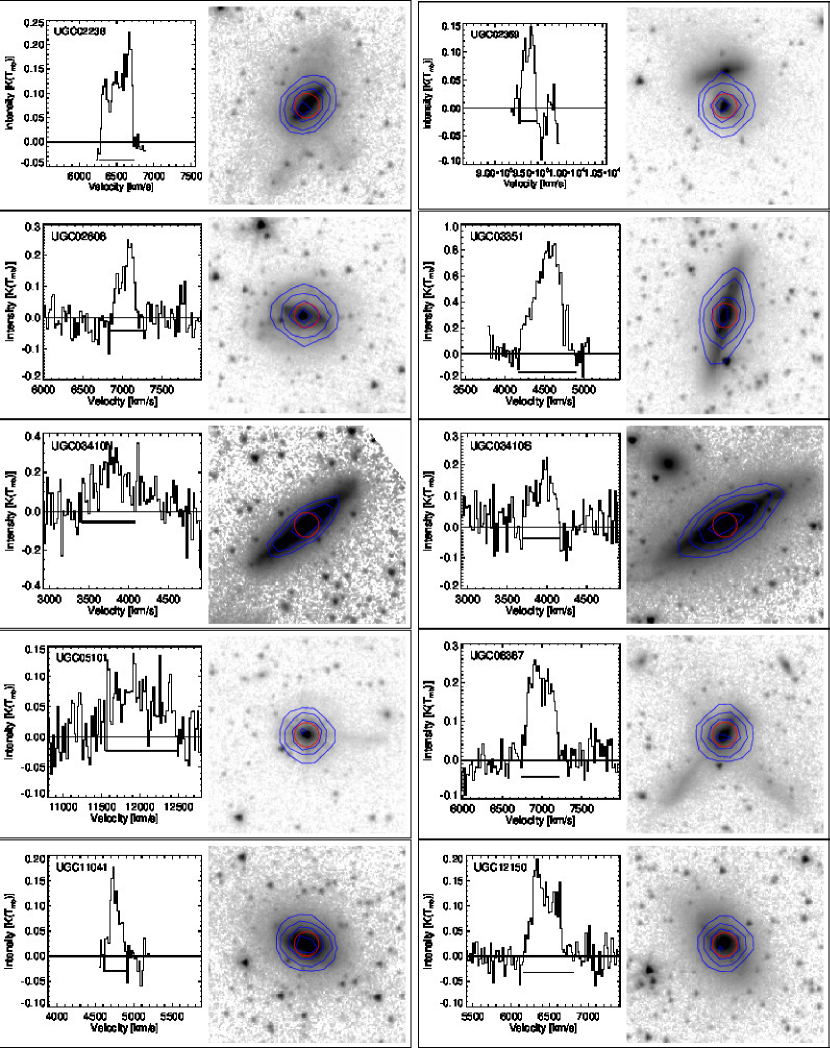
Fluxes of the obtained spectra were calibrated with the chopper wheel method and by observing standard sources. System noise temperatures, throughout all the observations, were typically on the antenna temperature scale () at the observed frequency. The pointing of the telescope was regularly checked every 30 - 60 minutes by observing SiO masers, with the typical r.m.s. error of . The spectra of observed CO emission lines are shown in Figure 16 with the observed position of the NRO45 beam, superposed on the 3.6 m images and 24 m contours.
2.3. Data Reduction and Analysis
The primary data reduction was performed by NewStar, a software distributed by NRO. The baselines were fitted with polynomial functions of order 1, but we used second to third orders in some cases that show large baseline fluctuations. Averaging individual scans of a source was done using weights of . The spectra were then smoothed with a box function of a velocity resolution of in order to improve the S/N ratio, except for IRAS F12224-0624 smoothed to a bin of 60 km s-1 and Mrk 331 to a bin of 40 km s-1. The CO velocity-integrated intensity was derived from the main beam temperature and the full velocity width and is represented as follows:
where is in a unit of , is the main beam temperature in K and is the main beam efficiency which is 0.38, 0.36, 0.31, and 0.28222The main beam efficiency is taken from the NRO web page http://www.nro.nao.ac.jp/ nro45mrt/html/ . in the first, second, third, and fourth runs, respectively. The performed integral range is indicated by a horizontal solid line below the spectrum in Figure 16. In order to estimate systematic calibration uncertainties, we further calibrated the integrated intensity using the observations of standard sources, NGC 7538, IRC+10210, and W51. The calibration factor is determined for each observing day and ranges from 0.838 to 2.80. The median is 1.14. Standard sources were not observed in the first run, so were bootstrapped to sources which were observed over several runs. The uncertainties in which is estimated from variations of fluxes of standard sources are typically about 13 %.
Of the 79 observed sources, 68 sources were detected, giving a detection rate of 86%. Five out of 11 non-detected sources are companions with fainter IR luminosity in their paired system. Three objects out of eleven non-detections were observed by AOS-W. Therefore, the narrow bandwidth is not a major cause of the non-detections. For the non-detected sources, 3 upper limits of their integrated CO intensity were estimated on the assumption that the sources have a Gaussian-shaped spectrum with an average velocity width of the sample, . Additional information for the notable sources are presented in Appendix C.
3. RESULTS
3.1. CO Luminosity and Molecular Gas Mass
The CO luminosity is commonly described by the following equation:
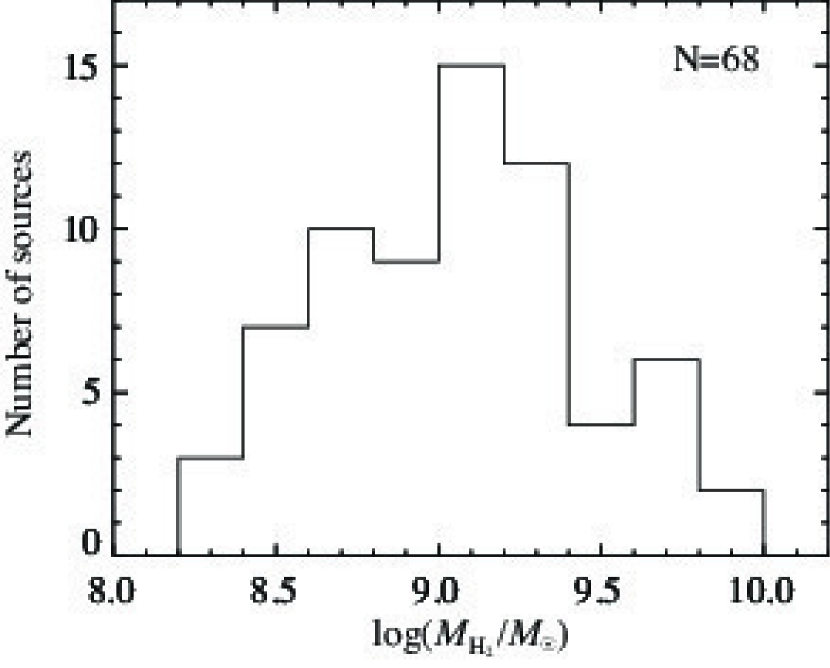
where is the main beam solid angle, and is the luminosity distance. The molecular gas mass, , was calculated using a CO-H2 conversion factor, . In this paper, an of (Papadopoulos et al., 2012) is used for all sources in the sample. This value is taken from Papadopoulos et al. (2012) who performed a one-phase radiative transfer analysis using global 12CO and 13CO emission lines of local ULIRGs and LIRGs. Such low values of compared to the Galactic value of are generally accepted for ULIRG or LIRGs (e.g., Downes & Solomon 1998; Bolatto et al. 2013, and references therein). The is known to be affected by some parameters, including metallicity, surface gas density, and dust temperature (e.g., Tacconi et al., 2008; Genzel et al., 2012; Magnelli et al., 2012). However, within the population of local LIRGs, the dynamic range of these parameters are relatively small, and thus these parameters are likely to be ineffective in changing the in our LIRG sample. For instance, the dust temperatures of our sample, which are derived from the IRAS 60 m/100 m color and of 2, are in a narrow range of 30 – 40 K. This corresponds to a variation of a factor of three on the relation between the dust temperature and derived by Magnelli et al. (2012). In addition, the dispersion of the observed CO intensities is as small as 0.5 dex in our sample, which provides a small variation of less than a factor of two based on the correlation between the total surface density and (Bolatto et al., 2013) assuming that local LIRGs have the same gas fraction. Inami et al. (2013) has shown that the gas-phase metallicities in GOALS sources are confined to a relatively narrow range of . This metallicity range corresponds to the nearly constant according to the predictions in Bolatto et al. (2013) using the models by Glover & Mac Low (2011) and Wolfire et al. (2010). We do not consider the variation of within a galaxy (Sandstrom et al., 2013), because only the central regions are observed. We note that the comparisons of molecular gas mass between LIRGs are less affected by the systematic variation of over the populations of galaxies as long as we use a single . The calculated CO luminosity and molecular gas mass are shown in Table 2. The molecular gas masses range from to , and the histogram of is shown in Figure 5.
3.2. Velocity Width
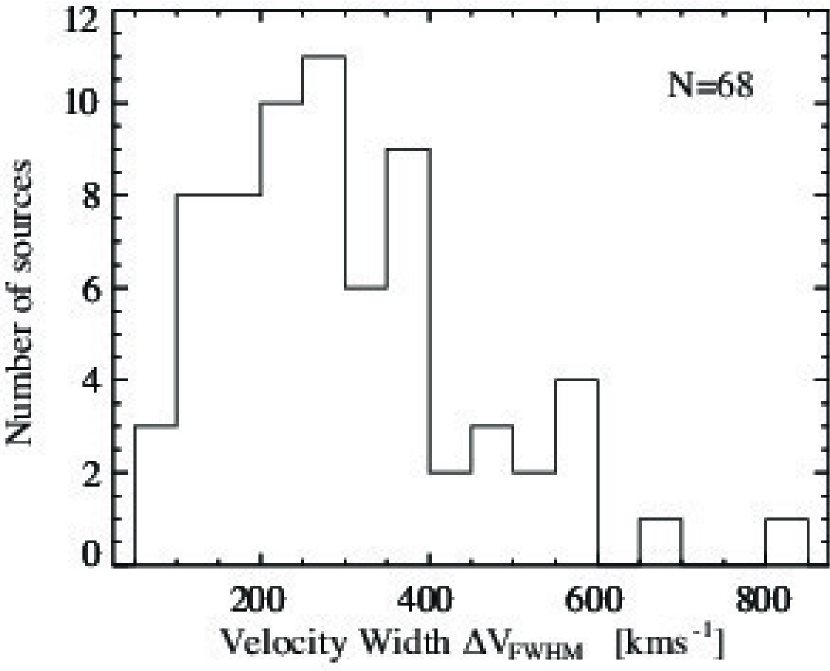
We derived the full width at half maximum (FWHM) of the velocity width, , of the CO line of all detected sources. The error in the is estimated by its variation which depends on the peak intensity uncertainty, and is % on average. The distribution of is shown in Figure 6. We find that is km s-1 on average, ranging from 80 km s-1 to 840 km s-1. Two galaxies, UGC 05101 and MCG +04-48-002S, have the significantly high velocity-widths (839 km s-1 and 651 km s-1, respectively) over observed ones by GS04, 245 km s-1 and 397 km s-1, respectively. This may be because our observation using the broader spectrometer could capture components of gas with anomalous velocities. While the maximum velocity coverages of the employed spectrometer is at 115 GHz, those in SSS91 and GS04 are 1330 km s-1 and 1560 km s-1, respectively.
3.3. Comparison with Results of the Previous Observations
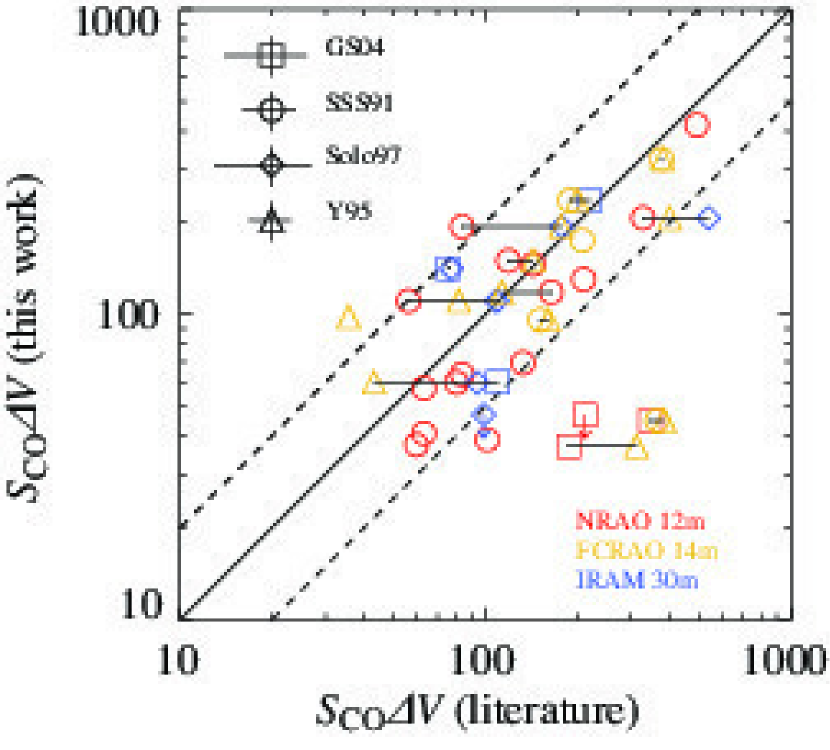
We compare the CO fluxes of 24 individual sources that are in both our observation and previous observations (GS04, Solomon et al. 1997, Young et al. 1995, and SSS91), which used smaller diameter telescopes of 12 m, 14 m, and 30 m with beam sizes of 55′′, 45′′, and 22′′, respectively. In case of multiple entries in the literature, we use values from smaller aperture telescopes, and in case more than one value is found for a telescope with the same aperture, we list the result from the most recent observation. For UGC 08387, the value from FCRAO 14 m (Young et al., 1995) is used as a reference instead of NRAO 12 m (SSS91) for the purpose of the CO size estimation in Section 3.4, as the 12 m measured a flux that was smaller than the 45 m measurement.
The comparison of the CO fluxes between this work and the references is shown in Figure 7. The fluxes of this work are on average lower than those of the NRAO 12 m observations while they are on average nearly equal to those of the IRAM 30 m observations. The fluxes of our observation are on average lower than those of the FCRAO 14 m observations if we exclude 3 ULIRGs and NGC 1275, whose is substantially different between our observation and Young et al. (1995) (see Appendix C for details). This systematic decrease is because of the difference of the projected beam sizes of the telescopes. The projected radii of the NRO45 and the 30 m telescope are 3.5 kpc and 5.2 kpc at 97 Mpc, respectively. The beams can capture the flux from only the central region. On the other hand, the projected radii of the 12 m and 14 m telescopes are 13 kpc and 11 kpc at 97 Mpc, respectively. Because our Galaxy has an extended CO distribution up to a radius of (Nakanishi & Sofue, 2006) and the spiral galaxies in the Virgo cluster have the CO emitting regions of radii up to 13.3 kpc (Nakanishi, 2005), the beams of the 12 m and 14 m telescopes are large enough to observe the total flux of a galaxy. The fluxes between NRAO 12 m and FCRAO 14 m are not significantly different. We illustrate the effect of the different beam sizes in Figure 8. On a CO contour of LIRG Arp 302 taken from Lo et al. (1997), four beam sizes are shown. This example obviously shows NRO45 and IRAM 30 m beam sizes are smaller than the extent of CO gas while NRAO 12 m and FCRAO 14 m beams are enough large. It is worth mentioning that the extended molecular gas of some LIRGs have been reported from CO(3–2) mappings with the JCMT telescope whose beam size is equivalent to one of NRO45 (Leech et al., 2010). This strongly implies that some LIRGs have the extended CO(1–0) distributions beyond the NRO45 beam.

3.4. CO Size Estimation
Molecular gas distributions in local LIRGs can be measured by interferometric observations, which show that almost all molecular gas of advanced mergers is concentrated in the compact nuclear region (Downes & Solomon, 1998; Bryant & Scoville, 1999) while molecular gas of some early or mid-stage mergers extends over a disk or a overlap region (Lo et al., 1997; Gao et al., 1997b; Wang et al., 2001; Saito et al., 2015). However, it is time-consuming for interferometers to build up a large sample of CO distributions of merging LIRGs. A method of comparisons of our NRO45 flux with observations from the literature which used single-dish telescopes with larger beam sizes allows us to quickly estimate the spatial extent of the CO distribution of our sources and to produce a large unbiased sample of galaxies with an estimated extent of CO gas.
The size of the CO distribution, , can be estimated by using the flux ratio of our flux at the NRO45 to the flux at the 12 m or 14 m telescopes. The flux ratio is an observable value, and represents the ratio of the the central flux convolved with the NRO45 beam to the total flux, on the supposition that the flux from the 12 m or 14 m observations are the total flux of a galaxy due to their large beam sizes (see Section 3.3). The flux ratio is rewritten as,
| (1) |
where is the radial CO intensity distribution which is characterized by the size , is the radius from the center of the galaxy on the sky, is the normalized beam pattern of NRO45, and the integral is performed over the whole galaxy. The radial distribution of CO intensity can often be approximated by an exponential, a Gaussian, or an uniform-disk distribution (e.g., Young et al., 1995; Nishiyama et al., 2001). We assume these three profiles of the CO intensity, the Gaussian distribution (Model A), the azimuthally symmetric exponential distribution (Model B), and the uniform disk (Model C). The size of the CO extent is defined as the half width at the half maximum (HWHM) of the CO distribution for the model A () and Model B (), and the radius of the CO distribution for the Model C (). In brief, this method solves Equation 1 for the parameterized CO size using the observed flux ratio and the assumption of the CO intensity distribution . Note that there is a limit to this estimate for galaxies with off-center distributions of CO gas. Moreover, there may be possibilities of overestimations for some galaxies whose CO distributions are extended up to 12 m or 14 m beams. For example, the Antennae galaxies show the extended molecular gas comparable to its optical distribution (Gao et al., 2001). The optical sizes of our sample galaxies are as well as or slightly larger than 12 m and 14 m beams. Further description of the estimation is given in Appendix A.
Sizes of the CO distribution of a sub-sample are estimated using this method. The sub-sample is composed of 21 galaxies which have literature flux value of the 12 m or the 14 m telescopes and have the value of less than one within the uncertainty. For four galaxies with we cannot estimate from directly, and therefore we estimate only the upper limit of by replacing in Equation 1 by . The flux ratio and the CO size of the sub-sample are summarized in Table 3.
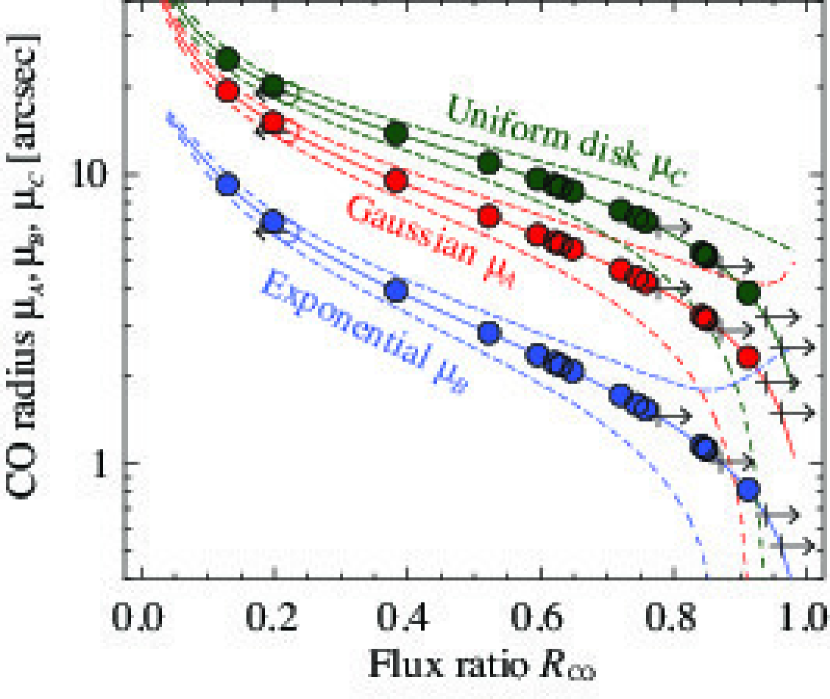
Figure 9 shows as a function of for each of the models. The difference of among three models increases from a factor of 2 around of 0.1, up to a factor of 5 near of 1. The error of each model also increases with , becoming greater than 100 % at . The source IRASF 01417+1651 in all models, and IC 1623AB, NGC 0992, and NGC 7771S1 in Model B have the errors of more than 100 % in the estimated CO size. In other words, the accuracy of this method decreases rapidly for of , , and in Model A, B, and C, respectively. Therefore, this method is not sensitive to CO distributions that are much smaller than the beam size of the single-dish observations.
The ranges of CO size of the sub-sample are 23 – 194, 37 – 98, and 39 – 250 in Model A (), B (), and C (), respectively. Eight sources (38 % of the sub-sample) show compact distributions in Model B with . Figure 10 shows the CO radius on the physical scale of the three models. The widely ranges from 0.8 kpc to 11 kpc in Model A and from 1.3 kpc to 17 kpc in Model C. Meanwhile all in Model B settle within a narrow range from 0.3 kpc to 4 kpc. The median of Model A, B, and C are 2.6 kpc, 1.0 kpc, and 4.1 kpc, respectively, excluding upper/lower limits. The majority of the sources, 14 sources (67 %) for Model A, 20 sources (95 %) for Model B, and 13 sources (62 %) for Model C, have of less than 4 kpc.

We compare with sizes measured with interferometers, to verify this method. We summarize published interferometric data of CO (1–0) and CO (2–1) in Table 3. In nine of twelve galaxies (75 %) that have the interferometric measurements in literature, the estimated sizes in one or more models are consistent with interferometric measurements within the errors. The is consistent with interferometric results for seven galaxies (58 %). This ensures the validity of this size-estimation. The sizes of two sources, NGC 4418, and IRAS F17207-0014, are inconsistent with the interferometric measurements. These sources have a very compact distribution of , for which our method is likely invalid.
In addition to the comparison with the interferometric sizes, the estimated CO sizes are compared with CO sizes measured from our mapping observations. Although no galaxies overlapping between the two measurements, this comparison allows us to confirm that our estimate does not largely contradict. The CO sizes from the mapping observations are measured for seven galaxies out of the mapping sample. These galaxies have CO detections in more than three positions along a axis and the peak positions of the intensities do not deviate from the galactic center. The CO size from the mapping observations is defined as a beam-deconvolved HWHM of a Gaussian fitting to a radial profile of an integrated intensity, and is summarized in Table 4. The detailed method to measure the size and an example of the mapping observations are presented in Appedix B. Figure 11 shows that the CO size in kpc scale from the mapping observations distributes from 1 to 7 kpc. This range is comparable to one of the Gaussian model in Figure 10. Therefore we conclude that our estimate of the CO size based on two different telescopes is consistent with the measurements of the mapping observations.

For the Gaussian distribution, corresponds to a radius where a half of total energy is included. Our Galaxy has 50 % of its molecular gas mass within the radius of 6 kpc (Sanders et al., 1984). The CO distributions of almost all of our sources are concentrated in a region more compact compared to our Galaxy. Young & Scoville (1982) reported that the HWHM of two late-type spiral galaxies whose radial profiles are fitted well by an exponential function which is similar to Model B is estimated to be approximately 4 kpc. Nishiyama et al. (2001) fitted CO radial distributions in the outer disk regions of nearby spiral galaxies by an exponential function and estimate a HWHM of kpc on average. The median radius of (1.0 kpc) is approximately a factor of 2-4 lower than spiral galaxies. The of 17/21 sources are smaller than the spiral galaxies.
For sources whose interferometric data are unavailable, the size estimate based on the Gaussian model predicts NGC 0992 and NGC 7771S1 to possess a compact distribution of the cold molecular gas (). This could imply the presence of the nuclear molecular disk in these sources. Interferometric observations of some local LIRGs reveals that the molecular gas is concentrated towards the central 1 kpc (e.g., Downes & Solomon, 1998; Bryant & Scoville, 1999). On the other hand, our model also predicts that IRAS F03359+1523, IC 2810W, MCG+04-48-002S, and Mrk 331 have molecular gas distribution extended over kpc. This method can easily estimate rough sizes of CO distributions.
4. DISCUSSION
4.1. Molecular Gas Inflow in Merging Galaxies
4.1.1 Molecular Gas in the Central Region and Merger Process
It is difficult to observe inflowing gas in interacting galaxies because of the short time-scale of inflow (, Iono et al., 2004) and complicated morphologies and velocity fields in mergers. In this section, we assess whether gas inflow is a common process in local LIRGs. Gao & Solomon (1999) find that the total molecular gas mass of LIRGs and ULIRGs decreases by a factor of 5 with decreasing separation between the two nuclei. This decrease in mass is interpreted as the consumption of molecular gas by the interaction/merger induced starburst. This is consistent with theoretical predictions in which of the initial gas content is consumed in a major merger (Cox et al., 2008).
Our observations allow us to statistically investigate the supply and consumption of the gas in the central region (, see Figure 2) along the merger sequence. While the total molecular gas in the whole galaxy decreases due to star formation, if molecular gas inflow from the outer parts of the galaxy into the central region is common in our sample, we expect the molecular gas in the central region to either be increasing when a speed of gas inflow is higher than one of gas-consumption by star formation, or be constant when the both speeds are equivalent, sustaining the high SFR during the interaction/merger.
We classify our sources into three stages of merger instead of the five stages in Section 2.1 in order to obtain the statistically large number of sources at each stage. The original five stages are binned into the three stages as follows: the non-merger (N) remains as the non-merger (0), the original pre-merger (a) and early stage merger (b) are combined as early stage (1), and original mid-stage merger (c) and late stage merger (d) are also combined as late stage (2). The numbers of galaxies with in each merger stage are 15, 21, and 22 for the non-merger, the early stage merger, and the late stage merger, respectively. Haan et al. (2011) investigated the merging timescales of a sub-sample in the GOALS sample and reported a timescale of 0.3 – 1.3 Gyr until the nuclei merge for interacting GOALS galaxies. Thus we can estimate the dynamical timescale between the early stage and late stage to be approximately .


Figure 12 shows the molecular gas mass in the NRO45 beam at each merger stage. In this diagram, we also plot the median values among sources detected in CO with . We do not detect any trend in the molecular gas mass in the central region along the merger sequence. Although there is a huge dispersion and therefore any quantitative discussion is difficult, the median values of the molecular gas mass from the early stage to the late stage are constant within their errors. The result of a Kolmogorov-Smirnov (K-S) test indicates a -value of 0.66 between the distributions of the early stage and the late stage, which suggests that the molecular gas mass in the central region, on average, does not evolve strongly as a function of merger stage, and supports the constant molecular gas mass in the central region. The total molecular gas mass decreases by a factor of 5 along the merger sequence as proposed by Gao & Solomon (1999), while but the molecular gas mass in the central region appears not to show any similar trends. This result could imply a radial inflow towards the central region from the outer disk.
The molecular gas mass in the central region of the NRO45 beam along the merger stage may be affected by a systematic bias in the the source distance as the function of the merger stage, since the area subtended by the telescope beam would be changed. Figure 13 shows the distribution of the projected radii at each stage. Almost all of the sources are within 2 kpc – 5 kpc, and no systematic dependence of the projected radii on the merger stage is present. Even if four sources with a particularly large projected radius of are excluded from Figure 12, the median of the molecular gas mass still does not detect any trend.
A systematic dependence of on the merger stage can also affect the molecular gas mass at each merger stage. Such a change may occur when the molecular gas distribution becomes compact (the more discussion in the Section 4.1.2). In order for the to account for the observed constancy of molecular gas mass, would have to change systematically by a factor of 4.5 from the early stage to the late stage, bringing down the median gas mass in the late stage below the spread of the early stage. Considering the discussion in Section 3.1, this large change in is unlikely. In addition, even though in the extreme case that LIRGs have the Galactic of (Bolatto et al., 2013) while ULIRGs have the low of (Downes & Solomon, 1998), the central molecular gas mass is still constant because of the small number of ULIRGs (eight sources) in our sample.
If the molecular gas mass in the central region through the interaction/merger does not vary, then the amount of molecular gas consumed by star formation in the central region are roughly comparable with the molecular gas mass supplied by the global inflow towards the central region during a term between the early stage to the late stage of merger, approximately 1 Gyr. In other words, the time-averaged SFR over a merger timescale of Gyr, , are comparable with the time-averaged rate of gas inflow over the same timescale, . Thus we can roughly estimate as
| (2) |
Numerical simulations have predicted two starburst events during a merger (e.g., Mihos & Hernquist, 1996), which lasts Gyr each (Cox et al., 2008). Since the whole merger event lasts Gyr (Haan et al., 2011), we can estimate that the time-averaged SFR is on the order of the median value () of the galaxies with in our sample. Given large uncertainties, from Equation 2, we estimate of in our sample. This rate is significantly larger than barred spiral galaxies (Sakamoto et al., 1999). This implies that mergers efficiently transfer the molecular gas towards the central region compared to bars in spiral galaxies.
There are other possible mechanisms involving flows of the molecular gas, such as outflows by AGN (e.g., García-Burillo et al., 2014; Sakamoto et al., 2014; Cicone et al., 2014) or by the large-scale wind by starburst (e.g., Walter et al., 2002; Cicone et al., 2014; Cazzoli et al., 2014), or the kinetic ejection due to interactions/mergers (Iono et al., 2004; Kapferer et al., 2005). However, these effects are likely not significant for the mass-loss in our sample. The kinetic ejections hardly affect depletions of the molecular gas in the central region because it is effective mainly in the outer disk. The mass-loss rates by the AGN-driven outflow and the starburst outflow are likely smaller than their SFRs, because most of our sample is not AGN-dominated galaxies (Petric et al. 2011; ST13) nor shock-heated galaxies (Inami et al., 2013).

4.1.2 The CO Size and Merger Stage
Gas inflow from the outer disk to the central region could downsize the extent of the CO distribution. We examine the CO size with the merger stage in Figure 14. We also show the CO size normalized by a radius in -band image, , in Figure 14b. The -band radius are the geometric mean of half-light radii between a major axis and a minor axis, which is taken from the 2MASS Extended Source Catalog (Skrutskie et al., 2006). The seven galaxies with the CO size from the mapping observations are unintentionally early-stage mergers and non-mergers, and thus we does not plot these data.
In all three models (Model A-C), the median values of and appear to be decreasing by a factor of . However, there are remaining uncertainties: the large dispersion of data, the simplified merger stages, and the uncertainties of the estimated CO size, which arise from the assumed distribution profile of CO gas, the error in CO intensity, and the pointing error of the observations. The decreasing trend, if significant, would be consistent with the scenario where the inflow of the molecular gas from the outer disk towards the central region in merging LIRGs.
The CO size of the non-mergers are the smallest among the three classes of mergers. In the molecular gas mass distributions, the KS test for the non-mergers shows p-values of 0.53 and 0.13 against the early stage mergers and the late stage mergers, respectively. It is not rejected that the non-mergers are from a same population of the early stage mergers and the late stage mergers. Therefore, the non-mergers seem to have a centrally concentrated, dense molecular gas. Haan et al. (2011) report that non-mergers in the GOALS galaxies with have the most luminous bulge, largest bulge radius, and largest bulge Sérisic index compared to other merger stages. These non-merger LIRGs may be radiating their IR by a different mechanism from the merging LIRGs.
5. SUMMARY and CONCLUSION
We present initial results from the CO observation of 79 galaxies in 62 GOALS LIRG systems (54 LIRGs and 8 ULIRGs) using the Nobeyama 45 telescope. The CO was observed with a single beam towards the central regions (, for 80 % of our sample) corresponding to their brightest MIR positions. Our CO sample covers the full range of merger stage, AGN fraction and IR luminosity seen in the GOALS sample. Using the obtained CO data, we find that
-
1.
CO emission was detected in 68 out of 79 sources, giving a detection rate of 86 %. Adopting a of , the molecular gas mass is estimated to be .
-
2.
By comparing the NRO45 CO flux to that reported in larger beams in the literature for a subset of 21 LIRGs, we are able to estimate the extent of the CO emission using a few simple models for the distribution of the molecular gas. The median values of the CO radii are 2.6 kpc, 1.0 kpc, and 4.1 kpc in the Gaussian, exponential, and uniform disk models, respectively. The majority of the galaxies have the CO radii of in all models. Despite the low spatial resolutions (FWHM=15″, 45″, 55″) of the single-dish telescopes, the estimated CO sizes are consistent with interferometric measurements for most of the sources with available interferometric data. We note that our estimation is inaccurate for compact sources with .
-
3.
Any trend is not detected in the molecular gas mass in the central region along the merger sequence. Although there is the large dispersion, the median values of the molecular gas mass from the early stage to the late stage of merger are constant within their errors. If the total molecular gas mass decreases along the merger sequence as proposed by Gao & Solomon (1999), then this constant central gas mass could imply an inflow towards the central 1–few kpc in these sources. The CO size appears to be decreasing from the early stage to the late stage of merger by a factor of , although there are large uncertainties remaining. This might imply a gas inflow from the outer disk towards the central region.
Appendix A Models to Estimate the CO Size
The CO sizes of 21 sub-sample galaxies are estimated using a combination of flux from , , and beam-sized telescopes. In Equation 1, the ratio of the flux within the beam to the flux within or beam is defined. The numerator is considered to be the total flux of the source. The denominator corresponds to the flux from the emitting region which is convolved with the primary beam pattern of the telescope beam. The primary beam pattern is approximated by a normalized axisymmetric Gaussian distribution with the main beam size and is expressed by the following equation,
| (A1) |
We assume three intensity distribution profiles of the emitting region, the Gaussian distribution (Model A), the azimuthally symmetric exponential distribution (Model B), and the Uniform disk (Model C). These are represented as,
| (A2) | |||||
| (A3) | |||||
| (A4) |
where is the radius from the peak of the intensity, and is a constant. The , , and are the CO sizes for each model. For Model A and B, the CO sizes and are identical to the HWHMs. The is the radius of the disk in Model C. As long as the center of the beam coincides with the center of the intensity distribution, the flux ratio in Equation 1 is rewritten as,
| (A5) |
where is replaced by indices of Model A, B or C. By solving Equations A5 for , we obtain the CO size. We can easily isolate as follows,
| (A6) |
Model B and C cannot be solved analytically for and . We solve Model B and C numerically. The equations to be solved are,
| (A7) | |||
| (A8) |
The integration in Equation A7 was performed by using the IDL function QROMO.
The solutions of the CO sizes for given flux ratios are displayed in Figure 9.
The accuracy of this estimate and the difference between the models are discussed in Section 3.4.
Appendix B The Measurement of the CO Size from the Mapping Observations
We also conducted the half-beam spacing mapping for 31 LIRGs during the 2012 and 2013 semesters. The basic reductions were done in a similar manner to the pointing observations, and the maps are produced from 2–35 positions. For seven galaxies, the CO size are measured. They have CO detections of more than three positions along a axis and positions of their peak intensities does not deviate from the galactic center.
A Gaussian function is fitted to the radial profile of integrated intensities along a axis. The obtained Gaussian HWHM is deconvolved by the NRO45 beam profile function which is approximated by a Gaussian with of . The deconvolved HWHM is defined as the CO size of the mapping observations. When the Gaussian HWHM is smaller than the beam size, the Gaussian HWHM is the upper limit of the CO size. An example of the mapping observation and a radial profile are shown in Figure 15.

Appendix C Notes on Individual Sources
We describe the characteristics of four sources which have excessively large or small flux ratio ( or ), and one source which may have CO intensity distributions that possibly deviate from our assumed models.
NGC 1275 — This object is a cD galaxy at the center of the Perseus cluster. A strong radio continuum comes from Perseus A (3C 084) located in the center of NGC 1275. The cold molecular gas is associated with filament structures seen in H (Salomé et al., 2006, 2008a, 2008b). The NRO45 observation of the beam shows that this source has 98.2 Jy km s-1, which is 75 % larger than 35.7 Jy km s-1 given in Young et al. (1995) by the beam, and therefore has a high of 2.75 (see Section 3.3). The flux towards the center of NGC 1275 reported in the literature vary greatly. For example, Lazareff et al. (1989) reported a flux of Jy km s-1 with the beam at IRAM 30 m. Mirabel et al. (1989) obtained a flux of 65.8 Jy km s-1 with the the beam at NRAO 12 m, and Evans et al. (2005) measured the flux to be Jy km s-1 with beam at the Kitt Peak 12 m Telescope. An observation by Salomé et al. (2008b) reported the central flux of NGC 1275 to be Jy km s-1 with IRAM 30 m. This undetermined flux may be due to instabilities of the baseline in the spectra due to the strong radio continuum.
We note that may be overestimated because of the low S/N ratio. In the velocity range with the high S/N ratio the is estimated to be 240 km s-1. Lazareff et al. (1989), Mirabel et al. (1989), Evans et al. (2005), and Salomé et al. (2008b) estimate to be 200 – 300 km s-1.
UGC 05101 — This ULIRG shows a high flux ratio of . The flux is Jy km s-1 based on the NRO45 observation, while 75.5 Jy km s-1 based on the IRAM 30 m observation (Gao & Solomon, 2004). Solomon et al. (1997) obtained 77.2 Jy km s-1 with the IRAM 30 m. The velocity widths of Gao & Solomon (2004) and Solomon et al. (1997) are consistent with each other, as well as the flux. Their spectra are located in the heliocentric velocity range from 11500 km s-1 to 12000 km s-1, Our spectrum shows an additional redshifted component +500 km s-1 and consequently the broad velocity width of 840 km s-1. Due to this redshifted feature, our measurement of the flux is larger than those by Gao & Solomon (2004) and Solomon et al. (1997).
Mrk 231 — For this ULIRG, the flux measurements by NRO45 and SSS91 show Jy km s-1 and 56.0 Jy km s-1, respectively. Therefore Mrk 231 has a high flux ratio of 1.98. Our measurement is consistent with the IRAM 30 m observation with beam, which gives Jy km s-1 (Solomon et al., 1997). Additionally the CO spectrum by SSS91 shows two peaks, while the spectrum of our observation and Solomon et al. (1997) show a single peak. Thus the measurement by SSS91 may be doubtful. The S/N ratio of the observation by SSS91 appears to be lower compared to our observation and the observation by Solomon et al. (1997).
MCG+04-48-002S (NGC 6921, MCG +04-48-001) — This is a less-IR luminous object (), accompanying a luminous galaxy MCG +04-48-002N (MCG +04-48-002, ) offset on the sky by 1.5. Our flux measurement shows Jy km s-1. GS04 obtain a flux of 188 Jy km s-1 with a beam observation. Thus a flux ratio is as low as 0.2. Young et al. (1986, 1995) reported a larger flux of 312 Jy km s-1. Both observations of GS04 and Young et al. (1986, 1995), however, suffer from baseline uncertainties due to relatively narrow bandwidths. Moreover, the line profiles are quite different between GS04 and Young et al. (1986). The flux from GS04 is consistent with a flux estimated from the – relation for the starburst galaxies in Daddi et al. (2010).
NGC 7771S1 — This object is an edge-on galaxy companying two galaxies NGC 7771N (NGC 7769) and NGC 7771S2 (NGC 7770). The 24 m peak is located at the galactic center, while the two additional components of 24 m are seen at both edges of the galaxy (see Figure 16). Interferometric observation of the galaxy shows an elongated CO distribution towards the east edge (Dale et al., 2005). Therefore the CO spatial structure might not match any of models to estimate the CO extent in Section 3.4.
The line profile shows three distinct peaks (see Figure 16). This three-peak profile is also seen in the 14 m observation (SSS91; Young et al. 1995). The detection by the smaller beam observation indicates that the origin of the profile is within the central 2.2 kpc. There may be a rotating molecular ring around the galactic nucleus which produces the secondary peaks, and concentrated molecular clouds which emerge as the central peak in the spectrum. The rotating molecular ring might be directly associated with the starburst ring existing around the nucleus (Smith et al., 1999).
Mrk 331 — This object is a disk galaxy at the pre-merger stage (Haan et al. 2011; ST13). The CO we obtain shows a much lower flux ( Jy km s-1) than the 12 m observation (346.4 Jy km s-1, GS04, ). The flux ratio of 0.13 is the lowest in our sample. Other flux measurements of Mrk 331 report 371 Jy km s-1 with the IRAM 30 m (Solomon et al., 1997) and 392 Jy km s-1 with the FCRAO 14 m (Young et al., 1995). The CO gas in this object could be extremely extended.
References
- Aalto & Hüttemeister (2000) Aalto, S., & Hüttemeister, S. 2000, A&A, 362, 42
- Armus et al. (2007) Armus, L., Charmandaris, V., Bernard-Salas, J., et al. 2007, ApJ, 656, 148
- Armus et al. (2009) Armus, L., Mazzarella, J. M., Evans, A. S., et al. 2009, PASP, 121, 559
- Barnes & Hernquist (1996) Barnes, J. E., & Hernquist, L. 1996, ApJ, 471, 115
- Bolatto et al. (2013) Bolatto, A. D., Wolfire, M., & Leroy, A. K. 2013, ARA&A, 51, 207
- Bryant & Scoville (1999) Bryant, P. M., & Scoville, N. Z. 1999, AJ, 117, 2632
- Caputi et al. (2007) Caputi, K. I., Lagache, G., Yan, L., et al. 2007, ApJ, 660, 97
- Casey (2012) Casey, C. M. 2012, MNRAS, 425, 3094
- Cazzoli et al. (2014) Cazzoli, S., Arribas, S., Colina, L., et al. 2014, A&A, 569, A14
- Cicone et al. (2014) Cicone, C., Maiolino, R., Sturm, E., et al. 2014, A&A, 562, A21
- Costagliola et al. (2013) Costagliola, F., Aalto, S., Sakamoto, K., et al. 2013, A&A, 556, A66
- Cox et al. (2008) Cox, T. J., Jonsson, P., Somerville, R. S., Primack, J. R., & Dekel, A. 2008, MNRAS, 384, 386
- Curran et al. (2000) Curran, S. J., Aalto, S., & Booth, R. S. 2000, A&AS, 141, 193
- Daddi et al. (2010) Daddi, E., Elbaz, D., Walter, F., et al. 2010, ApJ, 714, L118
- Dale et al. (2005) Dale, D. A., Sheth, K., Helou, G., Regan, M. W., Hüttemeister, S. 2005, AJ, 129, 2197
- Díaz-Santos et al. (2010) Díaz-Santos, T., Charmandaris, V., Armus, L., et al. 2010, ApJ, 723, 993
- Díaz-Santos et al. (2011) Díaz-Santos, T., Charmandaris, V., Armus, L., et al. 2011, ApJ, 741, 32
- Dinh-V-Trung et al. (2001) Dinh-V-Trung,, Lo, K. Y., Kim, D.-C., Gao, Y., & Gruendl, R. A. 2001, ApJ, 556, 141
- Downes et al. (1993) Downes, D., Solomon, P. M., & Radford, S. J. E. 1993, ApJ, 414, L13
- Downes & Solomon (1998) Downes, D., & Solomon, P. M. 1998, ApJ, 507, 615
- Elbaz et al. (2002) Elbaz, D., Cesarsky, C. J., Chanial, P., et al. 2002, A&A, 384, 848
- Elfhag et al. (1996) Elfhag, T., Booth, R. S., Hoeglund, B., Johansson, L. E. B., & Sandqvist, A. 1996, A&AS, 115, 439
- Evans et al. (2000) Evans, A. S., Surace, J. A., & Mazzarella, J. M. 2000, ApJ, 529, L85
- Evans et al. (2005) Evans, A. S., Mazzarella, J. M., Surace, J. A., et al. 2005, ApJS, 159, 197
- Gao et al. (1997a) Gao, Y., Gruendl, R., Lo, K. Y., Hwang, C. Y., & Veilleux, S. 1997, American Institute of Physics Conference Series, 393, 319
- Gao et al. (1997b) Gao, Y., Solomon, P. M., Downes, D., & Radford, S. J. E. 1997, ApJ, 481, L35
- Gao & Solomon (1999) Gao, Y., & Solomon, P. M. 1999, ApJ, 512, L99
- Gao et al. (2001) Gao, Y., Lo, K. Y., Lee, S.-W., & Lee, T.-H. 2001, ApJ, 548, 172
- Gao & Solomon (2004) Gao, Y., & Solomon, P. M. 2004, ApJS, 152, 63
- García-Burillo et al. (2014) García-Burillo, S., Combes, F., Usero, A., et al. 2014, A&A, 567, A125
- García-Burillo et al. (2012) García-Burillo, S., Usero, A., Alonso-Herrero, A., et al. 2012, A&A, 539, A8
- Genzel et al. (2012) Genzel, R., Tacconi, L. J., Combes, F., et al. 2012, ApJ, 746, 69
- Glover & Mac Low (2011) Glover, S. C. O., & Mac Low, M.-M. 2011, MNRAS, 412, 337
- Goto et al. (2010) Goto, T., Takagi, T., Matsuhara, H., et al. 2010, A&A, 514, A6
- Haan et al. (2011) Haan, S., Surace, J. A., Armus, L., et al. 2011, AJ, 141, 100
- Howell et al. (2010) Howell, J. H., Armus, L., Mazzarella, J. M., et al. 2010, ApJ, 715, 572
- Imanishi & Nakanishi (2013) Imanishi, M., & Nakanishi, K. 2013, AJ, 146, 47
- Inami et al. (2013) Inami, H., Armus, L., Charmandaris, V., et al. 2013, ApJ, 777, 156
- Iono et al. (2005) Iono, D., Yun, M. S., & Ho, P. T. P. 2005, ApJS, 158, 1
- Iono et al. (2004) Iono, D., Yun, M. S., & Mihos, J. C. 2004, ApJ, 616, 199
- Kamazaki et al. (2012) Kamazaki, T., Okumura, S. K., Chikada, Y., et al. 2012, PASJ, 64, 29
- Kapferer et al. (2005) Kapferer, W., Knapp, A., Schindler, S., Kimeswenger, S., & van Kampen, E. 2005, A&A, 438, 87
- Kennicutt (1998) Kennicutt, R. C., Jr. 1998, ARA&A, 36, 189
- Kim et al. (1998) Kim, D.-C., Veilleux, S., & Sanders, D. B. 1998, ApJ, 508, 627
- Lazareff et al. (1989) Lazareff, B., Castets, A., Kim, D.-W., & Jura, M. 1989, ApJ, 336, L13
- Le Floc’h et al. (2005) Le Floc’h, E., Papovich, C., Dole, H., et al. 2005, ApJ, 632, 169
- Leech et al. (2010) Leech, J., Isaak, K. G., Papadopoulos, P. P., Gao, Y., & Davis, G. R. 2010, MNRAS, 406, 1364
- Lo et al. (1997) Lo, K. Y., Gao, Y., & Gruendl, R. A. 1997, ApJ, 475, L103
- Magnelli et al. (2009) Magnelli, B., Elbaz, D., Chary, R. R., et al. 2009, A&A, 496, 57
- Magnelli et al. (2013) Magnelli, B., Popesso, P., Berta, S., et al. 2013, A&A, 553, AA132
- Magnelli et al. (2012) Magnelli, B., Saintonge, A., Lutz, D., et al. 2012, A&A, 548, A22
- Mazzarella et al. (1993) Mazzarella, J. M., Graham, J. R., Sanders, D. B., & Djorgovski, S. 1993, ApJ, 409, 170
- Mihos & Hernquist (1996) Mihos, J. C., & Hernquist, L. 1996, ApJ, 464, 641
- Mirabel et al. (1990) Mirabel, I. F., Booth, R. S., Johansson, L. E. B., Garay, G., & Sanders, D. B. 1990, A&A, 236, 327
- Mirabel et al. (1989) Mirabel, I. F., Sanders, D. B., & Kazes, I. 1989, ApJ, 340, L9
- Nakajima et al. (2013) Nakajima, T., Kimura, K., Nishimura, A., et al. 2013, PASP, 125, 252
- Nakajima et al. (2008) Nakajima, T., Sakai, T., Asayama, S., et al. 2008, PASJ, 60, 435
- Nakanishi (2005) Nakanishi, H. 2005, PhD Thesis, The University of Tokyo
- Nakanishi & Sofue (2006) Nakanishi, H., & Sofue, Y. 2006, PASJ, 58, 847
- Nishiyama et al. (2001) Nishiyama, K., Nakai, N., & Kuno, N. 2001, PASJ, 53, 757
- Papadopoulos et al. (2012) Papadopoulos, P. P., van der Werf, P. P., Xilouris, E. M., et al. 2012, MNRAS, 426, 2601
- Petric et al. (2011) Petric, A. O., Armus, L., Howell, J., et al. 2011, ApJ, 730, 28
- Planesas et al. (1991) Planesas, P., Mirabel, I. F., & Sanders, D. B. 1991, ApJ, 370, 172
- Saintonge et al. (2011) Saintonge, A., Kauffmann, G., Kramer, C., et al. 2011, MNRAS, 415, 32
- Saito et al. (2015) Saito, T., Iono, D., Yun, M. S., et al. 2015, ApJ, 803, 60
- Sakamoto et al. (2014) Sakamoto, K., Aalto, S., Combes, F., Evans, A., & Peck, A. 2014, arXiv:1403.7117
- Sakamoto et al. (1999) Sakamoto, K., Okumura, S. K., Ishizuki, S., & Scoville, N. Z. 1999, ApJ, 525, 691
- Salomé et al. (2006) Salomé, P., Combes, F., Edge, A. C., et al. 2006, A&A, 454, 437
- Salomé et al. (2008b) Salomé, P., Combes, F., Revaz, Y., et al. 2008, A&A, 484, 317
- Salomé et al. (2008a) Salomé, P., Revaz, Y., Combes, F., et al. 2008, A&A, 483, 793
- Sanders et al. (2003) Sanders, D. B., Mazzarella, J. M., Kim, D.-C., Surace, J. A., & Soifer, B. T. 2003, AJ, 126, 1607
- Sanders & Mirabel (1985) Sanders, D. B., & Mirabel, I. F. 1985, ApJ, 298, L31
- Sanders & Mirabel (1996) Sanders, D. B., & Mirabel, I. F. 1996, ARA&A, 34, 749
- Sanders et al. (1991) Sanders, D. B., Scoville, N. Z., & Soifer, B. T. 1991, ApJ, 370, 158
- Sanders et al. (1986) Sanders, D. B., Scoville, N. Z., Young, J. S., et al. 1986, ApJ, 305, L45
- Sanders et al. (1984) Sanders, D. B., Solomon, P. M., & Scoville, N. Z. 1984, ApJ, 276, 182
- Sandstrom et al. (2013) Sandstrom, K. M., Leroy, A. K., Walter, F., et al. 2013, ApJ, 777, 5
- Scoville et al. (1989) Scoville, N. Z., Sanders, D. B., Sargent, A. I., Soifer, B. T., & Tinney, C. G. 1989, ApJ, 345, L25
- Scoville et al. (1991) Scoville, N. Z., Sargent, A. I., Sanders, D. B., & Soifer, B. T. 1991, ApJ, 366, L5
- Scoville et al. (2014) Scoville, N., Sheth, K., Walter, F., et al. 2014, arXiv:1412.5183
- Skrutskie et al. (2006) Skrutskie, M. F., Cutri, R. M., Stiening, R., et al. 2006, AJ, 131, 1163
- Smith et al. (1999) Smith, D. A., Herter, T., Haynes, M. P., & Neff, S. G. 1999, ApJ, 510, 669
- Solomon et al. (1997) Solomon, P. M., Downes, D., Radford, S. J. E., & Barrett, J. W. 1997, ApJ, 478, 144
- Stierwalt et al. (2014) Stierwalt, S., Armus, L., Charmandaris, V., et al. 2014, ApJ, 790, 124
- Stierwalt et al. (2013) Stierwalt, S., Armus, L., Surace, J. A., et al. 2013, ApJS, 206, 1
- Tacconi et al. (2008) Tacconi, L. J., Genzel, R., Smail, I., et al. 2008, ApJ, 680, 246
- U et al. (2012) U, V., Sanders, D. B., Mazzarella, J. M., et al. 2012, ApJS, 203, 9
- Ueda et al. (2014) Ueda, J., Iono, D., Yun, M. S., et al. 2014, ApJS, 214, 1
- Walter et al. (2002) Walter, F., Weiss, A., & Scoville, N. 2002, ApJ, 580, L21
- Wang et al. (2001) Wang, W.-H., Lo, K. Y., Gao, Y., & Gruendl, R. A. 2001, AJ, 122, 140
- Wolfire et al. (2010) Wolfire, M. G., Hollenbach, D., & McKee, C. F. 2010, ApJ, 716, 1191
- Yao et al. (2003) Yao, L., Seaquist, E. R., Kuno, N., & Dunne, L. 2003, ApJ, 588, 771
- Young et al. (1986) Young, J. S., Schloerb, F. P., Kenney, J. D., & Lord, S. D. 1986, ApJ, 304, 443
- Young & Scoville (1982) Young, J. S., & Scoville, N. 1982, ApJ, 258, 467
- Young et al. (1989) Young, J. S., Xie, S., Kenney, J. D. P., & Rice, W. L. 1989, ApJS, 70, 699
- Young et al. (1995) Young, J. S., Xie, S., Tacconi, L., et al. 1995, ApJS, 98, 219
- Yun et al. (1994) Yun, M. S., Scoville, N. Z., & Knop, R. A. 1994, ApJ, 430, L109
- Yun & Scoville (1995) Yun, M. S., & Scoville, N. Z. 1995, ApJ, 451, L45
- Xu et al. (2014) Xu, C. K., Cao, C., Lu, N., et al. 2014, ApJ, 787, 48
- Xu et al. (2015) Xu, C. K., Cao, C., Lu, N., et al. 2015, ApJ, 799, 11


| Galaxies | R.A.(J2000) | Dec.(J2000) | Velocity | ||
|---|---|---|---|---|---|
| (km s-1) | (Mpc) | ||||
| (1) | (2) | (3) | (4) | (5) | (6) |
| NGC 0034S | 5881 | 84.1 | 11.34HHfootnotemark: | ||
| NGC 0034N | 5881 | 84.1 | 10.57HHfootnotemark: | ||
| MCG -02-01-051 | 8159 | 117.5 | 11.48 | ||
| NGC 0232S | 6647 | 95.2 | 11.28DDfootnotemark: | ||
| NGC 0232N | 6647 | 95.2 | 10.93DDfootnotemark: | ||
| MCG +12-02-001 | 4706 | 69.8 | 11.50 | ||
| IC 1623AB | 6016 | 85.5 | 11.71 | ||
| MCG -03-04-014 | 10040 | 144 | 11.65 | ||
| CGCG 436-030 | 9362 | 134 | 11.69 | ||
| IRAS F01417+1651 | 8375 | 119 | 11.64 | ||
| NGC 0695 | 9735 | 139 | 11.68 | ||
| UGC 01385 | 5621 | 79.8 | 11.05 | ||
| UGC 01845 | 4679 | 67 | 11.12 | ||
| NGC 0992 | 4141 | 58 | 11.07 | ||
| UGC 02238 | 6560 | 92.4 | 11.33 | ||
| IRAS F02437+2122 | 6987 | 98.8 | 11.16 | ||
| UGC 02369 | 9558 | 136 | 11.67 | ||
| UGC 02608 | 6998 | 100 | 11.41 | ||
| NGC 1275 | 5264 | 75 | 11.26 | ||
| IRAS F03359+1523 | 10613 | 152 | 11.55 | ||
| CGCG 465-012N | 6662 | 94.3 | 10.54DDfootnotemark: | ||
| CGCG 465-012S | 6662 | 94.3 | 11.09DDfootnotemark: | ||
| IRAS 03582+6012 | 8997 | 131 | 11.43 | ||
| IRAS 04271+3849 | 5640 | 80.8 | 11.11 | ||
| NGC 1797F | 4441 | 63.4 | 9.20XXfootnotemark: | ||
| NGC 1797 | 4441 | 63.4 | 11.03XXfootnotemark: | ||
| CGCG 468-002S | 5454 | 77.9 | 10.92DDfootnotemark: | ||
| CGCG 468-002N | 5454 | 77.9 | 10.92DDfootnotemark: | ||
| IRAS 05083+2441 | 6915 | 99.2 | 11.26 | ||
| IRAS 05129+5128 | 8224 | 120 | 11.42 | ||
| IRAS F05187-1017 | 8474 | 122 | 11.3 | ||
| IRAS 05223+1908 | 8867 | 128 | 11.65 | ||
| MCG +08-11-002 | 5743 | 83.7 | 11.46 | ||
| UGC 03351 | 4455 | 65.8 | 11.28 | ||
| IRAS 05442+1732 | 5582 | 80.5 | 11.30 | ||
| UGC 03410N | 3921 | 59.7 | 10.29DDfootnotemark: | ||
| UGC 03410S | 3921 | 59.7 | 11.03DDfootnotemark: | ||
| IRAS 07251-0248 | 26249 | 400 | 12.39 | ||
| NGC 2623 | 5549 | 84.1 | 11.60 | ||
| IRAS F09111-1007W | 16231 | 246 | 11.86DDfootnotemark: | ||
| IRAS F09111-1007E | 16231 | 246 | 11.62DDfootnotemark: | ||
| UGC 05101 | 11802 | 177 | 12.01 | ||
| MCG +08-18-013S | 7777 | 117 | 9.93HHfootnotemark: | ||
| MCG +08-18-013N | 7777 | 117 | 11.32HHfootnotemark: | ||
| IRAS F10173+0828 | 14716 | 224 | 11.86XXfootnotemark: | ||
| IRAS F10173+0828F | 14716 | 224 | 9.60XXfootnotemark: | ||
| CGCG 011-076F | 7464 | 117 | 10.02HHfootnotemark: | ||
| CGCG 011-076 | 7464 | 117 | 11.41HHfootnotemark: | ||
| IC 2810W | 10192 | 157 | 11.45HHfootnotemark: | ||
| IC 2810E | 10192 | 157 | 11.20HHfootnotemark: | ||
| NGC 4194 | 2501 | 43 | 11.10 | ||
| IRAS F12224-0624 | 7902 | 125 | 11.36 | ||
| NGC 4418 | 2179 | 36.5 | 11.19XXfootnotemark: | ||
| NGC 4418F | 2179 | 36.5 | 8.59XXfootnotemark: | ||
| Mrk 231 | 12642 | 192 | 12.57 | ||
| UGC 08387 | 6985 | 110 | 11.73 | ||
| Mrk 273 | 11326 | 173 | 12.21 | ||
| CGCG 247-020 | 7716 | 120 | 11.39 | ||
| IRAS F14348-1447 | 24802 | 387 | 12.39 | ||
| CGCG 049-057 | 3897 | 65.4 | 11.35 | ||
| Arp 220 | 5434 | 87.9 | 12.28 | ||
| IRAS F17207-0014 | 12834 | 198 | 12.46 | ||
| UGC 11041 | 4881 | 77.5 | 11.11 | ||
| CGCG 141-034 | 5944 | 93.4 | 11.20 | ||
| CGCG 142-034S | 5599 | 88.1 | 10.64DDfootnotemark: | ||
| CGCG 142-034N | 5599 | 88.1 | 11.03DDfootnotemark: | ||
| MCG +04-48-002S | 4167 | 64.2 | 10.68XXfootnotemark: | ||
| MCG +04-48-002N | 4167 | 64.2 | 11.06XXfootnotemark: | ||
| IRAS 20351+2521 | 10102 | 151 | 11.61 | ||
| CGCG 448-020 | 10822 | 161 | 11.94 | ||
| ESO 602-G025 | 7507 | 110 | 11.34 | ||
| UGC 12150 | 6413 | 93.5 | 11.35 | ||
| IC 5298 | 8221 | 119 | 11.60 | ||
| NGC 7752S | 5120 | 73.6 | 11.07DDfootnotemark: | ||
| NGC 7752N | 5120 | 73.6 | 11.07DDfootnotemark: | ||
| NGC 7771N | 4277 | 61.2 | 10.74DDfootnotemark: | ||
| NGC 7771S2 | 4277 | 61.2 | 10.67DDfootnotemark: | ||
| NGC 7771S1 | 4277 | 61.2 | 11.17DDfootnotemark: | ||
| Mrk 331 | 5541 | 79.3 | 11.50 |
Note. — Col. (1): The galaxy name. The interacting galaxies are labeled by “N”, “E”, “S”, and “W” in pair galaxies. Col. (2), (3): The observing coordinates, which is the brightest position in image from MIPS/Spitzer. Col. (4), (5), and (6): The heliocentric velocity of galaxies, the luminosity distance, and the IR luminosity taken from Armus et al. (2009), who calculate the IR luminosity using four the IRAS bands from 12 m to 100 m and the derivation in Sanders & Mirabel (1996). For resolved galaxies, the individual IR luminosities are shown, which are taken from Howell et al. (2010) (H) and Díaz-Santos et al. (2010) (D), or this work (X) (see text for details).
| Galaxies | Backend | (ref) | ||||||
|---|---|---|---|---|---|---|---|---|
| (km s-1) | (km s-1) | (K km s-1) | (Jy km s-1) | (Jy km s-1) | () | () | ||
| (1) | (2) | (3) | (4) | (5) | (6) | (7) | (8) | (9) |
| NGC0034S | SAM45 | 420 | 293 | |||||
| NGC0034N | SAM45 | 200 | 166 | |||||
| MCG-02-01-051 | AOS | 320 | 277 | |||||
| NGC0232S | SAM45 | 680 | 436 | |||||
| NGC0232N | SAM45 | 600 | 373 | |||||
| MCG+12-02-001 | SAM45 | 395 | 178 | |||||
| IC1623AB | SAM45 | 580 | 307 | 493.5ccfootnotemark: | ||||
| MCG-03-04-014 | AOS | |||||||
| CGCG436-030 | AOS | 240 | 206 | |||||
| IRASF01417+1651 | SAM45 | 340 | 272 | 63.0ccfootnotemark: | ||||
| NGC0695 | AOS | 360 | 250 | 199.9bbfootnotemark: | ||||
| UGC01385 | AOS | 240 | 103 | |||||
| UGC01845 | SAM45 | 600 | 458 | |||||
| NGC0992 | AOS | 400 | 187 | 207.9ccfootnotemark: | ||||
| UGC02238 | AOS | 440 | 382 | 210.0ccfootnotemark: | ||||
| IRASF02437+2122 | SAM45 | 640 | 235 | |||||
| UGC02369 | AOS | 220 | 173 | |||||
| UGC02608 | SAM45 | 420 | 223 | |||||
| NGC1275* | AC45 | 680 | 538 | 35.7bbfootnotemark: | ||||
| IRASF03359+1523 | SAM45 | 500 | 318 | 133.0ccfootnotemark: | ||||
| CGCG465-012N | AOS | 320 | 148 | |||||
| CGCG465-012S | AOS | 300 | 136 | |||||
| IRAS03582+6012 | AOS | 520 | 211 | |||||
| IRAS04271+3849 | AC45 | 520 | 255 | |||||
| NGC1797F | SAM45 | |||||||
| NGC1797 | SAM45 | 370 | 257 | |||||
| CGCG468-002S | SAM45 | |||||||
| CGCG468-002N | AC45 | |||||||
| IRAS05083+2441S | SAM45 | 320 | 389 | |||||
| IRAS05129+5128 | SAM45 | 300 | 361 | |||||
| IRASF05187-1017 | SAM45 | 685 | 515 | |||||
| IRAS05223+1908 | SAM45 | |||||||
| MCG+08-11-002 | AC45 | 500 | 378 | |||||
| UGC03351 | AC45 | 700 | 334 | |||||
| IRAS05442+1732 | AOS | 340 | 226 | |||||
| UGC03410N | SAM45 | 665 | 586 | |||||
| UGC03410S | SAM45 | 480 | 344 | |||||
| IRAS07251-0248 | SAM45 | 340 | 293 | |||||
| NGC2623 | SAM45 | 500 | 230 | 161.3bbfootnotemark: | ||||
| IRASF09111-1007W | SAM45 | 390 | 303 | |||||
| IRASF09111-1007E | SAM45 | 635 | 596 | |||||
| UGC05101* | SAM45 | 930 | 839 | 75.5aafootnotemark: | ||||
| MCG+08-18-013S | SAM45 | |||||||
| MCG+08-18-013N | SAM45 | 180 | 216 | |||||
| IRASF10173+0828 | SAM45 | 390 | 346 | 63.0ccfootnotemark: | ||||
| IRASF10173+0828F | SAM45 | |||||||
| CGCG011-076F | SAM45 | 390 | 286 | |||||
| CGCG011-076 | SAM45 | 480 | 389 | |||||
| IC2810W | SAM45 | 505 | 460 | 101.5ccfootnotemark: | ||||
| IC2810E | SAM45 | 605 | 354 | |||||
| NGC4194 | SAM45 | 410 | 184 | 143.5ccfootnotemark: | ||||
| IRASF12224-0624 | SAM45 | 210 | 142 | |||||
| NGC4418 | SAM45 | 410 | 120 | 164.5ccfootnotemark: | ||||
| NGC4418F | SAM45 | 400 | 210 | |||||
| Mrk231* | SAM45 | 815 | 194 | 56.0ccfootnotemark: | ||||
| UGC08387 | SAM45 | 475 | 369 | 177.2bbfootnotemark: | ||||
| Mrk273 | SAM45 | 675 | 591 | 80.5ccfootnotemark: | ||||
| CGCG247-020 | SAM45 | 235 | 88 | |||||
| IRASF14348-1447 | SAM45 | 410 | 280 | 59.5ccfootnotemark: | ||||
| CGCG049-057 | SAM45 | 465 | 288 | 119.0ccfootnotemark: | ||||
| Arp220 | SAM45 | 760 | 468 | 329.0ccfootnotemark: | ||||
| IRASF17207-0014 | SAM45 | 212.7aafootnotemark: | ||||||
| UGC11041 | AOS | 280 | 106 | |||||
| CGCG141-034 | AOS | |||||||
| CGCG142-034S | AOS | |||||||
| CGCG142-034N | AC45 | |||||||
| MCG+04-48-002S* | SAM45 | 780 | 651 | 187.5aafootnotemark: | ||||
| MCG+04-48-002N | SAM45 | 600 | 402 | |||||
| IRAS20351+2521 | AOS | 250 | 96 | |||||
| CGCG448-020 | AOS | 440 | 104 | |||||
| ESO602-G025 | AOS | 500 | 180 | |||||
| UGC12150 | SAM45 | 650 | 364 | |||||
| IC5298 | SAM45 | 519 | 281 | 84.0ccfootnotemark: | ||||
| NGC7752S | SAM45 | 360 | 260 | |||||
| NGC7752N | SAM45 | 860 | 563 | |||||
| NGC7771N | SAM45 | 340 | 136 | |||||
| NGC7771S2 | SAM45 | 320 | 153 | |||||
| NGC7771S1 | SAM45 | 720 | 239 | 380.5bbfootnotemark: | ||||
| Mrk331* | SAM45 | 475 | 80 | 346.4aafootnotemark: |
Note. — Col. (1): Galaxy name. Col. (2): Spectrometer used in our CO observation. Col. (3): Full velocity width at zero intensity of the CO emission line. Col. (4): Full velocity width at half maximum of the CO line. Col. (5): CO intensity on the temperature scale of . Col. (6): CO flux. A conversion factor from K to Jy is 2.45 JyK()-1. Col. (7): CO flux in the literature (a = GS04, b = Young et al. (1995), and c = SSS91). Conversion factors from K to Jy are 4.95 JyK()-1, 42 JyK()-1, and 35 JyK()-1 for the IRAM 30 m telescope, FCRAO 14 m telescope (Young et al., 1995), and NRAO 12 m telescope (the NRAO 12 m User’s Manual 1990 edition, Fig. 14.), respectively. For 14 m observations in the scale, 3.15 JyK() is used assuming . Col. (8): CO luminosity, Col. (9): Molecular gas mass calculated with the (Papadopoulos et al., 2012). The asterisk denotes the objects with the additional information about the uncertain CO flux or the line profile in Appendix C.
| Galaxies | A: Gaussian | B: Exponential | C: Uniform disk | Literature | ||||||
|---|---|---|---|---|---|---|---|---|---|---|
| (′′) | (kpc) | (′′) | (kpc) | (′′) | (kpc) | (′′) | ||||
| (1) | (2) | (3) | (4) | (5) | (6) | (7) | (8) | (9) | ||
| IC1623AB | 0.847 | 4a,1a,1footnotemark: , 7.54d,2d,2footnotemark: | ||||||||
| IRASF01417+1651 | 0.912 | |||||||||
| NGC0695 | ||||||||||
| NGC0992 | 0.842 | |||||||||
| UGC02238 | 0.621 | 6.0j,3j,3footnotemark: | ||||||||
| IRASF03359+1523 | 0.522 | |||||||||
| NGC2623 | 0.596 | 0.90.75g,4g,4footnotemark: , 1.34j,3j,3footnotemark: | ||||||||
| IRASF10173+0828 | 0.648 | c,5c,5footnotemark: | ||||||||
| IC2810W | 0.383 | |||||||||
| NGC4194 | 2.11.25h,6h,6footnotemark: , 7.7j,3j,3footnotemark: | |||||||||
| NGC4418 | 0.721 | 0.35i,7i,7footnotemark: | ||||||||
| UGC08387 | 2.54j,8j,8footnotemark: , 1.36f,9f,9footnotemark: | |||||||||
| Mrk273 | 0.745 | 3.451.7e,10e,10footnotemark: , e,11e,11footnotemark: , 0.58f,9f,9footnotemark: | ||||||||
| IRASF14348-1447 | 0.629 | k,5k,5footnotemark: | ||||||||
| CGCG049-057 | c,5c,5footnotemark: | |||||||||
| Arp220 | 0.630 | 0.70.95b,11b,11footnotemark: , 3.52.5b,10b,10footnotemark: , 1.4f,9f,9footnotemark: | ||||||||
| IRASF17207-0014 | c,5c,5footnotemark: , 0.7f,12f,12footnotemark: | |||||||||
| MCG+04-48-002S | 0.198 | |||||||||
| IC5298 | 0.759 | |||||||||
| NGC7771S1* | 0.850 | |||||||||
| Mrk331* | 0.130 | |||||||||
| Average | 0.627 | 6.59 | 3.78 | 2.69 | 1.51 | 9.81 | 5.73 | |||
| Median | 0.639 | 5.66 | 2.63 | 2.14 | 1.00 | 8.89 | 4.12 | |||
| Minimum | 0.130 | 2.34 | 0.83 | 0.82 | 0.31 | 3.91 | 1.33 | |||
| Maxmum | 0.912 | 19.4 | 10.8 | 9.21 | 4.11 | 25.0 | 17.0 | |||
Note. — The CO radius is estimated from flux ratio between two observations with different telescopes. The galaxies with are listed. If for those with , their are listed and are used to estimate the upper limit of . The columns are (1): the galaxy name. (2): the flux ratio between our observation and the literature. (3), (4): the CO size and in the Gaussian model (Model A). (5), (6): the CO size and in the azimuthally symmetric exponential model (Model B). (7), (8): the CO size and in the uniform disk model (Model C). (9): the CO radius measured with interferometers. The alphabetical superscript represents the literature: a = Scoville et al. (1989), b = Scoville et al. (1991), c = Planesas et al. (1991), d = Yun et al. (1994), e = Yun & Scoville (1995), f = Downes & Solomon (1998), g = Bryant & Scoville (1999), h = Aalto & Hüttemeister (2000), i = Costagliola et al. (2013), j = Ueda et al. (2014), k = Evans et al. (2000). The notes for each interferometric radius is given as the superscript number: 1 = deconvolved source size, double sources, 2 = deconvolved source size, bar structure, 3 = CO(2-1), radius enclosing 80 % of the total flux, 4 = deconvolved core size, 5 = unresolved source, HWHM, 6 = extended component enclosing 33 % of the total flux, HWHM, 7 = CO(2-1), HWHM on circle-average Gaussian in the visibility, 8 = CO(3-2), radius enclosing 80 % of the total flux, 9 = CO(2-1), nuclear disk component, HWHM in Gaussian model fit, 10 = extended component, deconvolved radius, 11 = core component, deconvolved radius, 12 = HWHM in Gaussian model fit. The symbols of ‘’ and ‘’ indicate the upper or lower limit, respectively. The colon represents the large error more than 100 %. The asterisk of NGC 7771S1 and Mrk 331 means the model uncertainty and the uncertain CO fluxes, respectively. See the note in Section C. The statistics is also shown in the lower part except those with the upper/lower limit value.
| Galaxies | R.A.(J2000) | Dec.(J2000) | Deconvolved HWHM | Deconvolved HWHM | |
|---|---|---|---|---|---|
| (Mpc) | (arcsec) | (kpc) | |||
| (1) | (2) | (3) | (4) | (5) | (6) |
| CGCG011-076 | 117 | 10.6 | 6.03 | ||
| CGCG052-037 | 116 | 10.2 | 5.74 | ||
| MCG-02-33-098 | 78.7 | ||||
| NGC5653 | 60.2 | 24.1 | 7.03 | ||
| NGC5990 | 64.4 | 3.33 | 1.04 | ||
| IC0563N | 92.9 | 8.69 | 3.91 | ||
| UGC03351 | 65.8 | 14.9 | 4.74 |
Note. — Col. (1): Name of galaxies whose CO size are measured from the mapping observations. Col. (2), (3): The source coordinates. Col. (4): The luminosity distance taken from Armus et al. (2009). Col. (5), (6): Deconvolved HWHMs in arcsec and kpc scale. See Appendix B for details. The symbol of ‘’ indicates the upper limit.