Using forces to accelerate first-principles anharmonic vibrational calculations
Abstract
High-level vibrational calculations have been used to investigate anharmonicity in a wide variety of materials using density-functional-theory (DFT) methods. We have developed a new and efficient approach for describing strongly-anharmonic systems using a vibrational self-consistent-field (VSCF) method. By far the most computationally expensive part of the calculations is the mapping of an accurate Born-Oppenheimer (BO) energy surface within the region of interest. Here we present an improved method which reduces the computational cost of the mapping. In this approach we use data from a set of energy calculations for different vibrational distortions of the materials and the corresponding forces on the atoms. Results using both energies and forces are presented for the test cases of the hydrogen molecule, solid hydrogen under high pressure including mapping of two-dimensional subspaces of the BO surface, and the bcc phases of the metals Li and Zr. The use of forces data speeds up the anharmonic calculations by up to 40%.
I Introduction
Developing an accurate theoretical model for crystalline solids requires going beyond the static lattice model and including the effects of atomic vibrations. Usually this is achieved within the harmonicWallace (1972); Maradudin et al. (1971) or quasiharmonic approximations - the latter includes thermal expansion by making the phonon frequencies volume dependentPavone et al. (1993); Baroni et al. (2001). In many materials and situations these approximations work very well. However, they may be inaccurate if the vibrational amplitudes are large. Large amplitudes may occur, for example, in materials that contain light elements, materials close to a structural instability, or at high temperatures. Under such conditions it may be necessary to include anharmonic vibrations in the model. The mean-field vibrational-self-consistent-field (VSCF) method proposed by Monserrat, Drummond and NeedsMonserrat et al. (2013) provides a sophisticated approach for computing the anharmonic vibrational wavefunction and energy of crystalline solids from first principles. This approach has been applied successfully in several systemsMonserrat et al. (2014a, b); Drummond et al. (2015); Engel et al. (2016); Prentice et al. (2017).
Within the Born-Oppenheimer (BO) approximationBorn and Oppenheimer (1927) the electronic and nuclear motion can be separated, giving two coupled Schrödinger equations. Application of the VSCF method consists of two main tasks - mapping of the BO energy surface (the “energy landscape”) that the nuclei move through, and self-consistently solving the VSCF equations for the anharmonic vibrational wavefunction and energy. Of these two tasks, the former is by far the most expensive, as it is usually accomplished by performing a large number of single-point density-functional-theory (DFT) calculations and fitting a functional form to the calculated energies. To ensure that the fitted form of the BO surface is accurate, it is necessary to converge the solution of the VSCF equations with respect to the number of mapping points used. Reducing the required number of mapping points reduces the computational cost of mapping the BO surface. The development of a method for increasing the accuracy of the fit for a given number of mapping points would help in reaching this goal.
Here we propose a scheme for improving the accuracy of the fitted functional form of the BO surface by making use of the force data generated by the DFT calculations in addition to the total electronic energy. Accurate forces are readily available within plane-wave basis DFTPayne et al. (1992). The gradient of the BO surface at each mapping point can be obtained from the forces, which provides additional data that can be used in the fitting process and therefore provides a better fit with negligible additional cost. We have investigated the effectiveness and cost of the VSCF method with forces (VSCF+f) and without forces (VSCF) for several systems in which anharmonicity is expected to play an important role - the hydrogen molecule, solid hydrogen at 100 GPa, and the bcc phases of lithium and zirconium, which exhibit soft modes. The effect of including both 1-D and 2-D subspaces of the BO surface in the calculations for solid hydrogen, corresponding to including coupling between anharmonic phonons, is also considered.
As the lightest element, hydrogen is an excellent test case for the VSCF+f method, as its vibrations have strong anharmonic character, even at low temperatures. Several ab initio studies of high pressure phases of hydrogen, with and without anharmonic effects, have been conducted recently to determine the stable structure of the high pressure phases III and IVPickard et al. (2012); Chen et al. (2014); Pickard and Needs (2007); Johnson and Ashcroft (2000). In particular, we use as test cases three structures from previous work, labelled by their space group and number of atoms in the primitive unit cell: Cmca-4, Cmca-12 and C2/c-24. These are molecular phases arranged in layers; the C2/c-24 phase is a candidate for phase III of hydrogenPickard and Needs (2007). Previous work has shown that anharmonicity has a significant effect on the vibrational energy of these structuresBorinaga et al. (2016); Monserrat et al. (2016). The strongly anharmonic character of the nuclear vibrations in hydrogen also implies that anharmonic effects that cannot be described by simple 1-D mapping of the BO surface could be significant. This provides an opportunity to test the ability of the VSCF+f method to reduce the computational cost of calculations including the mapping of 2-D subspaces of the BO surface. The mapping of 2-D subspaces is expensive in general, and therefore we have chosen the phase of solid hydrogen with the fewest atoms in its unit cell, Cmca-4, as a test case for applying our improved method to mappings of 2-D subspaces of the BO surface.
Lithium and zirconium both have body-centered cubic (bcc) phases that are unstable at 0 K, and are stabilised at finite temperatures. This property is shared with other elements such as titanium and hafnium. In the case of Li, the structure at zero temperature is a close-packed R9 structure, with the phase transition to bcc occurring at around KHellman et al. (2011); Overhauser (1984); Schaeffer et al. (2015). Zirconium, on the other hand, has an hexagonal hcp structure at room temperature, with the transition to bcc occurring at around KGrimvall et al. (2012). In both materials, the bcc phase is unstable at low temperatures due to the presence of soft modes, which are dynamically stabilised at higher temperatures. Soft modes inherently have strong anharmonic character, and an accurate description of anharmonicity is required to treat these modes and the phase transition to the bcc structure. Several first principles vibrational studies including anharmonicity have been reported for Li, Zr and other similar elementsAntolin et al. (2012); Grimvall et al. (2012); Hellman et al. (2011); Souvatzis et al. (2008); Petry et al. (1991); Heiming et al. (1991); Trampenau et al. (1991). The well-known presence of significant anharmonic effects in the bcc phase of these materials makes them suitable test cases for the VSCF+f method.
The rest of this work is organised as follows: In Sec. II we outline the VSCF method and describe our implementation of it. In Sec. III we describe the improved VSCF+f method and the testing of it, which is the focus of the rest of this work. In Sec. IV we compare results calculated using the VSCF+f and standard VSCF methods. Applications to molecular and high pressure solid hydrogen are reported in Sec. IV.A, mappings of 2-D subspaces of the BO surface in the Cmca-4 hydrogen phase in Sec. IV.B, and the bcc phases of Li and Zr in Sec. IV.C. Finally, in Sec. V we summarise our results. All equations are in Hartree atomic units, with .
II The VSCF method
We work within the BO approximation in which the electronic and nuclear motions are separated out, which leads to the vibrational equationMonserrat et al. (2013)
| (1) | |||
where and label unit cells in the system and atoms within a unit cell respectively, with the mass of the th atom. is a collective vector of all the nuclear positions, is the vibrational wavefunction, and is the vibrational energy of the system. The electronic energy for a given , , acts as the potential in the vibrational Hamiltonian , and is generally known as the BO surfaceMonserrat et al. (2013).
Typically, this equation is solved approximately using the harmonic approximation by expanding up to quadratic order in the displacement co-ordinates . Here, and are, respectively, the displaced and equilibrium nuclear positions. We calculate the harmonic potential by determining the matrix of force constants , using a finite differences methodKunc and Martin (1982), and transforming to reciprocal space to give the dynamical matrix:
| (2) |
is the position vector of the th unit cell, is the number of unit cells in the system, and run over the Cartesian directions. The eigenvectors, , and eigenvalues, , of can then be found, with labelling the phonon branch indexMonserrat et al. (2013).
is then re-expressed in terms of harmonic normal or phonon co-ordinates given by:
| (3) |
Within the harmonic approximation, this gives a set of non-interacting simple harmonic oscillators of frequencies . In the VSCF method, the principal axes approximationJung and Gerber (1996) is used to include anharmonic effects. Assuming that anharmonicity is a perturbation to the harmonic approximation, and therefore a description of the BO surface in terms of many 1-D subspaces is a good approximation, we expand the BO surface as a series of -D subspaces, using a basis given by the harmonic normal modes, Monserrat et al. (2013):
| (4) | ||||
is a collective mapping amplitude vector. The re-expression of allows the mapping of the BO surface along the directions corresponding to the harmonic phonons and builds up an expression for , by means that will be discussed below. With this expression in hand, the energy can be minimised, using a Hartree product of 1-D states as a trial wavefunction. Solving the resulting VSCF equations gives a set of anharmonic vibrational eigenstates, with their associated energy eigenvalues and wavefunctionsMonserrat et al. (2013); Bowman (1978). A perturbation theory can be constructed on these states, providing a further correction to the energy, and a partition function can be constructed, allowing the anharmonic free energy to be calculated at any finite temperatureMonserrat et al. (2013).
III Improvements to the VSCF method
In order to solve the VSCF equations we require the form of . In previous work using this method, this is typically obtained using DFT to calculate for various values of (i.e., various sets of atomic positions), and then fitting a functional form to these DFT energy resultsMonserrat et al. (2014a); Engel et al. (2016); Prentice et al. (2017). To find the form of the 1-D terms , calculations are performed at several mapping points along the direction given by the appropriate harmonic phonon; to find the form of the 2-D terms , calculations must be done at points on a grid, and so on. However, these calculations rapidly become computationally expensive as we include more terms in the expansion of the BO surface, and therefore an increasingly large number of calculations is required. This restricts us to including very few or none of the 2-D or higher dimensional terms for all but the smallest systems.
Even when 2-D and higher terms are neglected, the mapping of the BO surface is by far the most computationally expensive part of using the VSCF method. In order to obtain an accurate fit to the BO surface, and therefore an accurate solution to the VSCF equations, it is necessary to converge the anharmonic correction to the energy, , with respect to the number of mapping points used per mapping direction, which introduces further computational expense. Reducing the computational cost of the mapping is therefore extremely desirable in order to speed up the calculations. One way to reduce this cost would be to try and reduce the number of mapping points required to reach convergence, by utilising information other than the energy from the DFT calculations, such as the calculated forces on the atoms.
The gradient of the BO surface at a given value of can be calculated from the forces on the atoms in the corresponding atomic configuration
| (5) |
where is the force on the atom labelled by in Cartesian direction . Information about the forces can then be fed into the fitting procedure, which then increases the accuracy of the fit. In previous work, the DFT energy values have typically been fitted using a cubic splineMonserrat et al. (2013). In this work we investigate using cubic and quintic splines in the fitting procedure, to see whether either generally produces a more accurate fit. Utilising a seventh order (heptic) spline was also tested, but this approach suffered from overfitting and performed significantly worse than the cubic and quintic splines. For this reason, heptic splines will not be discussed further in this work.
Utilising forces to improve the mapping of the 1-D terms in the expansion of the BO surface in equation (4) is a simple extension of the usual splining procedure, but the task becomes more complex when trying to improve the mapping of the higher dimensional terms. The only higher dimensional terms considered here are 2-D. A functional form for the BO surface is found by using a series of 1-D splines along one direction, with the co-ordinate , and then using the results to fit a spline along the second direction, with the co-ordinate . Typically this would require knowledge of the cross derivative at each sampling pointPress et al. (1992). We avoid this requirement by using a simple cubic spline to obtain the form of the function . This represents the gradient along the direction defined by as a function of , for a fixed value of . Obtaining this function allows forces to be used in the fit along . To ensure the accuracy of the calculations including 2-D terms, we converge the correction to the anharmonic vibrational energy due to these terms, , with respect to the number of mapping points used per direction.
Although including the force data in the fitting process should reduce the number of calculations required to obtain convergence, the accuracy of the forces themselves must be considered. If a variational method is used to minimise the total energy in the DFT calculations, the energy itself will be correct to second order errors in the charge density. However, the error in the forces is instead linear with the error in the charge density Payne et al. (1992), and calculations must be converged to within a strict tolerance to obtain accurate forces. This requirement could potentially cancel out the reduction in computational cost gained by reducing the number of mapping points if the convergence tolerance is too strict, and our results include tests to determine whether this is true or not. These tests showed that this issue did not negatively affect the speed-up obtainable with the VSCF+f method, with both methods breaking down at the same level of energy convergence.
IV Results
All DFT calculations were performed using version 8.0 of the plane-wave DFT code CASTEPClark et al. (2005) and ultrasoft pseudopotentialsVanderbilt (1990) generated ‘on-the-fly’. Throughout, the ratio between the fast Fourier transform (FFT) grid used for the electronic density and that used for the Kohn-Sham states (the ‘grid scale’ parameter in CASTEP) is . The local density approximation (LDA) was used for the exchange-correlation functional in the hydrogen calculationsKohn et al. (1996), while the PBE functional was used for lithium and zirconiumPerdew et al. (1996). Previous work on solid hydrogen has shown that, while the exact quantitative results of DFT calculations are strongly dependent on the choice of functional, the qualitative results are similar for most functionalsAzadi and Foulkes (2013), and that the LDA is a reasonable choice for the purpose of tests on solid hydrogen. The PBE functional has been used successfully in several previous studies of lithium, zirconium and other similar materialsHellman et al. (2011); Souvatzis et al. (2008). Calculations of the harmonic normal modes and energy were performed by determining the matrix of force constants via a finite differences methodKunc and Martin (1982), before diagonalization of the dynamical matrix. Atomic displacements of 0.01 bohr were used.
IV.1 Hydrogen
As the lightest element, hydrogen is a good material in which to test the VSCF+f method. Its vibrational motions explore the BO surface out to large amplitudes due to its low mass, which introduces significant anharmonic character. The method was first applied to molecular hydrogen before moving onto solid hydrogen at 100 GPa. All hydrogen calculations were performed at zero temperature and only the zero-point energy was considered.
A plane-wave cut-off energy of 800 eV was used for the calculations on molecular hydrogen, with a Monkhorst-Pack -point gridMonkhorst and Pack (1976). As CASTEP uses periodic boundary conditions, it is necessary to make the unit cell large enough to prevent the molecule from interacting with its periodic images. The frequencies of the harmonic phonon modes were converged with respect to the size of the cubic unit cell, resulting in a converged lattice constant of 8 Å. The distance between the atoms was allowed to relax, using the Broyden-Fletcher-Goldfarb-Shanno (BFGS) methodNocedal and Wright (2006) to converge the forces on the atoms to within eV , before single-point energy calculations were conducted.
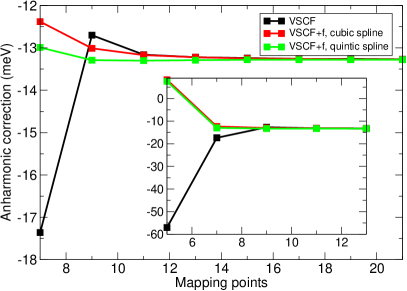
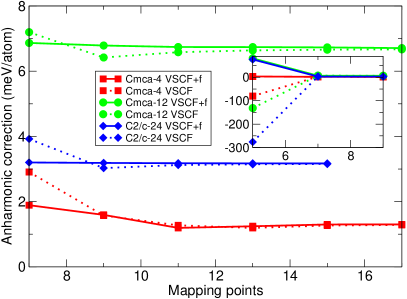
Once the harmonic calculations were completed, a range of different numbers of mapping points per direction from 7 to 27 were used to map the BO surface of the hydrogen molecule. The performance of the basic VSCF method was compared to the VSCF+f method using both cubic and quintic splines in the fitting process. This was repeated with the energy convergence tolerance of the calculations set to and eV per SCF cycle, to test whether this affected the accuracy of the forces, and therefore the accuracy of the VSCF+f fitting relative to the normal fitting procedure. Fig. 1 shows the convergence of the anharmonic correction to the zero point energy, , with respect to the number of mapping points for the three different methods. Here the energy convergence tolerance was set to eV per SCF cycle. It can be seen that including the forces in the fitting process significantly improves the convergence of , with the quintic spline fit performing even better than the cubic spline. This suggests that including forces in the fitting process can significantly improve the efficiency of the VSCF method, and that utilising a quintic spline allows fitting of the BO surface even more accurately for the same number of DFT calculations, especially for low numbers of mapping points. An almost identical set of results was found for energy convergence tolerances from eV up to eV per SCF cycle, with the VSCF+f method converging more rapidly with the number of mapping points. For an energy convergence tolerance of eV per SCF cycle, both the VSCF and VSCF+f methods failed to converge with less than 27 mapping points per direction. This shows that for a range of energy convergence tolerances, the VSCF+f fitting method is still able to outperform the basic VSCF method and map the BO surface accurately at a lower computational cost. Using a quintic spline improves the quality of the fit still further.
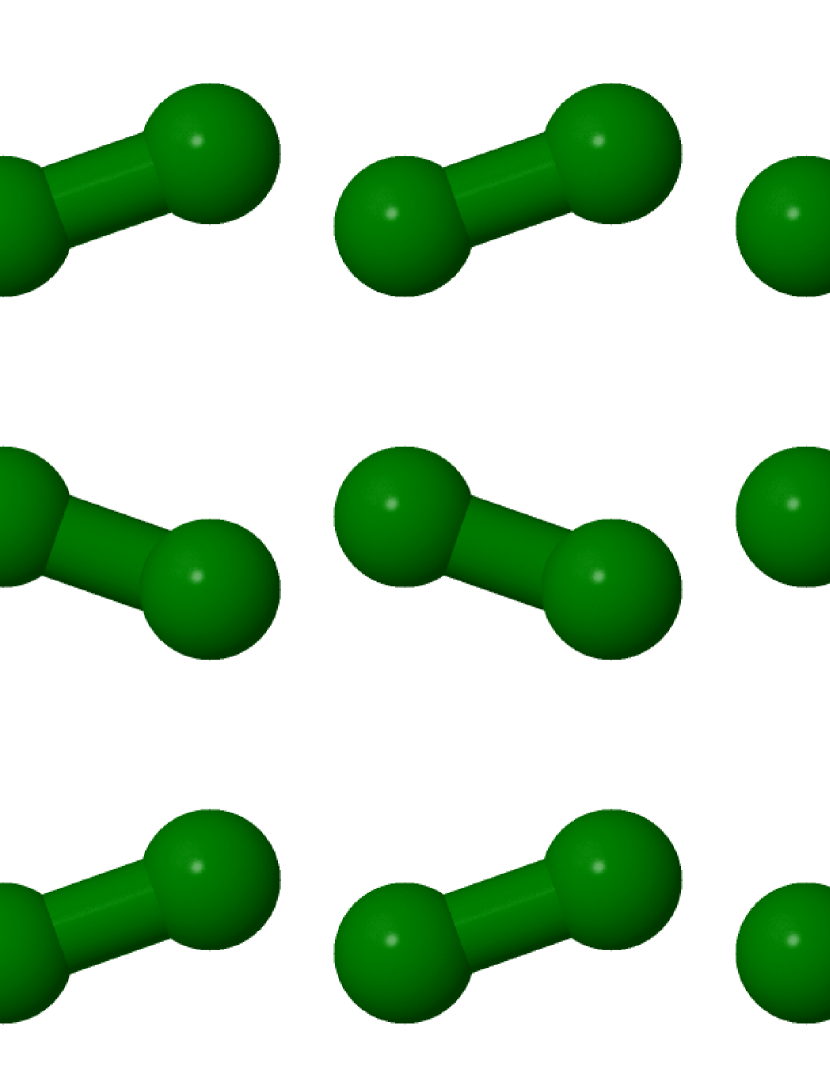
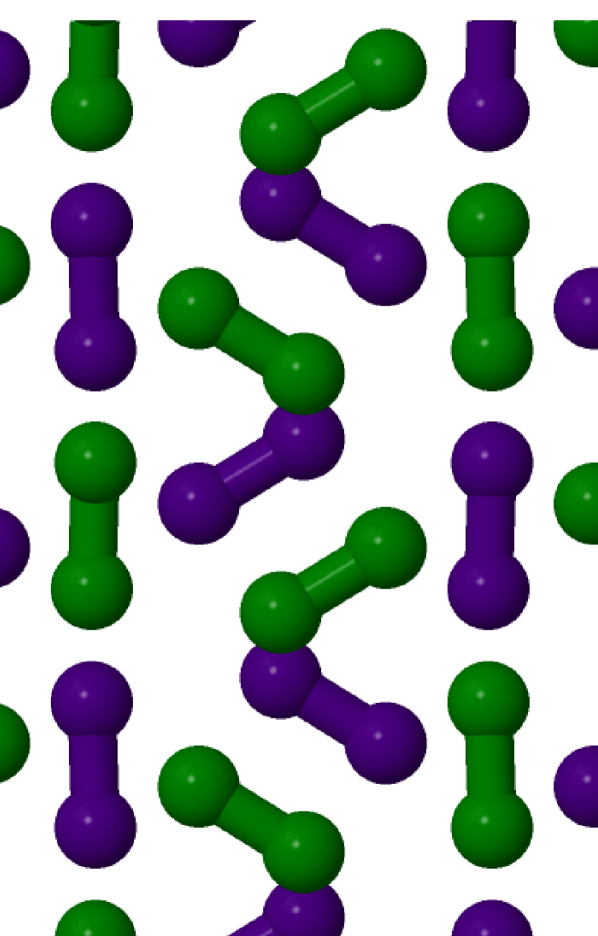
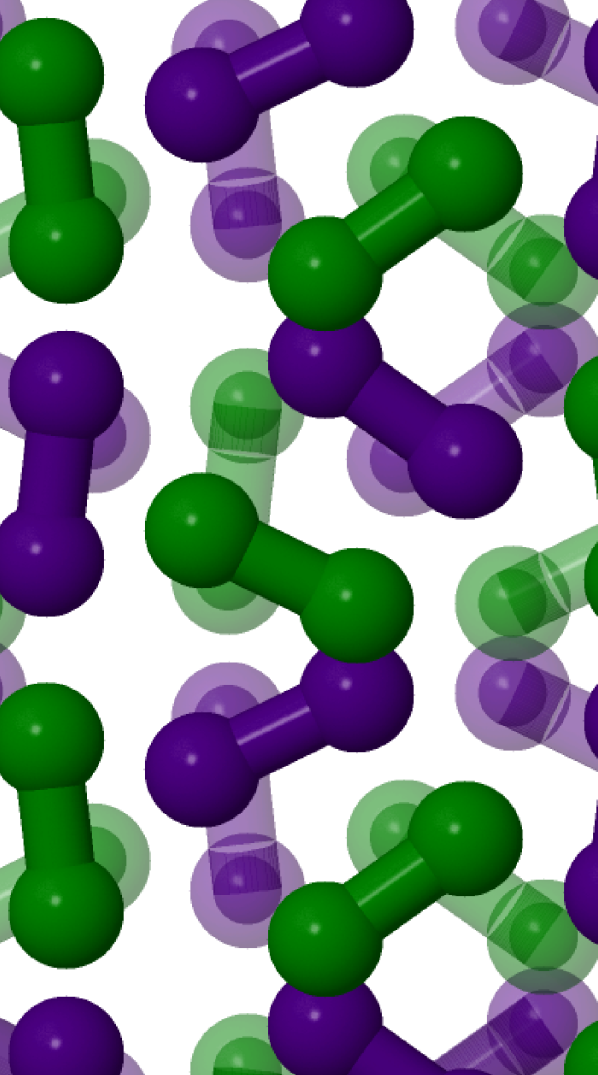
With the results from the hydrogen molecule in mind, we turn our attention to the case of high pressure solid hydrogen. Three different structures of solid hydrogen were considered at a pressure of 100 GPa - Cmca-4, Cmca-12 and C2/c-24, as previously described. Fig. 2 gives a view of these three structures, showing that they are molecular in nature. These structures have all been studied previously with DFT over a range of pressuresPickard et al. (2012). Again, once harmonic calculations were completed, the covergence of the anharmonic correction to the zero point energy per atom with respect to the number of mapping points was calculated for a single unit cell of each structure. An plane-wave cut-off energy of 1000 eV and an energy convergence tolerance of eV per SCF cycle was used throughout, with Monkhorst-Pack grids of size , and for the Cmca-4, Cmca-12 and C2/c-24 structures respectively. Fig. 3 shows the convergence of per atom for all three structures for the basic VSCF and the improved VSCF+f quintic spline methods. Again, convergence was reached with fewer numbers of mapping points per direction using the VSCF+f method than with the VSCF method, especially for the Cmca-12 and C2/c-24 structures. In the latter case, including forces in the fitting reduces the computational cost by around 40%. This further implies that the VSCF+f method is robust and improves on the efficiency of the basic VSCF method.
IV.2 Two-dimensional subspaces
A natural next test of the VSCF+f method is to apply it to mapping 2-D subspaces of the BO surface. This poses a more significant challenge than the 1-D terms considered up to now, as interpolating data in two dimensions is required.
Mapping the BO surface in two dimensions is expensive, and can only feasibly be done for small systems. Here, we focus on the Cmca-4 structure of solid hydrogen discussed previously, which possesses twelve potential mapping directions, corresponding to the twelve harmonic phonon modes, labelled with numbers from 1 to 12. Three of these modes are acoustic, and thus have zero frequency. To minimise the computational cost further, we consider only two of the many 2-D subspaces in this system – those corresponding to the directions described by the harmonic modes 4 and 5, and 4 and 7. The harmonic frequencies of modes 4, 5, and 7 are , and meV, respectively, and the displacement patterns corresponding to each of these mapping directions can be found in the Supplemental Material. These subspaces were chosen by conducting a preliminary mapping of all 2-D subspaces with a low number of mapping points, and taking only those with significant corrections to the 1-D description of the BO surface. The subspaces where the mapping entered parts of energy minima corresponding to structures significantly lower in energy than the Cmca-4 structure were also neglected. The two subspaces presented here were then chosen as being representative of those remaining. The same cut-off energy and Monkhorst-Pack grid was used as in the calculations of Sec. IV.A, but an energy convergence tolerance of eV was used to ensure accurate forces.
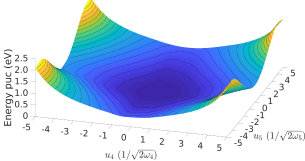
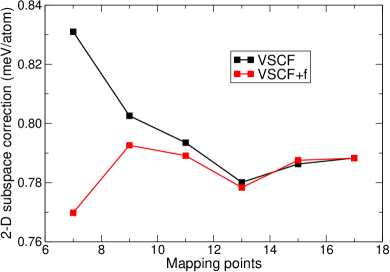
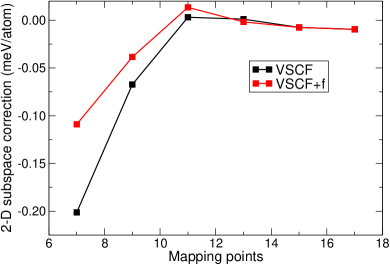
Fig. 4 shows the results of tests including the mapping of 2-D subspaces in the Cmca-4 solid hydrogen structure. The two rows of figures correspond to the two subspaces mapped. The left-hand column shows the BO surface mapped in the relevant subspace, and the right-hand column shows the convergence of the correction to the energy due to 2-D terms with respect to the number of mapping points used per mapping direction. All energies were again calculated at zero temperature. The convergence graphs show that utilising forces in the mapping of the BO surface in two dimensions improves the results relative to the converged final value, especially for small numbers of mapping points, although the improvement is not as pronounced as in the 1-D case. This could be due to the small size of the energy scales in question – the energies shown are all smaller than 1 meV per atom, which is around the finest energy scale that such anharmonic calculations can reasonably be assumed to be accurate to. The small size of the corrections due to 2-D terms compared to those seen for 1-D terms shows that the neglect of such higher-order terms in the BO surface expansion of equation (4) is justified. The ability of the VSCF+f method to show improvement even at such small energy scales again demonstrates its capabilities, even in cases including mapping of 2-D subspaces of the BO surface.
IV.3 Lithium and zirconium
Finally, we consider two systems in a very different regime from molecular or solid hydrogen - the metals lithium and zirconium, in their bcc phases. The main anharmonic contributions to the vibrational energy in these systems arise from soft modes, which necessarily have some quartic character. Here, we focus our attention on mapping the BO surface along the direction defined by these soft modes, and how utilising the VSCF+f procedure can improve this mapping. In addition to calculations at zero temperature, the effect of anharmonicity on the free energy at finite temperature is also considered, as the bcc phase only becomes stable experimentally at K in Li and K in Zr. Thermal expansion effects are not included in these calculations.
For the calculations in lithium and zirconium, we used the recently introduced non-diagonal supercells method to reduce the computational cost of sampling the vibrational Brillouin zoneLloyd-Williams and Monserrat (2015). Typically, diagonal supercells are used to sample the vibrational BZ, with an sampling grid requiring an supercell containing unit cells. The non-diagonal supercells method allows such an sampling to be done using a series of non-diagonal supercells each containing a maximum of unit cells, significantly reducing the computational cost. However, as the aim of this work is to consider methods for improved fitting of the BO surface, rather than to conduct high-accuracy calculations on these well-studied materials, we did not attempt to completely converge our results with respect to the sampling of the vibrational BZ. Even with the non-diagonal supercell method the computational cost increases rapidly with increasing sampling grid size. Instead, we used a sampling of the vibrational BZ as a compromise between accuracy and speed.
As lithium and zirconium are metallic, it is necessary to use partial band occupancies to eliminate discontinuities in the energy during the SCF minimisation. This is done by artificially giving the Kohn-Sham quasiparticles a finite temperature to smear out their energy levels. In these calculations, a smearing width of eV, corresponding to K, is used. The calculated DFT energies do depend on the size of this smearing, but the effect on the overall shape of the BO surface is small, meaning the results of the vibrational calculations are largely unaffected by the choice of smearing width. The Monkhorst-Pack grids in all supercells used had a spacing of , corresponding to a grid in the unit cell. An energy cut-off of eV was used in all calculations. To obtain these parameter values, the harmonic vibrational energy was converged to within meV with respect to the Monkhorst-Pack grid size and energy cut-off. This constitutes a somewhat stronger convergence criterion than that used in other workLejaeghere et al. (2016), as it is important to ensure the harmonic results are accurate before using them as a basis for further calculations.
Our results for Li show that any differences in the anharmonic vibrational energy arising from the three different fitting methods are negligible, down to scales of 0.1 meV. Because of this we do not present the results for Li here, although we do discuss them. The negligible difference between fitting methods arises from the fact that, apart from along the direction defined by the soft modes present, the vibrational properties of Li are described well by the harmonic approximation, despite its low massTaole et al. (1978). This means that a very good fit to the BO surface along most modes can be found with small numbers of mapping points (as in the standard finite displacement method for calculating harmonic frequencies), and so all three methods agree very well. Even in the case of the soft modes, which must necessarily contain some anharmonic character, the double-well structure is not very pronounced, with the overall BO surface appearing essentially quadratic. To see this double-well structure, where the two minima are very close to the central maximum, a finer than usual mapping of the BO surface proved necessary. Our calculations show these double wells are quite shallow, meaning that even at zero temperature the BO surface looks essentially harmonic. Our results imply that the bcc structure of Li is dynamically stable at zero temperature, although experimental results show that the bcc phase becomes stable above K. This disagreement could potentially be caused by incomplete convergence with respect to sampling of the vibrational BZ, or higher order terms in the expansion of the BO surface of equation (4), as well as by the errors inherent in DFT. A different exchange-correlation functional might give results closer to experiment.
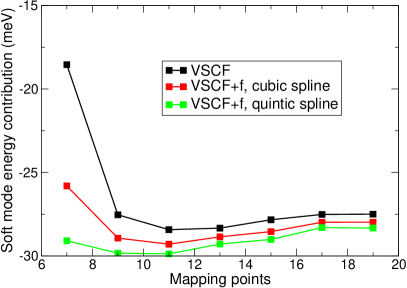
The results for zirconium tell a different story to those of lithium. Fig. 5 shows the variation with the number of mapping points of the sum of the lowest eigenvalues calculated for each of the 1-D terms resulting from mapping the BO surface along a soft mode. The differences between the values obtained by the different fitting methods for the sum of the lowest eigenvalues of all the 1-D terms (which would represent the zero-point energy if the bcc structure of Zr was dynamically stable at 0 K) are small, as in Li. However, there are much more significant differences in the contribution of the soft modes to the anharmonic energy, as seen in Fig. 5. Although the effect is much less pronounced than that seen for hydrogen in Fig. 3, it is clear that, for low numbers of mapping points, including force data improves the fit to the BO surface. It is also evident that the quintic spline gives a better fit than the cubic spline when the forces are used. This demonstrates that the VSCF+f method can improve on the basic VSCF method in this type of system, as well as the hydrogen systems explored previously.
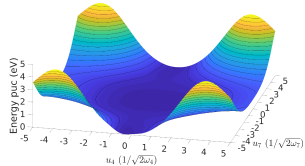
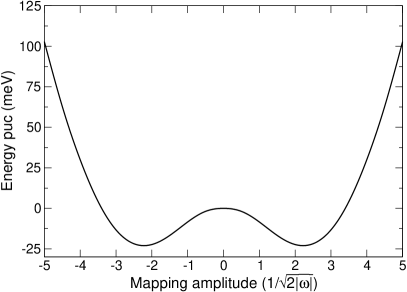
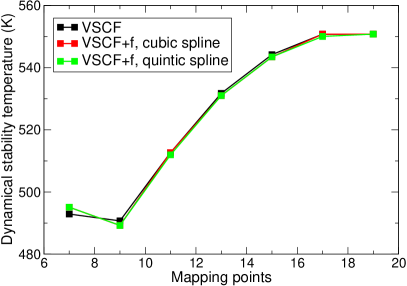
The soft modes in Zr are more numerous, and mapping the BO surface along the directions defined by them gives much more pronounced double-well structures than in Li, meaning that the structure is not dynamically stable at zero temperature. An example of the pronounced double-well structure of the BO surface mapped along one of the soft modes in Zr is shown in Fig. 6. Our results can be used to calculate the temperature at which the bcc phase is stabilised dynamically, by calculating the internal energy at a range of temperatures and finding where it becomes positive. The results are shown in Fig. 7 for a range of mapping points and the three fitting methods used. At these higher temperatures, it can be seen that the differences between the three fitting methods, visible at zero temperature in Fig. 5, are much less significant – the differences are mostly washed out by the overall vibrational energy increasing. Our calculations predict that the bcc structure of Zr should become dynamically stable above about K, which is significantly lower than the observed transition temperature of K. This disagreement could again potentially be caused by the incomplete convergence with respect to the vibrational BZ sampling, higher-order terms in the BO surface expansion, thermal expansion effects, or errors inherent in DFT itself.
V Conclusions and future work
In summary, we have shown that the efficiency of the vibrational self-consistent field method proposed in Ref. Monserrat et al., 2013 can be significantly improved by using both energy and force data from DFT calculations when mapping the BO energy surface. Tests of this method on molecular and high-pressure solid hydrogen, including the contribution of 2-D subspaces of the BO surface to the energy, as well as on lithium and zirconium in the bcc structure, show that the VSCF+f method agrees well with the basic VSCF method, but significantly reduces the computational cost involved.
Our results show that the VSCF+f method allows us to perform accurate calculations of anharmonic corrections to the harmonic phonon model for a significantly reduced computational cost compared to the basic VSCF method. The next step will be to apply the VSCF+f method to new systems in which large anharmonicities are of interest.
VI Acknowledgements
The authors would like to thank Bartomeu Monserrat for useful discussions and comments on the manuscript. Calculations were performed on the Cambridge High Performance Computing Service facility and the ARCHER facility of the UK National Supercomputing Service. R.J.N. acknowledges financial support from the Engineering and Physical Sciences Research Council (EPSRC) of the U.K. under Grant No. EP/J017639/1. Computational resources were provided by the Archer facility of the U.K.’s national high-performance computing service (for which access was obtained via the UKCP consortium, EPSRC Grant No. EP/K014560/1). Supporting research data may be freely accessed at https://doi.org/XX.XXXXX/XXX.XXXX, in compliance with the applicable Open Data policies.
References
- Wallace (1972) D.C. Wallace, Thermodynamics of Crystals (John Wiley & Sons, New York, 1972).
- Maradudin et al. (1971) A.A. Maradudin, E.W. Montroll, G.H. Weiss, and I.P. Ipatova, Theory of Lattice Dynamics in the Harmonic Approximation, 2nd ed. (Academic Press, New York, 1971).
- Pavone et al. (1993) P. Pavone, K. Karch, O. Schütt, D. Strauch, W. Windl, P. Giannozzi, and S. Baroni, “Ab initio lattice dynamics of diamond,” Phys. Rev. B 48, 3156–3163 (1993).
- Baroni et al. (2001) S. Baroni, S. de Gironcoli, A. Dal Corso, and P. Giannozzi, “Phonons and related crystal properties from density-functional perturbation theory,” Rev. Mod. Phys. 73, 515–562 (2001).
- Monserrat et al. (2013) B. Monserrat, N.D. Drummond, and R.J. Needs, “Anharmonic vibrational properties in periodic systems: energy, electron-phonon coupling, and stress,” Phys. Rev. B 87, 144302 (2013).
- Monserrat et al. (2014a) B. Monserrat, N.D. Drummond, C.J. Pickard, and R.J. Needs, “Electron-phonon coupling and the metallization of solid helium at terapascal pressures,” Phys. Rev. Lett. 112, 055504 (2014a).
- Monserrat et al. (2014b) B. Monserrat, R.J. Needs, and C.J. Pickard, “Temperature effects in first-principles solid state calculations of the chemical shielding tensor made simple,” J. Chem. Phys. 141, 134113 (2014b).
- Drummond et al. (2015) N.D. Drummond, B. Monserrat, J.H. Lloyd-Williams, P. López Ríos, C.J. Pickard, and R.J. Needs, “Quantum Monte Carlo study of the phase diagram of solid molecular hydrogen at extreme pressures,” Nat. Commun. 6, 7794 (2015).
- Engel et al. (2016) E.A. Engel, B. Monserrat, and R.J. Needs, “Vibrational effects on surface energies and band gaps in hexagonal and cubic ice,” J. Chem. Phys. 145, 044703 (2016).
- Prentice et al. (2017) J.C.A. Prentice, B. Monserrat, and R.J. Needs, “First-principles study of the dynamic Jahn-Teller distortion of the neutral vacancy in diamond,” Phys. Rev. B 95, 014108 (2017).
- Born and Oppenheimer (1927) M. Born and R. Oppenheimer, “Zur Quantentheorie der Molekeln,” Ann. Phys. 389, 457–484 (1927).
- Payne et al. (1992) M.C. Payne, M.P. Teter, D.C. Allan, T.A. Arias, and J.D. Joannopoulos, “Iterative minimization techniques for ab initio total-energy calculations: molecular dynamics and conjugate gradients,” Rev. Mod. Phys. 64, 1045–1097 (1992).
- Pickard et al. (2012) C.J. Pickard, M. Martinez-Canales, and R.J. Needs, “Density functional theory study of phase IV of solid hydrogen,” Phys. Rev. B 85, 214114 (2012).
- Chen et al. (2014) J. Chen, X. Ren, X.-Z. Li, D. Alfè, and E. Wang, “On the room-temperature phase diagram of high pressure hydrogen: An ab initio molecular dynamics perspective and a diffusion Monte Carlo study,” J. Chem. Phys. 141, 024501 (2014).
- Pickard and Needs (2007) C.J. Pickard and R.J. Needs, “Structure of phase III of solid hydrogen,” Nat. Phys. 3, 473–476 (2007).
- Johnson and Ashcroft (2000) K.A. Johnson and N.W. Ashcroft, “Structure and bandgap closure in dense hydrogen,” Nature 403, 632–635 (2000).
- Borinaga et al. (2016) M. Borinaga, I. Errea, M. Calandra, F. Mauri, and A. Bergara, “Anharmonic effects in atomic hydrogen: Superconductivity and lattice dynamical stability,” Phys. Rev. B 93, 174308 (2016).
- Monserrat et al. (2016) B. Monserrat, R.J. Needs, E. Gregoryanz, and C.J. Pickard, “Hexagonal structure of phase III of solid hydrogen,” Phys. Rev. B 94, 134101 (2016).
- Hellman et al. (2011) O. Hellman, I.A. Abrikosov, and S.I. Simak, “Lattice dynamics of anharmonic solids from first principles,” Phys. Rev. B 84, 180301 (2011).
- Overhauser (1984) A.W. Overhauser, “Crystal structure of lithium at 4.2 K,” Phys. Rev. Lett. 53, 64–65 (1984).
- Schaeffer et al. (2015) A.M. Schaeffer, W. Cai, E. Olejnik, J.J. Molaison, S. Sinogeikin, A.M. dos Santos, and S. Deemyad, “Boundaries for martensitic transition of 7Li under pressure,” Nat. Commun. 6, 8030 (2015).
- Grimvall et al. (2012) G. Grimvall, B. Magyari-Köpe, V. Ozoliņš, and K.A. Persson, “Lattice instabilities in metallic elements,” Rev. Mod. Phys. 84, 945–986 (2012).
- Antolin et al. (2012) N. Antolin, O.D. Restrepo, and W. Windl, “Fast free-energy calculations for unstable high-temperature phases,” Phys. Rev. B 86, 054119 (2012).
- Souvatzis et al. (2008) P. Souvatzis, O. Eriksson, M.I. Katsnelson, and S.P. Rudin, “Entropy driven stabilization of energetically unstable crystal structures explained from first principles theory,” Phys. Rev. Lett. 100, 095901 (2008).
- Petry et al. (1991) W. Petry, A. Heiming, J. Trampenau, M. Alba, C. Herzig, H.R. Schober, and G. Vogl, “Phonon dispersion of the bcc phase of group-IV metals. I. bcc titanium,” Phys. Rev. B 43, 10933–10947 (1991).
- Heiming et al. (1991) A. Heiming, W. Petry, J. Trampenau, M. Alba, C. Herzig, H.R. Schober, and G. Vogl, “Phonon dispersion of the bcc phase of group-IV metals. II. bcc zirconium, a model case of dynamical precursors of martensitic transitions,” Phys. Rev. B 43, 10948–10962 (1991).
- Trampenau et al. (1991) J. Trampenau, A. Heiming, W. Petry, M. Alba, C. Herzig, W. Miekeley, and H.R. Schober, “Phonon dispersion of the bcc phase of group-IV metals. III. bcc hafnium,” Phys. Rev. B 43, 10963–10969 (1991).
- Kunc and Martin (1982) K. Kunc and R.M. Martin, “Ab Initio force constants of GaAs: A new approach to calculation of phonons and dielectric properties,” Phys. Rev. Lett. 48, 406–409 (1982).
- Jung and Gerber (1996) J. O. Jung and R. B. Gerber, “Vibrational wave functions and spectroscopy of (H2O)n, : Vibrational self-consistent field with correlation corrections,” J. Chem. Phys. 105, 10332 (1996).
- Bowman (1978) J.M. Bowman, “Self‐consistent field energies and wavefunctions for coupled oscillators,” J. Chem. Phys. 68, 608–610 (1978).
- Press et al. (1992) W.H. Press, S.A. Teukolsky, W.T. Vetterling, and B.P. Flannery, Numerical Recipes in FORTRAN: The Art of Scientific Computing, 2nd ed. (Cambridge University Press, Cambridge, 1992).
- Clark et al. (2005) S.J. Clark, M.D. Segall, C.J. Pickard, P.J. Hasnip, M.I.J. Probert, K. Refson, and M.C. Payne, “First principles methods using CASTEP,” Z. Kristallogr. 220, 567–570 (2005).
- Vanderbilt (1990) D. Vanderbilt, “Soft self-consistent pseudopotentials in a generalized eigenvalue formalism,” Phys. Rev. B 41, 7892–7895 (1990).
- Kohn et al. (1996) W. Kohn, A.D. Becke, and R.G. Parr, “Density functional theory of electronic structure,” J. Phys. Chem. 100, 12974–12980 (1996).
- Perdew et al. (1996) J.P. Perdew, K. Burke, and M. Ernzerhof, “Generalized gradient approximation made simple,” Phys. Rev. Lett. 77, 3865–3868 (1996).
- Azadi and Foulkes (2013) S. Azadi and W.M.C. Foulkes, “Fate of density functional theory in the study of high-pressure solid hydrogen,” Phys. Rev. B 88, 014115 (2013).
- Monkhorst and Pack (1976) H.J. Monkhorst and J.D. Pack, “Special points for Brillouin-zone integrations,” Phys. Rev. B 13, 5188–5192 (1976).
- Nocedal and Wright (2006) J. Nocedal and S.J. Wright, Numerical Optimization, 2nd ed. (Springer-Verlag, Berlin, 2006).
- Lloyd-Williams and Monserrat (2015) J.H. Lloyd-Williams and B. Monserrat, “Lattice dynamics and electron-phonon coupling calculations using nondiagonal supercells,” Phys. Rev. B 92, 184301 (2015).
- Lejaeghere et al. (2016) Kurt Lejaeghere, Gustav Bihlmayer, Torbjörn Björkman, Peter Blaha, Stefan Blügel, Volker Blum, Damien Caliste, Ivano E. Castelli, Stewart J. Clark, Andrea Dal Corso, Stefano de Gironcoli, Thierry Deutsch, John Kay Dewhurst, Igor Di Marco, Claudia Draxl, Marcin Dułak, Olle Eriksson, José A. Flores-Livas, Kevin F. Garrity, Luigi Genovese, Paolo Giannozzi, Matteo Giantomassi, Stefan Goedecker, Xavier Gonze, Oscar Grånäs, E. K. U. Gross, Andris Gulans, François Gygi, D. R. Hamann, Phil J. Hasnip, N. A. W. Holzwarth, Diana Iuşan, Dominik B. Jochym, François Jollet, Daniel Jones, Georg Kresse, Klaus Koepernik, Emine Küçükbenli, Yaroslav O. Kvashnin, Inka L. M. Locht, Sven Lubeck, Martijn Marsman, Nicola Marzari, Ulrike Nitzsche, Lars Nordström, Taisuke Ozaki, Lorenzo Paulatto, Chris J. Pickard, Ward Poelmans, Matt I. J. Probert, Keith Refson, Manuel Richter, Gian-Marco Rignanese, Santanu Saha, Matthias Scheffler, Martin Schlipf, Karlheinz Schwarz, Sangeeta Sharma, Francesca Tavazza, Patrik Thunström, Alexandre Tkatchenko, Marc Torrent, David Vanderbilt, Michiel J. van Setten, Veronique Van Speybroeck, John M. Wills, Jonathan R. Yates, Guo-Xu Zhang, and Stefaan Cottenier, “Reproducibility in density functional theory calculations of solids,” Science 351, aad3000 (2016).
- Taole et al. (1978) S.H. Taole, H.R. Glyde, and R. Taylor, “Anharmonic properties of Li,” Phys. Rev. B 18, 2643 (1978).