Reddened, Redshifted, or Intrinsically Red?
Understanding Near-Ultraviolet Colors
of Type Ia Supernovae
Abstract
Understanding the intrinsic colors of Type Ia supernovae (SNe Ia) is important to their use as cosmological standard candles. Understanding the effects of reddening and redshift on the observed colors are complicated and dependent on the intrinsic spectrum, the filter curves, and the wavelength dependence of reddening. We present ultraviolet and optical data of a growing sample of SNe Ia observed with the Ultra-Violet/Optical Telescope on the Swift spacecraft and use this sample to re-examine the near-UV (NUV) colors of SNe Ia. We find that a small amount of reddening ( mag) could account for the difference between groups designated as NUV-blue and NUV-red, and a moderate amount of reddening ( mag) could account for the whole NUV-optical differences. The reddening scenario, however, is inconsistent with the mid-UV colors and color evolution. The effect of redshift alone only accounts for part of the variation. Using a spectral template of SN2011fe we can forward model the effects of redshift and reddening and directly compare with the observed colors. We find that some SNe are consistent with reddened versions of SN2011fe, but most SNe Ia are much redder in the color than SN2011fe reddened to the same color. The absolute magnitudes show that two of five NUV-blue SNe Ia are blue because their near-UV luminosity is high, and the other three are optically fainter. We also show that SN 2011fe is not a “normal” SN Ia in the UV, but has colors placing it at the blue extreme of our sample.
Subject headings:
supernovae: general — ultraviolet: general — ISM: dust, extinction — supernovae: individual (SN2011fe, SN2011ia, SN2008Q, SN2008hv, SN2015F)1. Introduction
Type Ia Supernovae (SNe Ia) are important cosmological tools because their high optical luminosity correlates tightly with the optical light curve shape and color (Pskovskii, 1977; Phillips, 1993; Riess et al., 1996; Phillips et al., 1999), allowing them to be used as standard candles (Branch, 1998; Leibundgut, 2001). The near-infrared luminosity is found to have a smaller dependence on light curve shapes while also being less susceptible to the effects of interstellar extinction (Krisciunas et al., 2000; Wood-Vasey et al., 2008; Mandel et al., 2011; Kattner et al., 2012). In contrast, the ground-based near-ultraviolet has been found to be less homogeneous (e.g. Jha et al., 2006; Kessler et al., 2009), likely a combination of intrinsic differences such as metallicity and ejecta velocity (Burns et al., 2014), interstellar extinction, and the effects of different filter shapes and atmospheric absorption (Krisciunas et al., 2013).
The launch of the Swift spacecraft (Gehrels et al., 2004) with its Ultra-Violet Optical Telescope (UVOT; Roming et al., 2005) ushered in a new era of SN observations in the UV (see Brown et al., 2015 for a review). Data from Swift/UVOT revealed an increased dispersion in the near and mid-UV wavelengths (Brown et al., 2010; Milne et al., 2010). Milne et al. (2013) suggested the possibility that this dispersion could be the result of two distinct classes separated by a shift in their NUV-optical color evolution, with “NUV-red” SNe Ia being the majority and “NUV-blue” SNe Ia comprising about 25% of the SNe Ia. This came from a sample of 23 SNe with Swift/UVOT photometry and 33 SNe with HST near-UV spectrophotometry. McClelland (2013) noted a similar difference in the fraction of the luminosity coming from the UV in a subset of the same Swift SNe Ia. The cause of the difference is unknown, with velocity, density gradient (Sauer et al., 2008), mixing in the ejecta (Höflich et al., 1998), and metallicity (Sauer et al., 2008; Walker et al., 2012) differences being possibilities. Additionally, the detection of unburned carbon is much more common amongst NUV-blue SNe Ia (Thomas et al., 2011; Milne et al., 2013), though non-uniformity in the spectroscopic follow-up and analysis of SNe Ia make quantification difficult. Whether they represent distinct populations or are a continuum is also uncertain. Milne et al. (2015) found that similar groupings can be identified in the spectrophotometry of near-UV spectra of 59 higher redshift SNe Ia. Disturbing for those relying on the homogeneous nature of SNe Ia is the finding that the relative fractions of NUV-blue and NUV-red SNe Ia changes with redshift.
One difficulty with a classification based on color is the uncertain effect of reddening from circumstellar or interstellar dust. Milne et al. (2013) compared the peak colors to reddening vectors and found that the whole sample of colors could not result from a single intrinsic color modified by either a Milky Way (MW) dust law (RV=3.1, Cardelli et al., 1989) or a circumstellar scattering dust law (RV=1.7, Wang, 2005; Goobar, 2008). Separate samples were compared spectroscopically in Milne et al. (2013) and Milne et al. (2015) with several pairs showing a distinct block of emission in the NUV-blue SNe Ia as opposed to the continuum expected from extinction differences. Cinabro et al. (2016), however, find that a model with a distribution of colors, brightness, stretch and extinctions better matches the higher redshift photometric samples from SDSS-II and SNLS than a model with a bimodal distribution in the near-UV colors. Their assumed spectroscopic model creating the near-UV differences, however, is not consistent with the spectroscopic or photometric differences seen (Milne et al., 2013, 2015). Clearly a better understanding of the near-UV differences is needed.
Here we study in more detail the effects of color dispersion and reddening within an expanded sample of nearby SNe Ia. In Section 2 we detail the sample we presently use. Section 3 compares the sample to the Milne et al. (2013) color differences and examine the color and color-color evolution and absolute magnitudes. We discuss the consequences of our findings in Section 4 and summarize in Section 5.
2. Observational Sample
Swift/UVOT has observed over 500 SNe of all types in its twelve years of operation (see Brown et al., 2015 for a review of the first ten years). Most of the observations use the six UV and optical filters. The filter has a central wavelength of 1941 Å and an effective wavelength (using the type Ia SN 1992A spectrum; Kirshner et al., 1993) of 3064 Å. The equivalent central and effective wavelengths for the other filters are : 2248 and 2360, : 2605 and 3050, : 3464 and 3600, : 4371 and 4340, and : 5442 and 5400 Å. These numbers do not capture the full complexity of the filter throughputs and the effective transmission for a SN Ia spectrum; the reader is referred to Brown et al. (2010) and Brown et al. (2016) for further details.
The Swift SN sample has grown considerably since Milne et al. (2013), warranting a re-examination of the sample’s bulk properties. Milne et al. (2013) used 23 SNe Ia, of which 14 would meet the , subclassification, and light curve quality cuts we use below to arrive at our sample of 29 SNe Ia. The correlation between NUV flux and the optical decline rate parameter has been seen with Swift/UVOT and Hubble Space Telescope (HST) photometry (Brown et al., 2010; Wang et al., 2012) and HST UV spectroscopy (Foley et al., 2016), though the effect is smaller than the NUV-blue/red differences (Milne et al., 2013). The presence of the correlation in Swift photometry and HST photometry and spectrophotometry means it is not a side effect of the UVOT red leak. To minimize the effect of such a correlation, we restrict our sample to SNe Ia with 1.0 1.4. We also exclude SNe Ia spectroscopically identified as peculiar subtypes (91T-like, Super-Chandrasekhar candidates, 91bg-like, or 2002cx-like). All photometry comes from the Swift Optical/Ultraviolet Supernova Archive (SOUSA; Brown et al., 2014b) and is available at the Swift SN website111http://swift.gsfc.nasa.gov/docs/swift/sne/swift_sn.html and the Open Supernova Archive222https://sne.space/ (Guillochon et al., 2016).
Milne et al. (2013) found the NUV-blue/red dichotomy was apparent in the and colors. For our sample, many of the nearest and best-sampled SNe Ia (e.g. SNe 2005df, 2007af, 2011fe) were near or above the saturation limit in the UVOT optical () filters. Ground-based Johnson and -band observations can be substituted for Swift and with negligible differences (Poole et al., 2008; Brown et al., 2009). The Swift filters are designated in lower-case to distinguish them from Johnson filters (Poole et al., 2008). The Swift/UVOT band, however, is broader and, uninhibited by atmospheric absorption or the poor blue response of CCDs, extends bluer than the Johnson or SDSS bands. Ground-based / bands effectively do not reach short enough wavelengths to see the spectroscopic differences identified in Milne et al. (2013) and Milne et al. (2015). Folatelli et al. (2010) found a color-width relation that is similar to what is seen in optical colors. In this work we will focus on the and colors, substituting ground-based and -band measurements as needed, for the near-UV/optical color differences. We separately examine the mid-UV using the uvm2 filter, as a further check on the reddening and intrinsic differences. Mid-UV differences are found in SNe Ia with similar near-UV and optical properties (Foley & Kirshner, 2013).
We fit the UVOT data around maximum light and up to 20 days after using the MLCS2k2 model (Jha et al., 2007) in and , the SN 2011fe light curves Brown et al. (2012) for and , and the and curves of SN 2011fe for their respective filters. From this stretched template we extract and the magnitudes in the 6 UVOT bands interpolated at the time of the -band maximum light using the respective best-fit light curves. These parameters along with the host galaxy distances are listed in Table 1. For the following SNe Ia we use and data from the listed references: SNe 2005cf (Pastorello et al., 2007; Wang et al., 2009), 2005df (Milne et al., 2010), and 2011fe (Richmond & Smith, 2012).
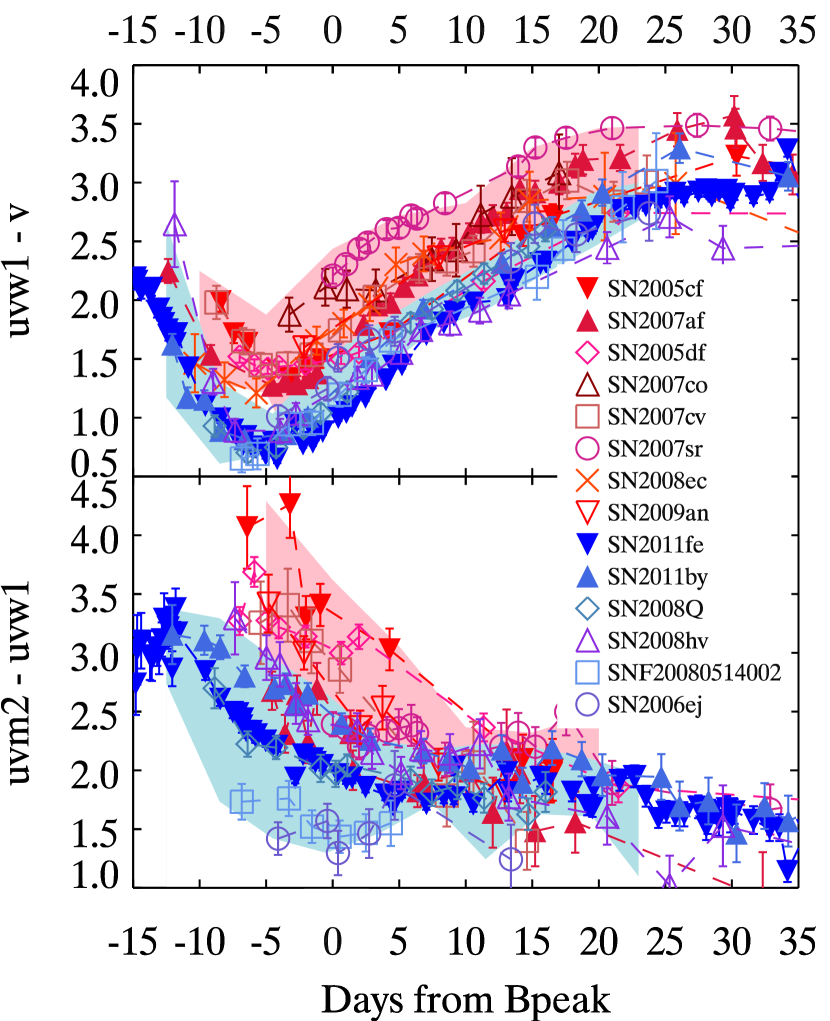
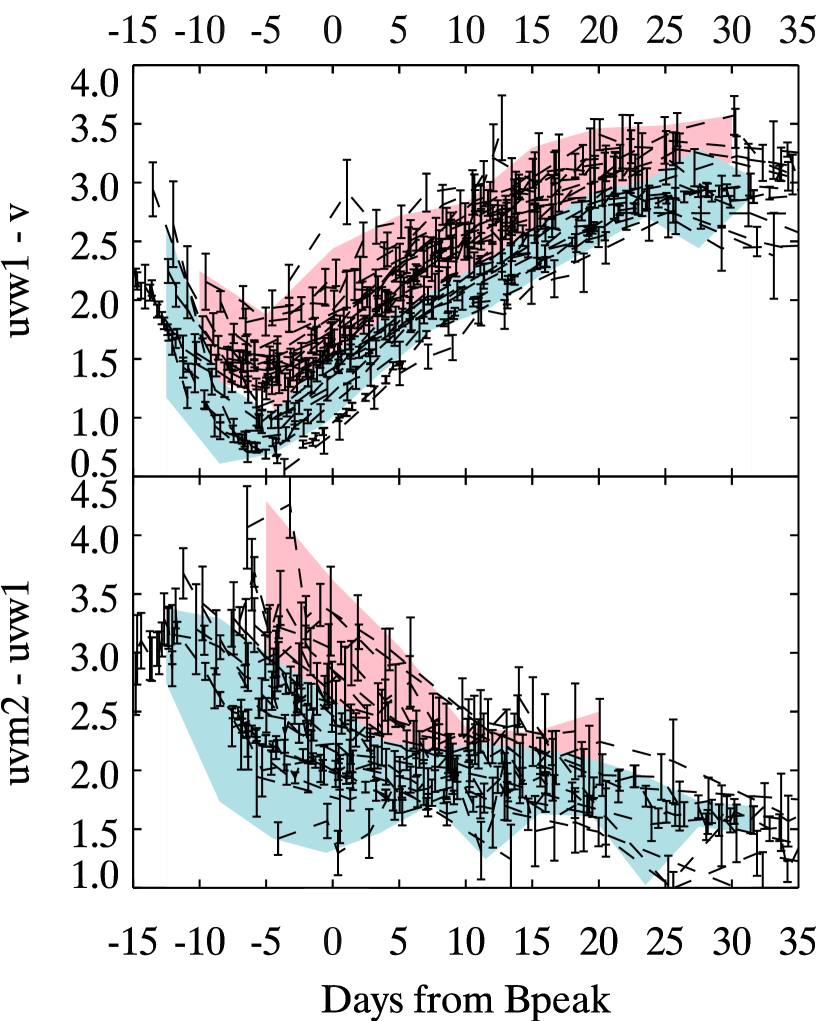
First we reproduce the and temporal evolution of the NUV-blue and NUV-red classes from Milne et al. (2013). In the left panel of Figure 1, blue and red regions have been made by outlining the minimum and maximum colors at each epoch (binned by 5 days) within each group using the same SNe Ia. Even within the groups, the colors have a large amount of scatter and there is a region occupied by both. In the right panel of Figure 1 we show the new objects from our current study overplotted on those colored regions.
The Swift filter does have an extended red tail reaching optical wavelengths (see Brown et al., 2010) which can complicate the direct translation of broadband photometry into monochromatic flux (Brown et al., 2016). For relative comparisons, the red tail does not affect the analysis. If all SNe Ia have the same spectral shape, the colors and relative UV and optical contributions will be the same. If there are spectral differences, the UV-brighter SNe Ia will have brighter UV magnitudes and bluer UV-optical colors and a smaller fractional contribution from the optical. The change in the optical contribution is caused by the spectral differences rather than the red leak creating apparent differences not in the spectra. Since we are studying apparent UV differences in optically-similar SNe Ia, the fact that some of the detected photons come from the optical cannot undermine the result. The optical contribution can only dilute UV differences, as evidenced by the uvm2 filter showing more scatter in colors and absolute magnitudes than the uvw2 filter which has a bluer central wavelength but a long tail into the optical (Brown et al., 2010). The forward-modeling technique we will use in comparing spectrophotometry from a reddened template with the photometry also allows us to naturally incorporate the red tail of the filter for a robust comparison.
As a spectroscopic template we will use the bolometric spectral series of SN 2011fe from Pereira et al. (2013), which incorporated HST UV spectra later published in Foley & Kirshner (2013) and Mazzali et al. (2014). SN 2011fe was a NUV-blue SN Ia (Brown et al., 2012; Milne et al., 2013). So while it has become a commonly-used template object because of the extensive temporal and wavelength coverage of its observations, it is either part of a minority subclass of SNe Ia or near one extreme of a continuum. Despite great efforts to broaden the parameter space of SNe Ia with UV spectroscopy (see e.g. Foley et al., 2016), we still lack a UV spectral series of a NUV-red SN Ia with a normal . So while we cannot test how well the photometry of NUV-red SNe Ia compares to a reddened NUV-red template, we can test whether their colors are consistent with that of a reddened NUV-blue. Essentially, we are testing the hypothesis that SNe Ia with similar optical are intrinsically similar in the near-UV and that the observed differences are due to differences in reddening or reddening laws. Within this context SN 2011fe is an excellent template to use.
3. Results
3.1. Color Evolution
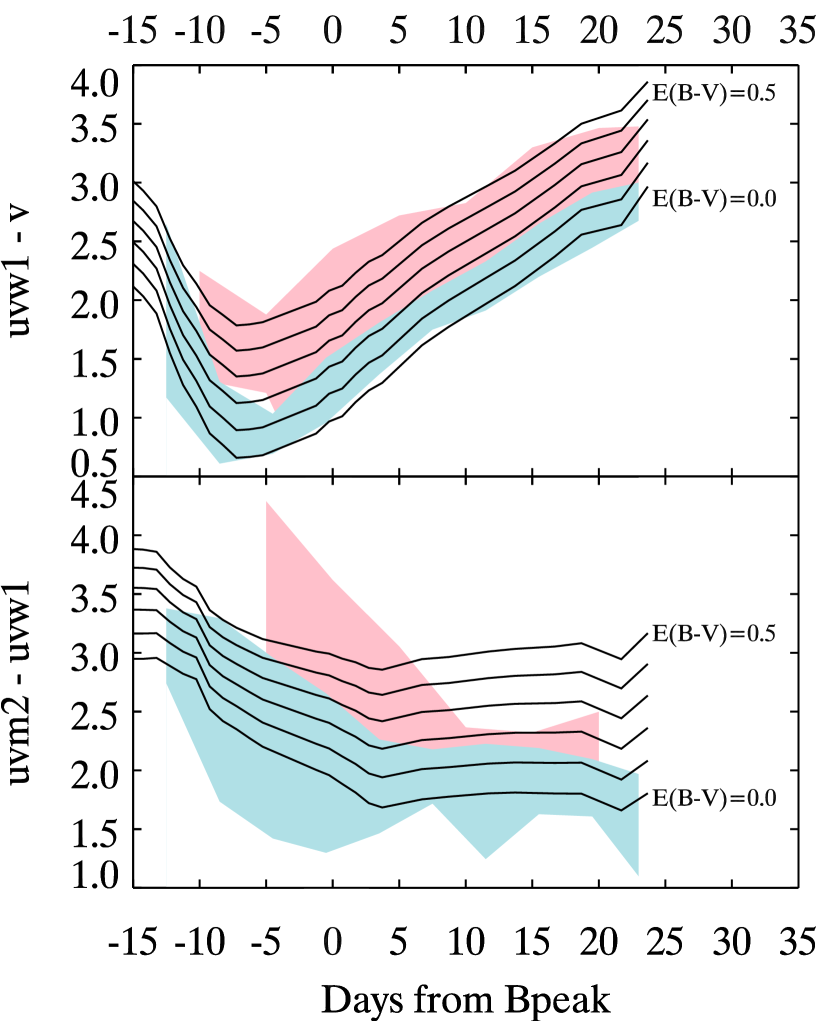
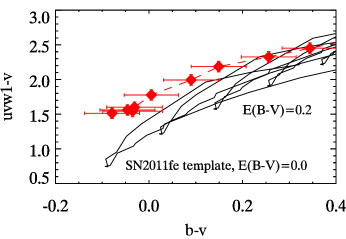
To predict the effect of reddening, we overplot the spectrophotometric color evolution of SN 2011fe with steps of 0.1 mag in using a Milky Way (MW) reddening law (ie, RV=3.1) from Cardelli et al. (1989). This is shown in the left panel of Figure 2. Using a different value for RV changes the offsets between the lines but not the temporal behavior. A reddening of =0.2 mag is sufficient to shift the colors of SN 2011fe to the blue edge of the NUV-red group. A reddening of mag would shift it through the entire range of observed colors for this sample. The post-maximum reddening in has the same slope for the NUV-red and NUV-blue SNe Ia. The timing of the pre-maximum minimum in the uvw1-v, however, is delayed for the NUV-red SNe Ia compared to the reddened color curves of SN 2011fe.
The observed colors have a large ( 2 mag) scatter before maximum light, but the scatter decreases after maximum light as the colors generally become monotonically bluer. The reddened curves required to match the spread in colors would predict a much larger scatter in the post-maximum colors than is observed. While some SNe Ia drop off of the plot because they become too faint in uvm2, the closer NUV-red objects would be expected to have a flat color evolution with very red colors, which we do not observe. Despite the large scatter in uvm2 colors and behavior, it does not appear to be driven by reddening.
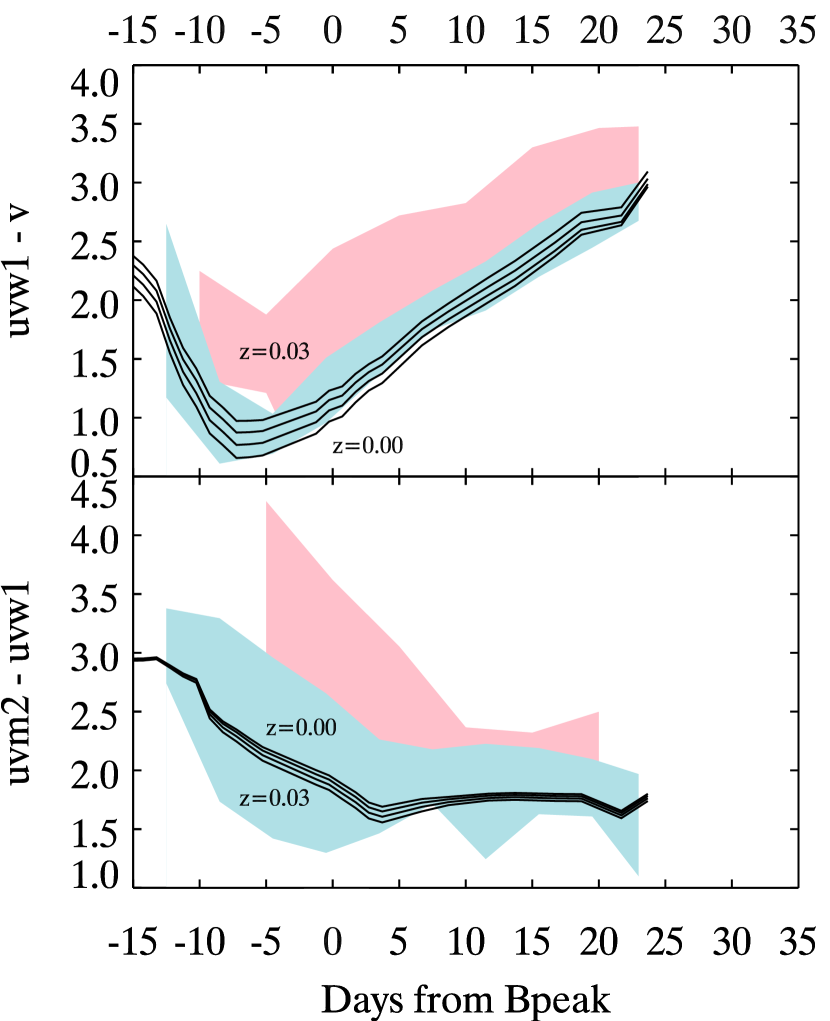
We also test for the effect of redshift on the observed colors. Because of the steeply changing near-UV spectrum, the differences between the observed photometry and that which would be observed in the rest from of the source ( corrections) are not negligible even for low redshifts (z0.03) (Brown et al., 2010).
The right panel of Figure 2 shows the observer-frame spectrophotometric colors for the SN 2011fe template between z=0 and z=0.03 in steps of 0.01. At a redshift of z=0.03, the color is reddened by 0.3 mags. This is not enough to make SN 2011fe look like a NUV-red SN, but it can contribute a significant shift.
3.2. Color-Color Evolution
While the bulk color evolution strongly suggests that reddening and redshift are not the dominant source of the color dispersion or the NUV-blue/red dichotomy, it does not tell us about individual objects. To correct for the effects of redshift and reddening, one must have an accurate spectral model. Lacking spectra for individual objects, we can use the spectral template of SN 2011fe and forward-model the effects of reddening and redshift on the observed magnitudes and colors.
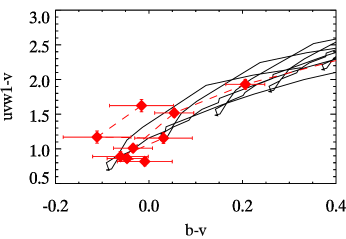
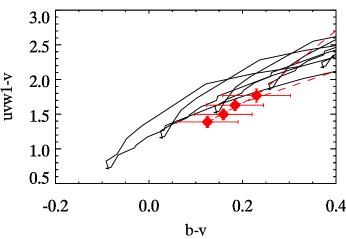
The NUV-optical and colors of SNe Ia become bluer until just before maximum light. When plotted as and , the colors follow a narrow track to the blue corner and then retreat almost along the same track. In Figure 3 we show the color-color tracks of three SNe Ia along with that predicted from SN 2011fe (at the appropriate redshift) with different amounts of reddening. We focus on the blue minimum of the colors as a pivot point, as epoch and reddening appear somewhat degenerate in the post-maximum phase. In the top panel, the colors of SN 2011by are consistent with SN 2011fe. We would thus classify SN 2011by as a NUV-blue SN. In the middle panel, the colors of SN 2007af are vertically offset to the red from the track of the bluest colors. We thus classify SN 2007af as NUV-red. In the bottom panel, SN 2015F is consistent with SN 2011fe reddened by about mag. According to the Schlafly & Finkbeiner (2011) reddening maps, the MW reddening along the line of sight amounts to mag. Based solely on the color evolution, it would have been classified as a NUV-red SN. We believe SN 2015F would more appropriately be labeled as a reddened NUV-blue.
We apply this procedure to all of the normal SNe Ia with observations beginning 5 days before the maximum light. Some SNe Ia are clearly offset vertically (in ) compared to curves pivoting at comparable optical colors. Several SNe Ia have colors comparable to the SN 2011fe model at zero or moderate reddening values. Because we do not know the appropriate extinction law or how close SN 2011fe would be to an intrinsic color boundary, the line of separation between NUV-red and NUV-blue (especially reddened NUV-blue) is still uncertain. We can however, identify some individual SNe Ia which are consistent with SN 2011fe and a reddening law. We can also identify some individual SNe Ia which have colors inconsistent with SN 2011fe and any of these reddening laws.
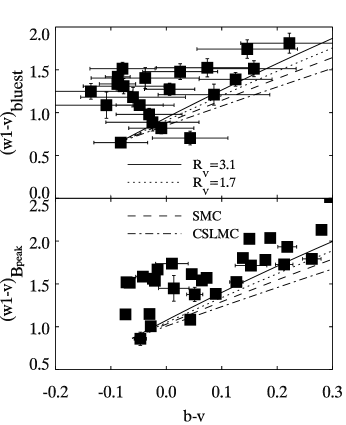
To compare multiple SNe Ia, Figure 4 plots the simultaneous and colors at the bluest epoch and at the time of B-band maximum. K-corrections have not been applied due to the limited number of spectral templates. The effect of reddening is represented by taking the spectra from the SN 2011fe template series at its bluest epoch and at the time of maximum light in the B band and reddening it with different extinction laws. These include the Cardelli et al. (1989) parameterization with RV=3.1 and 1.7, the SMC reddening law (Prevot et al., 1984), and a LMC reddening law modified by circumstellar scattering (Goobar, 2008). It is clear that SN 2015F and some of the other “red” SNe Ia are consistent with the reddened versions of SN 2011fe.
3.3. UV-bright or optically-faint?
Having demonstrated near-UV color differences, it is natural to wonder whether NUV-blue SNe Ia are brighter in the near-UV or fainter in the optical. In the analysis of Brown et al. (2010) we found that in the near-UV and optical, the scatter in the absolute magnitudes of the Swift SNe Ia sample was dominated by distance uncertainties. That sample was small (8 SNe Ia in the range used here) and most are at small enough redshifts for peculiar velocities of the galaxies (after removing bulk flows from known overdensities as in e.g. Mould et al., 2000) to be a significant fraction of the recessional velocity. The low redshift is a problem when the absence of redshift-independent distance estimates are unavailable and distances are computed from the recessional velocity. Most of the Swift SNe Ia are still very nearby, but our sample is larger, includes more SNe Ia in the nearby Hubble flow (z 0.02), and a growing number have Cepheid distances (Riess et al., 2016). We are pursuing HST observations from which to obtain surface brightness fluctuation distances (SBF, Tonry et al., 1997; Jensen et al., 2003, 2015) for many of our SNe Ia in late type galaxies. The distances we use in this study are listed in Table 1.
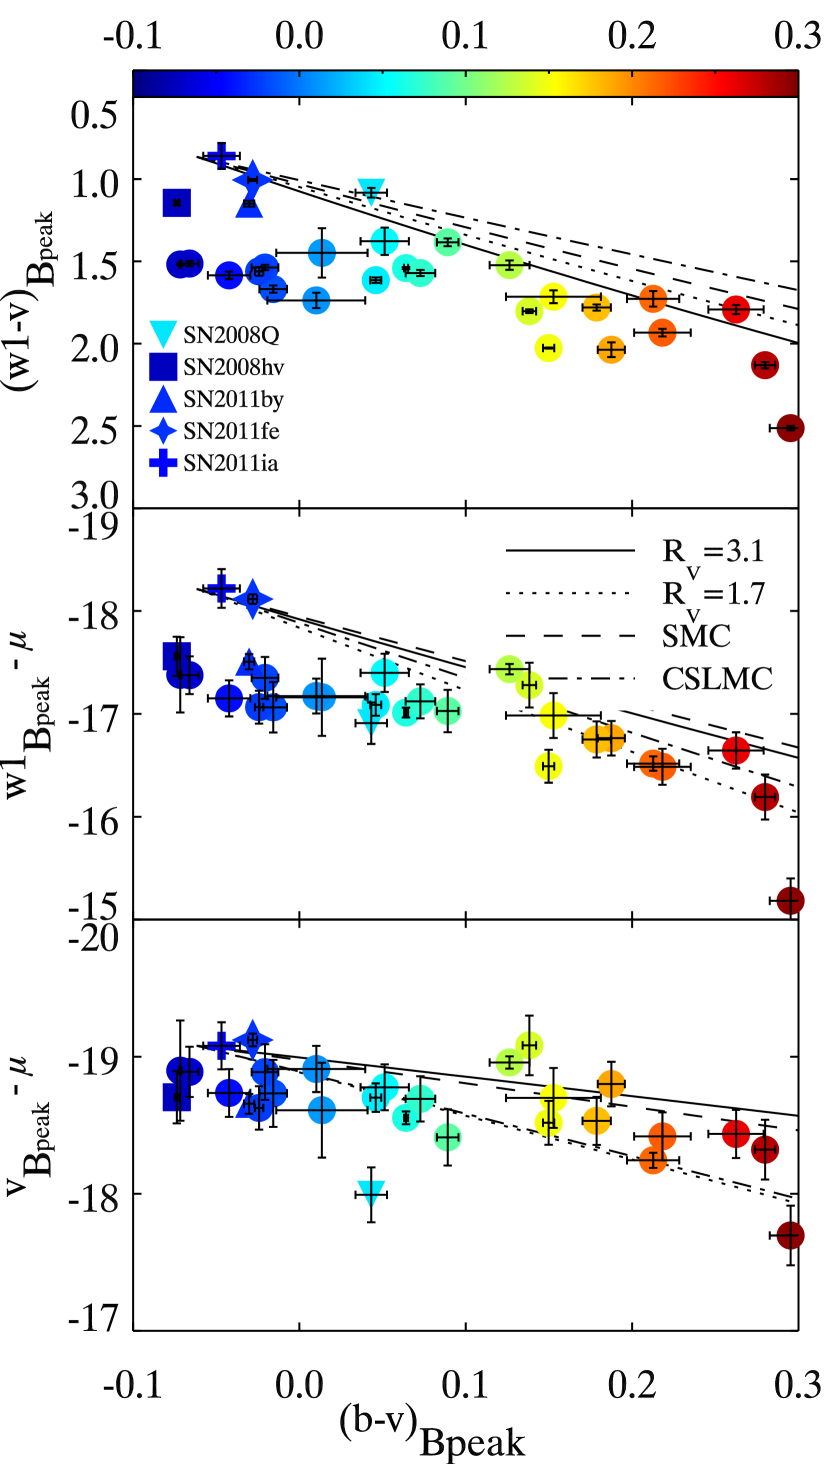
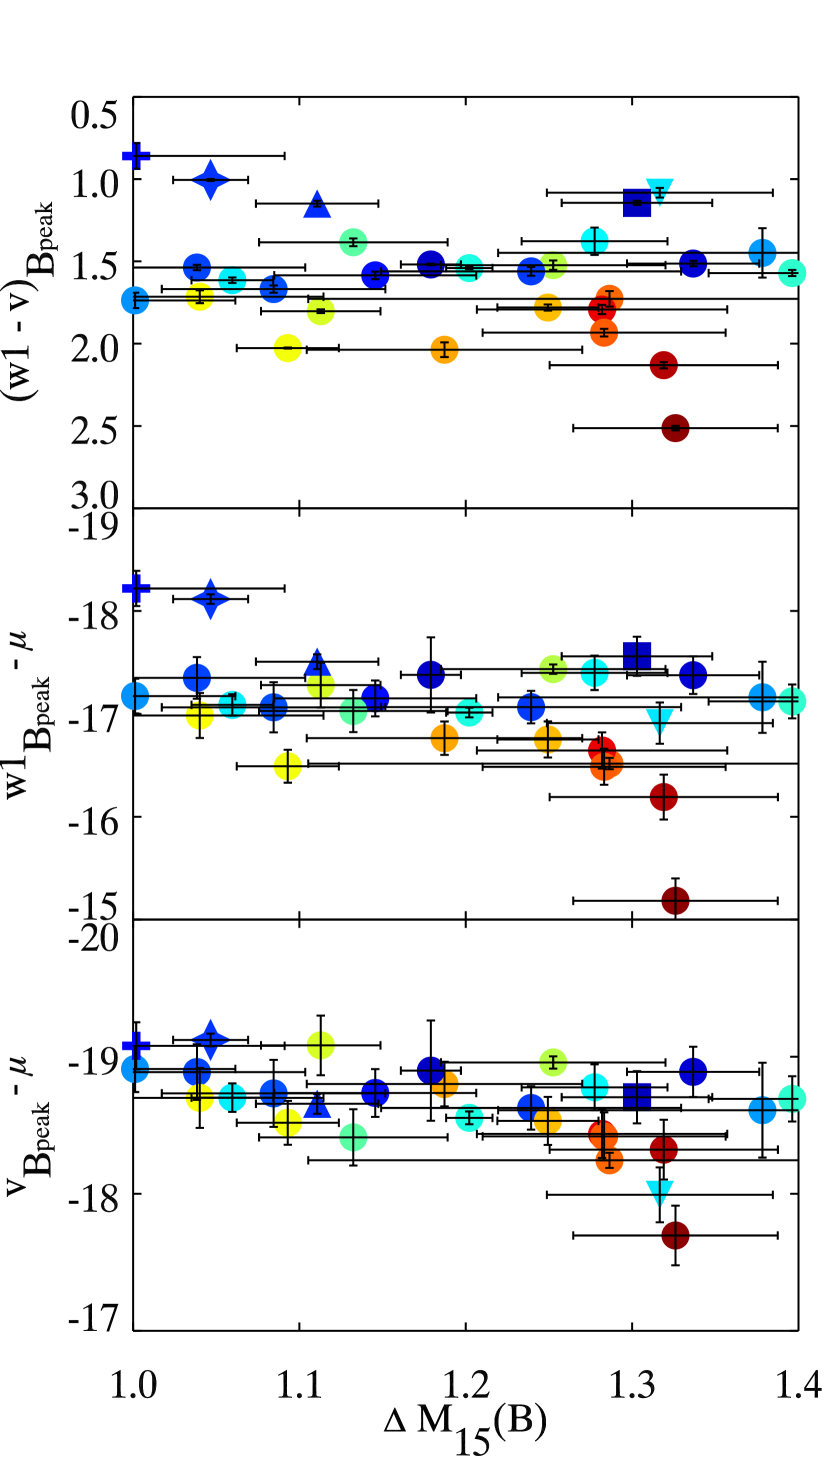
Figure 5 shows the colors as well as the magnitudes in the and bands (at the time of b-band maximum light) corrected for distance. They are plotted with respect to the color (at -band maximum light), which serves as a proxy for the amount of dust reddening. For these plots we use the full sample of normals (i.e. we use the cut on but require only photometry at the time of -band maximum rather than five days earlier). We again show the expected track for a reddened version of SN 2011fe. No extinction corrections have been applied, so the colors will be affected by a combination of Milky Way and host galaxy dust.
Of the five SNe Ia clearly blue in the top panel, SNe 2011fe and 2011ia are anomalously bright in the filter, though not as bright as Super-Chandrasekhar candidates (Brown et al., 2014a; Scalzo et al., 2014), SN 2004dt (Wang et al., 2012), or SN 2011de (Brown, 2014). SN 2008hv is intermediate. SNe 2008Q and 2011by appear more normal in the UV. SN 2008Q is anomalously faint in the optical, while SN 2011by is at the lower end of the optical brightness range, but not extremely so. The difference between SNe 2011by and 2011fe is significant, as they have nearly identical spectral shapes in the near-UV and optical, but different mid-UV continuum levels and different optical absolute magnitudes (Foley & Kirshner, 2013; Graham et al., 2015). The absolute luminosity differences persist with the new Cepheid distances of (Riess et al., 2016). An HST program (PI: Milne) will obtain SBF distances to the hosts of SNe 2008Q and 2008hv.
4. Discussion
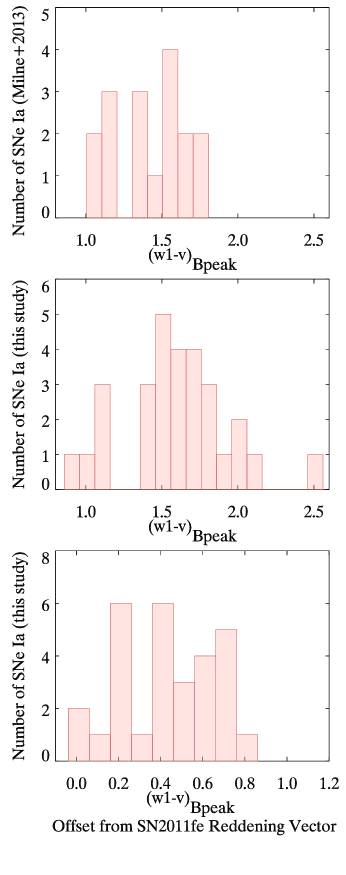
Especially in the presence of reddening, it is difficult to determine whether the true distribution of intrinsic colors could be bimodal or just have a large dispersion. In our sample, we still see a bimodality in the colors similar to Milne et al. (2013), as shown in Figure 6. However, our color-color evolution analysis also identifies SNe Ia (such as 2008ec and 2015F) which evolve like reddened NUV-blue SNe Ia. When viewing the distributions with a diagonal cutoff roughly parallel to the (albeit divergent) reddening vectors, two distinct groups are no longer prominent. We still don’t see a continuous distribution, but the sample size, binning, and selection effects may play some role. Variations in the reddening laws (which may or may not be related to the intrinsic colors of the SNe Ia) could also be mixing the distribution of modestly-reddened SNe Ia. The ratio between the numbers of NUV-blue and red SNe Ia also depends on whether the colors are corrected for reddening and/or where the cutoff in is made for SNe Ia to be considered to have low reddening.
One concern raised in Milne et al. (2013) is that there could also be differences in the intrinsic optical colors from which reddening is determined, namely NUV-blue SNe Ia having bluer colors. The expanded sample studied here includes SNe Ia which would be classified as NUV-red based on their colors, but which have bluer colors than the NUV-blue SNe Ia. We show here that the red cut off of the NUV-blue SNe Ia is the result of reddening. A color excess of just mag would cause SN 2011fe to be classified as NUV-red, limiting the color distribution of SNe Ia labeled NUV-blue. Fully understanding the intrinsic color distributions requires a better understanding of the multiwavelength reddening to the SNe Ia individually and an appropriate extrapolation of the reddening law to the UV. An alternative route is a physical explanation for the observed differences, with the optical differences inferred from models which are constrained by the UV data.
Milne et al. (2015) found similar near-UV color groupings in SNe Ia in Swift and HST SNe Ia at low redshifts (0.00 z0.03), Keck spectrophotometry of SNe Ia at higher redshifts (0.18 z0.53), and k-corrected colors from HST SNe Ia (z 0.6). The population distribution, however, shifts with redshift; namely, the lower redshift SNe Ia are dominated by NUV-red SNe Ia while the higher (z1 SNe Ia) are almost exclusively NUV-blue SNe Ia. (Cinabro et al., 2016) did not find evidence for a bimodality in the SDSS and SNLS samples (0.3 z0.7), which had overlap with the spectroscopic samples used in Milne et al. (2015). More specifically, they found that their spectroscopic model designed to mimic the distributions seen in Milne et al. (2013) and Milne et al. (2015) predicted U-V colors which did not match the U-V from the SALT-II fits of the SDSS and SNLS SNe Ia. Whether there are two distinct groups or a just a distribution in the colors, the observed shift in near-UV colors remains to be explained based on the SN properties or spectroscopic selection effects. While selection effects are harder to model for the nearby SN Ia samples, it should be tested whether the models for spectral variation (Betoule et al., 2014; Kessler et al., 2013; Scolnic & Kessler, 2016) can match the observed local distribution shown here and extreme cases such as SN 2011fe. As shown in Figures 5 and 4, there is UV variation that is not correlated with the optical colors. Thus a color correction which combines intrinsic color variations and reddening together will not be accurate in the UV.
5. Summary
We have used an expanded sample of 29 SNe Ia with 1.0 1.4 to study the effects of reddening and redshift on the observed near-UV colors of SNe Ia.
SNe Ia with similar optical colors have a 0.7 mag spread in colors, which cannot be caused by known extinction laws.
The color evolution can be broadly reproduced by reddening the SN 2011fe template, but the colors and color evolution are not consistent with the same amount of reddening.
The redshift range of the Swift SNe Ia (0.00 z0.03) results in a 0.3 mag difference in using the SN 2011fe template. However, as shown in Milne et al. (2013), redshift does not drive the color differences (over 80% of our SNe Ia have z0.02 where the difference is 0.2 mag or less) and different UV spectra give different k-corrections.
This larger sample also shows a dichotomy of colors. Many, but not all, of the red SNe Ia are consistent with the colors of a reddened SN 2011fe model. At least six SNe Ia have color-color evolution shifted to the red in the colors but not in the colors, clearly not the effect of reddening, while optically-red SNe Ia are more difficult to interpret.
Out of five SNe Ia with blue colors and low reddening, two are brighter than normal in the UV and three are at the faint end of normal in the optical.
SN 2011fe, often considered to be the best-observed normal SN Ia, does not appear to be normal in the UV, but is overluminous by 0.8 mags in compared to minimally-reddened SNe Ia with comparable .
6. Acknowledgements
P. J. B. and the Swift Optical/Ultraviolet Supernova Archive (SOUSA) are supported by NASA’s Astrophysics Data Analysis Program through grant NNX13AF35G. We acknowledge the use of Swift data obtained under the agreement with the Instrument Center for Danish Astrophysics (IDA). M. D. S. is funded by generous support provided by the Danish Agency for Science and Technology and Innovation realized through a Sapere Aude Level 2 grant and from the Villum Foundation.
| SN name | w1Bpeak | VBpeak | (BV)Bpeak | Distance | Reference | |
|---|---|---|---|---|---|---|
| (mag) | (mag) | (mag) | (mag) | (mag) | ||
| SN 2015F | 1.29 0.18 | 14.994 0.044 | 13.267 0.016 | 0.213 0.016 | 31.511 0.053 | Cepheids (Riess et al., 2016) |
| SN 2013gy | 1.34 0.04 | 16.456 0.015 | 14.943 0.005 | -0.066 0.005 | 33.832 0.183 | (Catinella et al., 2005) |
| SN 2013gs | 1.15 0.06 | 17.085 0.019 | 15.500 0.013 | -0.042 0.013 | 34.235 0.174 | (Falco et al., 1999) |
| SN 2013ex | 1.13 0.06 | 16.163 0.023 | 14.780 0.006 | 0.089 0.007 | 33.191 0.205 | (de Vaucouleurs et al., 1991) |
| SN 2013eu | 1.33 0.06 | 17.749 0.005 | 15.236 0.013 | 0.295 0.013 | 32.932 0.218 | (Falco et al., 1999) |
| SN 2013cs | 1.11 0.04 | 15.668 0.012 | 13.867 0.006 | 0.128 0.006 | 32.927 0.217 | (Pisano et al., 2011) |
| SN 2012ht | 1.25 0.07 | 14.475 0.026 | 12.952 0.012 | 0.126 0.012 | 31.910 0.043 | Cepheids (Riess et al., 2016) |
| SN 2012hr | 1.08 0.07 | 15.427 0.020 | 13.759 0.008 | -0.016 0.008 | 32.491 0.244 | (Koribalski et al., 2004) |
| SN 2011im | 1.28 0.08 | 17.505 0.022 | 15.712 0.017 | 0.262 0.017 | 34.149 0.175 | (Catinella et al., 2005) |
| SN 2011ia | 1.00 0.09 | 16.129 0.077 | 15.269 0.011 | -0.047 0.011 | 34.348 0.172 | (Huchra et al., 2012) |
| SN 2011fe | 1.05 0.02 | 11.023 0.006 | 10.017 0.003 | -0.028 0.003 | 29.139 0.046 | Cepheids (Riess et al., 2016) |
| SN 2011by | 1.11 0.04 | 14.081 0.018 | 12.932 0.003 | -0.030 0.003 | 31.588 0.072 | Cepheids (Riess et al., 2016) |
| SN 2011ao | 1.04 0.07 | 15.896 0.014 | 14.358 0.008 | -0.021 0.008 | 33.246 0.203 | (Adelman-McCarthy et al., 2007) |
| SN 2011B | 1.38 0.16 | 14.283 0.148 | 12.834 0.027 | 0.014 0.027 | 31.444 0.345 | (Rothberg & Joseph, 2006) |
| SN 2010kg | 1.28 0.07 | 17.718 0.016 | 15.785 0.017 | 0.218 0.017 | 34.203 0.174 | (de Vaucouleurs et al., 1991) |
| SN 2010gp | 1.19 0.08 | 18.278 0.044 | 16.241 0.008 | 0.188 0.008 | 35.042 0.162 | (Downes et al., 1993) |
| SN 2010gn | 1.24 0.09 | 18.489 0.026 | 16.929 0.002 | -0.024 0.003 | 35.554 0.158 | (Pan et al., 2014) |
| SN 2010ev | 1.32 0.07 | 16.727 0.018 | 14.597 0.006 | 0.280 0.006 | 32.919 0.218 | (Doyle et al., 2005) |
| SN 2009cz | 1.00 0.06 | 17.549 0.037 | 15.813 0.029 | 0.010 0.029 | 34.723 0.166 | (Mahdavi & Geller, 2004) |
| SN 2009Y | 1.04 0.07 | 15.968 0.026 | 14.253 0.029 | 0.153 0.029 | 32.952 0.217 | (Catinella et al., 2005) |
| SN 2008hv | 1.30 0.05 | 16.031 0.013 | 14.887 0.001 | -0.074 0.001 | 33.590 0.190 | (Wegner et al., 2003) |
| SN 2008ec | 1.25 0.03 | 17.409 0.017 | 15.629 0.009 | 0.179 0.009 | 34.161 0.175 | (Keel, 1996) |
| SN 2008Q | 1.32 0.07 | 14.830 0.028 | 13.748 0.009 | 0.043 0.009 | 31.740 0.200 | SBF (Jensen et al., 2003) |
| SN 2007co | 1.09 0.03 | 18.760 0.001 | 16.734 0.003 | 0.150 0.003 | 35.251 0.160 | (Marzke et al., 1996) |
| SN 2007af | 1.20 0.01 | 14.760 0.007 | 13.219 0.001 | 0.064 0.001 | 31.773 0.047 | Cepheids (Riess et al., 2016) |
| SN 2006ej | 1.28 0.04 | 17.252 0.082 | 15.874 0.015 | 0.051 0.015 | 34.651 0.167 | (Abazajian et al., 2003) |
| SN 2006dm | 1.40 0.05 | 17.690 0.016 | 16.119 0.009 | 0.073 0.009 | 34.811 0.165 | (Theureau et al., 1998) |
| SN 2005df | 1.18 0.02 | 13.910 0.005 | 12.392 0.001 | -0.072 0.001 | 31.290 0.366 | (Koribalski et al., 2004) |
| SN 2005cf | 1.06 0.02 | 15.174 0.016 | 13.560 0.003 | 0.046 0.003 | 32.261 0.104 | Cepheids (Riess et al., 2016) |
References
- Abazajian et al. (2003) Abazajian, K., Adelman-McCarthy, J. K., Agüeros, M. A., et al. 2003, AJ, 126, 2081
- Adelman-McCarthy et al. (2007) Adelman-McCarthy, J. K., Agüeros, M. A., Allam, S. S., et al. 2007, ApJS, 172, 634
- Betoule et al. (2014) Betoule, M., Kessler, R., Guy, J., et al. 2014, A&A, 568, A22
- Branch (1998) Branch, D. 1998, ARAA, 36, 17
- Brown et al. (2014a) Brown, M. J. I., Moustakas, J., Smith, J.-D. T., et al. 2014a, ApJS, 212, 18
- Brown (2014) Brown, P. J. 2014, ApJL, 796, L18
- Brown et al. (2016) Brown, P. J., Breeveld, A., Roming, P. W. A., & Siegel, M. 2016, ArXiv e-prints
- Brown et al. (2014b) Brown, P. J., Breeveld, A. A., Holland, S., Kuin, P., & Pritchard, T. 2014b, A&SS, 354, 89
- Brown et al. (2015) Brown, P. J., Roming, P. W. A., & Milne, P. A. 2015, Journal of High Energy Astrophysics, 7, 111
- Brown et al. (2009) Brown, P. J., Holland, S. T., Immler, S., et al. 2009, AJ, 137, 4517
- Brown et al. (2010) Brown, P. J., Roming, P. W. A., Milne, P., et al. 2010, ApJ, 721, 1608
- Brown et al. (2012) Brown, P. J., Dawson, K. S., de Pasquale, M., et al. 2012, ApJ, 753, 22
- Burns et al. (2014) Burns, C. R., Stritzinger, M., Phillips, M. M., et al. 2014, ApJ, 789, 32
- Cardelli et al. (1989) Cardelli, J. A., Clayton, G. C., & Mathis, J. S. 1989, ApJ, 345, 245
- Catinella et al. (2005) Catinella, B., Haynes, M. P., & Giovanelli, R. 2005, AJ, 130, 1037
- Cinabro et al. (2016) Cinabro, D., Scolnic, D., Kessler, R., Li, A., & Miller, J. 2016, ArXiv e-prints
- de Vaucouleurs et al. (1991) de Vaucouleurs, G., de Vaucouleurs, A., Corwin, Jr., H. G., et al. 1991, Third Reference Catalogue of Bright Galaxies. Volume I: Explanations and references. Volume II: Data for galaxies between 0h and 12h. Volume III: Data for galaxies between 12h and 24h.
- Downes et al. (1993) Downes, D., Solomon, P. M., & Radford, S. J. E. 1993, ApJ, 414, L13
- Doyle et al. (2005) Doyle, M. T., Drinkwater, M. J., Rohde, D. J., et al. 2005, MNRAS, 361, 34
- Falco et al. (1999) Falco, E. E., Kurtz, M. J., Geller, M. J., et al. 1999, PASP, 111, 438
- Folatelli et al. (2010) Folatelli, G., Phillips, M. M., Burns, C. R., et al. 2010, AJ, 139, 120
- Foley & Kirshner (2013) Foley, R. J., & Kirshner, R. P. 2013, ApJL, 769, L1
- Foley et al. (2016) Foley, R. J., Pan, Y.-C., Brown, P., et al. 2016, ArXiv e-prints
- Freedman et al. (2001) Freedman, W. L., Madore, B. F., Gibson, B. K., et al. 2001, ApJ, 553, 47
- Gehrels et al. (2004) Gehrels, N., Chincarini, G., Giommi, P., et al. 2004, ApJ, 611, 1005
- Goobar (2008) Goobar, A. 2008, ApJL, 686, L103
- Graham et al. (2015) Graham, M. L., Foley, R. J., Zheng, W., et al. 2015, MNRAS, 446, 2073
- Guillochon et al. (2016) Guillochon, J., Parrent, J., Kelley, L. Z., & Margutti, R. 2016, ArXiv e-prints
- Höflich et al. (1998) Höflich, P., Wheeler, J. C., & Thielemann, F. K. 1998, ApJ, 495, 617
- Huchra et al. (2012) Huchra, J. P., Macri, L. M., Masters, K. L., et al. 2012, ApJS, 199, 26
- Jensen et al. (2015) Jensen, J. B., Blakeslee, J. P., Gibson, Z., et al. 2015, ApJ, 808, 91
- Jensen et al. (2003) Jensen, J. B., Tonry, J. L., Barris, B. J., et al. 2003, ApJ, 583, 712
- Jha et al. (2007) Jha, S., Riess, A. G., & Kirshner, R. P. 2007, ApJ, 659, 122
- Jha et al. (2006) Jha, S., Kirshner, R. P., Challis, P., et al. 2006, AJ, 131, 527
- Kattner et al. (2012) Kattner, S., Leonard, D. C., Burns, C. R., et al. 2012, PASP, 124, 114
- Keel (1996) Keel, W. C. 1996, ApJS, 106, 27
- Kessler et al. (2009) Kessler, R., Becker, A. C., Cinabro, D., et al. 2009, ApJs, 185, 32
- Kessler et al. (2013) Kessler, R., Guy, J., Marriner, J., et al. 2013, ApJ, 764, 48
- Kirshner et al. (1993) Kirshner, R. P., Jeffery, D. J., Leibundgut, B., et al. 1993, ApJ, 415, 589
- Koribalski et al. (2004) Koribalski, B. S., Staveley-Smith, L., Kilborn, V. A., et al. 2004, AJ, 128, 16
- Krisciunas et al. (2000) Krisciunas, K., Hastings, N. C., Loomis, K., et al. 2000, ApJ, 539, 658
- Krisciunas et al. (2013) Krisciunas, K., Bastola, D., Espinoza, J., et al. 2013, AJ, 145, 11
- Leibundgut (2001) Leibundgut, B. 2001, ARAA, 39, 67
- Mahdavi & Geller (2004) Mahdavi, A., & Geller, M. J. 2004, ApJ, 607, 202
- Mandel et al. (2011) Mandel, K. S., Narayan, G., & Kirshner, R. P. 2011, ApJ, 731, 120
- Marzke et al. (1996) Marzke, R. O., Huchra, J. P., & Geller, M. J. 1996, AJ, 112, 1803
- Mazzali et al. (2014) Mazzali, P. A., Sullivan, M., Hachinger, S., et al. 2014, MNRAS, 439, 1959
- McClelland (2013) McClelland, C. M. 2013, PhD thesis, University of Notre Dame
- Milne et al. (2013) Milne, P. A., Brown, P. J., Roming, P. W. A., Bufano, F., & Gehrels, N. 2013, ApJ, 779, 23
- Milne et al. (2015) Milne, P. A., Foley, R. J., Brown, P. J., & Narayan, G. 2015, ApJ, 803, 20
- Milne et al. (2010) Milne, P. A., Brown, P. J., Roming, P. W. A., et al. 2010, ApJ, 721, 1627
- Mould et al. (2000) Mould, J. R., Huchra, J. P., Freedman, W. L., et al. 2000, ApJ, 529, 786
- Pan et al. (2014) Pan, Y.-C., Sullivan, M., Maguire, K., et al. 2014, MNRAS, 438, 1391
- Pastorello et al. (2007) Pastorello, A., Della Valle, M., Smartt, S. J., et al. 2007, Nature, 449, 1
- Pereira et al. (2013) Pereira, R., Thomas, R. C., Aldering, G., et al. 2013, A&A, 554, A27
- Phillips (1993) Phillips, M. M. 1993, ApJL, 413, L105
- Phillips et al. (1999) Phillips, M. M., Lira, P., Suntzeff, N. B., et al. 1999, AJ, 118, 1766
- Pisano et al. (2011) Pisano, D. J., Barnes, D. G., Staveley-Smith, L., et al. 2011, ApJS, 197, 28
- Poole et al. (2008) Poole, T. S., Breeveld, A. A., Page, M. J., et al. 2008, MNRAS, 383, 627
- Prevot et al. (1984) Prevot, M. L., Lequeux, J., Prevot, L., Maurice, E., & Rocca-Volmerange, B. 1984, A&A, 132, 389
- Pskovskii (1977) Pskovskii, I. P. 1977, Soviet Astronomy, 21, 675
- Richmond & Smith (2012) Richmond, M. W., & Smith, H. A. 2012, Journal of the American Association of Variable Star Observers (JAAVSO), 40, 872
- Riess et al. (1996) Riess, A. G., Press, W. H., & Kirshner, R. P. 1996, ApJ, 473, 88
- Riess et al. (2016) Riess, A. G., Macri, L. M., Hoffmann, S. L., et al. 2016, ApJ, 826, 56
- Roming et al. (2005) Roming, P. W. A., Kennedy, T. E., Mason, K. O., et al. 2005, Space Science Reviews, 120, 95
- Rothberg & Joseph (2006) Rothberg, B., & Joseph, R. D. 2006, AJ, 131, 185
- Sauer et al. (2008) Sauer, D. N., Mazzali, P. A., Blondin, S., et al. 2008, MNRAS, 391, 1605
- Scalzo et al. (2014) Scalzo, R. A., Childress, M., Tucker, B., et al. 2014, MNRAS, 445, 30
- Schlafly & Finkbeiner (2011) Schlafly, E. F., & Finkbeiner, D. P. 2011, ApJ, 737, 103
- Scolnic & Kessler (2016) Scolnic, D., & Kessler, R. 2016, ApJ, 822, L35
- Theureau et al. (1998) Theureau, G., Bottinelli, L., Coudreau-Durand, N., et al. 1998, A&SS, 130, 333
- Thomas et al. (2011) Thomas, R. C., Aldering, G., Antilogus, P., et al. 2011, ApJ, 743, 27
- Tonry et al. (1997) Tonry, J. L., Blakeslee, J. P., Ajhar, E. A., & Dressler, A. 1997, ApJ, 475, 399
- Walker et al. (2012) Walker, E. S., Hachinger, S., Mazzali, P. A., et al. 2012, MNRAS, 427, 103
- Wang (2005) Wang, L. 2005, ApJL, 635, L33
- Wang et al. (2009) Wang, X., Li, W., Filippenko, A. V., et al. 2009, ApJ, 697, 380
- Wang et al. (2012) Wang, X., Wang, L., Filippenko, A. V., et al. 2012, ApJ, 749, 126
- Wegner et al. (2003) Wegner, G., Bernardi, M., Willmer, C. N. A., et al. 2003, AJ, 126, 2268
- Wood-Vasey et al. (2008) Wood-Vasey, W. M., Friedman, A. S., Bloom, J. S., et al. 2008, ApJ, 689, 377