Broad-band characteristics of seven new hard X-ray selected cataclysmic variables
Abstract
We present timing and spectral analysis of a sample of seven hard X-ray selected Cataclysmic Variable candidates based on simultaneous X-ray and optical observations collected with XMM-Newton, complemented with Swift/BAT and INTEGRAL /IBIS hard X-ray data and ground-based optical photometry. For six sources, X-ray pulsations are detected for the first time in the range , identifying them as members of the magnetic class. Swift J0927.7-6945, Swift J0958.0-4208, Swift J1701.3-4304, Swift J2113.5+5422, and possibly PBC J0801.2-4625, are Intermediate Polars (IPs), while Swift J0706.8+0325 is a short (1.7 h) orbital period Polar, the 11th hard X-ray selected identified so far. X-ray orbital modulation is also observed in Swift J0927.7-6945 (5.2 h) and Swift J2113.5+5422 (4.1 h). Swift J1701.3-4304 is discovered as the longest orbital period (12.8 h) deep eclipsing IP. The spectra of the magnetic systems reveal optically thin multi-temperature emission between 0.2 and 60 keV. Energy dependent spin pulses and the orbital modulation in Swift J0927.7-6945 and Swift J2113.5+5422 are due to intervening local high density absorbing material (). In Swift J0958.0-4208 and Swift J1701.3-4304, a soft X-ray blackbody (kT50 and 80 eV) is detected, adding them to the growing group of "soft" IPs. White dwarf masses are determined in the range , indicating massive accreting primaries in five of them. Most sources accrete at rates lower than the expected secular value for their orbital period. Formerly proposed as a long-period (9.4 h) novalike CV, Swift J0746.3-1608 shows peculiar spectrum and light curves suggesting either an atypical low-luminosity CV or a low mass X-ray binary.
keywords:
novae, cataclysmic variables - white dwarfs - X-rays: individual: Swift J0706.8+0325, X-rays: individual: Swift J0746.3-1608 (aka 1RXS J074616.8-161127), X-rays: individual: Swift J0927.7-6945, X-rays: individual: Swift J0958.0-4208, X-rays: individual: PBC J0801.2-4625 (aka 1RXS J080114.6-462324), X-rays: individual: Swift J1701.3-4304 (aka IGR J17014-4306), X-rays: individual: Swift J2113.5+5422.1 Introduction
Cataclysmic variables (CVs) are close binary stellar systems where a compact
primary, a white dwarf (WD),
accretes matter from a low mass () Roche lobe
filling main-sequence or subgiant secondary.
About one quarter of the whole CV class host strongly magnetized WDs
( G).
The magnetic systems (MCVs) are further divided in two subclasses,
depending on the WD magnetic field intensity and degree of synchronism
(see e.g. Cropper, 1990; Warner, 1995; Hellier, 2014; Ferrario, de Martino & Gänsicke, 2015; Mukai, 2017).
Those showing intense optical/near-infrared (nIR) polarised emission,
the so-called polars (or AM Her stars),
have stronger magnetic fields (B G)
which synchronize the WD rotation with the orbital period
( 80 m – few hours).
The IPs (also known as DQ Her stars) instead are
asynchronous systems (), with a few exceptions do not show detectable polarized optical/nIR
emission, and are consequently believed to host WDs with lower magnetic
field strengths (B G).
Both groups are characterised by periodic X-ray emission at the WD
rotational period, a clear signature of magnetic accretion.
IPs mainly populate the orbital period distribution above the so-called
2–3 h orbital period gap, while polars are generally found
below it (Warner, 1995), suggesting that IPs may eventually
evolve into polars (Norton, Wynn & Somerscales, 2004).
The way in which the material lost from the companion is accreted by the WD,
mainly depends on the WD magnetic field intensity. Eventually, when the flow gets
closer to the WD, it is magnetically channeled along the field lines. Due to the
strong dipolar field in polars, matter lost by the companion is accreted
directly from a stream, while IPs may accrete from a stream or
through a disc, depending on the magnetic moment and the degree of
asynchronysm (Norton, Wynn & Somerscales, 2004; Norton et al., 2008). In the latter case accretion proceeds
from the disc to the WD surface on arc-shaped accretion curtains (Rosen, Mason & Cordova, 1988).
Disc-overflow (a hybrid accretion mode), may also occur depending
on the mass accretion rate (Hellier, 1995; Norton et al., 1997).
Since the velocities in the accretion flow are supersonic a stand-off shock forms. The temperature in the post shock region is high ( keV) and the flow cools and slows down via bremsstrahlung (hard X-ray) and cyclotron (optical/nIR) radiation (Aizu, 1973; Wu, Chanmugam & Shaviv, 1994; Cropper et al., 1999). The efficiency of the cooling mechanisms depends on the WD magnetic field intensity and the local mass accretion rate (Woelk & Beuermann, 1996; Fischer & Beuermann, 2001). The hard X-rays and cyclotron emission are partially absorbed and reflected from the WD surface. The thermalised emission from the WD pole gives rise to a non-negligible soft ( eV) X-ray blackbody component, formerly believed a characteristic of the polar systems only (Beuermann, 1999). The presence of this component has been challenged by XMM-Newton observations showing an increasing number of polars without it (see e.g. Ramsay & Cropper, 2004b; Ramsay et al., 2009; Bernardini et al., 2014). On the other hand, while ROSAT initially detected only a handful of "soft" IP systems (Haberl & Motch, 1995), XMM-Newton has later revealed that a soft X-ray blackbody is also present in a non-negligible number of IPs (Evans & Hellier, 2007; de Martino et al., 2004; Anzolin et al., 2008; de Martino et al., 2008; Bernardini et al., 2012). Compton reflection from the WD surface, considered nearly neutral, produces a non-negligible Fe line at 6.4 keV as observed in all MCVs (Ezuka & Ishida, 1999), as well as a Compton reflection continuum peaking at energies above 10 keV (Done & Magdziarz, 1998), which was unambiguously detected in recent joint XMM-Newton and NuSTAR observations of three bright IPs (Mukai et al., 2015). Complex absorption from neutral material in the dense ( up to ) pre-shock flow, partially covering the X-ray emitting pole, is an additional complication in interpreting the X-ray spectra and spin modulations of MCVs (Rosen, Mason & Cordova, 1988; Mukai, Ishida & Osborne, 1994). Moreover, the detection of absorption edges of ionised Oxygen or Iron in a few IPs (Mukai et al., 2001; de Martino et al., 2008; Bernardini et al., 2012) testifies that the accretion flow can also be ionised also in MCVs, besides low mass X-ray binaries.
Thanks to the deep hard X-ray surveys carried out by INTEGRAL and Swift satellites above 20 keV, and the numerous multiwavelength followup (see e.g. Masetti et al., 2013, and reference therein) the number of MCVs increased rapidly in the last years, the majority being identified as magnetics of the IP class, with a few polars and a handful of non-magnetic systems (Barlow et al., 2006; Bird et al., 2010; Cusumano et al., 2010; Baumgartner et al., 2013). The role of these hard X-ray emitting CVs as dominant contributors to the low-luminosity () X-ray source population in the galactic ridge (GRXE) and Galactic centre is a greatly debated topic for a decade (Muno et al., 2004; Sazonov et al., 2006; Revnivtsev et al., 2009, 2011; Warwick, Byckling & Pérez-Ramírez, 2014; Perez et al., 2015; Hailey et al., 2016). Whether the low-luminosity component is due to non-magnetic CVs or to a still to be discovered large population of IPs accreting at low rates has yet to be established. This would require higher space densities of MCVs than those, still very uncertain, obtained from current observations (see Reis et al., 2013; Pretorius & Mukai, 2014, and reference therein). In this respect, the identification of new systems is important to increase the statistics.
We here present the analysis of simultaneous X-ray and
optical data of seven recently identified candidates,
to unambiguously confirm them as magnetics through the
search for X-ray pulsations and the study of their broad-band
spectral properties. Our source sample consists of
Swift J0706.8+0325, Swift J0746.3-1608, PBC J0801.2-4625, Swift J0927.7-6945,
Swift J0958.0-4208, Swift J1701.3-4304, and Swift J2113.5+5422
(hereafter J0706, J0746, J0801, J0927, J0958, J1701, and J2113, respectively).
Their magnetic candidacy was only based on optical
spectroscopic follow-ups (Masetti et al., 2013; Thorstensen & Halpern, 2013; Parisi et al., 2014; Halpern & Thorstensen, 2015, and references therein).
Spectroscopic orbital periods were recently
determined for J0706 (1.7 h; Halpern & Thorstensen, 2015) and J0746
(9.4 h; Thorstensen & Halpern, 2013), suggesting a Polar and a novalike, respectively.
2 Observations and data reduction
2.1 XMM-Newton observations
The sources were observed between 2015-06-05 and 2016-04-01 by XMM-Newton with the European Photo Imaging Cameras (EPIC: PN, MOS1 and MOS2 Strüder et al., 2001; Turner et al., 2001; den Herder et al., 2001) as main instruments, complemented with simultaneous optical monitor (OM, Mason et al., 2001) photometry. The details of the observations are reported in Table 1. Data were processed using the Science Analysis Software (SAS) version 15.0.0 and the latest calibration files available in 2016 February.
| Source Name | Telescope | OBSID | Instrument | Date | UTstart | Texp a | Net Source Count Rate |
| Coordinates (J2000)α | yyyy-mm-dd | hh:mm | ks | c/s | |||
| Swift J0706.8+0325 | XMM-Newton | 0761120501 | EPIC-PNb | 2015-10-25 | 15:00 | 39.6 | |
| EPIC-MOS1b | 2015-10-25 | 17:03 | 32.0 | ||||
| RA=07:06:48.90 | EPIC-MOS2c | 2015-10-25 | 14:55 | 39.8 | |||
| Dec=+03:24:47.3 | RGS1 | 2015-10-25 | 14:54 | 40.0 | |||
| RGS2 | 2015-10-25 | 14:54 | 40.0 | ||||
| OM-Bd | 2015-10-25 | 15:01 | 6.6 | 17.52 | |||
| Swift | BATf | 7020 | |||||
| Swift J0746.3-1608 | XMM-Newton | 0761120401 | EPIC-PNc | 2016-04-01 | 08:29 | 34.5 | |
| EPIC-MOS1c | 2016-04-01 | 08:23 | 34.7 | ||||
| RA=07:46:17.13 | EPIC-MOS2c | 2016-04-01 | 08:24 | 34.7 | |||
| Dec=-16:11:27.8 | OM-Bd | 2016-04-01 | 08:30 | 31.0 | 16.330.06e | ||
| Swift | BATf | 8710 | |||||
| Swift | XRTg | 106 | |||||
| PBC J0801.2-4625 | XMM-Newton | 0761120301 | EPIC-PNh | 2015-12-04 | 18:50 | 30.0 | |
| EPIC-MOS1h | 2015-12-04 | 18:27 | 31.7 | ||||
| RA=08:01:17.03 | EPIC-MOS2h | 2015-12-04 | 18:28 | 31.7 | |||
| Dec=-46:23:27.5 | OM-Vi | 2015-12-04 | 18:33 | 26.6 | |||
| INTEGRAL | IBIS/ISGRIl | 3530 | |||||
| Swift J0927.7-6945 | XMM-Newton | 0761120901 | EPIC-PNh | 2015-06-05 | 01:10 | 31.6 | |
| EPIC-MOS1h | 2015-06-05 | 00:46 | 33.3 | ||||
| RA=09:27:53.12 | EPIC-MOS2h | 2015-06-05 | 00:47 | 33.2 | |||
| Dec=-69:44:42.0 | OM-Bd | 2015-06-05 | 00:53 | 26.4 | 16.100.02e | ||
| Swift | BATf | 11700 | |||||
| Swift J0958.0-4208 | XMM-Newton | 0761120101 | EPIC-PNh | 2015-05-14 | 04:56 | 37.9 | |
| EPIC-MOS1h | 2015-05-14 | 04:33 | 38.2 | ||||
| RA=09:57:50.64 | EPIC-MOS2h | 2015-05-14 | 04:34 | 38.1 | |||
| Dec=-42:08:35.5 | OM-Bd | 2015-05-14 | 04:39 | 34.0 | |||
| Swift | BATf | 9550 | |||||
| Swift J1701.3-4304 | XMM-Newton | 0761120701 | EPIC-PNh | 2015-09-22 | 15:25 | 30.0 | |
| EPIC-MOS1h | 2015-09-22 | 15:02 | 31.7 | ||||
| RA=17:01:28.15 | EPIC-MOS2h | 2015-09-22 | 15:02 | 31.7 | |||
| Dec=-43:06:12.3 | OM-Bd | 2015-09-22 | 15:08 | 26.6 | |||
| Swift | BATf | 8050 | |||||
| Swift J2113.5+5422 | XMM-Newton | EPIC-PNh | 2015-11-17 | 17:28 | 36.3 | ||
| EPIC-MOS1h | 2015-11-17 | 17:05 | 38.0 | ||||
| RA=21:13:35.40 | EPIC-MOS2h | 2015-11-17 | 17:05 | 38.0 | |||
| Dec=+54:22:32.8 | OM-Vi | 2015-11-17 | 17:04 | 31.0 | |||
| Swift | BATf | 13000 |
α Coordinates of the optical counterpart.
a Net exposure time.
b Large window mode (thin filter applied).
c Small window mode (thin filter applied).
d Fast window mode. The central wavelength of the B filter is 4500 Å.
e OM instrumental magnitude.
f All available pointings collected from 2004 December to 2010 September are summed together.
g All observations available between 2009-08-28 and 2014-06-20 (observation id: 49197, 38960, 40698, 41163, and 90159) are summed together.
h Full frame mode (thin filter applied).
i Fast window mode. The central wavelength of the V filter is 5430 Å.
l All available pointings collected from 2003-04-05 to 2014-12-20 are summed together.
2.1.1 The EPIC and RGS data
For the EPIC data, source photon event lists and spectra were extracted from a circular region of radius 40 arcsec. Background photons were taken from a nearby region of the sky clear from sources contamination, in the same CCD where the source lies, avoiding CCD gaps. For the spectral analysis, high particle background epochs were removed in all instruments, while for the timing analysis, we used the whole data set when possible.
Background-subtracted light curves were also generated with the task epiclccorr in the ranges keV, keV, keV, keV and keV, with different bin size, depending on the source and background flux. The event arrival times were corrected to Solar system barycenter by using the task barycen. Spectra were rebinned before fitting with the task specgroup, in order to have a minimum of 50 and 25 counts in each bin for PN and MOSs, respectively, and to prevent oversampling of the energy resolution by more than a factor of three. Spectra were also extracted as a function of the source rotational phase and of the orbital phase, when applicable. The response matrix and the ancillary files were generated using the tasks rmfgen and arfgen. The spectral fits were made with Xspec version 12.8.2 (Arnaud, 1996).
All sources except J0706, are too faint for a meaningful analysis with the RGS. For that source, the RGS1 and RGS2 spectra from the standard SAS pipeline were used (Table 1).
2.1.2 The Optical Monitor photometry
In all observations the OM was operated in fast window mode using the B-band (3900–4900 Å) filter, except for J0801 and J2113 where the V-band (5100–5800 Å) filter was used due to bright source in their field of view. The background subtracted light curves were generated with the task omfchain, with different bin times ( s) depending on the source flux, and then barycentric corrections were applied.
2.2 The Swift observations
BAT has built up an all-sky map of the hard X-ray sky (14–195 keV), thanks to its wide field of view. For all sources, with the exception of J0801 for which no spectrum is available, we used the archival eight-channel spectra from the first 70 months of monitoring (Baumgartner et al., 2013) available at the NASA GSFC site111http://swift.gsfc.nasa.gov/results/bs70mon/. The sources under study are all detected up to energies keV up to which we restrict our spectral analysis.
We also used XRT archival data to study the long term variability of two sources (J0746 and J0801). For this scope we used the lightcurves and spectra from the XRT products generator (Evans et al., 2009) at the UK Swift Science Data Centre at the University of Leicester222http://www.swift.ac.uk/
2.3 The INTEGRAL observations
For J0801 we extracted the INTEGRAL /IBIS spectrum from all the 1845 public INTEGRAL pointing with RA and Dec . The Offline Analysis Software v. 10.2 distributed by the ISDC (Courvoisier et al., 2003) was used. We built a response with four logarithmically spaced bins between 20 and 100 keV and extracted the source flux using the standard spectral extraction. We derived a sky model from a mosaicked significance map in the 20-100 keV band, which includes 39 sources, and an average mission background, retrieved from the calibration files. The spectral analysis of J0801 is further restricted below 80 keV.
2.4 Optical ground based photometry
The detection of deep X-ray and optical eclipses in J1701 (Section 4.6) motivated the search for its orbital period using optical ground-based photometry.
J1701 was repeatedly observed during ten days with the 1-m network of robotic optical telescopes in the Las Cumbres Observatory (LCO), from 2016-06-06 20:29:08 UT to 2016-06-16 03:34:33 UT. Six telescopes were used, located at three sites, Cerro Tololo (Chile), South African Astronomical Observatory (SAAO), Sutherland (South Africa) and Siding Spring (Australia). Imaging was obtained in the Sloan Digital Sky Survey (SDSS) -band with exposure times of 40 s. The coverage was typically 40 minutes about three times in 24 hours. A total of 328 usable images were acquired. The automatic Las Cumbres Observatory (LCO) pipeline BANZAI provides users with bias and flat-field corrected science images. Additional photometry was acquired during seven nights for about 5 hours consecutively from 2016-07-27 00:05:13 UT to 2016-08-07 06:08:00 UT with the robotic 0.6 m INAF REM telescope in La Silla, Chile (Zerbi, Chincarini & Ghisellini, 2004). The telescope is equipped with the ROSS2 camera333http://www.rem.inaf.it that performs simultaneous exposures in the Sloan filters g’, r’, i’ and z’ and with the REMIR camera (Conconi, Cuniffe & D’Alessio, 2004) covering simultaneously the near-IR band. Integration times were 150 s for all optical filters and a dithering of 5 exposures of 60 s each was used for the REMIR J-band. Both ROSS2 and REMIR data sets were reduced using standard routines of IRAF to perform bias and flat-field corrections. Due to the low response of the z’ filter the corresponding images have not been analysed. For the REMIR observations the five dithered images were merged into a single frame. A total of 483 useful science images were secured in each g’,r’,i’ filters while 251 were obtained in the J band.
Aperture photometry was performed on both LCO and REM data sets optimizing aperture radius and sky subtraction by adopting annuli of different sizes. Comparison stars were used to check and to correct for variable sky conditions. REM/ROSS2 and REMIR photometry was calibrated using the Sloan standards SA 104 428, SA 114 531 and SA 093 317 observed each night in July and August, respectively, whose near-IR magnitudes are also tabulated in the 2MASS catalogue (Skrutskie et al., 2006) 444http://www.ipac.caltech.edu/2mass/. The LCO photometry was instead calibrated using three comparison stars with known g’ magnitudes. Both data sets in the g’ band agree within 9 per cent. Average magnitudes are: g’=, r’=, i’=, and J= mag.
J1701 is also identified in the AAVSO Photometric All-Sky Survey (APASS)555http://www.aavso.org/apass as GDS J1701281-430612 (Henden et al., 2016). It was recently observed by AAVSO from 2016-09-20 23:15:19 UT to 2016-10-27 10:46:14 UT with several filters. For our purposes, we selected the most dense coverage in the V-band, including clear (unfiltered) reduced to V-band observations, totaling 3943 photometric measures. The average V magnitude is .
All light curves were corrected to the Solar system barycentre.
3 Data analysis
In this section, we describe the common procedures adopted for all sources to perform the timing and spectral analysis. We present the results, for each source individually, in Section 4.
3.1 Timing analysis
Light curves in the 0.3–12 keV range (PN and MOS) and in the optical OM B or V bands were first inspected for short and long-term variability (Figure 1). Then power spectra were computed to identify periodic signals in the two energy domains. A phase-fitting technique (see e.g. Dall’Osso et al., 2003, for details on the technique), was then used for an accurate period determination of the stronger signal. In case of additional significant peaks, the periods were determined using the FTOOLS666 http://heasarc.gsfc.nasa.gov/ftools/ task efsearch (Blackburn, 1995).
We interpreted the pulsation associated with the main peak in the power spectrum as the WD spin period (P), the lower signals to sidebands (P) and, when present, to the orbital (P) periods. The most common and stronger sideband observed in IPs is the beat () between the spin and the orbital () periods and, when present, we used it to estimate the orbital period.
For those sources displaying detectable orbital variability, a fit using one or more sinusoids (the fundamental plus possible harmonics) was performed to estimate the orbital period in the X-ray (P) and optical (P) bands. The two procedures were verified to give consistent results.
Spectral variations along the spin period were first inspected by folding at P the background subtracted source light curves extracted in five energy bands: 0.3–1, 1–3, 3–5, 5–12 keV and computing the hardness ratios (HR) defined as the count rate ratio in each phase bins between two selected energy ranges. A quantitative analysis (Table 2, second column) was then performed by fitting the pulses in the above bands with a Fourier sine series truncated at the highest significant harmonic. For each energy interval, the pulsed fraction was computed as: , where and are respectively the maximum and minimum amplitudes of the sinusoid at the fundamental frequency.
| Source | P | P | P | P | A/A | P | P | P |
| s | s | h | h | s | h | h | ||
| J0706 | - | - | PPΩ | - | - | - | 1.70180.0003 [1] | |
| J0746 | a | - | - | - | - | - | 5.030.10 b | 9.38410.0002 [2] |
| J0801 | - | - | - | - | - | - | ||
| J0927 | () | - | 5.150.10 [3] | |||||
| J0958 | - | - | - | - | - | - | - | |
| J1701 | 18593 | - | - | - | - | 12.816620.00012d | 12.816620.00012 [3] | |
| J2113 | 1265.64.5 | 1373.82.6 () | 4.020.10 | - | 3.630.11 | 4.020.10 [3] |
a Short-term variability with timescale of about 2700 s is present in the first half of the observation only.
b Period derived from OM data (=2PΩ).
c Spin period derived from AAVSO V-band photometry. From OM we get s.
d Orbital period derived from multi-site optical photometry.
[1] Halpern & Thorstensen 2015; [2] Thorstensen & Halpern 2013; [3] This work.
3.2 Spectral analysis
The study of the broad-band (0.3–80 keV) spectral properties of each source was first accomplished on the grand-average PN, MOS1 and MOS2 spectra together with the corresponding Swift-BAT or INTEGRAL -IBIS spectra fitted simultaneously. Calibration discrepancies between different instruments were taken into account by including in the fits an inter-calibration constant which only for the PN is fixed to one. This constant also accounts for the non simultaneity of the BAT(IBIS) spectra with those from the EPIC cameras and so for possible source long-term variability. All model parameters were linked between different instruments expect the multiplicative constants.
The sources under study display thermal spectra and most of them also show emission features at the iron complex. These are generally observed in the MCVs which have multi-temperature spectra locally absorbed by high dense cold material (see e.g. Done, Osborne & Beardmore, 1995; Ezuka & Ishida, 1999; Beardmore, Osborne & Hellier, 2000; de Martino et al., 2004; Anzolin et al., 2009; Bernardini et al., 2012; Mukai et al., 2015). Therefore, the spectra were fitted with a composite model consisting of one or more optically thin plasma components (bremss, mekal or cemekl in xspec), with metal abundances (AZ) with respect to Solar from Wilms, Allen & McCray (2000) left free to vary, absorbed by a total (phabs) and one or two partial (pcfabs) covering columns and a narrow Gaussian line fixed at 6.4 keV to account for the fluorescent Fe Kα feature. When needed, a blackbody component (bbody) was also included to model a soft excess in the residuals. Despite the presence of the 6.4 keV feature the inclusion of a reflection component (reflect) does not improve the fit quality in any of the sources under study, indicating that higher quality spectra above 10 keV are needed (see also Mukai et al., 2015). Additionally, to obtain a more reliable estimate of the mass of the accreting WD, the broad-band continuum spectra were also fitted with the more physical post-shock region (PSR) model developed by Suleimanov, Revnivtsev & Ritter (2005). This model takes into account both temperature and gravity gradients within the PSR in bremsstrahlung dominated regimes where cyclotron cooling is negligible, and thus applicable to those sources identified as IPs and, with caution, also to a low-field polar (see Sect. 4.1.2). To this purpose, for those sources showing soft complexities, the spectra were analysed above 1–3 keV to avoid the effect of absorption and heavily rebinned to smear emission lines, except the iron line complex, which is accounted for by a broad Gaussian.
To unveil the role of spectral parameters in producing the X-ray spin(orbital) modulations, a pulse-phase spectroscopy (PPS) analysis was performed on the EPIC spectra extracted at spin(orbital) maximum and minimum, which were fitted separately. For each source we adopted the spectral models and parameters obtained from the phase average spectral fits, fixing the column density of the total absorber and the metal abundance at their best fit values. All other parameters were left free to vary in the spin PPS analysis. In the orbital PPS analysis only the partial covering absorbers and the mekal(s) normalization(s) ( and ) were left free to vary when this extra free component is statistically significant (F-test verified).
4 Results
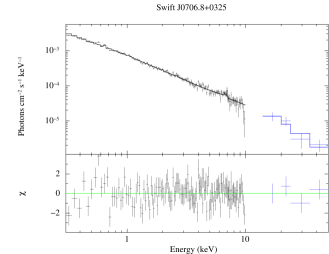
4.1 Swift J0706.8+0325
J0706 has been recently identified by Halpern & Thorstensen (2015), where it appears as PBC J0706.7+0327, as a short (1.7 h) orbital period CV and proposed as a polar based on its emission line variations and large amplitude optical modulation.
4.1.1 Timing analysis
The X-ray light curve covers about seven cycles of an almost on-off modulation, although the count rate does not drop to zero at minima (Figure 1). From a multi-sinusoidal fit to reproduce the shape of the modulation, we get a period of s, which is within consistent with the more accurate orbital period ( s) determined by Halpern & Thorstensen (2015) with optical spectroscopy (Table 2). This allows to interpret the X-ray period as the spin of the WD which is synchronised with the binary orbit. Thus, J0706 is unambiguously identified as a polar system. The OM B-band photometry being affected by technical problems is not used in the present study.
The X-ray light curves at different energies were folded using the spectroscopic ephemeris of Halpern & Thorstensen (2015).The modulation shows a broad asymmetric maximum extending 0.6 in phase. It is structured below 3 keV with a lower count rate during the first half of the maximum and a dip at followed by a higher rate lasting in phase. It is instead flatter for E keV (Figure 2). The faint phase (pulse minimum) is slightly flatter above 3 keV, while it shows a smooth decline below it. The PF varies from 75 per cent in the 0.3-1 keV band to 45 per cent in the 5–12 keV band (Table 3). The modulation reveals the typical bright and faint phases seen in the polars, which are produced by the accretion flow above the main (or upper) pole which comes into (bright phase) and out of (faint phase) view if the magnetic and rotation axes are offset by an angle defined as the magnetic colatitude, and shifted in azimuth () (see Cropper, 1988). The non-zero count rate during the faint phase could suggest either that the accreting upper pole does not completely disappear behind the WD limb or that a second emitting region is present. The length of the faint phase can be used to restrict the range of values of the binary inclination and colatitude of the main pole (Cropper, 1990). The lack of eclipses implies . These give for . The energy dependence of the dip and pre-dip maximum is reminiscent of absorption from the accretion stream at the threading of magnetic lines as seen in other polars (e.g. Ramsay & Cropper, 2007; Ramsay et al., 2009; Bernardini et al., 2014), implying . This further restricts the binary inclination to . Additionally, the fast rise/decay of the bright phase can be used to estimate the extent of the emitting region. However, both bright and faint phases suffer from cycle-to-cycle variability, thus a rise time of s is estimated from the more symmetric profiles observed at the , and cycles. A similar decay time is observed in these cycles. This gives an azimuthal extent of the spot of 35o, assuming no lateral extent.
 |
 |
 |
 |
 |
 |
 |
 |
 |
 |
| Source | Pulsed Fraction | n | ||||
|---|---|---|---|---|---|---|
| 0.3–1 keV | 1–3 keV | 3–5 keV | 5–12 keV | 0.3–12 keV | ||
| % | % | % | % | % | ||
| J0706a | 75(1) | 71(1) | 60(2) | 45(2) | 68(1) | 3 |
| J0927b | 37(4) | 52(3) | 40(2) | 23(2) | 33(1) | 3 |
| J0958c | 38(2) | 30(2) | 23(4) | 7(2) | 20(1) | 2 |
| J0801d | 20(2) | 15(3) | 12(6) | 9(6) | 15(2) | 1 |
| J1701 | 70(3) | 55(2) | 28(2) | 18(2) | 36(1) | 2 |
| J2113 | 31(5) | 22(1) | 14(1) | 9(1) | 15(1) | 1 |
a The PF is calculated using the more accurate optical spectroscopy period (6126.36 s) from Halpern & Thorstensen 2015.
b For E keV only, the first harmonic has the highest PF ( per cent).
c Results refer to the first 26 ks of the pointing only. The last 12 ks are removed because of high background contamination.
d Results refer to the second half of the pointing only, where the background level is low.
4.1.2 Spectral analysis
While a simple optically thin plasma with kT keV and absorbed by only a partial covering column well fit the average broad-band spectrum (, 336 d.o.f.), a multi-temperature plasma cemekl with (fixed), keV, and with the same underabundance gives the same and alleviates a problem of the inter-calibration constant between the EPIC and BAT spectra. Despite this, the partial covering parameters are less constrained (Table 4 and Figure 3). The source spectrum does not require either a soft blackbody component or a Gaussian for the 6.4 keV line. Furthermore, only a upper limit to the hydrogen column density of the total absorber is derived, a factor lower than the total value in the source direction (Kalberla et al., 2005). This suggests that the source distance is small as also indicated by its large proper motion (Skinner, Thorstensen & Lépine, 2014; Halpern & Thorstensen, 2015). To independently verify that the post-shock plasma is not isothermal we performed a joint EPIC+RGS fit using the one-T model with the temperature, abundance, and absorbing partial covering column parameters fixed to the values obtained in the EPIC+INTEGRAL /IBIS fit. The new fit clearly shows an excess at 0.57 keV, and probably also around 0.65 keV. Allowing for an additional simple absorber and narrow Gaussians, we measure a line at 0.573 keV ( Å) with an equivalent width EW eV at 90 per cent confidence, and less robustly a probable line at 0.65 keV. These are identified as the He-like triplet of OVII and H-like line of OVIII, neither of which is in the best-fit 1-T model. These lines indicate the presence of plasma at keV, likely forming at the base of the post-shock region. We conclude that the shock plasma is indeed not isothermal and consider the cemekl model the best description of the data. Although the PSR model is not applicable to polars, J0706 is likely a low-field Polar (Sect. 4.1.3) and thus cyclotron cooling should not strongly affect the PSR structure. With this note of caution, we consider the derived WD mass from PSR model a lower limit which results: (Table 5).
Both parameters of the multi-temperature plasma decrease at orbital minimum as expected in a polar system, where the main accretion spot comes in and out of view along the orbital cycle. The absorption component is poorly constrained and we are unable to assess whether this contribution is important at the orbital minimum (Table 6).
| source | mod. | N | N | cvf | N | cvf | kTBB | kTc | kTh | n | nc | nh | AZ | EW | F0.3-10 | FX,bol |
|---|---|---|---|---|---|---|---|---|---|---|---|---|---|---|---|---|
| /dof | cm-2 | cm-2 | % | cm-2 | % | eV | keV | keV | keV | erg/cm2/s | erg/cm2/s | |||||
| J0706 | cemeka | - | - | - | - | - | - | |||||||||
| 1.05/336 | ||||||||||||||||
| J0746c | mek | - | - | - | - | - | - | - | - | - | ||||||
| 1.10/125 | ||||||||||||||||
| J0746d | A:mek | - | - | - | - | - | - | - | - | 1 (fix) | - | |||||
| 1.33/53 | ||||||||||||||||
| J0746d | B:mek | - | 48(6) | - | - | - | - | - | - | 1 (fix) | - | |||||
| 0.89/52 | ||||||||||||||||
| J0801 | brem+pow | - | - | - | 1.0(1)e | - | 0.14(4)e | - | 2.7(1) | |||||||
| 1.33/251 | ||||||||||||||||
| J0927 | mek | - | - | - | - | |||||||||||
| 1.32/320 | ||||||||||||||||
| J0958 | BB+mek | - | - | - | - | |||||||||||
| 1.08/294 | ||||||||||||||||
| J1701 | BB+2mek | - | - | |||||||||||||
| 1.10/366f | ||||||||||||||||
| J2113 | 2mek | - | - | |||||||||||||
| 1.05/370f |
Blackbody normalization defined as , where is the source luminosity in units of erg/s and is the distance to the source in units of 10 kpc.
a Multi-temperature power-law index fixed to 1.
b upper limit (results refer to a model without this component).
c Fit results for EPIC data only.
d Fit results for XRT plus BAT data.
e Power law photon index and normalization.
f BAT inter-calibration constant is for J1701, and for J2113.
g lower limit.
 |
 |
 |
 |
 |
 |
| Source | a | b | c |
|---|---|---|---|
| pc | |||
| J0706 | 230 | ||
| J0801 | 250 | ||
| J0927 | |||
| J0958 | 720–1100 | ||
| J1701 | 1000 | ||
| J2113 |
a Derived from PSR model.
b Adopted distances.
c Derived from accretion luminosity (see text for details) and using the quoted masses.
| source | N | cvf | N | cvf | kTBB | kTc | kTh | nBB | nc | nh | EW | F0.3-10 | /dof |
|---|---|---|---|---|---|---|---|---|---|---|---|---|---|
| 1022 cm-2 | % | 1022 cm-2 | % | keV | keV | keV | keV | ||||||
| J0706 | |||||||||||||
| max (=0.70-1.20) | - | - | 22(6) | - | - | 45.8 (fix) | - | - | 12.90.1 | - | 9.9(4) | 0.85/105 | |
| min (=0.30-0.60) | - | - | - | - | - | - | 5.22 | - | 1.26/24 | ||||
| J0801 | |||||||||||||
| max () | 4.6(7) | 72(7) | - | - | - | 1.05(8) | 0.8(3)c | - | 2.3(5) | 0.10(4)c | 3.1(1) | 1.09/137 | |
| min () | 41(25) | - | - | - | 0.8(4) | 1.4(3)c | - | 0.5(1) | 0.3(1)c | 0.3(1) | 2.4(2) | 1.13/141 | |
| J0927 | |||||||||||||
| max () | 2.8(5) | 76(3) | 27(4) | 74(3) | - | - | 17(5) | - | - | 7.8(5) | 0.16(3) | 6.6(2) | 1.15/160 |
| min () | 6.2(17) | 92(3) | 76(7) | - | - | - | - | 6.8(8) | 0.16(5) | 4.7(3) | 1.03/47 | ||
| J0958 | |||||||||||||
| max () | - | - | 17.5(27) | 61(3) | 0.078(4) | - | 0.09(2) | - | 4.1(2) | 0.21(4) | 5.2(2) | 1.17/157 | |
| min () | - | - | 15.0(25) | 69(2) | 0.067(9) | - | 36.27 (fix)a | 0.07(4) | - | 3.0(2) | 0.37(8) | 3.6(1) | 1.17/59 |
| J1701 | |||||||||||||
| max () | 7.4(7) | 52(2) | - | - | 0.053(2) | 79.9 (fix)a | 0.90(3) | 6.6(4) | 0.11(2) | 9.6(1) | 1.16/271 | ||
| min () | 10.2(7) | 82(1) | - | - | 0.048(7) | 7.5(17) | 79.9 (fix)a | 0.96(3) | 4.8(4) | 0.18(2) | 6.3(1) | 1.11/208 | |
| J2113 | |||||||||||||
| max () | 3.1(6) | 67(4) | 15(4) | 42(8) | - | 4(2) | 28(6) | - | 2.2(5) | 7.0(6) | 0.07(2) | 10.1(3) | 0.88/256 |
| min () | 3.9(7) | 78(4) | 32(10) | - | 5(2) | - | 3.1(4) | 5.5(10) | 0.09(2) | 8.5(4) | 0.82/245 |
a Fixed to the average spectrum best-fit value.
b lower limit.
c Power law photon index and normalization.
4.1.3 A hard X-ray and low-B field polar
J0706 was identified in the nIR at =14.54 mag (Skinner, Thorstensen & Lépine, 2014). It also appears in the 2MASS catalogue as 2MASS J07064892+0324472 with J=, H14.843 and K= mag. It is further detected in the mid-IR with the Wide-field Infrared Survey Explorer (WISE) (Wright et al., 2010) as WISE J07064895+0324469 in the W1 (3.35m), W2 (4.6m), and W3 (11.6m) bands: W1=, W2= and W3= mag. The upper limit to the column density of a total absorber indicates that extinction is negligible and translate to (Güver & Özel, 2009). The 2MASS colour J-K= is consistent with a late type (M5–M6 V) donor star (Straižys & Lazauskaitė, 2009). A M5.3 V spectral type is also expected for a donor in a 1.7 h binary (Smith & Dhillon, 1998). However, though WISE and 2MASS data are not contemporaneous, the K-W1 , W1-W2, and W2-W3 colours are much redder for such spectral type (Pecaut & Mamajek, 2013), indicating a mid-IR excess. A number of polars studied in the nIR and mid-IR have also shown extreme colours in the WISE bands (W2-W31; Harrison et al., 2013; Bernardini et al., 2014; Harrison & Campbell, 2015), ascribed to cyclotron radiation with the fundamental harmonic falling in the W3 band (Harrison & Campbell, 2015). The IR excess in the case of cyclotron origin is also expected to be variable at the orbital-rotational period, but the single exposure WISE data are too sparse to reveal a modulation. The position of J0706 in the mid-IR colour-colour diagram (W1-W2;W2-W3, see Figure 1 in Harrison & Campbell, 2015) falls in a region consistent with the presence of a cyclotron fundamental in the W3 band. This suggests a moderately low magnetic field ( G). We then use 2MASS K-band magnitude to estimate the distance. Adopting a M5–M5.6 V donor with (Knigge, 2006), the observed K band magnitude implies a distance of 150–300 pc. We therefore assume a distance of 230 pc for J0706. An estimate of the mass accretion rate is obtained assuming for the accretion luminosity , where and are the X-ray optically thin bolometric and cyclotron luminosities. The latter, as estimated from the mid-IR flux excess, is for a distance of 230 pc, and contributes only to the total luminosity. With , adopting and its corresponding radius of 7.07 cm (Nauenberg, 1972)777The WD Mass-Radius relation by Nauenberg (1972) is adopted throughout this work., a mass accretion rate of is obtained (Table 5). This is in remarkable agreement with the expected secular mass transfer rate for gravitational losses (Warner, 1995) for a system with =1.7 h and a mass ratio q=0.25 having adopted for the M5 donor (Knigge, 2006).
The lack of a soft X-ray blackbody component is not surprising given the recent discovery of an increasing number of polars not displaying such soft X-ray emission (Ramsay & Cropper, 2004b). A shift to the EUV or FUV bands due to large footprints may be possible. However, as pointed out by Ramsay et al. (2009), there is no obvious explanation for why these hard polars should have larger accretion areas, since their orbital period and magnetic field strengths are not so different from other polars. The hard X-ray detection of polars also poses the question of whether the few (now 11) that are hard X-ray selected possess lower magnetic fields and/or more massive WDs. J0706 appears to show both properties.
4.2 Swift J0746.3-1608
J0746 was identified as a CV independently by Thorstensen & Halpern (2013), where it figures as Swift J0746.2-1611, and Parisi et al. (2014), and proposed as either a novalike system or a magnetic system because of its optical spectral characteristics. From the late-type secondary absorption lines Thorstensen & Halpern (2013) derived a long orbital period of 9.38 h and a distance of pc.
4.2.1 Timing analysis
The X-ray lightcurve888The last quarter of the XMM-Newton pointing was removed from the analysis because it was affected by high background level. shows a faint source ( c/s, in the PN). In the first half of the pointing there are at least five flare-like events of variable amplitude (up to a factor of 6) with timescale of about 2700 s (Figure 4), but these do not appear to be periodic. The HR vs time are constant within uncertainty. The optical (B-band) light curve (Figure 4), where no flares are detected, shows instead a modulation with amplitude B = 0.10 mag. Although covered only for two cycles, we estimate a period of 5.030.10 h, about half the spectroscopic orbital period found by Thorstensen & Halpern (2013). These authors did not detect any modulation in their photometry of Jan. 2013, but instead an erratic variability. This indicates that this source is variable on a long-term timescale (yrs).
Indeed Thorstensen & Halpern (2013) presented the Swift-XRT light curve of J0746 covering the period between 2009 and 2011. The source is highly variable with count rate changing up to a factor of on timescale of a few hours. Two additional pointings in Jun. 2013 and Aug. 2015 showed the source had faded to a count rate of 0.05 c/s from a maximum of about c/s during 2009–2011. It then appears that a substantial change of the X-ray fluxes occurred after 2011. We then inspected the Swift-UVOT photometry acquired since 2009, in the U, UVW1 and UVW2 filters. The source also faded in the UV and U bands after June 2011, by 1.3 and 1.0 mag, respectively. We further inspected the optical long-term history using B-band photometric measures from USNO-A2 catalogue (B=13.4 mag, in 1953), USNO-B1 catalogue (B1=14.5 and B2=14.7 mag, in 1971), the Guide Star Catalogue (GSC 2.2) (B= mag in 1984), and the APASS catalogue (B= mag in Jan.2011). These, compared with the OM photometry (B= mag), further confirm the fading at optical wavelengths. The double humped orbital modulation in the B band observed with the OM could be due to ellipsoidal modulation of the donor star filling its Roche lobe. The two minima of the light curve correspond to the inferior and superior conjunction of the secondary, according to the spectroscopic ephemeris of Thorstensen & Halpern (2013). The lack of multi-band photometry does not allow to further investigate the origin of the optical modulation and so to confirm this hypothesis.
 |
 |
4.2.2 Spectral analysis
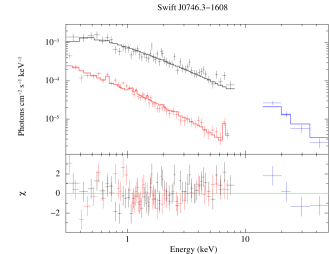
Due to the remarkable long-term X-ray variability, the EPIC spectra were fitted without the high-energy coverage from the Swift-BAT instrument, which would require an unfeasible inter-calibration constant as high as 100. This suggests that when observed by XMM-Newton the source was much fainter than its average over many years. The spectrum (Table 4 and Figure 4) is satisfactorily fitted with a mekal with kT keV and A (, 125 d.o.f.). Similar is also obtained using a simple power law (with photon index ), but an excess results at the iron complex. This makes us prefer the former model. The absorption is very low, with a upper limit of N cm-2, at least a factor 10 lower than the total galactic column density in the direction of the source that lies in the dust lane and consistent with the optical extinction by Thorstensen & Halpern (2013). The absorbed 0.3–10 keV flux is low () indicating a very low mass accretion rate and consequently a negligible intrinsic absorption. Furthermore, the lack of a fluorescent line at 6.4 keV is also consistent with such low state, where reflection from cool material is negligible. No significant spectral change, except for the normalization of the mekal, is found extracting the in-flare and out-flare spectra, as also indicated by the constant HR.
Given the source long-term X-ray variability, we analysed the average XRT spectrum which covers the higher state observed between Aug. 2009-Jun. 2011 (IDs: 38960, 40698, 41163 and 90159). We fitted the broad-band XRT+BAT spectrum adopting a thermal component, since a power law fails to account for the BAT data. We first used model A, a mekal (with the abundance fixed to Solar) multiplied by phabs obtaining kT keV and N cm-2 (, 53 d.o.f.). An improved fit is found using model B, where a partial covering absorber is used in place of phabs (when using both, the latter is totally unconstrained) and gives kT keV, N cm-2, and cvf= per cent (, 52 d.o.f.). Here we note that the former fit gives a column density in line with the estimated extinction (Thorstensen & Halpern, 2013). We notice that for both models the BAT inter-calibration constant is now consistent with unity, within uncertainty. The XRT 0.3–10 keV flux is , a factor 17 larger than in the XMM-Newton observation (Table 4 and Figure 4). If instead compared with the maximum flux recorded by XRT, the source in April 2016 is a factor of fainter.
4.2.3 An atypical low accretion rate CV or a LMXB?
J0746 faded after 2011, and in April 2016 it was at its lowest level ever observed. At the distance of 900 pc, the bolometric X-ray luminosities in the high and low states are and , respectively. Both values, for a WD mass in the range 0.6–0.8 M⊙ would give accretion rates of and , respectively. These fall too short (at least 2–3 orders of magnitudes) with respect to those of systems above the gap (McDermott & Taam, 1989; Howell, Nelson & Rappaport, 2001), unless evolved donors are taken into account (Goliasch & Nelson, 2015).
The short and long-term X-ray and optical variabilities observed in J0746 are difficult to reconcile with a long-period nova-like CV that is expected to have a large accretion disc that acts as a reservoir. Furthermore the lack of periodic pulsations (with the caveat of the low S/N) in the typical range of MCVs, also rules out the possibility that this systems harbours a magnetic WD. The peculiar flaring activity, the low luminosity level in both high and low states poses the question on whether J0746 is indeed a CV or a low-mass X-ray binary (LMXB). X-ray variability and luminosities down to are observed in transient LMXBs (with both neutron star or black hole primaries) during quiescence (e.g. Hynes et al., 2004; Degenaar & Wijnands, 2012; Bernardini et al., 2013a; Bernardini & Cackett, 2014). Those harbouring neutron stars (NS) show X-ray spectra generally revealing the optically thick thermal emission from the NS atmosphere at several tens of eV and/or a power law hard tail ascribed to non-thermal emission processes possibly related to the magnetic field of the NS (see e.g. Degenaar & Wijnands, 2011, 2012). Black hole LMXBs, so far discovered through their strong outbursts except for a recent detection by Tetarenko et al. (2016), show hard X-ray power laws during quiescence (with power law index very close to 2 Plotkin, Gallo & Jonker, 2013, e.g. higher than in the case of J0746). The Swift long-term monitoring does not give evidence that J0746 has undergone an outburst over the last 7 years and its spectrum, especially during the high state, seems to be thermal (and not a simple power law). On the other hand, the observed behaviour in J0746 may be reminiscent of the sub-luminous states of two LMXBs, PSR J1023+0038 and XSS J12270-4859, harbouring millisecond pulsars (MSPs) that initially were wrongly classified as CVs (see Archibald et al., 2009; de Martino et al., 2010). These pulsars were observed to transit from LMXB to MSP radio phases and vice versa and consequently defined as transitional MSPs (tMSPs; Archibald et al., 2009; de Martino et al., 2010, 2013; Bassa et al., 2014; de Martino et al., 2014, 2015; Bogdanov et al., 2015). During the LMXB state, they show peculiar high (persistent emission) and low (dips) modes besides erratic flaring activity, with msec pulses detected during the high mode only (Archibald et al., 2015; Papitto et al., 2015). In J0746 dipping behaviour is not observed, but we are unable to search for pulsations in the 1–10 msec range, due to the temporal resolution of the EPIC camera. Furthermore, differently from J0746, the X-ray spectra of tMSPs are featureless and described with a simple power law.
Additionally, at the X-ray levels observed in J0746 and drawing similarities with two tMSPs, a detection of a Gamma-ray source by Fermi-LAT would have been possible. However, we inspected possible Gamma-ray positional associations of J0746 and found that the only close Fermi-LAT source is 3FGL J0748.0-1639, but it is 37.6 arcmins away. The Fermi-LAT catalogue (Acero et al., 2015) gives a 95 error ellipse of 0.12 deg0.14 deg, excluding a positional association with J0746. Furthermore, this source has a different Gamma-ray spectrum than those of the tMSPs. We also inspected radio catalogues through the Heasarc website and found no radio source consistent with the position of J0746 999The closest source seems to be OI-173, a bright (200 mJy at 20 cm) radio source, but is 2.9 arcmin away from J0746 (Dixon, 1995).. In summary, the lack of positional Gamma-ray or radio association does not support a MSP classification.
While a quiescent LMXB in a prolonged (years) low state could not be excluded, the thermal spectrum of this source may favour an atypical low luminosity CV. High and low states seen in J0746 could be explained if the donor is not completely filling its Roche-lobe allowing for fast changes in the accretion rate as well as accounting for the low state after 2011. CVs entering extended low states are seen in the VY Scl star subclass, but they have shorter orbital periods (typically 3–4 h). This system poses the same questions regarding the true nature of the low-luminosity CV, V405 Peg, which is however just at the upper end of the VY Scl stars orbital periods ( h; Schwope et al., 2014). The other type of CVs undergoing high and low states on timescales of years are the polars, but our data do not support a magnetic nature. In particular at the long orbital period of J0746, no Polars are known except for V1309 Ori ( h, B G), which however is a blobby-accretor and displays one of the most extreme soft-to-hard flux ratios (de Martino et al., 1998; Schwarz et al., 2005). J0746 does not share any similarity with this system. On the other end, the optical spectra acquired in 2010 (Thorstensen & Halpern, 2013; Parisi et al., 2014) show intense emission lines of Balmer series and He II, with and He II(4686 Å) equivalent width ratios similar to those observed in polars and novalikes and much larger than those observed in LMXBs (van Paradijs & Verbunt, 1984).
In conclusion there are no strong indications favouring either an LMXB or a typical long-period CV, but if its X-ray spectrum is indeed thermal as it seems more likely, we suggest it could be a CV accreting at an unusually low rate for its long orbital period. This is not in disagreement with the recent results by (Pala et al., 2017) who also found several long-period CVs accreting at unexpectedly low rates. Both an X-ray monitoring and a new long X-ray observation of J0746 in a higher state are desirable to shed light into the true nature of this peculiar source.
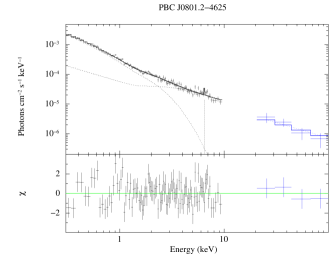
4.3 PBC J0801.2-4625
J0801, =1RXS J080114.6-462324 in Masetti et al. (2010), was identified by those authors as a CV and tentatively suggested as magnetic. It was observed in April 2016 by Swift-XRT due to a possible, though uncertain, association with the fast soft X-ray transient MAXI J0758-456 (Masumitsu et al., 2016; Kennea et al., 2016).
4.3.1 Timing analysis
The X-ray and V-band light curves display clear short term variability. The power spectra in both bands show a strong, isolated, peak at Hz. We measure a period of s in the X-ray band and s in the V-band, respectively that we interpreted as the spin period of the accreting object. The 0.3–12 keV and V-band pulses are broadly in phase and have similar PF ( per cent and per cent, respectively). The X-ray PF slightly decreases with energy, from per cent in the softer to per cent in the harder band (Table 3 and Figure 2).
Given the purported association to the transient detected by MAXI a compact star spinning at 1300 s could be either a NS or a WD. However, slow NS rotators at the rate observed in J0801 are found only in high-mass X-ray binaries, and in the few known symbiotic X-ray binaries and none detected in LMXBs (Patruno & Watts, 2012). The optical spectrum (Masetti et al., 2010) clearly disfavors an early type counterpart as well as a K–M giant. Furthermore, the presence of the pulsation in both the X-ray and optical bands is typically observed in CVs being the optical spin modulation produced in the magnetically confined accretion flow onto the WD poles. The more energetic LMXBs do not generally show optical spin pulsations. Therefore, the X-ray and optical modulations in J0801 strongly suggest a MCV of the IP type. The presence of only the spin period further implies that that accretion occurs via a disc (Rosen, Mason & Cordova, 1988).
4.3.2 Spectral analysis
The EPIC spectra of J0801 are not easy to reconcile with the typical X-ray spectra of magnetic CVs. This is the only source of the sample for which a model based on a thermal continuum do not provide the best fit in terms of . The combined XMM-Newton and INTEGRAL broad-band spectrum can instead be described by a simple model (Table 4 and Figure 3) consisting of bremss with kT keV and a power law with photon index (dominating for keV) plus a Gaussian at 6.4 keV with EW eV, all multiplied by pcfabs with N cm-2, and cvf=0.616 per cent. Only a upper limit to the hydrogen column density of the total absorber is obtained (N cm-2), a factor of about 15 lower than the total value in the source direction. The hard component is not compatible with a second bremss since an unrealistic temperature of 200 keV is obtained, even including the effect of reflection from neutral material (refl in Xspec).
On top of its peculiar spectrum, we also note that is slightly high (1.33, 252 d.o.f.), and we found that this is in part due to post-fit residual features at low energies ( keV). Due to the low S/N, they could be modeled with either absorption or emission lines (we note that in the latter case a mekal thermal continuum with solar abundance could fit the data). Unfortunately, the low X-ray flux of J0801 prevents us using the RGS spectra to study in details the soft portion of the X-ray spectrum. Consequently, we decided not to attempt to model these features and consider the adopted average spectrum a satisfactory description of the data. Due to these complexities, the PSR model has been applied to the broad-band spectrum above 3 keV from which a massive WD () is obtained (Table 5).
Only the normalization of the thermal component increases by a factor of 5 at pulse maximum, while all other parameters are constant within uncertainty (Table 6). The spin modulation then seems mainly due to visibility changes of the post-shock region, rather than to absorption effects.
4.3.3 A low accretion rate IP?
Due to the source faintness during the XMM-Newton pointing and the purported association with the fast MAXI transient source, all available archival Swift-XRT observations (obsid 34515 in 2007 and 262347 in 2016) were inspected for long-term changes. Similar fluxes are measured during these observations, indicating a likely intrinsically faint source. This does not exclude the possible association with the bright (1.4 Crab) fast-flaring source, and thus that J0801 could be a LMXB in deep quiescence. However, while the X-ray spectrum is atypical for a CV, the presence of pulses in both X-ray and optical bands strongly supports J0801 harbouring a magnetic WD. Furthermore, the optical spectrum by (Masetti et al., 2010) acquired in 2009 displays strong emission lines (Balmer, He I and He II) with EW ratio of and He II close to those observed in magnetic CVs and much larger than those of LMXBs (van Paradijs & Verbunt, 1984).
J0801 is detected in the nIR as 2MASS J08011702-4623274, with K=, H=, and K= mag, as well as in the midIR as WISE J080116.96-462327.5 with W1=, W2=, and W3= mag. As shown in Sect. 4.3.2, extinction is negligible. The nIR colour J-H= suggests a K-type donor star, but those at longer wavelengths, H-K= and W1-W2= are instead both compatible with a M4 V star (Bilir et al., 2008; Straižys & Lazauskaitė, 2009; Pecaut & Mamajek, 2013). This implies that accretion affects the emission above 1.2. For an assumed M4 V donor a distance of 250 pc is obtained using the observed and absoluted K-band magnitudes () (Knigge, 2006). Such small distance would imply the closest LMXB ever known, especially if associated to the fast MAXI transient source. All this makes the magnetic CV interpretation more plausible.
The lack of multi-colour photometry does not allow to infer a possible contribution of reprocessed emission at UV/optical wavelengths as would be expected from the detection of pulsations in the V-band (see also Mukai, Ishida & Osborne, 1994). However given the small optical pulse amplitude ( per cent), reprocessing should not be important. We then estimate the accretion luminosity adopting a distance of 250 pc as: . Using the inferred WD mass (Table 5) a mass accretion rate is derived. This value is close to that of a system loosing angular momentum through gravitational radiation below the 2–3 h orbital period gap. J0801 may resemble those short period IPs, like HT Cam (de Martino et al., 2005), with a spin pulse not affected by absorption and accreting at a low rate. Although the binary period cannot be measured with the present data, if the donor spectral type is indeed M4 V, J0801 is expected to have h (Knigge, 2006), quite consistent with the above arguments. Time-resolved optical spectroscopy is needed to assess whether J0801 is indeed a short orbital period system. Also, the peculiar X-ray spectrum requires a more detailed analysis with higher quality X-ray spectroscopy to classify it as an "ironclad" IP.
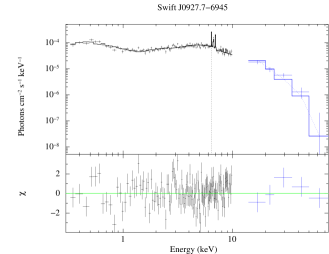
4.4 Swift J0927.7-6945
J0927 was identified from optical spectroscopic follow-ups by Parisi et al. (2014), as a CV, likely of the magnetic type. It appears as PBC J0927.8-6945 in their work.
4.4.1 Timing analysis
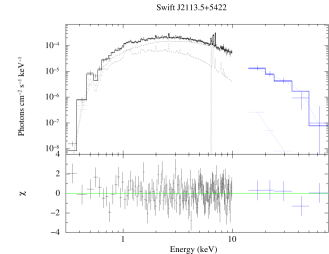
The X-ray and optical light curves display short-term and long-term variability (Figure 1). The X-ray power spectrum shows a strong peak at Hz and weaker ones at twice and three times this frequency. Power is also detected close to the main peak at Hz. We measure s and s, with an amplitude ratio A/A. The shorter period is then identified as the WD spin period and the other as the beat (). The power spectrum also shows substantial power at low frequencies. The lightcurve indeed displays almost two cycles of a possible periodic modulation, which could be the orbital period. It is asymmetric and we use two sinusoid functions (fundamental and harmonic) to determine its period: P h. This is consistent with that obtained from the beat frequency (): P h. Thus, J0927 is undoubtedly an IP. The presence of a dominant spin pulsation in the X-ray band implies that it mainly accretes through a disc, although a non negligible fraction ( per cent) of the accretion flow overpasses the disc and impacts directly onto the WD poles. The optical B band light curve instead shows evidence of the spin period only (= s), together with a longer timescale (hours) non periodic variability.
The presence of harmonics up to the second implies a structured X-ray spin pulse profile (Figure 2). The two main peaks giving rise to the fundamental and first harmonic are separated by 0.4 in phase. The PF decreases with increasing energy (Table 3), but the first harmonic almost dominates the 0.3–1 keV energy range (PF up to per cent), and loses power as the energy increases. This may indicate the presence of two emitting poles with the lower one dominating at low energies. The optical pulse profile is instead almost sinusoidal ( mag), with a single broader maximum approximately encompassing the phase interval covered by both X-ray peaks, and centred on the first harmonic X-ray peak (Figure 2). This suggests that the optical and X-ray emitting regions are somehow linked and that the former is likely more extended.
The HR shows hardening at orbital minimum and the intensity of the orbital modulation decreases with energy. These findings imply that as for the spin pulse, also the X-ray orbital modulation is mainly due to localized absorption.
4.4.2 Spectral analysis
We fitted the average broad-band spectrum (Table 4 and Figure 3) with a single mekal (kT keV) plus a Gaussian (EW= eV), multiplied by phabs (N cm-2) and two pcfabs (N and N cm-2). We got a slightly high (1.3 for 294 d.o.f.), also because of the residuals below 1.5 keV. Unfortunately, data from the RGS cannot help in resolving residual features, since the source is heavily absorbed. The relatively low temperature of the emitting plasma, although being an average over the post-shock region, may indicate that the WD is not massive. Indeed, the PSR model gives a WD mass of (Table 5).
The spectrum at pulse minimum is more absorbed. The Pc1 parameters increase by a factor of 2.2 (N) and of 1.2 (). We conclude this is the main cause of the X-ray pulse. The high column density absorber (Pc2) is in fact constant within uncertainty (Table 6). The spectrum at orbital minimum is also affected by absorption. However, if both Pc1 and Pc2 parameters are left free to vary, Pc1 is still the dominant component (Table 7). Due to the low S/N we are not able to infer spectral changes along the spin period at orbital maximum and minimum.
Energy dependent X-ray orbital modulations have been observed in a number of IPs (Parker, Norton & Mukai, 2005; Bernardini et al., 2012) indicating that material fixed in the binary frame, such as the stream impact point at the outer disc rim, could produce additional absorption. Since J0927 show evidence of (a partial) disc-overflow accretion mode, this interpretation seems well justified.
| source | Orb. | N | cvf | N | cvf | F0.3-10 | /dof |
| 1022 cm-2 | % | 1022 cm-2 | % | ||||
| J0927 | Max | 3.8(3) | 79(1) | 29(1) | 74(2) | 5.4(1) | 1.34/296 |
| Min | 6.9(7) | 93(1) | 38(2) | 78(3) | 4.2(1) | 1.14/172 | |
| J2113 | Max | 3.3(5) | 64(4) | 12(2) | 37(7) | 9.9(1) | 0.97/344 |
| Min | 4.4(4) | 89(1) | 30(4) | 47(4) | 7.7(2) | 0.86/225 |
4.4.3 An IP above the gap
J0927 shows temporal and spectral characteristics of a typical IP. A tentative distance of 240 pc was derived adopting an absolute magnitude of (Parisi et al., 2014). We here try to constrain the source distance as follows. The low column density of the total absorber suggests low extinction. Using the relation by Güver & Özel (2009) an upper limit to the interstellar extinction is derived: . J0927 is also identified as 2MASS J09275308-6944 with J=, H= and K= mag, and as WISE J092752.94-694442.3, with W1=, W2= and W3=13.4590.42 mag. The dereddened nIR colours J-H= and H-K=0.320.1, indicate the presence of more than one spectral component. The J-H colour would suggest a mid F-type star, but the H-K index would give a spectral type M2–M6 (Straižys & Lazauskaitė, 2009). The mid-IR colour W1-W2=0.270.08 also indicates a spectral type later than M4 (Pecaut & Mamajek, 2013). A M2.3 V donor is expected in a 5.15 h binary (Smith & Dhillon, 1998; Knigge, 2006). Since later spectral type than M4 would imply a system below the gap, we assume a donor in the range M2–M4 (hence absolute magnitudes , Knigge, 2006) and use the dereddened K-band magnitude to estimate the distance that results in the range pc. While this encompass the value found by Parisi et al. (2014), it poses a more stringent upper limit to the distance.
We then evaluate the accretion luminosity and then accretion rate in J0927. Also in this case the contribution of reprocessed radiation cannot be determined with the present data. Using the upper limit of 670 pc, , which in turn translates into a mass accretion rate for a 0.58 WD mass (Table 5). This is orders of magnitude lower than the secular mass transfer rate expected for a binary evolving through magnetic braking in a 5 h orbit (McDermott & Taam, 1989; Howell, Nelson & Rappaport, 2001). Lower mass transfer rates than predicted by the present-day CV population models were also recently found in a number of CVs above the gap (see Pala et al., 2017). While diversities in their secular properties are expected for selected CV populations (Goliasch & Nelson, 2015), any conclusion needs to await accurate GAIA parallaxes.
The spin-orbit period ratio is 0.06, as it is for most of the IPs observed above the orbital period gap and accreting via a disc truncated at the magnetospheric radius (see Norton et al., 2008). For a WD spinning at equilibrium, the corotation radius () defined as the radius at which the magnetosphere rotates at the expected Keplerian frequency for that radius, balances the Alfven radius, . Here is the magnetic moment in units of , is the luminosity in units of , and the WD mass and radius are in solar and cm units, respectively. Adopting Pω=1033.54 s, the luminosity determined above, and cm, a magnetic moment is inferred. This is at the low end of magnetic moments expected for slow rotators (Norton et al., 1999; Norton, Wynn & Somerscales, 2004), as it is the WD in J0927, but it depends on the assumed accretion luminosity.
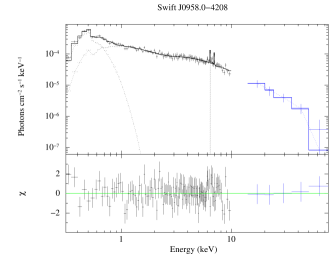
4.5 Swift J0958.0-4208
J0958 was identified by Masetti et al. (2013) as a CV, possibly of the magnetic type through optical spectroscopy.
4.5.1 Timing analysis
The X-ray power spectrum shows a strong peak corresponding to a period of s that we interpret as the WD spin period and a much weaker feature at its first harmonic (Table 2). There is no sign of these short-term periodicities in the optical (B-band) power spectrum. The inspection of the X-ray light curve suggests that long-term X-ray variability (on a timescale of h) could be present, although consistent with the length of the pointing. A possible variability on a timescale of h may be present in the optical band, but does not appear to be periodic. J0958 is also a variable source (CSS J095750.7-420836) monitored in the Catalina (CRTS)101010http://crts.caltech.edu/ survey from 2006 to 2013, but a search for periodicities less than a day did not give conclusive results. Thus, the orbital period of this system remains unknown.
The PF decreases as the energy increases (Table 3 and Figure 2) from a maximum of about 38 per cent in the 0.3–1 keV band to a minimum of about 7 per cent in the 5–12 keV band111111The PF is calculated removing the last 12 ks of EPIC exposure which are affected by high background activity. The HR shows hardening at spin minimum, as found in the majority IP systems. J0958 seems to be an IP dominated by its spin period and therefore a pure disc accretor.
4.5.2 Spectral analysis
The best fit model (, 294 d.o.f.) to the average broadband spectrum (Table 4 and Figure 3) consists of a mekal (kT keV) plus a blackbody (kT eV) and a Gaussian (EW eV), absorbed by a total phabs (N cm-2) and a partial covering absorber pcfabs (N cm-2). Metal abundances are consistent with solar value. No additional optically thin component is required. The blackbody component is hot, but not unusual as found also in other soft IPs (see Haberl, Motch & Zickgraf, 2002; Anzolin et al., 2008; Bernardini et al., 2012). The column density of the total absorber is within 2 consistent with that in the direction of the source (, Kalberla et al., 2005). The fit with the PSR model gives (Table 5), which is consistent within uncertainties with that resulting when adopting a 36 keV maximum temperature (0.8). The main changes in the spectral parameters with the spin period are related to variations in the normalization of the mekal, which increases at spin maximum by a factor of 1.4. The cvf of pcfabs also slightly increases at pulse minimum ( vs per cent), but not its column density. The other parameters remain constant within uncertainties (Table 6). The lack of variability of the blackbody normalization indicates that the irradiated polar cap of the WD remains visible along the whole spin pulse.
The bolometric soft-to-hard flux ratio defined as (see Ramsay & Cropper, 2004b) is 0.09, similar to those found in other soft IPs with comparable hot blackbody temperature (Anzolin et al., 2008; Bernardini et al., 2012). The reprocessed X-ray emission would then originate from a small polar region as inferred from the normalization of the blackbody: for a distance in the range 0.72–1.1 kpc (see below). Indeed, adopting a and its corresponding cm radius, a fractional area is obtained.
4.5.3 A fast spinning IP
J0958 shows typical IP characteristics. A tentative distance of 200 pc was derived by Masetti et al. (2013) using similar arguments as in J0927 by (Parisi et al., 2014). We here estimate the distance using nIR and mid-IR photometry. Both the high column density derived from X-ray spectral fits and the interstellar reddening in the direction of the source (Schlafly & Finkbeiner, 2011) should be considered as upper limits to the galactic extinction to the source since the optical spectrum (Masetti et al., 2013) does not reveal interstellar absorption features (DIBs). We then assume A.
J0958 is detected as 2MASS J09575064-4208355 with J=, H= and K= mag and as WISE J095750.67-420835.8 with W1= and W2=14.1480.042 mag. The J-H=0.490.10 colour suggests a K1–K5 V donor star . A similar range (K0–K4) is obtained using the dereddened colour (Straižys & Lazauskaitė, 2009), while W1-W2=0.270.05 points to a spectral type later than M4 (Pecaut & Mamajek, 2013). However, a fit to the combined nIR and mid-IR SED requires only one spectral component and gives a blackbody temperature of kK, indicating a K4–M2 star. Using the more accurate J-band magnitude, assuming a K4–M2 V donor star with mag (Bilir et al., 2008; Knigge, 2006), a distance of 0.72–1.0 kpc (0.77–1.1 kpc) is obtained with (and without) reddening correction. We conservatively adopt the distance range 0.72–1.1 kpc.
The lack of pulsations in the optical band may suggest that additional X-ray reprocessing is negligible. We then estimate the accretion luminosity including both soft and hard X-ray emission: , which using the above distance range results in: . For a 0.74 WD (Table 5) the accretion rate is . This is rather similar to what found in long orbital period IPs (e.g. above the period gap). If the donor spectral type is truly K4–M2, the binary period would be in fact be above the gap ( h).
J0958 hosts a fast spinning WD only surpassed by a few systems: SWIFT J0525.6+2416 (226 s), XY Ari (206 s), V2731 Oph (128 s), DQ Her (71 or 142 s), AE Aqr (33 s), and V455 And (67 s) (see Ferrario, de Martino & Gänsicke, 2015, for a recent update of IPs). Except for the last example, they are all long ( h) orbital period systems with spin-to-orbital period ratios 0.01. While the lack of knowledge of the orbital period prevents us from determining the degree of asynchronism, the above arguments may favour a system above the gap and thus J0958 may in future also join this group. Systems with such very small ratios are expected to be disc accretors when the WD is spinning at equilibrium, and would be strong propellers if out of equilibrium, as the unique system AE Aqr (Norton et al., 2008). The detection of X-ray spin pulses then shows that J0958 is a disc accretor IP that possess a WD spinning at equilibrium. Furthermore, fast rotating WDs are expected to harbour relatively weak magnetic WDs, as opposed to slow rotators with strong magnetic fields (Norton et al., 1999). Thus, J0958 could have a magnetic moment as low as .
4.6 Swift J1701.3-4304
J1701, =IGR J17014-4306 in Masetti et al. (2013), was identified by those authors as a CV and proposed to be a magnetic candidate for its optical spectroscopic characteristics.
4.6.1 Timing analysis
The eclipse
All the three EPIC light curves show at the middle of the observation a remarkable drop of count rate that reaches zero, indicative of a total eclipse of the X-ray source (Figure 1). A partial eclipse is also detected in the simultaneous OM B-band photometry, where the flux drops by a factor of . An archival XMM-Newton observation (obsid: 0743200101) of the planetary nebula PN G343.3-00.6=PN HaTr 5, which is only 17 arcsec apart from J1701 was carried out on 2014-08-31 for 14 ks. J1701 is serendipitously detected in the EPIC exposures as a bright source overwhelming PN G343.3-00.6, which is instead not detected. At the beginning of this pointing, the final part of a total X-ray eclipse clearly appears. This shows that this feature is real and that J1701 is a deep eclipsing CV. The lack of consecutive eclipses in both XMM-Newton observations implies an orbital period h.
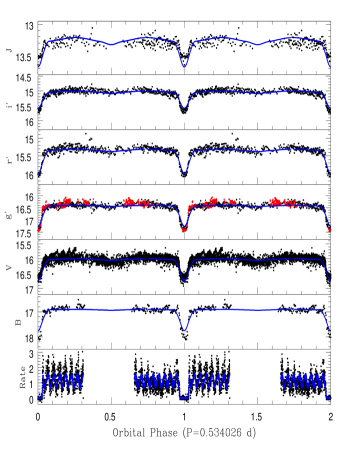
The ground-based optical and nIR photometry (Section 2.4) also displays eclipses in all bands. The LCO photometry caught one full eclipse and another only partially. Four eclipses are instead detected in the REM data, and seven in the AAVSO photometry. To determine the orbital period the combined g’ and V-band, light curves were analysed with the Period04 package121212http://www.univie.ac.at/tops/Period04/. The power spectrum reveals a strong peak at 1.87 d-1 and period analysis gives d, and epoch of minimum (BJD)=2457660.535690.00003. An improved ephemeris was obtained extending the baseline with the LCO g’-band (June 2016) and the OM B-band data (2015). Each of the 13 eclipses was fitted with a Gaussian to obtain the times of minima. A linear regression was used to obtain the following ephemeris: and d. Observed-minus-calculated () residuals were inspected against trends, showing that a constant period gives an acceptable fit. The excursions on average are within 240 s around zero. The eclipse depths derived from Gaussian fits are: , , , , and mag. The width of the optical eclipses (fwhm) are instead consistent within errors ( s). The X-ray eclipse lasts s and is total for s. The egress appears slightly asymmetric since it happens at the peak of a spin pulsation (Figure 1). To measure the e-folding times we fitted the light curve (14 s binned) outside the eclipse with two sinusoids to account for the X-ray spin pulse, and with an exponential decay/rise to model the ingress/egress time and found s and s (Figure 5).
The spin pulsation
The X-ray persistent emission further displays a periodic modulation. The PN power spectrum has a strong peak at Hz and its first harmonic. No other signal is detected. By removing the eclipse interval, a composite two-sinusoidal fit gives: P s (Table 2).
The OM B-band light curve also displays similar periodic variability. A sinusoidal fit does not require the first harmonic and gives P s, fully consistent with the X-ray period. We used the AAVSO V-band light curve to improve the measure of the spin period. A fit with two-sines to model the fundamental and its first harmonic gives P s. This period is adopted to fold and study the X-ray pulse properties (Table 2). Both the X-ray and optical (B and V bands) pulses are in phase indicating a common origin. The X-ray PF decreases from 70 per cent in the 0.3–1 keV band to 18 per cent in 5–12 keV band (Figure 2 and Table 3), suggesting that photoelectric absorption is the main cause of the X-ray spin pulsation.
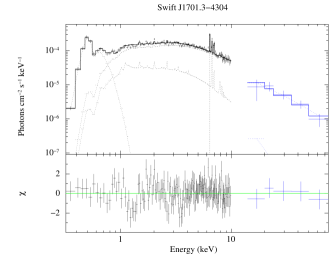
4.6.2 Spectral analysis
The best fit to the average broad-band spectrum (Table 4 and Figure 3) consists of two mekal (kT keV and kT keV, lower limit), plus a blackbody (kT eV) and a 6.4 keV Gaussian (EW= eV). The hydrogen column density of the total absorber is N cm-2 and that of the partial is N cm-2 with per cent ( for 366 d.o.f). The metal abundance is high (A), though consistent with solar values within . The BAT inter-calibration constant is , suggesting that the sources could be variable on the long-term and that when observed by XMM-Newton, it was brighter than the average over many years. Despite its hard spectrum, a reflection component is not required. Furthermore, the PSR model gives a massive WD (, Table 5). This high value is consistent with the lower limit obtained for the hot mekal component ().
The HR shows an hardening at spin minimum. The equivalent hydrogen column and the covering fraction of the partial covering absorber both increase at spin minimum by a factor of and , respectively. The normalization of the hot mekal slightly increases by a factor of about 1.4 at maximum. On the other hand, the blackbody normalization increases by a factor at spin minimum, indicating this component arises from the heated WD atmosphere at the poles. Similarly, the EW of the 6.4 keV fluorescent line also increases from 110 eV at spin maximum to 180 eV at spin minimum, suggesting that reflection occurs at the WD poles (Table 6).
We derive a bolometric flux ratio , which is the highest ever inferred in a soft X-ray IP and closer to that observed in polars (Anzolin et al., 2008; Bernardini et al., 2012). Although subject to model uncertainties, the emitting area of the WD hot spot is at a distance of 1 kpc (see below). This would correspond to a large fractional area, , of a WD with .
4.6.3 A deep eclipsing long period IP
The multi-band photometry has been analysed to unveil the donor star and system parameters. Using the B, V, g’ r’, i’ and J bands magnitudes (Figure 5), the spectral energy distributions outside and at eclipse minima were constructed. We applied a reddening AV=3.17 derived assuming that the phabs absorber, which 1 lower error is N cm-2, is entirely interstellar and then applying the extinction relation by Güver & Özel (2009). Although this source lies in a heavily reddened region of the Galactic Plane, a higher extinction is disfavoured by inspection of the optical spectrum by Masetti et al. (2013), where weak DIBs are identified. Fitting the SED at eclipse minimum with a blackbody gives a temperature of kK indicating a relatively hot donor. The optical spectrum presented in Masetti et al. (2013) also reveals the Mg b feature at 5167-5184 Å, which was compared with stellar templates from the Pickles catalogue (Pickles, 1998) with spectral types in the range F0–G0 V using several reddening values. The best match is found for a F0–F5 V spectral type with AV=3.1, in agreement with the SED at eclipse minimum, with the mid-F spectral type being preferred. The contribution of the donor star to the total V-band flux outside the eclipse is per cent.
While a detailed analysis and fine tuning of the optical/nIR light curves will be presented in a forthcoming work, first estimates of the binary system parameters, the mass ratio , the inclination , and the donor star temperature were obtained with the Nightfall code (v.1.88) 131313http://www.hs.uni-hamburg.de/DE/Ins/Per/Wichmann/Nightfall.html applied simultaneously to the most covered orbital light curves in V, g’, r’, i’ and J bands. These were fitted adopting a Roche-lobe filling donor star and a primary treated as a point source with fixed temperature of 200 kK (e.g. the higher allowed temperature). An irradiated accretion disc with fixed inner and outer radii of 0.01 and 0.40 in units of the WD Roche-lobe was also included. The disc thickness was set to 1 per cent and the temperature of the inner disc boundary and of the hot-spot at the outer disc rim to 30 kK and 8 kK, respectively141414Details of parameters setting can be found in the Nightfall User Manual.
The donor temperature, , and were left free to vary obtaining , deg and kK (=28 for 5640 dof). The large is due to the large scatter and small errorbars (typically 3 per cent) of the photometric measures and to the approximate modeling of the eclipse feature. Due to the extent of the wings of the eclipse a larger accretion disc is disfavoured (see also Horne, Gomer & Lanning, 1982). Adopting , the donor would have .
The length of the X-ray eclipse, and particularly the time elapsed from the first to the contact, (or the and contact) 0.06, allows the placing of constraints on the donor star radius in units of binary separation: (Horne, Gomer & Lanning, 1982). Assuming a Roche-lobe filling secondary, this equation, together with the equivalent Roche lobe radius approximation by Eggleton (1983), define an unique relation between and . Adopting the uncertainty on , and as a range, this restricts the orbital separation to and the donor radius to . The secondary appears to be expanded and evolved, in line with the expected present-day population of CVs with evolved donors at these long orbital periods (Goliasch & Nelson, 2015). Adopting the range of the donor radius and using the normalization obtained from the fits to the SED during the eclipse, a distance of 995–1290 pc is obtained. We then adopt a distance of 1 kpc for J1701.
Furthermore, an estimate of the X-ray emitting region is also derived. Here s and and are the primary and secondary relative velocities. From Kepler’s third law: . Adopting the uncertainties on the WD and donor masses, inclination and egress time, we obtain , which is times the radius of the massive WD. Taken at its face value, this would suggest a very extended X-ray emitting region. Post-shock regions are only a few percent the WD radius (see Mukai, 1999). To account for such large linear extension, two opposite emitting poles should be visible at the same time, as suggested by the presence of the harmonic of the spin frequency, and in turn they should be gradually hidden during the eclipse ingress/egress.
Adopting for the accretion luminosity , at a distance of 1 kpc it results in . For a , we derive (Table 5). At long ( h) orbital periods, donors in CVs are expected to have high mass transfer rates and to be chemically evolved (Goliasch & Nelson, 2015). The inclusion of nuclear evolution in the synthesis models of the present-day CV population allows the attainment of longer ( h) periods and a wide range of mass-transfer rates, including the value inferred here for J1701. The probability of finding such very long period systems is however low, about 1 per cent.
J1701 is one of the longest orbital period IP. It is surpassed only by GK Per (47.9 h) and V2731 Oph (15.4 h). These are highly asynchronous systems (), while J1701 has = 0.04. Accounting for the high mass ratio inferred, the observed asynchronism in J1701 is consistent with a WD spinning at equilibrium (Wynn & King, 1995; King & Wynn, 1999) and accreting via a disc (Norton et al., 2008). We then derive a magnetic moment . Though to be regarded with caution, this large value would suggest that J1701 will evolve into a Polar when reaching synchronism (Norton, Wynn & Somerscales, 2004).
J1701 is then the first deeply eclipsing IP ever found at long orbital periods and adds to the small group of eclipsing systems of this class: EX Hya, XY Ari, IPHAS J062746+0148, V597 Pup, and DQ Her (Hellier, 2014, and references therein), and the two recently discovered IPs SWIFT J201424.9+152930 (Esposito et al., 2015) and CXOGBS J174954.5-294335 (Johnson et al., 2017). In addition, IGR J18293-1213 (Clavel et al., 2016) is definitely an eclipsing CV and may well be an eclipsing IP. Time-resolved optical/nIR polarimetry will be crucial to understand the evolution of this IP and the interaction of the accretion flow with the magnetosphere.
4.7 Swift J2113.5+5422
J2113 was tentatively proposed by Masetti et al. (2010), as a magnetic CV of the IP type given the strength of its He II emission line. It appears as 1RXS J211336.1+542226 in their work.
4.7.1 Timing Analysis
The X-ray power spectrum clearly shows three peaks, pointing to three periodic signals. A broad peak at low frequency Hz, together with two close peaks at Hz and Hz. We then identify the highest frequency peak as the WD spin and the close one as the beat (), while the broader low-frequency peak as the binary frequency (). Indeed, the X-ray light curve fully samples three orbital cycles (Figure 1) with P h. We further measure s and s (Table 2). Using the beat and spin frequency a period h is obtained. It is longer than P, but consistent within 3. The OM V-band light curve instead does not show any short-term periodicity, but rather large flickering (Figure 1). It is modulated at a period h, which is shorter, but consistent within 3, with the X-ray value. The amplitude of the optical modulation is smaller than that in the X-ray band ( vs per cent; Figure 1). The intensity of the spin modulation in the whole 0.3–12 keV range is low (PF per cent), but we still measure a higher PF at lower energies (ranging from 30 per cent in the softest range to 9 per cent in the hard band. (Table 3 and Figure 2). The HR varies along the orbital period, with the source being harder at the orbital minimum. The intensity of the orbital modulation also decreases with energy. All these findings suggest that photoelectric absorption is the main cause of both the spin and orbital modulations. As in the case of J0927, the fact that the orbital X-ray modulation is energy dependent suggests that the X-ray emission is absorbed by material fixed in the binary frame, such as the outer disc rim. The amplitude ratio of the two short-period X-ray modulations is A/A, indicating that the system is in a disc over-flow accretion mode.
4.7.2 Spectral analysis
We fitted the average broad-band spectrum (Table 4 and Figure 3) with two mekal (kT and kT keV) plus a Gaussian, absorbed by a total phabs (N cm-2) and two partial covering columns pcfabs (N and N cm-2) ( for 370 d.o.f.). We note that the BAT inter-calibration constant is , which may suggest that the source is variable on the long-term and that we observed it in a state brighter than the average over many years. The EW of the 6.4 keV fluorescent line is very small (70 eV), indicating that reflection is not important in the hard X-ray portion of the spectrum. The column density of the total absorber () is consistent with the galactic hydrogen column density in the source direction (; Kalberla et al., 2005). The PSR model gives a WD mass of , consistent within uncertainties with that resulting from the hot mekal component (Table 4).
Also because of the weak spin modulation, the pulse resolved spectroscopy only shows marginally significant changes. The spectrum is slightly harder at pulse minimum, where , the covering fraction of the lower density absorber (Pc1), increases by a factor of 1.2 (Table 6). On the other hand, the spectrum at orbital minimum is clearly harder, mainly due to the increase by a factor 2.5 of the hydrogen column density of the second partial covering absorber (Pc2) and a to a slight increase of , its covering fraction (see Table 7). Therefore, this higher density absorber is mainly responsible for the orbital modulation. The spectral analysis then clearly shows that two different absorbers are responsible for the spin (Pc1) and the orbital (Pc2) modulation. They can be ascribed to the magnetically confined pre-shock flow and matter accumulating at the disc rim, respectively.
4.7.3 An IP above the period gap
J2113 lies close to the galactic plane (b) and thus interstellar extinction in the direction of the source is high. We then adopt the column density of the total absorber ( cm-2) as an upper limit to the interstellar extinction in the source direction, which translates into =3.3 (Güver & Özel, 2009). Also for J2113 we estimate the distance using nIR and mid-IR data. However, J2113 is not a 2MASS source, but surprisingly it appears as WISE J211335.41+542233.0 with W1= and W2= mag. The dereddened colour W1-W2=, would indicate a very low temperature component K. For a 4.1 h orbital period binary, the donor should have a spectral type of a M3.4 V star (Knigge, 2006), and thus much bluer colours (W1-W20.12). This points to an excess of flux, as also found in some CVs. It could be due to circumbinary dust emission or, as seen in J0706 to low-harmonic cyclotron flux in the case of polars. Further analysis is beyond the scope of this paper, but investigation in the IR is needed to unveil the true nature of the excess in this system. From the lack of detection in the 2MASS survey, we estimate an upper limit to the K-band flux (lower limit magnitude of ) in a region close to the position of the source in the 2MASS survey. This, corrected for interstellar extinction, translates into a lower limit to the distance of 750 pc, adopting a M3.6 V star with (Knigge, 2006). A rough kpc distance would instead result using the extinction-distance relation as a function of galactic latitude.
The accretion luminosity is then evaluated as: adopting conservatively d750 pc. For a WD mass of 0.81 (Table 5), this translates into . As a lower limit it could be consistent with those of long period systems (Howell, Nelson & Rappaport, 2001).
J2113 is then an IP above the gap with a typical spin-to-orbit period ratio of . For a WD spinning at equilibrium a magnetic moment is derived, consistent with a moderately magnetic slow WD rotator. This system is then another example of a disc-overflow accretor above the orbital gap.
5 Conclusions
The broad-band analysis presented here unambiguously reveals the magnetic nature of five hard X-ray selected CV candidates. We indeed classify J0927, J0958, J1701, and J2113 as firm IPs. We suggest that J0801 is also an IP, although possibly displaying an atypical spectrum. J0706 is instead a polar, joining as the member the group of hard X-ray selected polars. One system, J0746, is found to accrete at an extremely low rate for its long orbital period (9.38 h). The lack of periodic variations in its X-ray light curve does not support the magnetic CV membership. It could be either an atypical low-luminosity CV or even a LMXB, although evidences for this interpretation are not compelling.
The class of IPs has grown substantially over the last decade (see e.g. Ferrario, de Martino & Gänsicke, 2015), now amounting to 66 systems (with 10 of them identified in the last two years, Bernardini et al., 2015; Esposito et al., 2015; Coti Zelati et al., 2016; Tomsick et al., 2016; Johnson et al., 2017). This is about half of the size of the Polar class ( members).
While IPs were already known to populate the orbital period distribution above the 2–3 h gap, the new identifications have revealed systems with longer periods (e.g. above 6 h). At present there are 14 such IPs that represent of the whole CV population in this period range. These long period systems have probably entered in the CV phase with evolved donors and their spin-orbit period ratios (Figure 6, left panel) suggest they will reach synchronism while evolving to short orbital periods. Furthermore, 10 IPs are found below the orbital period gap, where they are not expected (Norton, Wynn & Somerscales, 2004; Norton et al., 2008), indicating that they will likely never synchronise. They have low X-ray luminosity, with four identified in the hard X-ray surveys (EX Hya, V1025 Cen, DO Dra, and IGR J18173-2509) at only . J0801 has a similar luminosity and may in future join this group, once its orbital period is measured. Finding new low-luminosity IPs is crucial to confirm the suggestion that short-period IPs are intrinsically common as the more luminous long-period IPs (Pretorius & Mukai, 2014). Furthermore, seven out of the 11 polars detected in the hard X-ray surveys, including the last addition of J0706, are also found at similar luminosities. Whether magnetic systems, and particularly IPs, are major constituents of the Galactic Centre X-ray emission (GCXE) and of GRXE is still largely debated. A recent re-evaluation using both XMM-Newton and NuSTAR observations of the inner central (few pc) regions of the Galaxy (Hailey et al., 2016) shows that relatively massive (0.9 M⊙) magnetic WDs can account for the X-ray luminosity function at erg s-1. WDs in IPs are indeed found to be relatively massive (Brunschweiger et al., 2009; Yuasa et al., 2010; Bernardini et al., 2012, 2013b; Tomsick et al., 2016) as is the case for the majority of the sources in our sample (where ). This is broadly in line with the general finding that WD primaries in CVs are more massive than single WDs and WDs in pre-CV binaries, in contrast with predictions of standard CV formation theory. This disagreement led to suggest that either the WDs grow in mass during CV evolution, or a significant fraction of the observed population of CVs has formed through a preceding short phase of thermal timescale mass transfer (TTMT), during which the WD substantially increases in mass (Zorotovic, Schreiber & Gänsicke, 2011). However, neither the inclusion of a TTMT phase nor the adjustment of the accretion efficiency to allow the WD mass growth in binary population synthesis models (Wijnen, Zorotovic & Schreiber, 2015) are able to explain the observed WD mass distribution in CVs, leaving the issue still unsolved. Furthermore, other recent studies may indicate that the GRXE is not composed primarily of IPs, but rather by non-magnetic CVs and polars (Reis et al., 2013; Warwick, Byckling & Pérez-Ramírez, 2014; Xu, Wang & Li, 2016), with IPs populating the harder tail. Thus, this issue may eventually be solved with the identification of a larger sample of low-luminosity MCVs and IPs in particular.
 |
 |
Our study has also revealed additional systems displaying a soft X-ray blackbody component with temperatures ranging from those observed in the polars ( eV) as in J1701, to higher values ( eV) as in J0958, with distinct softness ratios. Since the time of the compilation by Anzolin et al. (2008) the current roster of "soft" IPs increased and now amounts to 19 systems (Figure 6, right panel), representing of the whole subclass (Bernardini et al., 2012; Masetti, Nucita & Parisi, 2012; Joshi et al., 2016). Although high blackbody temperatures arising from the WD surface would be locally super-Eddington, the possibility that the soft component originates instead in the coolest regions of the accretion flow (e.g. above the WD surface) is not supported by the spectral fits. On the other hand, J0706 adds to the increasing number of polars discovered without a detectable soft component (see e.g. Ramsay et al., 2009; Bernardini et al., 2014; Worpel et al., 2016). This soft component was initially considered the defining characteristics of highly magnetic systems, but XMM-Newton has demonstrated that not to be the case. Whether this component is in some cases cool and thus simply shifted to the EUV band, will be difficult to assess due to the lack of foreseen facilities in this energy range.
We also note that the spectra analysed here can simply be modeled with a one or two temperature emitting plasma (although a more physical model is also used), likely because we are sampling X-ray faint targets, where the fine details of the spectra are hidden in the noise. A detailed mapping of the plasma conditions in the post shock region with high resolution X-ray spectroscopy is clearly needed. It will also help in solving the puzzle of the hot and locally super-Eddington blackbody component. However, all this will need to await the next generation of X-ray telescopes, like Athena.
Acknowledgments
This work is based on observations obtained with XMM-Newton, an ESA science mission with instruments and contributions directly funded by ESA Member States; with Swift, a National Aeronautics and Space Administration (NASA) science mission with Italian participation; with INTEGRAL , an ESA project with instruments and science data centre funded by ESA member states and the participation of Russia and the USA. This work makes use of observations from the Las Cumbres Observatory (LCO). This research has made use of the data supplied by the UK Swift Science Data Centre at the University of Leicester. This work has also made use of the APASS catalog, located at the AAVSO web site. Funding for APASS has been provided by the Robert Martin Ayres Sciences Fund. The REM observations were obtained under programme DDT-REM:32905. The REM team is acknowledged for the support in the scheduling and data delivery. This publication also makes use of data products from: the Wide-field Infrared Survey Explorer, which is a joint project of the University of California, Los Angeles, and the Jet Propulsion Laboratory/California Institute of Technology, funded by the National Aeronautics and Space Administration; the Two Micron All Sky Survey (2MASS), a joint project of the University of Massachusetts and the Infrared Processing and Analysis Center (IPAC)/Caltech, funded by NASA and the NSF; and the Sloan Digital Sky Survey (SDSS). DdM and FB acknowledge financial support from ASI/INAF under contract I/037/12/0.
References
- Acero et al. (2015) Acero F. et al., 2015, ApJS, 218, 23
- Aizu (1973) Aizu K., 1973, Prog. Theor. Phys., 49, 1184
- Anzolin et al. (2008) Anzolin G., de Martino D., Bonnet-Bidaud J.-M., Mouchet M., Gänsicke B. T., Matt G., Mukai K., 2008, A&A, 489, 1243
- Anzolin et al. (2009) Anzolin G., de Martino D., Falanga M., Mukai K., Bonnet-Bidaud J.-M., Mouchet M., Terada Y., Ishida M., 2009, A&A, 501, 1047
- Archibald et al. (2009) Archibald A. et al., 2009, Science, 324
- Archibald et al. (2015) Archibald A. M. et al., 2015, ApJ, 807, 62
- Arnaud (1996) Arnaud K. A., 1996, in Astronomical Society of the Pacific Conference Series, Vol. 101, Astronomical Data Analysis Software and Systems V, Jacoby G. H., Barnes J., eds., p. 17
- Barlow et al. (2006) Barlow E. J., Knigge C., Bird A. J., J Dean A., Clark D. J., Hill A. B., Molina M., Sguera V., 2006, MNRAS, 372, 224
- Bassa et al. (2014) Bassa C. G. et al., 2014, MNRAS, 441, 1825
- Baumgartner et al. (2013) Baumgartner W., Tueller J., Markwardt C., Skinner G., Barthelmy S., Mushotzky R., Evans P., Gehrels N., 2013, ApJS, 297, 19
- Beardmore et al. (1998) Beardmore A. P., Mukai K., Norton A. J., Osborne J. P., Hellier C., 1998, MNRAS, 297, 337
- Beardmore, Osborne & Hellier (2000) Beardmore A. P., Osborne J. P., Hellier C., 2000, MNRAS, 315, 307
- Bernardini & Cackett (2014) Bernardini F., Cackett E. M., 2014, MNRAS, 439, 2771
- Bernardini et al. (2013a) Bernardini F., Cackett E. M., Brown E. F., D’Angelo C., Degenaar N., Miller J. M., Reynolds M., Wijnands R., 2013a, MNRAS, 436, 2465
- Bernardini et al. (2012) Bernardini F., de Martino D., Falanga M., Mukai K., Matt G., Bonnet-Bidaud J.-M., Masetti N., Mouchet M., 2012, A&A, 542, A22
- Bernardini et al. (2014) Bernardini F., de Martino D., Mukai K., Falanga M., 2014, MNRAS, 445, 1403
- Bernardini et al. (2013b) Bernardini F. et al., 2013b, MNRAS, 435, 2822
- Bernardini et al. (2015) Bernardini F., de Martino D., Mukai K., Israel G., Falanga M., Ramsay G., Masetti N., 2015, MNRAS, 453, 3100
- Beuermann (1999) Beuermann K., 1999, in Highlights in X-ray Astronomy, Aschenbach B., Freyberg M. J., eds., p. 410
- Bilir et al. (2008) Bilir S., Karaali S., Ak S., Yaz E., Cabrera-Lavers A., Coşkunoǧlu K. B., 2008, MNRAS, 390, 1569
- Bird et al. (2010) Bird A. J. et al., 2010, ApJS, 186, 1
- Blackburn (1995) Blackburn J. K., 1995, in Astronomical Society of the Pacific Conference Series, Vol. 77, Astronomical Data Analysis Software and Systems IV, Shaw R. A., Payne H. E., Hayes J. J. E., eds., p. 367
- Bogdanov et al. (2015) Bogdanov S. et al., 2015, ApJ, 806, 148
- Brunschweiger et al. (2009) Brunschweiger J., Greiner J., Ajello M., Osborne J., 2009, A&A, 496, 121
- Clavel et al. (2016) Clavel M. et al., 2016, MNRAS, 461, 304
- Conconi, Cuniffe & D’Alessio (2004) Conconi P., Cuniffe R., D’Alessio F. e., 2004, in Proc. SPIE, Vol. 5492, Ground-based Instrumentation for Astronomy, Moorwood F. M., Masanori I., eds., p. 1602
- Coti Zelati et al. (2016) Coti Zelati F., Rea N., Campana S., de Martino D., Papitto A., Safi-Harb S., Torres D. F., 2016, MNRAS, 456, 1913
- Courvoisier et al. (2003) Courvoisier T. J.-L. et al., 2003, A&A, 411, L53
- Cropper (1988) Cropper M., 1988, MNRAS, 231, 597
- Cropper (1990) Cropper M., 1990, SSRv, 54, 195
- Cropper et al. (1999) Cropper M., Wu K., Ramsay G., Kocabiyik A., 1999, MNRAS, 306, 684
- Cusumano et al. (2010) Cusumano G., La Parola V., Segreto A., Ferrigno C., Maselli A., Sbarufatti B., Romano P. e., 2010, A&A, 524, 64
- Dall’Osso et al. (2003) Dall’Osso S., Israel G., Stella L., Possenti A., Perozzi E., 2003, ApJ, 599, 485
- de Martino et al. (1998) de Martino D. et al., 1998, A&A, 332, 904
- de Martino et al. (2013) de Martino D. et al., 2013, A&A, 550, A89
- de Martino et al. (2014) de Martino D. et al., 2014, MNRAS, 444, 3004
- de Martino et al. (2010) de Martino D. et al., 2010, A&A, 515, A25
- de Martino et al. (2004) de Martino D., Matt G., Belloni T., Haberl F., Mukai K., 2004, A&A, 415, 1009
- de Martino et al. (2008) de Martino D. et al., 2008, A&A, 481, 149
- de Martino et al. (2005) de Martino D. et al., 2005, A&A, 437, 935
- de Martino et al. (2015) de Martino D. et al., 2015, MNRAS, 454, 2190
- Degenaar & Wijnands (2011) Degenaar N., Wijnands R., 2011, MNRAS, 412, L68
- Degenaar & Wijnands (2012) Degenaar N., Wijnands R., 2012, MNRAS, 422, 581
- den Herder et al. (2001) den Herder J. W. et al., 2001, A&A, 365, L7
- Dixon (1995) Dixon R. S., 1995, VizieR Online Data Catalog, 7002
- Done & Magdziarz (1998) Done C., Magdziarz P., 1998, MNRAS, 298, 737
- Done, Osborne & Beardmore (1995) Done C., Osborne J., Beardmore A., 1995, MNRAS, 276, 483
- Eggleton (1983) Eggleton P. P., 1983, ApJ, 268, 368
- Esposito et al. (2015) Esposito P. et al., 2015, MNRAS, 450, 1705
- Evans et al. (2009) Evans P. A., Beardmore A., Osborne J., O’Brian P., Willingale, R. andStarling R., Burrows D. e. a., 2009, MNRAS, 397, 1177
- Evans & Hellier (2007) Evans P. A., Hellier C., 2007, ApJ, 663, 1277
- Ezuka & Ishida (1999) Ezuka H., Ishida M., 1999, ApJS, 120, 277
- Ferrario, de Martino & Gänsicke (2015) Ferrario L., de Martino D., Gänsicke B. T., 2015, Space Sci. Rev., 191, 111
- Fischer & Beuermann (2001) Fischer A., Beuermann K., 2001, A&A, 373, 211
- Goliasch & Nelson (2015) Goliasch J., Nelson L., 2015, ApJ, 809, 80
- Güver & Özel (2009) Güver T., Özel F., 2009, MNRAS, 400, 2050
- Haberl & Motch (1995) Haberl F., Motch C., 1995, A&A, 297, L37
- Haberl, Motch & Zickgraf (2002) Haberl F., Motch C., Zickgraf F.-J., 2002, A&A, 387, 201
- Hailey et al. (2016) Hailey C. J. et al., 2016, ApJ, 826, 160
- Halpern & Thorstensen (2015) Halpern J. P., Thorstensen J. R., 2015, AJ, 150, 170
- Harrison et al. (2013) Harrison T., Hamilton R., Tappert C., Hoffman D., Campbell R., 2013, AJ, 145, 19
- Harrison & Campbell (2015) Harrison T. E., Campbell R. K., 2015, ApJS, 219, 32
- Hellier (1995) Hellier C., 1995, in ASP Conf. Ser., Vol. 85, Magnetic Cataclysmic Variables, Buckley D. A. H., Warner B., eds., p. 185
- Hellier (2014) Hellier C., 2014, in European Physical Journal Web of Conferences, Vol. 64, European Physical Journal Web of Conferences, p. 07001
- Henden et al. (2016) Henden A. A., Templeton M., Terrell D., Smith T. C., Levine S., Welch D., 2016, VizieR Online Data Catalog, 2336
- Horne, Gomer & Lanning (1982) Horne K., Gomer R. H., Lanning H. H., 1982, ApJ, 252, 681
- Howell, Nelson & Rappaport (2001) Howell S. B., Nelson L. A., Rappaport S., 2001, ApJ, 550, 897
- Hynes et al. (2004) Hynes R. I. et al., 2004, ApJ, 611, L125
- Johnson et al. (2017) Johnson C. B. et al., 2017, MNRAS, 466, 129
- Joshi et al. (2016) Joshi A., Pandey J. C., Singh K. P., Agrawal P. C., 2016, ApJ, 830, 56
- Kalberla et al. (2005) Kalberla P. M. W., Burton W. B., Hartmann D., Arnal E. M., Bajaja E., Morras R., Pöppel W. G. L., 2005, A&A, 440, 775
- Kennea et al. (2016) Kennea J. A. et al., 2016, The Astronomer’s Telegram, 8988
- King & Wynn (1999) King A. R., Wynn G. A., 1999, MNRAS, 310, 203
- Knigge (2006) Knigge C., 2006, MNRAS, 373, 484
- Masetti, Nucita & Parisi (2012) Masetti N., Nucita A., Parisi P., 2012, A&A, 544, A114
- Masetti et al. (2010) Masetti N. et al., 2010, A&A, 519, A96
- Masetti et al. (2013) Masetti N. et al., 2013, A&A, 556, A120
- Mason et al. (2001) Mason K. O. et al., 2001, A&A, 365, L36
- Masumitsu et al. (2016) Masumitsu T. et al., 2016, The Astronomer’s Telegram, 8993
- McDermott & Taam (1989) McDermott P., Taam R., 1989, ApJ, 342, 1019
- Mukai (1999) Mukai K., 1999, in Astronomical Society of the Pacific Conference Series, Vol. 157, Annapolis Workshop on Magnetic Cataclysmic Variables, Hellier C., Mukai K., eds., p. 33
- Mukai (2017) Mukai K., 2017, PASP, 129, 062001
- Mukai, Ishida & Osborne (1994) Mukai K., Ishida M., Osborne J., 1994, PASJ, 46, 87
- Mukai et al. (2001) Mukai K., Kallman T., Schlegel E., Bruch A., Handler G., Kemp J., 2001, in ASP Conf. Ser., Vol. 251, New Century of X-ray Astronomy, p. 90
- Mukai et al. (2015) Mukai K., Rana V., Bernardini F., de Martino D., 2015, ApJ, 807, L30
- Muno et al. (2004) Muno M. P. et al., 2004, ApJ, 613, 326
- Nauenberg (1972) Nauenberg M., 1972, ApJ, 175, 417
- Norton et al. (1999) Norton A. J., Beardmore A. P., Allan A., Hellier C., 1999, A&A, 347, 203
- Norton et al. (2008) Norton A. J., Butters O., Parker T., Wynn G. A., 2008, ApJ, 672, 524
- Norton et al. (1997) Norton A. J., Hellier C., Beardmore A. P., Wheatley P. J., Osborne J. P., Taylor P., 1997, MNRAS, 289, 362
- Norton, Wynn & Somerscales (2004) Norton A. J., Wynn G. A., Somerscales R. V., 2004, ApJ, 614, 349
- Pala et al. (2017) Pala A. F. et al., 2017, MNRAS, 466, 2855
- Papitto et al. (2015) Papitto A., de Martino D., Belloni T. M., Burgay M., Pellizzoni A., Possenti A., Torres D. F., 2015, MNRAS, 449, L26
- Parisi et al. (2014) Parisi P. et al., 2014, A&A, 561, A67
- Parker, Norton & Mukai (2005) Parker T. L., Norton A. J., Mukai K., 2005, A&A, 439, 213
- Patruno & Watts (2012) Patruno A., Watts A. L., 2012, ArXiv:1206.2727
- Pecaut & Mamajek (2013) Pecaut M. J., Mamajek E. E., 2013, ApJS, 208, 9
- Perez et al. (2015) Perez K. et al., 2015, Nature, 520, 646
- Pickles (1998) Pickles A. J., 1998, PASP, 110, 863
- Plotkin, Gallo & Jonker (2013) Plotkin R. M., Gallo E., Jonker P. G., 2013, ApJ, 773, 59
- Pretorius & Mukai (2014) Pretorius M. L., Mukai K., 2014, MNRAS, 442, 2580
- Ramsay & Cropper (2004b) Ramsay G., Cropper M., 2004b, MNRAS, 347, 497
- Ramsay & Cropper (2007) Ramsay G., Cropper M., 2007, MNRAS, 379, 1209
- Ramsay et al. (2009) Ramsay G., Rosen S., Hakala P., Barclay T., 2009, MNRAS, 395, 416
- Reis et al. (2013) Reis R., Wheatley P., Gänsicke B., Osborne J., 2013, MNRAS, 430, 1994
- Revnivtsev et al. (2009) Revnivtsev M., Sazonov S., Churazov E., Forman W., Vikhlinin A., Sunyaev R., 2009, Nature, 458, 1142
- Revnivtsev et al. (2011) Revnivtsev M., Sazonov S., Forman W., Churazov E., Sunyaev R., 2011, MNRAS, 414, 495
- Rosen, Mason & Cordova (1988) Rosen S. R., Mason K. O., Cordova F. A., 1988, MNRAS, 231, 549
- Sazonov et al. (2006) Sazonov S., Revnivtsev M., Gilfanov M., Churazov E., Sunyaev R., 2006, A&A, 450, 117
- Schlafly & Finkbeiner (2011) Schlafly E. F., Finkbeiner D. P., 2011, ApJ, 737, 103
- Schwarz et al. (2005) Schwarz R., Reinsch K., Beuermann K., Burwitz V., 2005, A&A, 442, 271
- Schwope et al. (2014) Schwope A. D., Scipione V., Traulsen I., Schwarz R., Granzer T., Pires A. M., Thorstensen J. R., 2014, A&A, 561, A121
- Skinner, Thorstensen & Lépine (2014) Skinner J. N., Thorstensen J. R., Lépine S., 2014, AJ, 148, 115
- Skrutskie et al. (2006) Skrutskie M. F. et al., 2006, AJ, 131, 1163
- Smith & Dhillon (1998) Smith D., Dhillon, 1998, MNRAS, 301, 767
- Straižys & Lazauskaitė (2009) Straižys V., Lazauskaitė R., 2009, Baltic Astronomy, 18, 19
- Strüder et al. (2001) Strüder L. et al., 2001, A&A, 365, L18
- Suleimanov, Revnivtsev & Ritter (2005) Suleimanov V., Revnivtsev M., Ritter H., 2005, A&A, 435, 191
- Tetarenko et al. (2016) Tetarenko B. E. et al., 2016, ApJ, 825, 10
- Thorstensen & Halpern (2013) Thorstensen J. R., Halpern J., 2013, AJ, 146, 107
- Tomsick et al. (2016) Tomsick J. A., Rahoui F., Krivonos R., Clavel M., Strader J., Chomiuk L., 2016, MNRAS, 460, 513
- Turner et al. (2001) Turner M. J. L. et al., 2001, A&A, 365, L27
- van Paradijs & Verbunt (1984) van Paradijs J., Verbunt F., 1984, in AIP Conf. Ser., Vol. 115, High Energy transients in Astrophysics, Woosley S. E., ed., p. 49
- Warner (1995) Warner B., 1995, Cambridge Astrophysics Series, 28
- Warwick, Byckling & Pérez-Ramírez (2014) Warwick R. S., Byckling K., Pérez-Ramírez D., 2014, MNRAS, 438, 2967
- Wijnen, Zorotovic & Schreiber (2015) Wijnen T. P. G., Zorotovic M., Schreiber M. R., 2015, A&A, 577, A143
- Wilms, Allen & McCray (2000) Wilms J., Allen A., McCray R., 2000, ApJ, 542, 914
- Woelk & Beuermann (1996) Woelk U., Beuermann K., 1996, A&A, 306, 232
- Worpel et al. (2016) Worpel H., Schwope A. D., Granzer T., Reinsch K., Schwarz R., Traulsen I., 2016, A&A, 592, A114
- Wright et al. (2010) Wright E. L. et al., 2010, AJ, 140, 1868
- Wu, Chanmugam & Shaviv (1994) Wu K., Chanmugam G., Shaviv G., 1994, ApJ, 426, 664
- Wynn & King (1995) Wynn G. A., King A. R., 1995, MNRAS, 275, 9
- Xu, Wang & Li (2016) Xu X.-j., Wang Q. D., Li X.-D., 2016, ApJ, 818, 136
- Yuasa et al. (2010) Yuasa T., Nakazawa K., Makishima K., Saitou K., Ebisawa K., Mori H., Yamada S., 2010, A&A, 520, 25
- Zerbi, Chincarini & Ghisellini (2004) Zerbi F., Chincarini G., Ghisellini G. e. a., 2004, in Proc. SPIE, Vol. 5492, Ground-based Instrumentation for Astronomy, Moorwood F. M., Masanori I., eds., p. 1590
- Zorotovic, Schreiber & Gänsicke (2011) Zorotovic M., Schreiber M. R., Gänsicke B. T., 2011, A&A, 536, A42