ngVLA Memo #14
Short Spacing Considerations for the ngVLA111This work was done as part of the ngVLA Community Studies Program.
David T. Frayer (Green Bank Observatory)
2017 June 08
Abstract
The next generation Very Large Array project (ngVLA) would represent a major step forward in sensitivity and resolution for radio astronomy, with ability to achieve 2 milli-arcsec resolution at 100 GHz (assuming a maximum baseline of 300 km). For science on spatial scales of , the ngVLA project should consider the use of a large single dish telescope to provide short-spacing data. Large single-dish telescopes are complementary to interferometers and are crucial to providing sensitivity to spatial scales lost by interferometry. Assuming the current vision of the ngVLA (300 18m dishes) and by studying possible array configurations, I argue that a single dish with a diameter of m with approximately 20 element receiver systems would be well matched to the ngVLA for mapping observations.
1 Introduction
For interferometers there is a large trade-off between spatial resolution and surface-brightness sensitivity. As one moves the interferometer dishes to longer and longer baselines to achieve higher spatial resolution, the surface-brightness sensitivity decreases rapidly. The magnitude of this affect can be lessen to some degree by tapering the interferometric data to lower resolution and increasing the number of short baselines (e.g., [1]). However, the inherent trade-off between spatial resolution and brightness sensitivity is unavoidable. Data from a single-dish telescope could help to mitigate the loss of surface-brightness sensitivity and recover spatial information on scales larger than is visible with the ngVLA. This memo discusses recommendations for using a single dish to compensate for the lack of “zero-spacing” data for the ngVLA. The 100m Green Bank Telescope (GBT) is used for a comparison in this study, since the GBT is the only facility currently operating over the full range of ngVLA frequencies (1–115 GHz) with high sensitivity.
2 ngVLA Compared to the VLA, GBT, and ALMA
The relative point source sensitivity for radio facilities is basically the ratio of the system temperature divided by the total effective collecting area. This can be expressed as
| (1) |
where is the aperture efficiency, is the diameter of the telescope, and is the effective number of antennae. For a single-dish , and for an inteferometer, where is the correlator efficiency (which is 0.88 for ALMA, 0.93 for the VLA, and is assumed to be 0.93 for the ngVLA). Equation (1) assumes the same bandwidth and integration time. For single-dish comparisons, this equation should only be used for line sensitivities since single-dish continuum observations are typically limited by noise. The physical collecting area of the ngVLA is about 6, 10, and 13 times that of the VLA, GBT, and ALMA, respectively, which would provide a major improvement in point-source sensitivity.
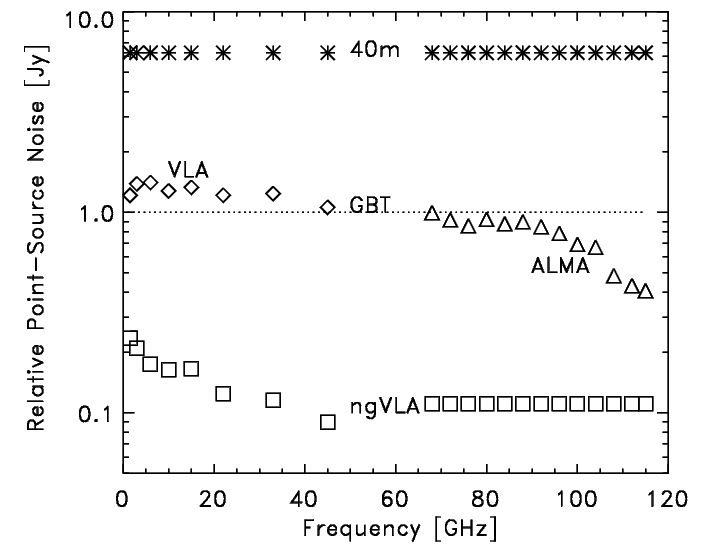
Figure 1 shows the relative point-source line sensitivity compared with the GBT as a function of frequency given by equation (1). The values below 84 GHz for ALMA assume the predicted Band-2 performance (when/if this band is available in the future). The values for the ngVLA are based on the information tabulated on the ngVLA web page and in ngVLA memo#5 [2]. The parameters (, ) estimated for the ngVLA in the 3mm band are similar to the GBT performance and were taken to match the GBT across the full 3mm band. A 40m single dish with the same performance parameters as the GBT is shown for comparison. The GBT has similar point-source sensitivity as the VLA and ALMA.
The relative time to map an area to the same depth for two different facilities is related to their relative sensitivities given in equation (1) as
| (2) |
The term represents the relative number of pointings required to cover the same area, i.e., a smaller dish has a bigger beam size and requires fewer pointings compared to a larger dish.
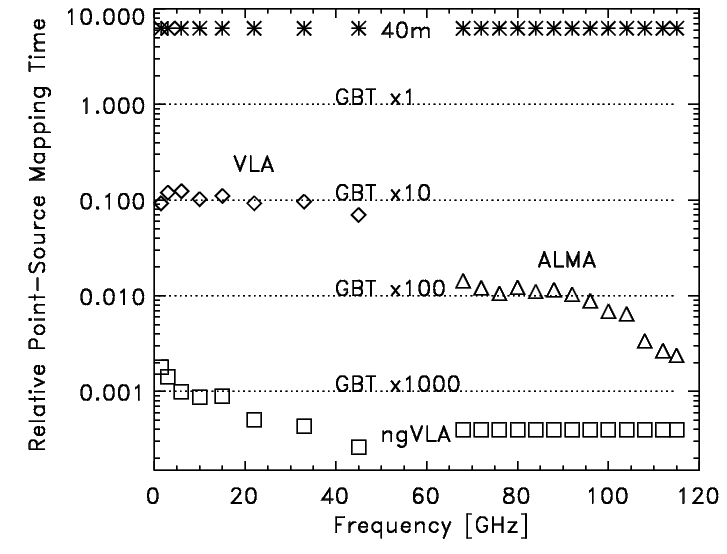
Figure 2 shows the relative point-source mapping speeds and highlights the power of the ngVLA. For comparison, the lines for the GBT are for one, 10, 100, and 1000 feeds. Large single dishes (which have small beams) require multiple feeds to be competitive in point-source mapping. For example, the K-band 7-element focal-plane-array on the GBT is well matched to the VLA, and a 100-element array at W-band would be well matched to ALMA (currently the GBT is limited to 16 feeds in the 3mm-band using Argus). Even with 1000 feeds on the GBT (which is possible for the 3mm-band), the ngVLA point-source mapping speed would be unmatched. The ngVLA would be, by far, the fastest point-source mapping instrument at high-frequencies compared with any current or any other planned instrument.
Of course, not all astronomical targets are point sources at the resolutions envisioned for the ngVLA. For extended objects the performance of the ngVLA depends significantly on source size. Surface-1brightness sensitivity () is typically given in Kelvin for radio astronomy and is proportional to point-source sensitivity divided by the beam area on the sky. The ratio of brightness sensitivities can be written as
| (3) |
where is the angular resolution of the synthesized beam for an interferometer and the primary beam for a single dish. In comparison with the compact “D-array” configuration of the VLA, the ngVLA has an improvement in resolution of a factor of 300 which would correspond to a decrease of in brightness sensitivity for the same point-source sensitivity.
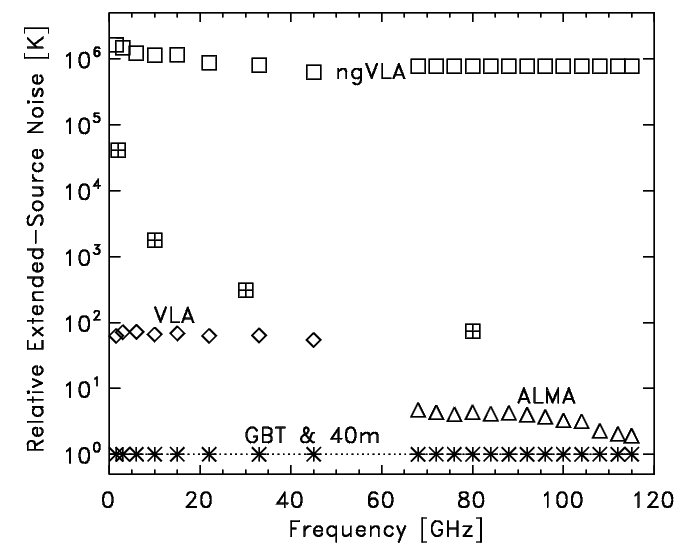
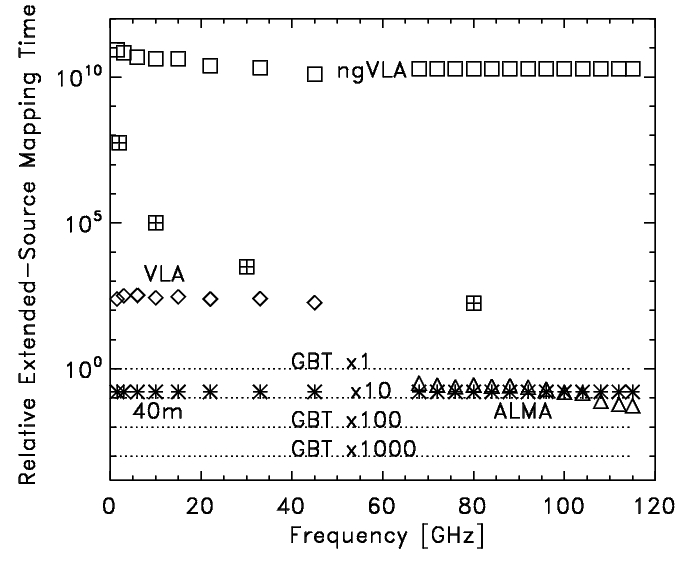
Figure 3 shows the brightness sensitivity of the ngVLA compared with the VLA and ALMA in their most compact configurations as well as with the GBT and a 40m single-dish telescope as function of frequency. The ngVLA data points that include tapering are for a beam based on values given on the ngVLA web page, and do not include the improvements for the proposed updated core configuration [1]. Without significant tapering or without single-dish data, the ngVLA is not useful for extended sources. Figure 4 shows the relative extended source mapping times. The GBT would be many orders of magnitude faster than the ngVLA interferometer in mapping extended sources. Single-dish data would greatly complement ngVLA observations of extended sources.
3 Single-Dish Size Recommended for the ngVLA
To estimate the size of the single dish needed for the ngVLA, three considerations are discussed in the following sub-sections. (§3.1) At the bare minimum, one needs overlapping UV coverage between the single dish and the ngVLA. (§3.2) For quality imaging, there should be sufficient UV coverage on short baselines to reconstruct the total power information. (§3.3) There should be similar sensitivity for the single-dish and the ngVLA data covering overlapping spatial scales.
3.1 Overlapping UV Coverage
The general rule-of-thumb for combining single-dish and interferometric data is that the size of the single dish should be at least 1.5–2 times that of the shortest baselines in order to provide sufficient overlapping UV coverage [3]. A simple way to look at this is the following. The maximum recoverable spatial scale of an interferometer is
| (4) |
where is the shortest baseline length, is wavelength, and is a coefficient between 0.4–1.0. The ALMA project team [4] adopts a value of , while VLA documentation [5] suggests a value of . One needs to be at least the size of the single-dish beam () to be able to recover emission on the scale of the beam size of the single dish. The FWHM beam size of a single dish of diameter is typically . Using the performance of the GBT as a guide [6],
| (5) |
is adopted for this memo. Using equations (4&5) and requiring , results in
| (6) |
The appropriate value for the coefficient depends on the actual source distribution and signal-to-noise of the data. Simple sources with high signal-to-noise data can get by with larger values of , while it is safer to use a smaller value of for more complicated sources at lower signal-to-noise.
Assuming a Gaussian source on the sky with a FWHM size of , the normalized visibility amplitude () as a function of projected baseline length in wavelength units () is given by [7] as
| (7) |
For a source whose size is equal to and for the shortest baseline length, . For the criterion, this corresponds to a visibility that is 0.28 times the source peak, while for the visibility threshold is about 0.1 times the source peak. Some authors adopt , but in this case less than 3% of the source peak is recovered, and one would be attempting to fit a Gaussian from only data within the wings of the profile. If one adopts a more conservative criterion corresponding to where the visibility amplitude is half the intensity of a Gaussian source peak, then . For this conservative case, . For the “ALMA” convention (), , while for the “VLA” convention () .
To avoid significant shadowing at low elevations, array antennae need to be separated by more than their physical diameter. At elevations of , shadowing is avoided if . If one uses the most compact configurations of PdBI or SMA as a guide, the shortest implied ngVLA spacing would be about 27m (). However, the ngVLA antennae could be placed in a somewhat more compact configuration given the large number of antennae for the ngVLA. Shadowing could be minimized by optimizing the compact core such that only a few antenna pairs would be affected at any specific hour angle. Adopting the ALMA Compact Array (ACA) as a guide, one could expect the smallest ngVLA antenna spacing of about 23m for the 18m ngVLA antenna ().
For ngVLA observations over a range of hour angles at intermediate elevations, the minimum projected baselines will typically be m (), regardless of the exact antenna spacing. However, to support observations near zenith and the spacing suggested by the ACA, the minimum recommended single-dish size for the ngVLA is about (i.e., equation [6] with ).
Studies combining single-dish data with interferometer data recommend a single-dish size of 1.5–2 [3,8], which is consistent with –0.6 used here. The minimum acceptable size is 1.5 for overlapping UV coverage, while for accurate cross-calibration of data sets is recommended [3]. Based on these previous studies and the results above, I adopt a value to provide the minimum allowable size for the single-dish and a value of to provided the recommended minimum size of the single dish. Therefore to provide sufficient overlapping UV coverage, the minimum allowable single-dish size is 34m (for the 18m antennae of the ngVLA) and the recommended minimum single-dish size is 45m.
3.2 Image Quality
The previous subsection discusses the minimum single-dish size based on having data with overlapping UV coverage, but did not address sensitivity or imaging quality. For proper image reconstruction, one needs a sufficient number of visibilities with overlapping UV coverage to provide similar sensitivity with the single-dish data, but equally important is sufficiently sampling the UV plane for image quality. For long interferometric observations that use the Earth’s rotation to fill-in the UV plane, a few short baselines would suffice. However, assuming the ngVLA will carryout short “snap-shot” observations, which could be envisioned for large mosaic mapping, it is important that each short observation fills-in the UV plane sufficiently. For complex structures, one would need a large number of baselines, while simpler regions could get by with fewer baselines. Arrays with less than 10 antennae (45 baselines) are generally not suitable for snap-shot observations (unless multiple observations are taken at different hour angles). The 27-element VLA (315 baselines) is sufficient for snap-shot observations. One could make the case for requiring somewhere between 45—315 baselines for sufficient UV coverage for snap-shot observations. Based on the studies of the ACA [9], I adopt the equivalent of the ACA (12-element, 66 baselines) for the minimum number of overlapping baselines to provide good UV coverage when combining with single-dish data.
Requiring at least 66 baselines with overlapping UV coverage is an additional constraint on the size of the single dish that is dependent on the ngVLA array configuration. Based on being greater than the single-dish beam size, the number of short-baselines with overlapping UV coverage with a single-dish is the number of baselines having a length less than . This is the definition of “good baselines” for different values of presented in Table 1. For the “core” configuration given in ngVLA Memo#12 (“Memo12-core”), this would suggest a recommended single-dish size of 70m () (Table 1). The “original” configuration in Memo#12 would require a single-dish size of 138m to provide at least 66 good baselines with overlapping UV coverage (with ).
Additional configurations were analyzed to test how many short baselines could be packed into a tight configuration to minimize the size of the single-dish required to provide at least 66 good baselines. All configurations studied here used 300 18m antennae. A “Clark-Conway” configuration was designed with 30% of the antennae (100) within the core arranged in a 10x10 grid with only 20m spacing (ignoring the effects of shadowing). This configuration is designated “Max-core” in Table 1. Although this configuration is not practical since shadowing would be significant except at high elevation, it is included in this study as a comparison. A more realistic possibility would be having multiple ACA cores to provide additional short baselines. The configuration designated ACA-5core is based on the Memo12-core configuration with its central 12 antennae replaced with a configuration with antenna separations scaled to the ACA example and having four additional scaled-ACA configurations centered at the corners of a square with (x,y) displacements of m from the ngVLA array center. This is the equivalent of having 5 copies of the scaled-ACA configuration within the ngVLA central core. The offsets of m were chosen for sensitivity on scales of at W-band which is based on one of the science drivers [10]. Antennae were semi-randomly replaced from the longer baseline positions from the Memo12-core configuration to provide the extra 48 central core antennae for the ACA-5core configuration. The ACA-5core configuration is not an optimal for imaging, but is used here to help quantify the number of overlapping short baselines available as a function of single-dish size.
For the ACA-5core configuration, the recommended minimum single-dish size is 50m () which is significantly reduced from the 70m dish size needed for the Memo12-core configuration. This 50m size limit is based on the constraint of having at least 66 good baselines for image quality and is close to the 45m limit required for having sufficient overlapping UV coverage. With more antennae concentrated in the core, additional configuration studies, and/or relaxing the imaging constraints, the this 50m limit could probably be lowered to the UV coverage limit of 45m. Adopting , one cannot lower the size of the single dish below 45m for 18m ngVLA antennae. Table 1 shows the number of “good” overlapping baselines for different values of as a function of single-dish size for the four ngVLA configurations studied here.
3.3 Sensitivity
For data combination, the sensitivity in the overlap region between an interferometer and a single dish should be similar. This has been discussed previously by multiple groups in significant detail (e.g., [8]). A somewhat simpler approach is adopted here. Assuming the single-dish telescope has similar performance parameters as the ngVLA antennae and for the same amount of integration time, the sensitivity is similar when , where is the “effective” number of baselines for the ngVLA. The noise in interferometer data is related to the number of effective baselines by
| (8) |
where is the typical noise for a single visibility () and represent the weight for each visibility. Assuming , then
| (9) |
Based on equation (7), the weights for the visibilities appropriate for a Gaussian source size equal to the single-dish beam is
| (10) |
where is the baseline length. Given the exponent in equation (10), long baseline visibilities provide very little signal on the spatial scales sampled by a single dish. The weights given by equation (10) are also the weights associated with tapering the ngVLA data to the resolution of the single-dish beam size. Table 2 shows as a function of single-dish size for the four studied ngVLA configurations. These results are independent of wavelength.
To achieve similar sensitivities for the spatial scale defined by the single dish, the ratio of integration time between the ngVLA and the single dish for mapping an area is given by [11]
| (11) |
where is the number of feeds for the single dish. Table 2 shows the mapping time ratio as a function of single-dish size assuming a single feed for the single dish. This value also represents the number of single-dish feeds required to have similar mapping times as the ngVLA. For the Memo12-core configuration, these results imply that about 20 feeds are needed for the single dish to provide similar mapping times. For the ACA-5core configuration, which has higher sensitivity on short-baselines, about 40 feeds would be required for the single dish to match the mapping speed of the interferometer.
The requirement of similar sensitivity between the ngVLA and the single dish effectively defines the optimal number of feeds needed for the single dish. Interestingly, the number of feeds is nearly independent of dish size. Therefore, the choice of ngVLA configuration will set the optimal number of feeds required for the single dish, independent of single-dish size. Larger single dishes will provide deeper maps, but having matched sensitivities is independent of the depth of the map. The depth of the maps required is driven by the science needs. The next section shows the ngVLA sensitivity as a function of source size which could be used to help define the sensitivity requirement.
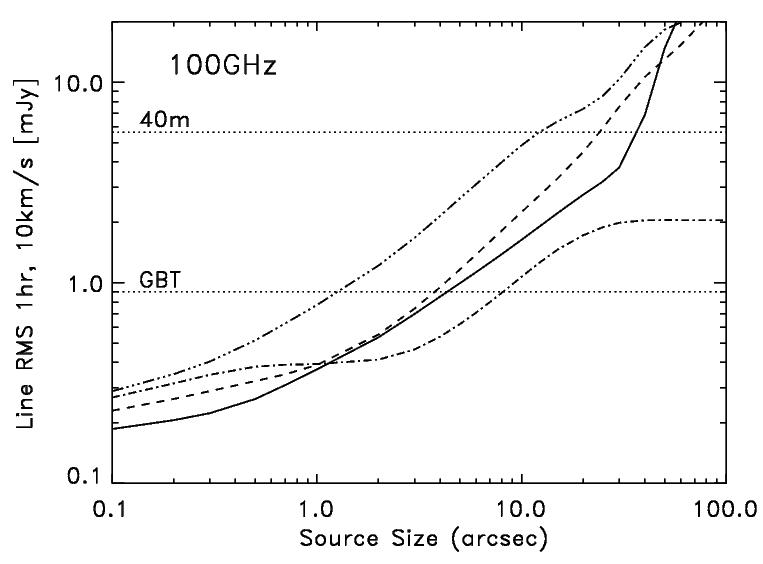
4 Line Sensitivity as a Function of Source Size
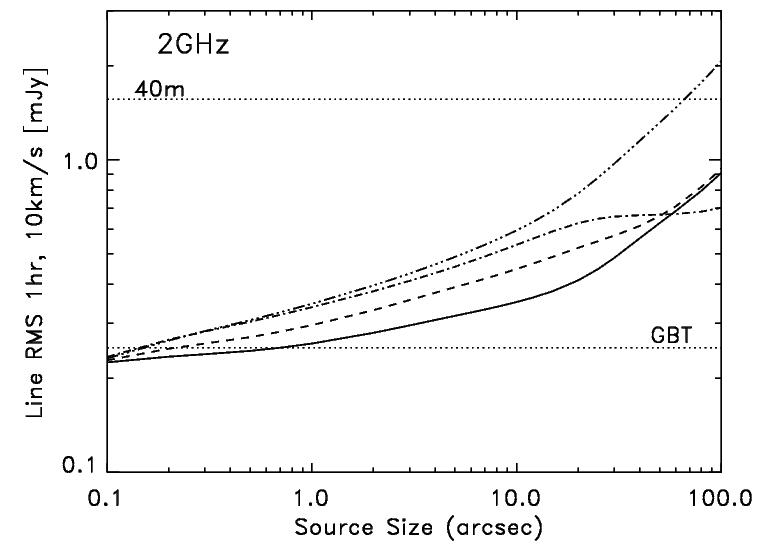
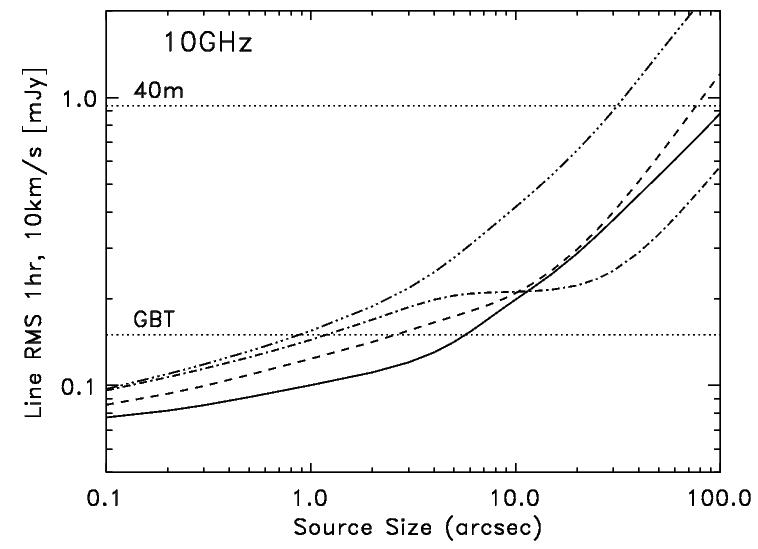
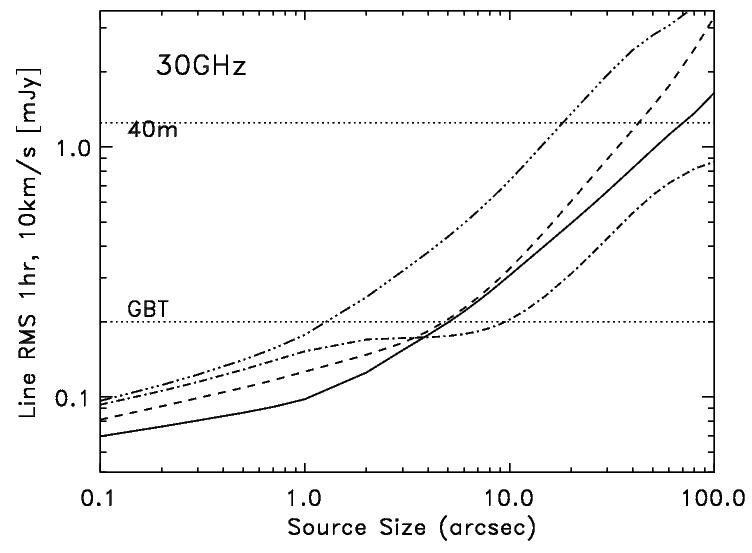
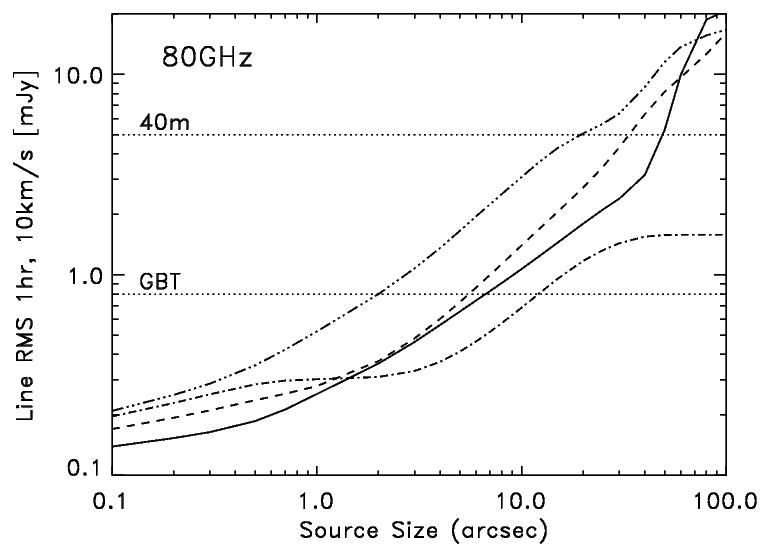
The line sensitivity of the ngVLA for the four different configurations is computed using the number of effective baselines as a function source size and configuration. The number of effective baselines is given by equation (9) with weights from equation (7). These weights are consistent with tapering the ngVLA data to a resolution that matches the size of the source. The sensitivity is scaled from the full array point-source sensitivity values using . Plots 5-9 show the results for the nominal ngVLA frequencies of 2, 10, 30, 80, and 100 GHz [2]. These plots highlight the strength of the ngVLA for small spatial-scales . For spatial scales , the ngVLA is less sensitive than the GBT. If the science requires high sensitivity on the scales of , then combining ngVLA data with data from a large single dish (e.g., 100m GBT) will be superior than using a smaller single dish.
5 CASA Simulations
CASA simulations were carried out at 90 GHz to test the photometric accuracy of combining single-dish data with simulated ngVLA data. The results presented here are based on the Memo12-core configuration (as provided by the ngVLA project for the community studies program). The longest baselines of the ngVLA were not used in the CASA simulations due to limitations in simulating a large region () required for comparison with single-dish data with an input truth image having a pixel size of less than (which implies a pixel (40GB) input truth image).
The task simobserve was used to simulate ngVLA mosaic observations using an input truth image as the “skymodel” with a total integration time of 1 hour. The simulated ngVLA visibilities were imaged using the task clean and simulated single-dish data were used for the “modelimage” for the combination of ngVLA and single-dish data. The input single-dish images were made by convolving the truth image with an appropriately sized Gaussian representing a single dish with a size of 30m, 40m, 50m, and 100m. The single-dish data were noiseless. This is an idealized experiment to test the ability to recover flux assuming perfect single-dish data. All data were cleaned down to a similar level and the noise levels in the output images were approximately 1–2 mJy per beam with a beam size of .
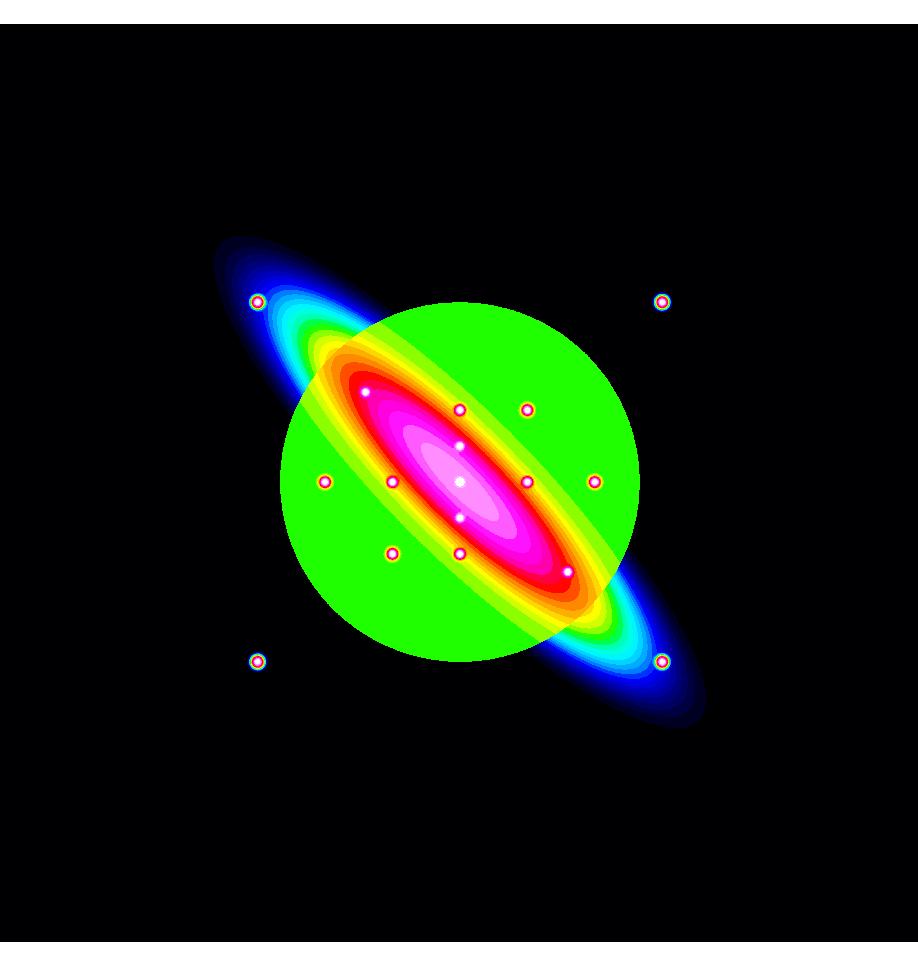
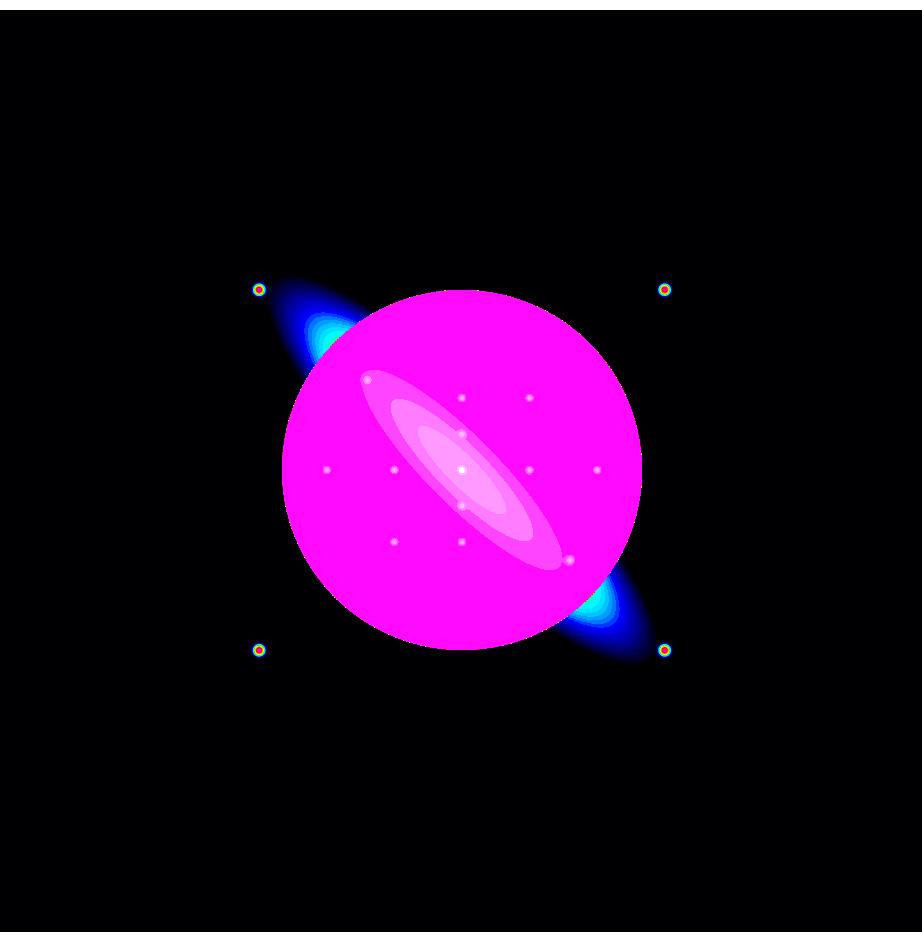
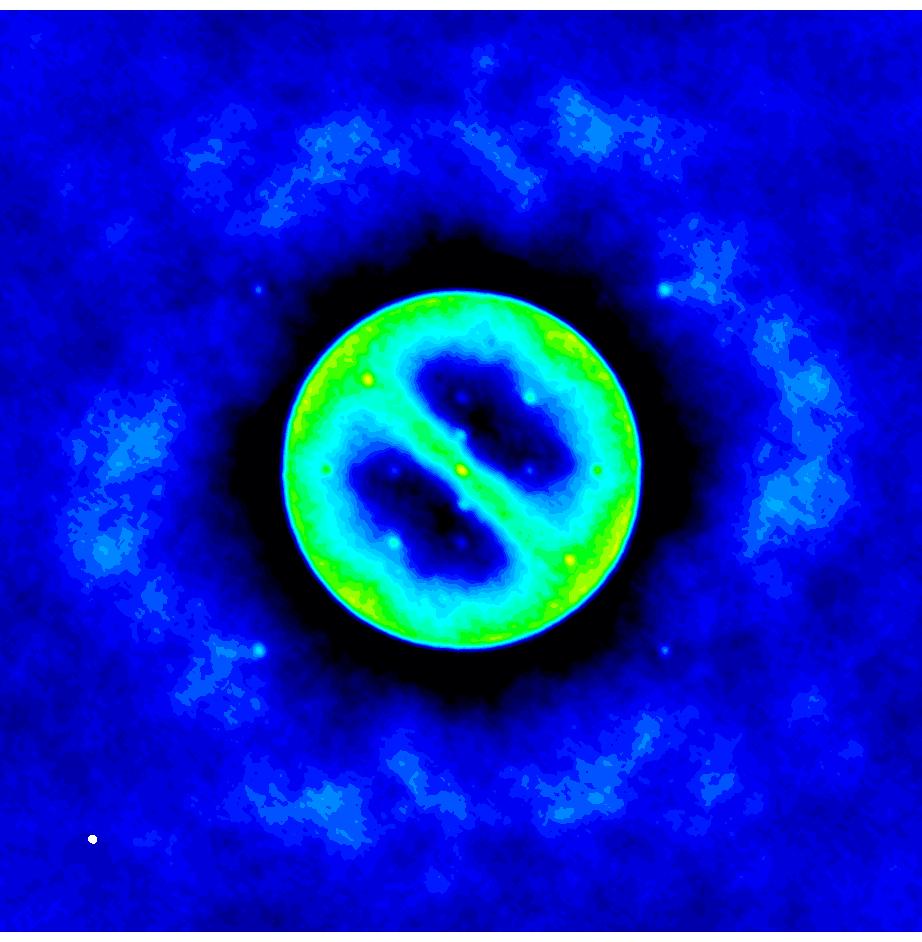
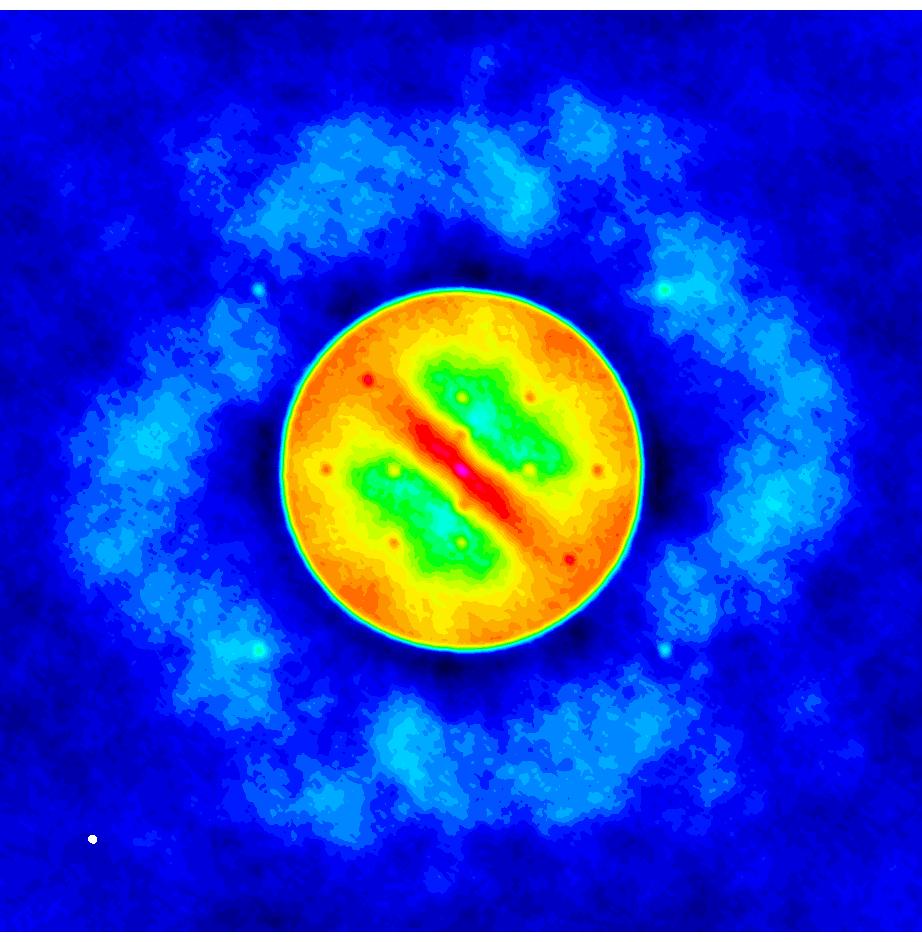
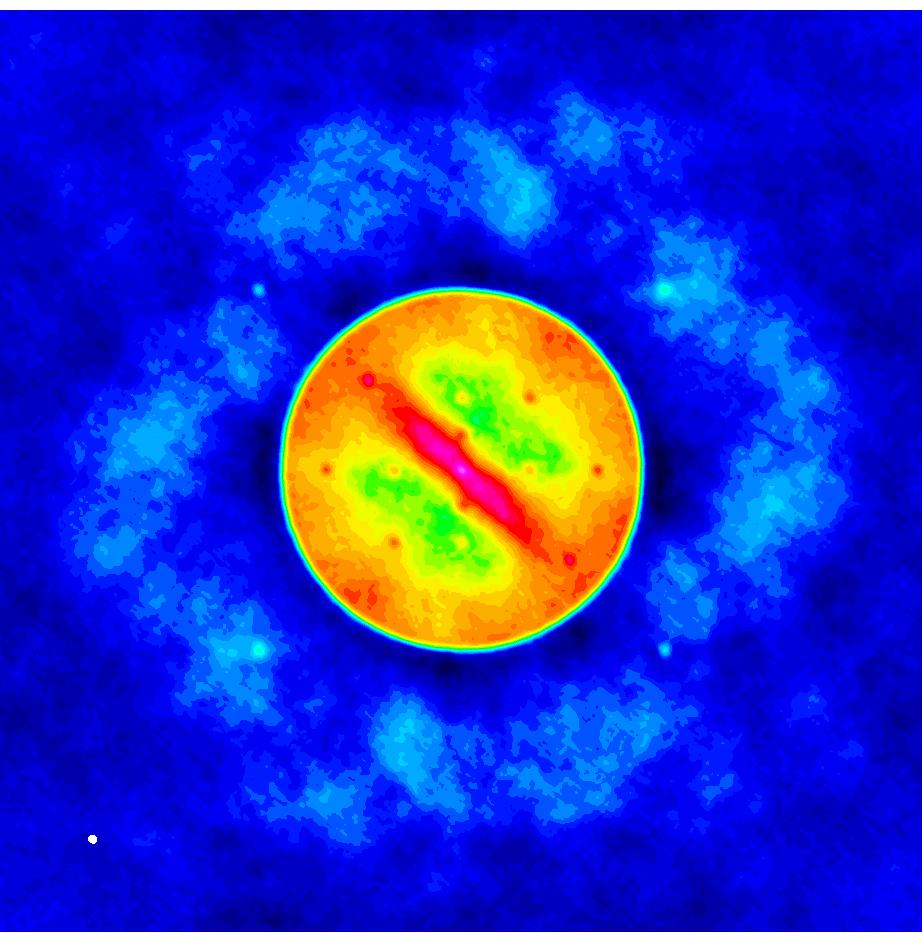
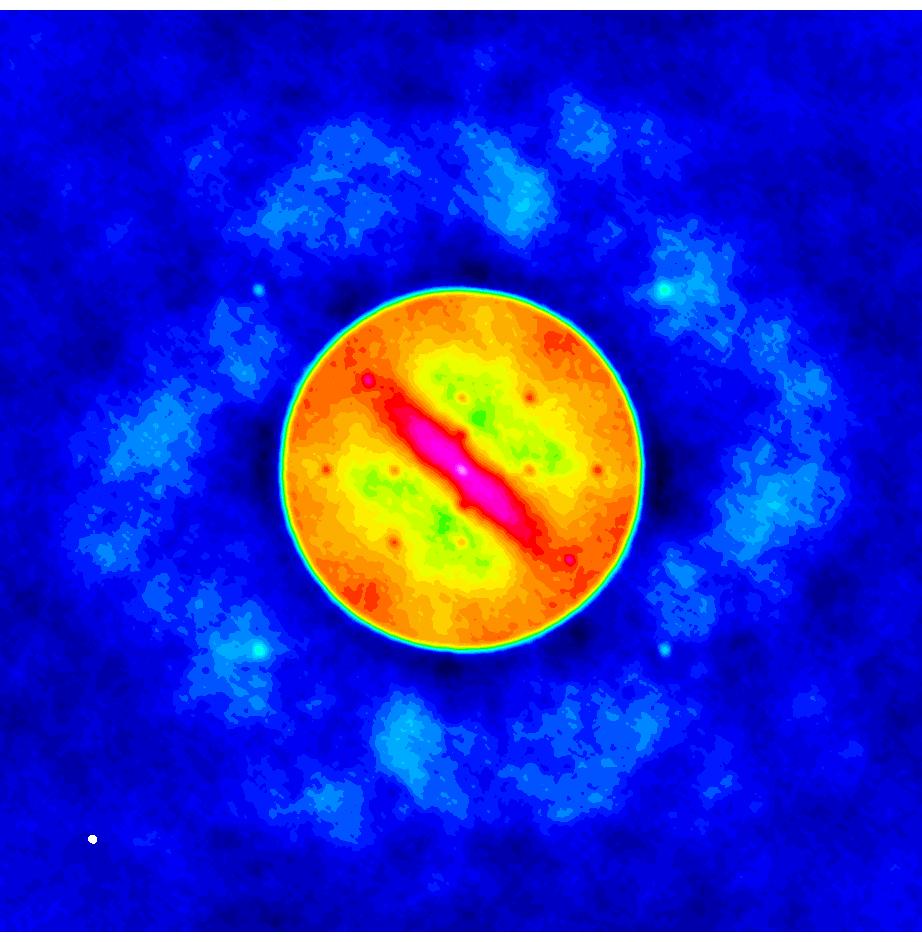
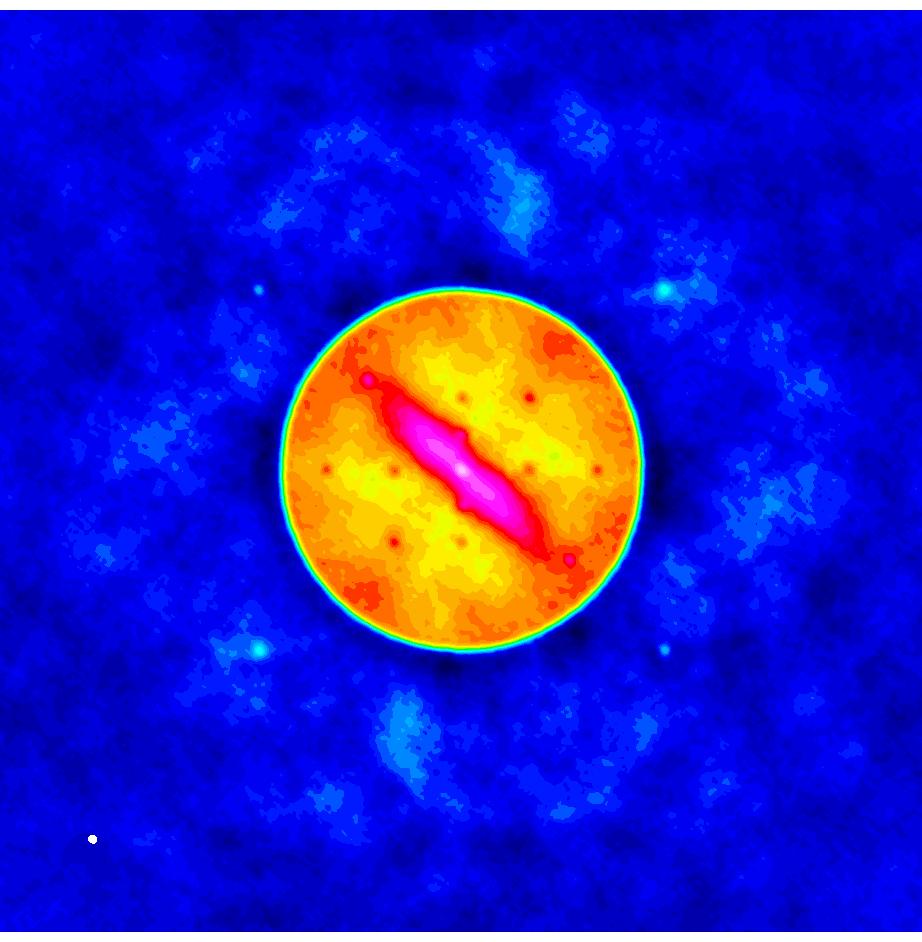
To test the ability to image regions with different sizes, the input truth image was comprised of a diameter circular pill-box, a large Gaussian disk profile with a FWHM of , and 17 small Gaussian sources with a FWHM of (Fig. 10). Two sets of simulations were carried out. One set used bright small sources, and for the other set of simulations, the peak brightness of all the components were the same.
5.1 Simulation with Bright Small Sources
For the first set of simulations, the 17 small sources were much brighter than the large circular pill-box and the Gaussian disk. The peak brightness for the small Gaussian sources was 240 mJy per sq-arcsec, while the peak surface-brightness for the Gaussian disk was 96 mJy per sq-arcsec. The level for the large circular pill-box (1.9 mJy per sq-arcsec) was only slightly above the noise in the image. The goal of this experiment is to test the photometric accuracy of small sources in the presence of weaker extended emission.
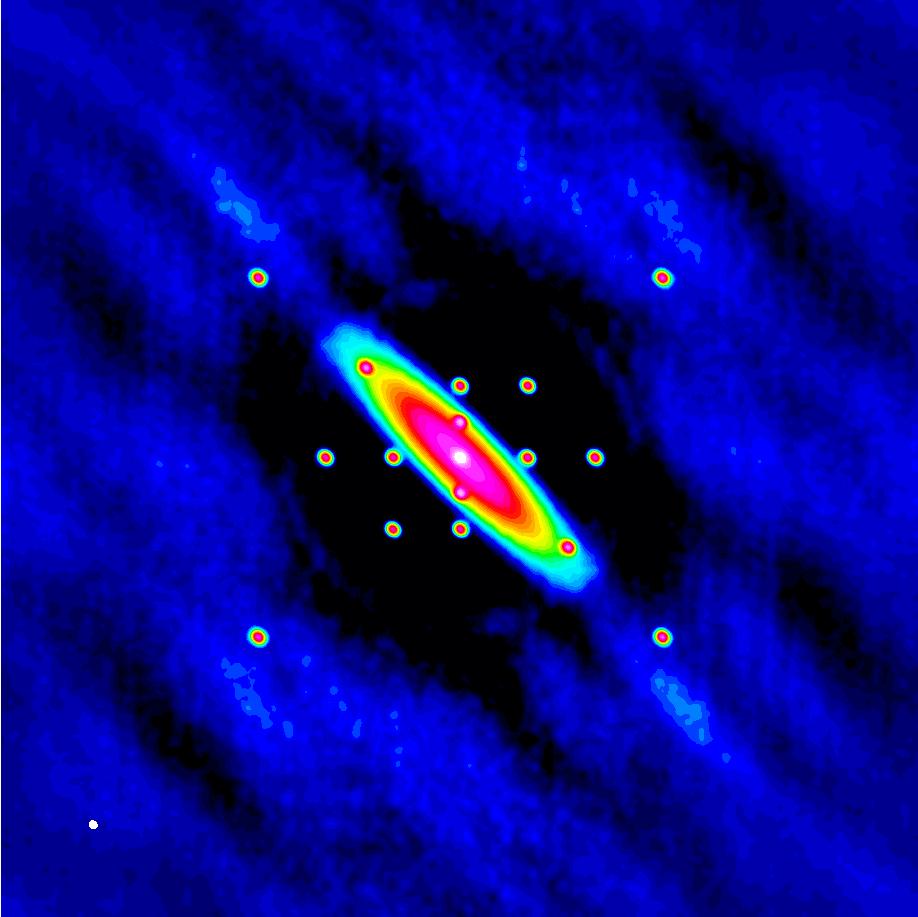
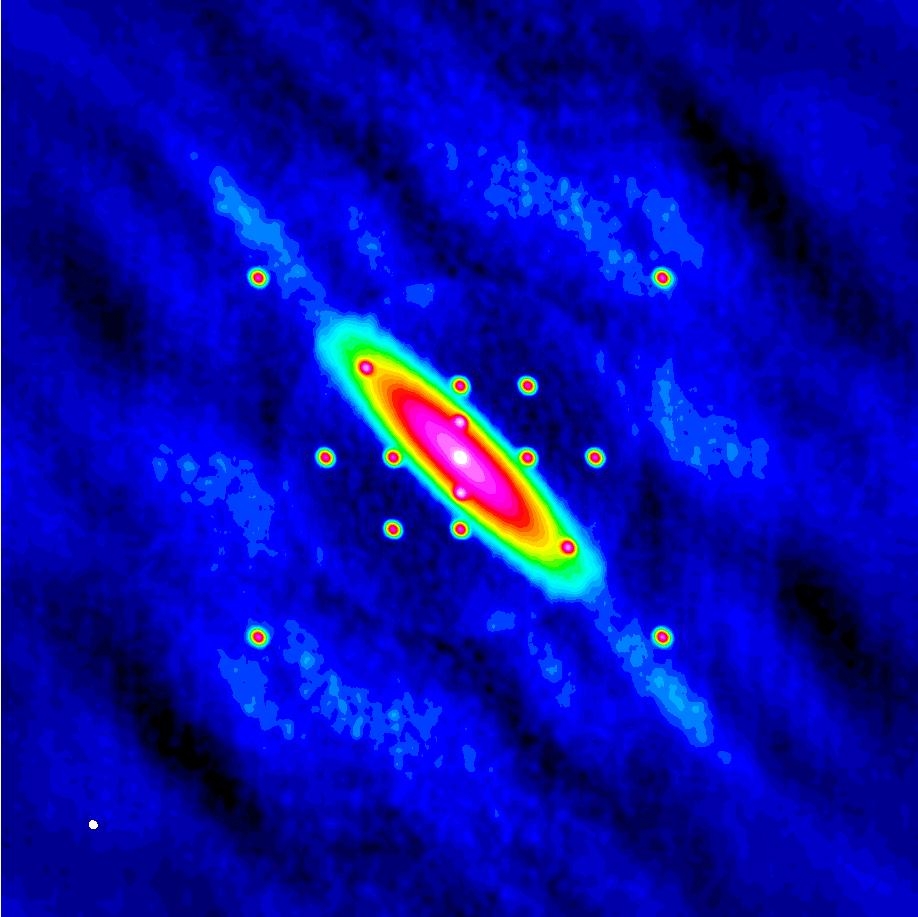
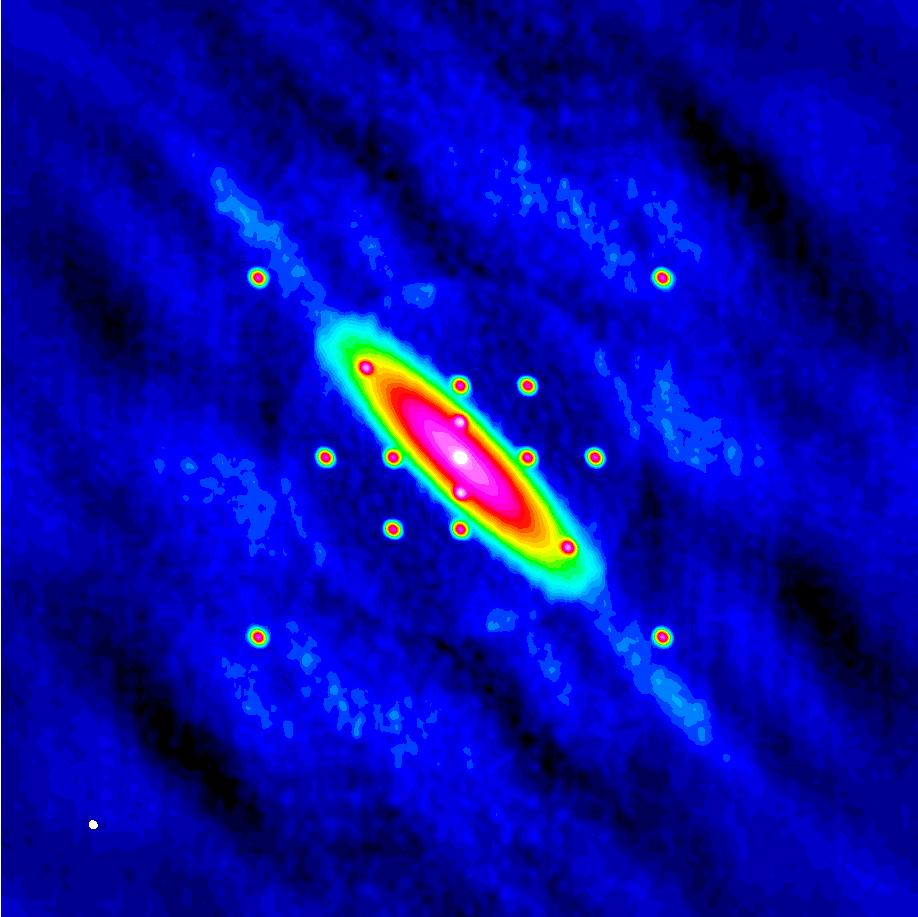
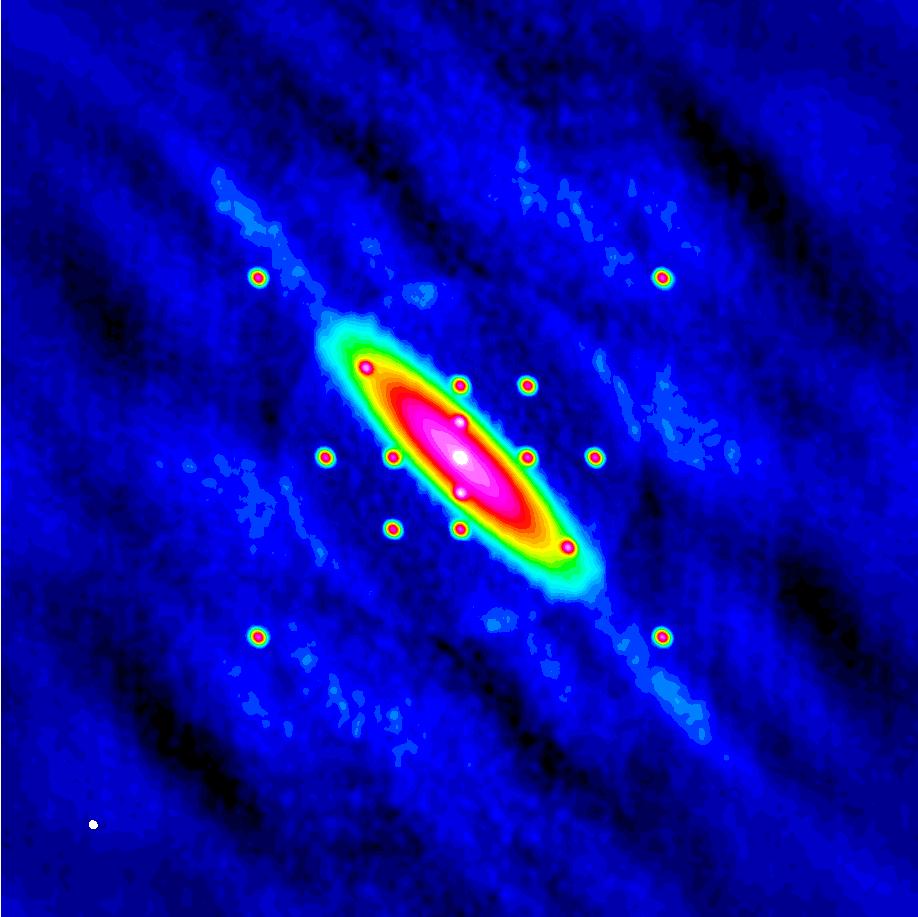
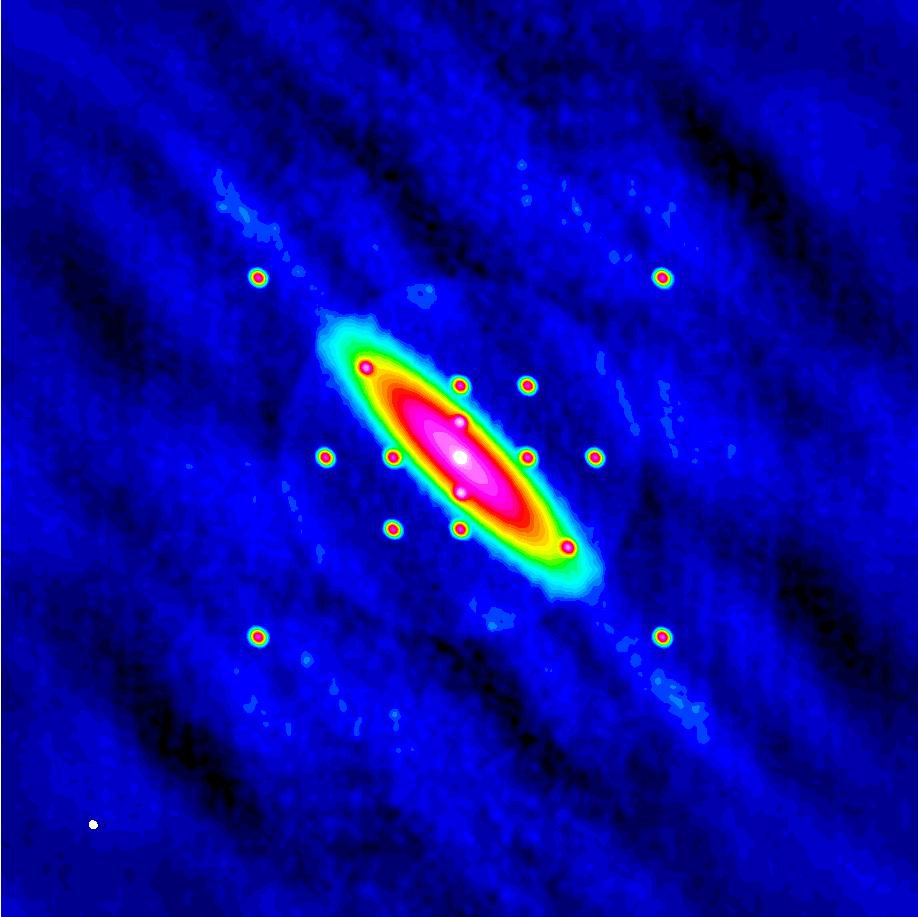
Figure 11 shows the results of imaging the ngVLA data without any single-dish data, while Figures 12–15 show the results for combining the ngVLA data with data from a 30m, 40m, 50m, and 100m single dish, respectively. Without any single-dish data, the image results in a significant negative bowl (which is expected when lacking zero-spacing data). Visually, even the ngVLA+30m imaging does a reasonable job at recovering the large-scale emission within the image. The imaging improves marginally with data from a progressively larger single dish.
To quantify the results, aperture measurements were made on all the images (Table 3). Without single-dish data, the photometry in the simulated ngVLA data is not very accurate even for the small sources. Aperture measurements for the 10 small sources farthest from the bright regions of the Gaussian disk were used to estimate the photometric errors. These errors represent the standard deviation (scatter) of the aperture measurements for sources with the same input flux densities. Without including single-dish data, there was a 22.4% photometric error in ngVLA image. In comparison for the ngVLA+100m image, there was an uncertainty of 4.6%. The empirical measurement errors are estimated to be 3% for individual sources. By removing the 3% measurement error in quadrature, I estimate errors due to imaging from these simulations and tabulate the results in Table 3. For the ngVLA+30m and ngVLA+40m combinations, the photometric imaging errors are %, while the ngVLA+50m and ngVLA+100m combinations have photometric imaging errors of 4%.
In addition to the photometric results, Table 3 shows the total fractional flux recovered for the entire image and the Gaussian disk. All the ngVLA+single-dish images recover the full input flux. In fact, for these simulations, the total output flux was slightly larger than the input flux when measured over the same area. This discrepancy is not due to the single-dish data (since these were noiseless), and may indicate that the simulation process and/or imaging does not completely conserve surface brightness (tiny systematic errors for a large number of pixels can add up over a large area).
A primary result from this experiment is that single-dish data are important for accurate photometry even if one is only interested in small sources within complex regions.
5.2 Simulation with Bright Large Sources
For the second set of simulations, the large circular pill-box had the same input surface brightness (9.6 mJy per sq-arcsec) as the peak of the small sources and the peak of the large Gaussian disk (Fig. 16). This simulation highlights the importance of a large single dish. Data from small single dishes do not have the resolution to properly reconstruct the total power information in the central regions of the pill-box and the Gaussian disk (Figs. 17–21). In this case, the simulation using the ngVLA+100m single-dish data is significantly superior than smaller single-dish combinations.
Based on the theoretical arguments in Section 3.2, the Memo12-core configuration only had a sufficient number of “good” baselines for the 100m combination in these simulations (i.e., needed a 70m dish to achieve the desired 66 “good” baselines). To test the relative importance of the size of the single-dish versus the number of short baselines for the ngVLA, this simulation was repeated with the Core-5ACA configuration which has five times as many short baselines. The additional short baselines from the Core-5ACA configuration did not improve the results in this simulation. Therefore, the larger the single dish, the better the results will be for recovering complex emission from large sources when combining with ngVLA observations.
6 Discussion
Of the three criteria given in Section 3 for choosing the size of the single dish, the requirement of sufficient overlapping UV coverage appears to be the most important (Section 3.1). The requirement of having similar sensitivities (Section 3.3) does not constrain the single-dish size, but rather sets the number of optimal feeds required for the single dish. The simulation results imply that the metric of having 66 “good” baselines for image quality (Section 3.2) is not a firm requirement. The many 1000’s of baselines available from the ngVLA with low weights and lengths larger than the “good” threshold level () appear to provide adequate information for image reconstruction. For example, in the simulations presented here, a 40m single dish performs fairly well, but only has 23 “good” baselines even with the relaxed definition of for the simulated Memo12-core configuration.
As derived in Section 3.1, the required single-dish size for the ngVLA is . For m, this corresponds to 45 m for (recommended value) and 34 m (minimum value) for .
The simulations show that having a larger single dish produces better results, especially for imaging large complex sources. Whatever the single-dish size, it is important to have quality single-dish data. The simulations presented here assumed noiseless single-dish data, but previous detailed studies suggest signal-to-noise ratios of S/N are needed to avoid significant imaging errors [8].
It would be reasonable for the ngVLA project to deploy a dedicated single dish to be used with the array. Many projects would benefit from the combination of the array data with data taken with a single dish of size 34–50m. For extended-source projects that require higher sensitivity (e.g., sub-mJy 1hr, 10 km/s sensitivity at 3mm), the GBT could be used to provide the single-dish data.
The choice of single-dish properties depends on the ngVLA array configuration as well as the ngVLA antenna size. The core of the ngVLA should be optimized to minimize shadowing while maximizing the number of baselines overlapping with the single dish. A larger single dish provides more flexibility. If the ngVLA needs to support snap-shot observations, then multiple compact cores may be required to provide a sufficient number of instantaneous short baselines for combination with single-dish data. In this memo, 66 “good” baselines was adopted as a criterion based on the ACA, but the value of 66 as well as the definition of “good” is admittedly somewhat arbitrary. More detailed simulations should be done to test the limits for short snap-shot integrations for large mosaic mapping with the ngVLA.
7 Concluding Remarks
Assuming that the ngVLA antenna locations are not re-configurable, the final ngVLA configuration decision will need to be a compromise between good high-resolution imaging and the number of antennae that will comprise the core(s). The ngVLA project should include a large single dish which would complement the interferometric data. A larger single dish relaxes the requirements on the configuration of the compact core compared to a smaller single dish, as well as providing better data products. The smallest recommended single-dish size is 45m for the 18m ngVLA antenna size. Adopting the Memo12-core configuration suggests that the single dish should be deployed with about 20 feeds to provide matched mapping times with the ngVLA interferometric observations.
8 References
-
1.
Carilli, C. L. 2016, The Strength of the Core, ngVLA Memo #12
-
2.
Carilli, C. L., et al. 2015, Science Working Groups Project Overview, ngVLA Memo #5
-
3.
Stanimirovic, S. 2002, Short-Spacings Correction from the Single-Dish Perspective, Single-Dish Radio Astronomy: Techniques and Applications, ASP Conference Proceedings, Vol. 278., 375-396
-
4.
ALMA Technical Handbook, 2017 Cycle 5: https://almascience.nrao.edu/documents-and-tools/cycle5/alma-technical-handbook/view
-
5.
Perley, R. A. 1995, Very Large Array Observational Status Summary
-
6.
Frayer, D.T. 2017, The GBT Beam Shape at 109 GHz, GBT Memo #296
-
7.
Wilner, D.J. & Welch, W. J. 1994, ApJ, 427, 898
-
8.
Kurono, Y., Morita, K. & Kamazaki, T. 2009, PASJ, 61, 873
-
9.
Wright, M.C.H. 2003, Heterogenous Imaging with the ALMA Compact Array, ALMA Memo #450
-
10.
Leory, A. K. et al. 2015, Science Working Group 2: “Galaxy Ecosystems”: The Matter Cycle in and Around Galaxies, ngVLA Memo #7
-
11.
Mason, B.S. & Brogan, C. 2013, Relative Integration Times for the ALMA Cycle 1 12-m, 7-m, and Total Power Arrays, ALMA Memo #598
| SD | Memo12-orig | Memo12-core | Max-core | ACA-5core | ||||||||||||
|---|---|---|---|---|---|---|---|---|---|---|---|---|---|---|---|---|
| Size | for values = 0.44, 0.6, 0.8, and 1.0 | |||||||||||||||
| (m) | 0.44 | 0.6 | 0.8 | 1.0 | 0.44 | 0.6 | 0.8 | 1.0 | 0.44 | 0.6 | 0.8 | 1.0 | 0.44 | 0.6 | 0.8 | 1.0 |
| 30 | 0 | 0 | 2 | 12 | 0 | 0 | 4 | 19 | 0 | 0 | 180 | 180 | 0 | 0 | 1 | 72 |
| 35 | 0 | 0 | 5 | 15 | 0 | 0 | 9 | 37 | 0 | 0 | 180 | 342 | 0 | 0 | 40 | 86 |
| 40 | 0 | 2 | 14 | 17 | 0 | 4 | 23 | 57 | 0 | 180 | 180 | 342 | 0 | 1 | 75 | 130 |
| 45 | 0 | 3 | 17 | 21 | 0 | 7 | 38 | 77 | 0 | 180 | 342 | 342 | 0 | 15 | 87 | 182 |
| 50 | 0 | 12 | 17 | 24 | 0 | 19 | 57 | 99 | 0 | 180 | 342 | 502 | 1 | 72 | 130 | 215 |
| 55 | 2 | 14 | 20 | 26 | 4 | 30 | 77 | 132 | 180 | 180 | 342 | 790 | 1 | 79 | 177 | 261 |
| 60 | 3 | 17 | 23 | 35 | 6 | 38 | 91 | 153 | 180 | 342 | 502 | 790 | 3 | 87 | 206 | 306 |
| 65 | 5 | 17 | 25 | 44 | 10 | 54 | 112 | 178 | 180 | 342 | 502 | 790 | 41 | 108 | 229 | 352 |
| 70 | 14 | 17 | 26 | 53 | 20 | 67 | 134 | 211 | 180 | 342 | 790 | 918 | 72 | 155 | 269 | 407 |
| 75 | 14 | 21 | 35 | 57 | 30 | 77 | 153 | 253 | 180 | 342 | 790 | 1310 | 79 | 182 | 306 | 461 |
| 80 | 15 | 23 | 42 | 63 | 38 | 91 | 172 | 285 | 342 | 502 | 790 | 1310 | 87 | 206 | 337 | 502 |
| 85 | 17 | 24 | 49 | 70 | 47 | 104 | 199 | 328 | 342 | 502 | 918 | 1310 | 96 | 219 | 382 | 555 |
| 90 | 17 | 25 | 54 | 83 | 56 | 126 | 225 | 366 | 342 | 790 | 1058 | 1534 | 125 | 242 | 421 | 600 |
| 95 | 17 | 26 | 59 | 88 | 66 | 140 | 261 | 416 | 342 | 790 | 1310 | 1654 | 149 | 282 | 470 | 670 |
| 100 | 20 | 35 | 63 | 95 | 77 | 153 | 285 | 462 | 342 | 790 | 1310 | 1870 | 177 | 306 | 502 | 722 |
| SD | Memo12-orig | Memo12-core | Max-core | ACA-5core | ||||
|---|---|---|---|---|---|---|---|---|
| Size | Effective | Effective | Effective | Effective | ||||
| (m) | Baselines | Baselines | Baselines | Baselines | ||||
| 30 | 10.8 | 7.8 | 23.2 | 16.7 | 215.8 | 155.4 | 76.8 | 55.3 |
| 35 | 13.4 | 7.1 | 34.1 | 18.0 | 245.3 | 129.7 | 94.7 | 50.1 |
| 40 | 15.4 | 6.2 | 46.1 | 18.7 | 279.9 | 113.4 | 114.3 | 46.3 |
| 45 | 17.2 | 5.5 | 59.0 | 18.9 | 320.4 | 102.5 | 135.9 | 43.5 |
| 50 | 19.2 | 5.0 | 72.9 | 18.9 | 367.6 | 95.3 | 159.4 | 41.3 |
| 55 | 21.4 | 4.6 | 87.6 | 18.8 | 421.6 | 90.3 | 184.2 | 39.5 |
| 60 | 24.0 | 4.3 | 103.4 | 18.6 | 481.9 | 86.7 | 210.3 | 37.9 |
| 65 | 26.9 | 4.1 | 120.2 | 18.4 | 547.7 | 84.0 | 237.4 | 36.4 |
| 70 | 30.2 | 4.0 | 138.3 | 18.3 | 618.3 | 81.8 | 265.5 | 35.1 |
| 75 | 33.9 | 3.9 | 157.6 | 18.2 | 692.9 | 79.8 | 294.5 | 33.9 |
| 80 | 37.8 | 3.8 | 178.1 | 18.0 | 770.9 | 78.1 | 324.3 | 32.8 |
| 85 | 42.0 | 3.8 | 199.9 | 17.9 | 852.0 | 76.4 | 354.8 | 31.8 |
| 90 | 46.5 | 3.7 | 223.0 | 17.8 | 935.7 | 74.9 | 386.0 | 30.9 |
| 95 | 51.1 | 3.7 | 247.3 | 17.8 | 1021.5 | 73.3 | 417.7 | 30.0 |
| 100 | 56.0 | 3.6 | 272.8 | 17.7 | 1109.4 | 71.9 | 449.9 | 29.2 |
| Measurement | ngVLA | ngVLA+ | ngVLA+ | ngVLA+ | ngVLA+ |
|---|---|---|---|---|---|
| 30m | 40m | 50m | 100m | ||
| Photometric errorsa | 22.4% | 8.3% | 6.2% | 5.3% | 4.6% |
| Imaging errorsb | 22.2% | 7.7% | 5.4% | 4.4% | 3.5% |
| Gaussian disk flux ratioc | 0.76 | 1.02 | 1.05 | 1.06 | 1.02 |
| Total flux ratioc | 0.32 | 1.07 | 1.12 | 1.13 | 1.06 |
(a) Errors representing the scatter of photometric measurements for the small sources. (b) Inferred imaging errors after removing the empirical measurement uncertainties. (c) Flux ratio is measured/input.
| Measurement | ngVLA | ngVLA+ | ngVLA+ | ngVLA+ | ngVLA+ |
|---|---|---|---|---|---|
| 30m | 40m | 50m | 100m | ||
| Gaussian disk flux ratioa | 0.22 | 0.69 | 0.78 | 0.83 | 0.92 |
| Total flux ratioa | 0.08 | 0.80 | 0.88 | 0.90 | 0.95 |
(a) Flux ratio is measured/input.
