Two-color Thermosensors based on [Y1-XDyX(acetylacetonate)3(1,10-phenanthroline) Molecular Crystals
Abstract
We develop a two-color thermometry (TCT) phosphor based on [Y1-xDyx(acetylacetonate)3(1,10-phenanthroline)] ([Y1-xDyx(acac)3(phen)]) molecular crystals for use in heterogeneous materials. We characterize the optical properties of [Y1-xDyx(acac)3(phen)] crystals at different temperatures and Dy concentrations and find that the emission is strongly quenched by increasing temperature and concentration. We also observe a broad background emission (due to the ligands) and find that [Y1-xDyx(acac)3(phen)] photodegrades under 355 nm illumination with the photodegradation resulting in decreased luminescence intensity. However, while decreasing the overall emission intensity, photodegradation is not found to influence the integrated intensity ratio of the and transitions. This ratio allows us to compute the temperature of the complex Based on the temperature dependence of these ratios we calculate that [Y1-xDyx(acac)3(phen)] has a maximum sensitivity of 1.5 % K-1 and our TCT system has a minimum temperature resolution of 1.8 K. Finally, we demonstrate the use of [Y1-xDyx(acac)3(phen)] as a TCT phosphor by determining a dynamic temperature profile using the emission from [Y1-xDyx(acac)3(phen)].
I Introduction
Plastic bonded explosives (PBXs) are heterogeneous materials consisting of energetic organic molecular crystals (e.g. RDX, PETN, and TNT) embedded in a polymer matrix, with possible additional additives being: plasticizers, antioxidants, taggants/markers, and friction-generating grit. These energetic organic molecular crystals can be initiated by a variety of stimuli, including thermal, mechanical or electrical. In the case of non-thermal initiation, it is believed that these stimuli first heat the energetic material, which then causes thermally-induced chemical decomposition to occur.
For mechanical shock initiation this heating is due to the shock induced formation of hot-spots within the material. Much research has been devoted to understanding shock induced hotspot formation Chen14.01 ; Chen14.02 ; Pokharel14.01 ; An13.01 ; Wu11.01 ; Rae02.01 ; Gruzdkov01.01 ; Gupta95.01 ; Mellor93.01 ; Field92.01 ; Field92.02 ; Field82.01 ; Winter75.01 ; Chaudhri74.01 with the main mechanisms being: pore collapse Chaudhri74.01 , plastic deformation Pokharel14.01 ; Winter75.01 ; Field82.01 , micro-fractures, binder/crystal interface friction, and crystal/crystal interface friction. While these mechanisms have been identified to form hot-spots in shocked heterogeneous materials, it is currently unknown which of these mechanisms are responsible for chemical energy release for a given material composition and loading condition Field82.01 .
Determining this dependence requires performing simultaneous time-resolved microstructural and thermal imaging of heterogeneous sample under shock compression. Performance of these measurements is difficult, as shock-compression events typically occur on the ns-s time scales and microstructural imaging typically utilizes synchrotron X-Ray phase contrast imaging Luo12.01 ; Jensen14.01 ; Jensen12.01 ; Yeager12.01 ; Luo12.02 . One approach to performing in situ microstructural imaging is the recently inaugurated NNSA sponsored Dynamic Compression Sector (DCS) at the Advanced Photon Source (Argonne National Laboratory) DCSweb ; DCS12.01 . The DCS provides the opportunity to perform time resolved X-ray phase contrast imaging of shock compressed heterogeneous materials, which provides the first of the two required measurements.
The second required measurement is rapid thermal imaging with ns-s resolution. To this end we are developing temperature sensors based on two-color thermometry (TCT) phosphors, which can be used in heterogeneous materials to provide spatially resolved thermal imaging. Previously, TCT phosphors based on inorganic crystals have been used to perform temperature imaging in a wide variety of contexts Juboori13.01 ; Heyes06.01 ; Khalid08.01 ; Kontis07.01 ; Allison97.01 ; Cates03.01 ; Gross89.01 ; Kontis02.01 ; Kontis03.01 ; Heyes06.01 ; Hasegawa07.01 ; Sarner05.01 ; Feist02.01 ; Feist01.01 , but for our application – inert PBX analogues – we desire to have organic TCT phosphors that have similar mechanical properties to the energetic materials.
The first step, towards this goal, is to develop appropriate organic molecular crystals that can be used for two-color thermometry. To achieve this goal we choose to use Dy3+-doped yttrium ternary complexes that can be grown into molecular crystals with the first such material being [Y1-xDyx(acetylacetonate)3(1,10-phenanthroline)] ([Y1-xDyx(acac)3(phen)]). In this study we report on the optical properties of [Y1-xDyx(acac)3(phen)] at different temperatures and concentrations.
II Background
II.1 Two-Color Thermometry
Dy3+ is a well known lanthanide ion used for a wide variety of optical applications Kumar15.01 ; Gupta13.01 ; Jayasimhadri11.01 ; Ratnam10.01 ; Kaur14.01 ; Akita15.01 ; Juboori13.01 ; Heyes06.01 ; Khalid08.01 ; Kontis07.01 ; Allison97.01 ; Cates03.01 ; Gross89.01 ; Kontis02.01 ; Kontis03.01 ; Heyes06.01 ; Feist01.01 ; Anderson16.07 ; Gunawidjaja16.01 , with a common application being two-color thermometry (TCT) Juboori13.01 ; Heyes06.01 ; Khalid08.01 ; Kontis07.01 ; Allison97.01 ; Cates03.01 ; Gross89.01 ; Kontis02.01 ; Kontis03.01 ; Heyes06.01 ; Feist01.01 . TCT using Dy relies on two closely spaced Dy energy levels ( and ) to act as a probe of temperature. When a Dy doped material is optically pumped (with an appropriate wavelength) the ions are excited into the energy level, from which they can also populate the energy level due to thermal effects. The ratio of the populations in the energy level , and the population in the energy level , is determined by the Boltzmann distribution, such that their ratio is:
| (1) |
where is the energy difference between the and energy levels (approximately 0.115 eV for aqua ions Carnall68.01 ; Carnall79.01 ; Bunzli10.01 ; Bunzli10.02 ), is Boltzmann’s constant, and is the temperature.
This ratio between the and energy levels can be determined using emission spectroscopy; as the ratio of the and transition is proportional to the ratio of populations:
| (2) |
where is a proportionality constant.
II.2 Ligand Enhanced Luminescence
While Dy3+ has advantageous optical properties for TCT, on its own Dy3+ (and the other lanthanide ions) has a small molar absorption coefficient, making it an inefficient phosphor. To overcome this limitation much work has been done on embedding different lanthanide ions in ligands such that the ligands (which have large absorption coefficients) absorb the pump light and subsequently transfer the absorbed energy to the lanthanide ion Sager65.01 ; Dexter53.01 ; Xin04.01 ; Klink00.01 ; Latva97.01 ; Feng09.01 ; Bunzli10.01 ; Adronov00.01 ; Dickens98.01 ; Bunzli89.01 ; Shavaleev10.01 ; Eliseeva10.01 ; Puntus09.01 ; Bunzli14.01 ; Bunzli16.01 ; Bunzli15.01 . This energy transfer is typically radiationless and can occur via several possible mechanisms: electron exchange Dexter53.01 ; Adronov00.01 , dipole-dipole interactions (both allowed Forster65.01 ; Forster59.01 ; Forster48.01 ; Forster46.01 and unallowed transitions Dexter53.01 ; Dexter54.01 ), dipole-quadrapole interactions Dexter53.01 , and excitons Dexter51.01 ; Heller51.01 .
This energy transfer has been empirically found to be most efficient if the ligand’s lowest triplet energy level is between 0.23 eV and 0.62 eV greater than the lanthanide’s primary luminescent state, as energy back-transfer is more likely to occur for energy differences of eV Sato70.01 ; Latva97.01 . One such material, satisfying this criterion is [Dy(acetylacetonate)3(1,10-phenanthroline)] ([Dy(acac)3(phen)]) Feng09.01 ; Tang15.01 ; Chen11.02 ; Choy07.01 ; Brito09.01 , which is the subject material of this study. To demonstrate the energy level spacing of the ligands and Dy ion we provide a simplified energy level diagram in Figure 1 where the energy levels are taken from the literature Peng05.01 ; Sager65.01 ; Xin06.01 ; Feng09.01 ; Bunzli10.01 . Note that in general there are many more energy levels for the ligands and Dy than displayed in Figure 1, but we simplify the diagram to highlight the relevant transitions.
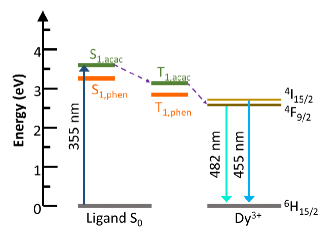
From a review of the literature Peng05.01 ; Sager65.01 ; Xin06.01 ; Feng09.01 ; Bunzli10.01 we find that the acac ligand has an transition corresponding to eV (345 nm), phen has an transition corresponding to eV (380 nm), and Dy3+’s primary luminescent state () is at eV (480 nm). In our study we use a frequency tripled Nd:YAG laser with a wavelength of 355 nm for our excitation source, which places the excitation wavelength nearly resonant with acac’s transition. This means that during excitation the primary absorption is due to the acac ligand, which can then nonradiatively transition to the lowest triplet state (energy eV) via intersystem crossing. Once in the triplet state the energy can be transferred from the ligand to the Dy3+ ion with the approximate energy difference between acac’s state and the state of Dy3+ being 0.554 eV. Since this energy difference is greater than 0.23 eV, backwards energy transfer will be minimal.
III Method
III.1 Materials
The primary component of our two-color thermosensors is [Dy(acetylacetonate)3(1,10-phenanthroline)] ([Dy(acac)3(phen)]). [Dy(acac)3(phen)] has previously been investigated for use as a single molecule magnet Tang15.01 ; Chen11.02 , a phosphor for white OLEDs Choy07.01 ; Brito09.01 , and a NIR optical phosphor for use in telecommunications Feng09.01 . In these previous studies the authors prepared the material with a Dy concentration of 100 mol%, while in our study we dilute [Dy(acac)3(phen)] with [Y(acac)3(phen)]. We perform this dilution in order to characterize the influence of Dy concentration on the material’s optical properties. This combination of [Dy(acac)3(phen)] and [Y(acac)3(phen)] results in a hybrid molecular crystal, which we denote [Y1-xDyx(acac)3(phen)].
To prepare [Y1-xDyx(acac)3(phen)] we use the following procedure Chen11.02 : First we prepare a solution of acetylacetone (0.06 M) and 1,10-phenanthroline (0.02 M) in a DMF/methanol mixture (1:1 vol./vol. ratio). To this solution we add an aqueous solution of potassium tert-butoxide (KOtBu) (0.06 M) at an equal volume ratio. Once mixed we add another equal volume aqueous solution containing Dy(NO3)3.5H2O and Y(NO3)3.6H2O in different Dy/Y mole ratios such that the total concentration is 0.02 M. For this study we make [Y1-xDyx(acac)3(phen)] with Dy concentrations of 1 mol%, 5 mol%, 10 mol% and 15 mol%. Gradually white precipitates appear and the suspension is allowed to age under stirring at room temperature for 4-6 hours. The precipitates are isolated via centrifugation (6000 rpm for 3 min) and finally dried in vacuum at 80 ∘C for hours. The resulting powder consists of [Y1-xDyx(acac)3(phen)] molecular crystals (MCs).
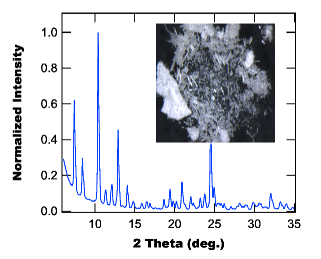
To characterize the structure of the [Y1-xDyx(acac)3(phen)] MCs we use X-ray diffraction (XRD) with a Cu-K radiation source (=1.5418 Å) operated at 40 kV and 40 mA. The X-ray beam is monochromated using an X’Celerator monochromator (PANalytical B.V.) and collimated using a fixed divergence slit with 0.04 radian Soller slits, 0.5∘ divergence slit and 10 mm mask. The diffracted X-rays are detected using a PIXcel3D detector (PANalytical B.V.) with the resulting diffraction patterns being analyzed using X’Pert HighScore Plus, Version 3.0 (PANalytical B.V.). Additional characterization is performed by optical microscopy of the MC powder.
Figure 2 shows a representative XRD pattern for [Dy(acac)3(phen)], with the pattern displaying sharp peaks consistent with a polycrystalline structure. This structure is also confirmed by optical microscopy, with the inset of Figure 2 being an optical image displaying multiple crystals of varying shapes and sizes. To determine the crystal parameters (structure, space group, lattice size, etc.) of the material we analyze the XRD pattern for each Dy concentration and find that the crystal parameters are within uncertainty of each other for all Dy concentrations. We therefore average the parameters and tabulate their average value in Table 1. These parameters are found to be consistent with previous XRD measurements of [Dy(acac)3(phen)] MCs Chen11.02 .
| Parameter | Value |
|---|---|
| Crystal System | Monoclinic |
| Space Group | P21/c |
| (Å) | 16.1 |
| (Å) | 21 |
| (Å) | 9.4 |
| 90∘ | |
| 116∘ | |
| 90∘ | |
| V (Å3) | 2841.82 |
III.2 Spectroscopy
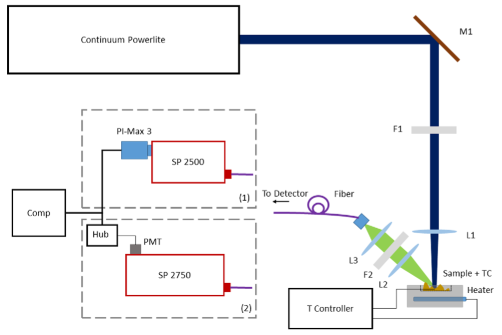
To measure the luminescence spectra of [Y1-xDyx(acac)3(phen)] at different temperatures we use a custom fluorescence spectroscopy system and powder heater. The spectroscopy system consists of a frequency-tripled Nd:YAG laser (Continuum Powerlite II 8000, 355 nm, 8 ns), focusing and collection optics, and two different spectrometers (one for temporally gated spectral measurements and the other for ungated measurements). The spectrometer for ungated measurements consists of an Acton SpectraPro 2750i monochromator, attached current PMT, and a Spectrahub interface, while the spectrometer for gated measurements consists of a Princeton Instruments PI-Max 3 ICCD connected to an Acton SpectraPro 2500i spectrometer. In addition to spectral measurements the ungated system is also used to measure florescence lifetimes with the PMT output connected to a Tektronix DPO 4104 oscilloscope. Figure 3 shows a schematic of the spectroscopy system.
In order to evenly heat our [Y1-xDyx(acac)3(phen)] molecular crystal powder we use a custom powder heater. The heater consists of a block of Aluminum (2” D 1” H) containing a 1 cm diameter indentation in which the powder is placed. This configuration allows for heating the powder from both the bottom and sides. For heating we use a 120 W canister heater which is controlled by an Omega CN32PT-220 PID controller with a K-type thermocouple providing temperature feedback.
IV Results and Discussion
IV.1 Ungated Spectra
We begin our study of [Dy(acac)3(phen)] by considering its ungated emission spectra at different Dy concentrations as shown in Figure 4. Note that the intensity in Figure 4 is scaled such that the intensity at 520 nm is normalized. From Figure 4 we find that the emission spectra consist of four broad peaks corresponding to emission from Dy with the peak centers being 453 nm (), 482 nm (), 577 nm (), and 660 nm ( ).
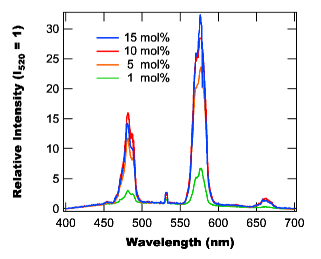
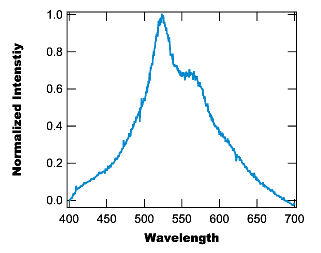
In addition to the four Dy peaks in Figure 4, we also observe a broad background emission centered at 520 nm (which is found to originate from the organic ligand) and a peak at 532 nm (corresponding to residual second harmonic in the pump). The ligand emission is isolated from the Dy emission by measuring a pure [Y(acac)3(phen)] sample, as shown in Figure 5.
IV.2 Gated Spectra
Given the proposed application of [Y1-xDyx(acac)3(phen)] as a TCT phosphor it is necessary to remove the ligand’s emission from the measured spectrum. This removal allows for an accurate probe of the Dy populations in the and energy levels. While the ligand’s emission can easily be subtracted using multi-peak fitting when performing spectral measurements, this technique is not an option when performing time-resolved TCT imaging. Instead, for time-resolved TCT imaging, we rely on the different luminescence lifetimes of the Dy3+ ions and the ligand.
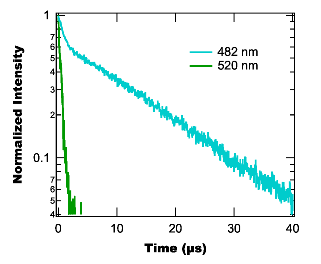
To demonstrate the different lifetimes we plot the normalized emission intensity (for a 1 mol% sample) at 482 nm (primarily due to Dy) and 520 nm (due to ligand) as a function of time in Figure 6. From Figure 6 we find that the 520 nm intensity follows a single exponential – with lifetime 0.6 s – while the 482 nm intensity is bi-exponential – with lifetimes of 16 s and 0.6 s. Given the value of the short lifetime (for the 482 nm intensity) and the observation that [Y(acac)3(phen)] has emission at 482 nm, we conclude that the fast component of the bi-exponential is due to the ligand, while the long lifetime component is due Dy’s transition. The order of magnitude difference in emission lifetime between the ligands and the Dy ion means that we can remove the ligands’ emission by using gated measurements with a delay greater than the emission lifetime of the ligands.
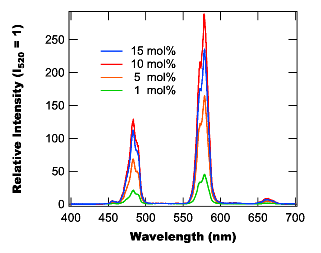
Using a gate delay of 1 s we re-perform the spectral measurements on the different [Y1-xDyx(acac)3(phen)] samples (scaled spectra are shown in Figure 7) and obtain improved contrast between the Dy and ligand emission as the ligand’s emission is mostly removed. From Figure 7 we find that the contrast between the emission at 520 nm and 482 nm is approximately 120, which is an order of magnitude larger than for the ungated spectral measurements (Figure 4). This increased contrast minimizes the influence of the ligand’s emission and allows for more accurate determination of the intensity ratios used in Equation 2.
IV.3 Concentration Dependence
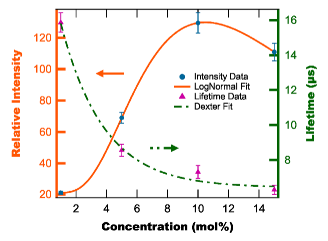
From Figure 7 we observe that, while the relative intensity of the Dy emission increases as the concentration increases from 1 mol% to 10 mol%, it begins to decrease as the concentration is further increased. This behavior arises as the increase in concentration initially is beneficial (providing more ions for luminescence), but as the concentration is further increased quenching becomes dominate, and limits the emission from the material. Figure 8 demonstrates this effect in the relative intensity at 482 nm as a function of concentration, with a fit to a lognormal function as a guide for the eye. From Figure 8 we find that the 10 mol% sample provides the most emission intensity.
To further characterize concentration quenching in [Y1-xDyx(acac)3(phen)], we measure the luminescence intensity as a function of time after excitation to determine the luminescence lifetime at different Dy concentrations. Figures 9(a) and 9(b) show the emission intensity as a function of time after excitation for the different concentrations. From both Figures 9(a) and 9(b) we find that the luminescence decays as a bi-exponential function with the fast decay occurring with a concentration independent lifetime of s and the slower decay having a concentration dependent lifetime, which decreases with increasing concentration. The observation of the long lifetime depending on the Dy concentration and the short lifetime being invariant with concentration is additional evidence that the short lifetime component is due to the ligands, while the long lifetime component is due to the Dy ion.
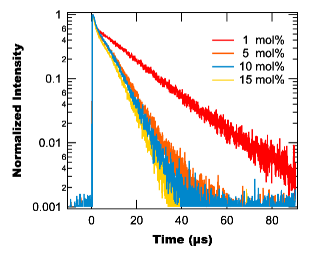
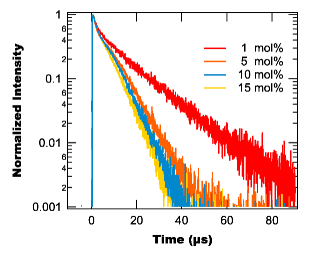
Using simple exponential fits to the data in Figures 9(a) and 9(b) we determine the lifetime as a function of Dy concentration, which is shown in Figure 8. From Figure 8 we find that as the concentration increases the lifetime becomes shorter, with the largest change occurring when going from 1 mol% to 5 mol%.
The influence of concentration quenching on lanthanide luminescence lifetimes has been studied in depth Kharabe15.01 ; Dexter53.01 ; Dexter54.01 ; Joos12.01 ; Meza14.01 ; Ju13.01 ; lakow06.01 ; Forster65.01 ; Forster59.01 ; Forster48.01 ; Forster46.01 with the two main mechanisms of concentration quenching in solid-state materials being: long-range Energy Transfer (LRET) lakow06.01 ; Forster65.01 ; Forster59.01 ; Forster48.01 ; Forster46.01 , and short-range Dexter electron exchange Dexter54.01 . These mechanisms result in different functional behavior of the lifetime as a function of concentration. Assuming that the ion has an unquenched lifetime of , the lifetime (as a function of concentration ) is:
| (3) |
for LRET with being the half-quenching concentration and being an exponent that depends on the energy transfer mechanism (e.g. dipole-dipole interactions, quadrapole-dipole interactions). For Dexter electron exchange the lifetime as a function of concentration is given by:
| (4) |
where is the critical concentration Bierwagen16.01 and is a material dependent constant. From the functional forms of Equations 3 and 4 we note that LRET results in the lifetime asymptotically approaching zero, while the Dexter mechanism has the lifetime asymptotically approaching a nonzero value. Given these differences in functionality of Equations 3 and 4, and the observed behavior of the lifetime in Figure 8, we conclude that the Dexter mechanism’s concentration dependence best matches the observed experimental data. Therefore we fit the lifetime data in Figure 8 to Equation 4 and observe good agreement.
The result of the experimental lifetimes following Equation 4 is surprising, as typically the other quenching mechanisms are more dominant lakow06.01 as they are longer range interactions than Dexter electron exchange. Typically Dexter electron exchange based quenching doesn’t occur until the average spacing of ions is on the order of 10’s of angstroms, as the Dexter mechanism is proportional to the overlap of the acceptor and donor wavefunctions Dexter54.01 .
Given this spatial dependence it is necessary to estimate the ion spacing in order to determine if Dexter electron exchange is a valid hypothesis. To do so we first estimate the particle density using the lattice volume (see Table 1), which gives a particle density of m-3. This density represents the number of molecular complexes in a given volume, but not the density of Dy ions. To get the density of Dy ions we need to scale the particle density by the doping percentage, which gives the ion density to be , where is the doping percentage. While a precise calculation of the mean inter-ion distance , from the concentration is difficult, we can get a rough estimate using the formula . Using this formula we get an inter-ion distance of 65.7 Å for the 1 mol% sample and 26.7 Å for the 15 mol% sample. These spacings suggest that the Dexter mechanism is a valid hypothesis for our observed concentration dependence. However, further study (using more concentrations and a calculation of the exchange radius) is required to verify this result.
IV.4 Temperature Dependence
IV.4.1 Emission Spectra
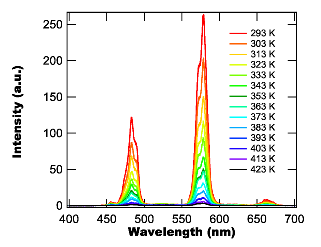
With the concentration dependence of the emission of [Y1-xDyx(acac)3(phen)] characterized, we now turn to consider the influence of temperature on its emission. To do so we use the gated spectroscopy system to measure the temperature dependent emission of [Y1-xDyx(acac)3(phen)] at 14 different temperatures ranging from 293 K to 423 K. Figure 10 shows an example set of emission spectra for the 10 mol% sample. From Figure 10 we find that the emission spectra display strong thermal quenching, which is seen in the emission from all concentrations tested.
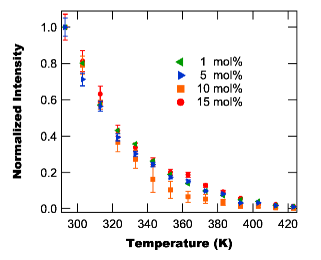
We characterize the material’s thermal quenching by plotting the emission intensity at 482 nm as a function of temperature for all four concentrations in Figure 11, with the intensity normalized such that the room temperature intensity is unity. From Figure 11 we find that the intensity as a function of temperature decays exponentially with each concentration’s curve being within uncertainty of each other. Fitting each curve to a simple exponential and taking the weighted average of the decay constants over all four concentrations we find that the average decay constant is K.
To consider what this temperature dependence means practically, we assume that we have a detection system capable of accurately measuring down to 1% of the room temperature signal. Using the decay constant determined above, this dynamic range gives a functional maximum temperature of approximately 463 K. However, for our current detection system we find that for temperatures above 423 K the signal to noise ratio is unacceptably small ( for the 455 nm peak and for the 482 nm peak). Thus our current maximum temperature limit is K.
IV.4.2 Luminescence Lifetime
In addition to the thermal quenching affecting the emission intensity we also find that it affects emission lifetime, which is consistent with previous measurements of other lanthanide-doped complexes Ueda15.01 ; Bierwagen16.01 ; Joos12.01 ; Yu14.01 . We characterize the influence of thermal quenching on the lifetime of [Y1-xDyx(acac)3(phen)] by measuring the lifetime of the emission at 482 nm and 575 nm for the 10 mol% sample, as shown in Figure 12. From Figure 12 we find that thermal quenching in [Y0.9Dy0.1(acac)3(phen)] results in the lifetime decreasing with increasing temperature.
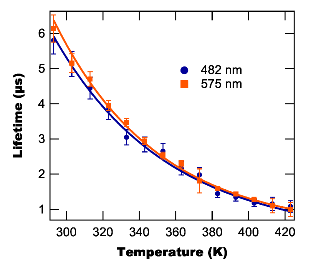
This decrease in lifetime with increasing temperature is typically modeled as a barrier process with the rate of energy loss from the excited state , being
| (5) |
where is the excited state’s natural decay rate, is the rate of nonradiative energy transfer as a function of temperature , with being the energy transfer barrier and being a rate related to non-radiative energy transfer from the excited state. Recalling that the lifetime of the excited state is given by , we use Equation 5 to give the lifetime as a function of temperature:
| (6) |
where .
Fitting the lifetime data in Figure 12 to Equation 6 we determine the different parameters for both the 482 nm and 575 nm peaks with the results tabulated in Table 2. From Table 2 we find that the parameters for both the 482 nm and 575 nm peak are within uncertainty of each other. This is expected as both peaks correspond to transitions from the energy level.
| Parameter | 482 nm | 575 nm |
|---|---|---|
| (s) | ||
| (ns) | ||
| (10-3 eV) |
IV.4.3 Intensity Ratios
At this point we have characterized the emission properties of [Y1-xDyx(acac)3(phen)] for different temperatures and concentrations. The next step towards using [Y1-xDyx(acac)3(phen)] as a TCT phosphor is to characterize the excited state ratios between the and states as a function of temperature. This ratio is probed by measuring the ratio between the emission peak at 455 nm () and 482 nm (). In our study – to improve the signal to noise ratio – we use the spectrally integrated peak intensities to calculate the peak ratios with the 455 nm peak having an integration range of 450 nm to 460 nm and the 482 peak having an integration range of 465 nm to 500 nm.
Using the gated spectra measured at different temperatures for each concentration we integrate the spectral peaks and calculate their ratios. The ratios of the integrated peaks are shown in Figure 13 as a function of inverse temperature. Note that for the 1:99 sample the intensity at temperatures above 383 K becomes so weak as to make the ratios unreliable. These ratios are therefore not used when performing fitting.
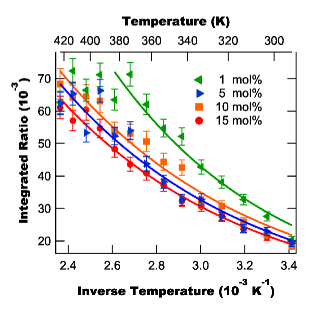
From Figure 13 we find that for all four concentrations the integrated ratio behaves as an exponential with inverse temperature, which is consistent with Equation 2. Fitting the ratios in Figure 13 to Equation 2 we determine both the amplitude parameter and the energy barrier , which are tabulated in Table 3.
| Dy Concentration (mol%) | ( eV) | |
|---|---|---|
| 1 | 2.30 0.87 | 114 14 |
| 5 | 1.06 0.31 | 100.1 9.4 |
| 10 | 1.08 0.20 | 98.4 6.2 |
| 15 | 0.98 0.13 | 99.7 4.3 |
From Table 3 we find that the energy differences are all within uncertainty of each other and have a weighted mean of eV. This energy difference is significantly less than the expected energy difference of eV (energy difference between photons with wavelengths of 482 nm and 455 nm). While the measured difference is less than the difference expected due to the peak wavelengths, it is actually consistent with the energy difference determined for Dy3+ in a water solution: eV (energy difference between photons with wavelengths of 475 nm and 455 nm) Carnall68.01 ; Carnall79.01 ; Bunzli10.01 ; Bunzli10.02 .
To understand why the energy difference measured in this study (and seen in the literature Carnall68.01 ; Carnall79.01 ; Bunzli10.01 ; Bunzli10.02 ; Gross89.01 ; Khalid08.01 ; Feist00.01 ) differs from the the value determined using the peak wavelengths, we note that the peak spacing (455 nm vs. 482 nm) does not directly represent the spacing between the and energy levels. In reality each broad spectral peak consists of multiple overlapping smaller peaks that arise due to transitions from the excited state into the Stark-split ground state Bunzli10.01 ; Bi16.01 .
Therefore, to accurately determine the spacing between the and energy levels using peak positions, we need to use transitions from the excited states into the same sub-level. This however is difficult to accomplish when the transitions to the different sub levels are overlapping from thermal and/or inhomogeneous broadening. This broadening can be minimized either by using low temperatures Bi16.01 or a host material with a strong crystal field Bunzli10.01 . Alternatively, by integrating over the full peak (as we do in this study) we can account for all transitions from the and energy levels into the state and obtain an accurate energy difference.
Having determined the temperature response of the intensity ratio, we can now calculate the sensitivity of [Y1-xDyx(acac)3(phen)] and the temperature resolution of our TCT technique. The sensitivity , of a TCT phosphor is given by Brites12.01
| (7) |
where is the intensity ratio and the sensitivity is given in units of % K-1. To calculate the sensitivity we first take the derivative of the intensity ratio function (Equation 2) and substitute in the average amplitude and energy difference from Table 1. We then divide the calculated derivative by the experimentally obtained ratio (for the 10 mol% samples) and compute Equation 7 with Figure 14 showing the computed sensitivity. From Figure 14 we find that the sensitivity has a maximum value of 1.5 % K-1, which is comparable to many other temperature sensing phosphors Brites12.01 .
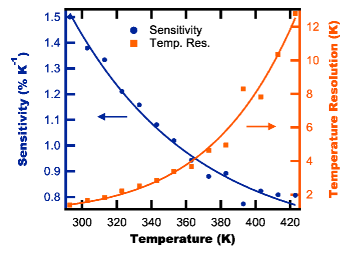
In addition to calculating the sensitivity of our phosphor we also consider the temperature resolution , of our technique, which not only depends on the sensitivity of the phosphor, but also the experimental uncertainty of the optical detection system. The temperature resolution can be defined as the temperature change required to change the ratio by an amount equal to the experimental uncertainty. Mathematically this takes the form of
| (8) |
where is the experimental uncertainty in the ratio.
Using the calculated derivative of the ratio and the ratio uncertainty for the 10 mol% sample we calculate the temperature resolution and show the results in Figure 14. From Figure 14 we find that at room temperature the temperature resolution is approximately 1.8 K and that it increases with temperature. This behavior is primarily due to the effects of thermal quenching, which is found to increase the relative uncertainty of the measured ratio as the temperature is increased.
IV.5 Photodegradation
In the previous section we measured the 455 nm/482 nm intensity ratios of [Y1-xDyx(acac)3(phen)] at different temperatures and determined the calibration parameters for the material’s temperature response. While this analysis is the main purpose of our study we also observe significant yellowing of the [Y1-xDyx(acac)3(phen)] powder during extended UV exposure, which suggests that the material undergoes significant photodegradation.
Given that [Y1-xDyx(acac)3(phen)] consists of either a Dy or Y ion connected to organic ligands, photodegradation will occur solely due to the ligands, implying that the Dy spectral ratios should be unaffected (assuming the ligand stays transparent in the 450 nm – 500 nm range). However, while the ratios should be unaffected, the overall intensity will be decreased as the ligand acts as an “antenna” for the Dy ion Feng09.01 and damage to the ligand will decrease the efficiency of energy transfer between the ligand and Dy ion.
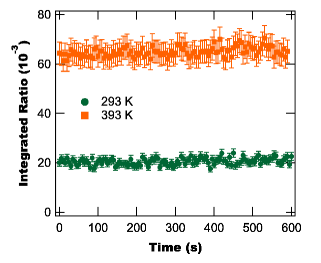
To characterize this decrease in energy transfer efficiency (and confirm that the ratios are unaffected) we measure the emission spectra between 450 nm and 500 nm for a 10 mol% sample as a function of time during constant UV illumination at two different temperatures (293 K and 393 K). For both degradation and excitation we use the same 355 nm pulsed laser with the fluence per pulse being 89 mJ/cm2 (average intensity of 0.891 W/cm2). Figure 15 shows the scaled integrated intensity of the 482 nm peak (integration range 465 nm to 500 nm, smoothed for clarity) as a function of time for both 293 K and 393 K, with the intensity scaled such that the initial intensity is 1.
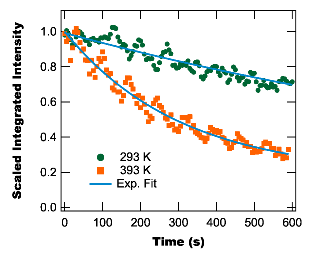
From Figure 15 we find that the scaled integrated intensity of the 482 nm peak decays exponentially with time, with the higher temperature being found to decay more quickly. Fitting the decay curves in Figure 15 to a simple exponential function we find decay rates of s-1 for the 293 K curve and s-1 for the 393 K curve.
Comparing the decay rates between the two temperatures we find that by increasing the temperature by 100 K the ligand decays 2.35 more quickly than at room temperature. This temperature dependence suggests that photodegradation is due to an energy barrier process. To estimate this energy barrier we first assume that the decay rate depends on temperature as an Arrhenius function:
| (9) |
where is the asymptotic decay rate and is the photodegradation energy barrier. With this assumption we calculate the ratio of decay rates to be,
| (10) |
where is the decay rate at temperature and is the decay rate at temperature . Equation 10 can be rearranged to give the energy barrier to be
| (11) |
Substituting in our experimental values we can estimate the energy barrier to be eV. Note that a more accurate determination – using degradation at many different temperatures – of this energy barrier is beyond the scope of this current study.
In addition to determining the temperature dependence of (acac)3(phen)’s photodegradation, we also compare its photostability to other organic materials by computing the commonly used figure of merit for organic dyes Anderson15.04 :
| FoM | (12) | |||
| (13) |
where is the undamaged absorbance cross section, is the degradation’s inverse quantum efficiency, is the average pump intensity, is the decay rate, and is the photon energy of the degradation source. Using Equation 13 and the values from our room temperature (293 K) measurement we determine a FoM of cm-2, which is on the same order as a large number of organic materials, but almost two orders of magnitude below the most photostable organic materials Anderson15.04 .
With the influence of (acac)3(phen)’s photodegradation on the emission intensity now determined, we turn to considering how (acac)3(phen)’s photodegradation affects the intensity ratio between the 455 nm peak and the 482 nm peak. Using the same calculation method described in Section IV.4.3 we calculate the integrated peak ratio as a function of temperature for both temperatures as shown in Figure 16. From Figure 16 we find that for both 293 K and 393 K the integrated ratio is invariant within uncertainty for the entire time frame of photodegradation. This result confirms our initial hypothesis that photodegradation won’t influence the intensity ratios.
IV.6 Dynamic Heating Test
Having now determined the temperature dependence of the integrated ratio and shown that the ratio is invariant during ligand photodegradation, we now demonstrate the use of [Y1-xDyx(acac)3(phen)] as a TCT phosphor. To do so we heat a sample (10 mol%) and measure the luminescence spectrum and TC temperature as a function of time using the gated spectroscopy system.
After heating we compute the integrated intensity ratio as a function of time and calculate the temperature using Equation 1 and the calibration values. Figure 17 shows the calculated temperature, TC value, and the peak intensity at 482 nm as a function of time. From Figure 17 we find that the calculated temperature is within uncertainty of the TC temperature for temperatures up to about 370 K after which point the calculated temperatures are more noisy. This noise in temperatures is due to the emission intensity decreasing to the point where the SNR is too small to obtain accurate temperatures.
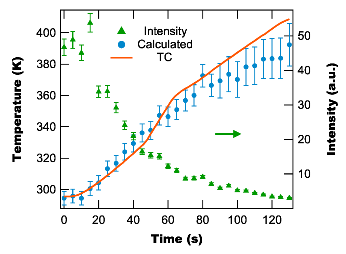
From Figures 11 and 17 it should be noted that the maximum accurate temperature is lower in Figure 17 than in Figure 11. The reason for this difference is related to the different camera settings between the static calibration measurements and the dynamic heating measurements. During the calibration measurements the camera gain is adjusted for each temperature to account for the decrease in intensity, while during dynamic heating the gain is fixed for the entire run. This leads to the intensity quickly falling below the accurate detection limit. We are currently working on developing new software which will dynamically adjust the camera gain allowing for a larger temperature range.
V Conclusions
We develop a TCT phosphor based on a [Y1-xDyx(acac)3(phen)] molecular crystals. The emission (using an excitation wavelength of 355 nm) is found to contain four peaks originating from the Dy ion and a broad background peak arising from the ligand. The emission from the Dy ion at room temperature is found to have a lifetime ranging from 6 s to 16 s depending on Dy concentration, and the emission from the ligand at room temperature has a lifetime of approximately 600 ns. This difference in lifetime allows us to remove the ligand’s contribution from the emission spectra by using time-gated spectroscopy.
Using this technique we characterize the material’s emission for four different concentrations and 14 different temperatures. From these measurements we find that the material displays both concentration and thermal quenching, which results in decreased emission intensity and luminescence lifetimes at high concentrations and temperatures. With regards to concentration quenching we find that the peak intensity occurs for a Dy concentration of mol% and that the lifetime as a function of concentration appears to follow the functionality of Dexter electron exchange quenching. While the estimated ion spacing is found to be the correct order of magnitude for the Dexter exchange mechanism, a more in depth study of the concentration dependence is needed to verify this hypothesis.
We also find that the effect of thermal quenching on [Y1-xDyx(acac)3(phen)]’s emission is consistent with results seen in other lanthanide-doped complexes. We find that the emission intensity decays exponentially in the temperature range tested (with the 1/e intensity decay temperature being K) and that the emission lifetime obeys Equation 6 with a thermal quenching barrier of eV. Due to this thermal quenching we find that – for our current spectroscopy system – we can accurately measure the emission to a temperature of 423 K.
Additionally, we find that the organic ligand photodegrades under UV illumination resulting in a decrease of the Dy emission peaks as the ligand acts as an “antenna” for the Dy ion. Despite this decrease in luminescence efficiency, due to photodegradation, we find that the ratio between the 455 nm and 482 nm peaks is unchanged.
With the emission of [Y1-xDyx(acac)3(phen)] characterized, we next demonstrate its use as a TCT phosphor by heating a 10 mol% sample dynamically and measuring the emission as a function of time using our time-gated spectroscopy system. Based on the emission spectra (and using the known calibration parameters) we compute the temperature and compare the calculated value to that measured by a thermocouple with both temperatures found to be within uncertainty of each other up to a temperature of approximately 370 K, with the main limitation due to the current spectroscopy systems software. To remove this limitation we are currently developing improved software, which will allow for a higher temperature range with our initial target maximum temperature being 423 K.
In summary, we find that [Y1-xDyx(acac)3(phen)] forms organic molecular crystals with appropriate spectroscopic properties for use as a TCT phosphor. Our next step – towards using [Y1-xDyx(acac)3(phen)] as a TCT phosphor during shock compression of heterogeneous materials – is to perform fast laser heating of the phosphor in order to demonstrate its ability to measure temperature during short time scales. At the same time we are also testing other Dy3+-doped Yttrium ternary complexes to determine how their thermal performance compares to [Y1-xDyx(acac)3(phen)].
Acknowledgements
This work was supported by the Air Force Office of Scientific Research, Award # FA9550-15-1-0309 to Washington State University.
References
- (1) M. Chen, S. You, K. Suslick, and D. Dlott, “Hot spots in energetic materials generated by infared and ultrasound, detected by thermal imaging microscopy,” Rev. Sci. Instrum 85, 023705 (2014).
- (2) M. Chen, S. You, K. Suslick, and D. Dlott, “Hot spot generation in energetic materials created by long-wavelength infared radiation,” App. Phys. Lett. 104, 061907 (2014).
- (3) R. Pokharel, J. Lind, A. Kanjarla, R. Lebensohn, S. Li, P. Kenesei, R. Suter, and A. Rollett, “Polycrystal plasticity: comparison between grain-scale observations of deformation and simulations,” Annual Review of Condensed Matter Physics 5, 317–346 (2014).
- (4) Q. An, W. Goddard, S. Zybin, A. Jaramillo-Botero, and T. Zhou, “Highly shocked polymer bonded explosiuves at a nonplanar interface: hot-spot formation leading to detonation,” Journal of Physical Chemistry C 117, 26551–26561 (2013).
- (5) Y. Wu and F. Huang, “A microscopic model for predicting hot-spot ignition of granular energetic crystals in response to drop-weight impacts,” Mechanics of Materials 43, 835–852 (2011).
- (6) P. Rae, H. Goldrein, S. Palmer, J. Field, and A. Lewis, “Quasi-static studies of the deformation and failure of beta-hmx based polymer bonded explosives,” Proceedings of the Royal Society a-Mathematical Physical and Engineering Sciences 458, 743–762 (2002).
- (7) Y. Gruzdkov and Y. Gupta, “Vibrational properties and structure of pentaerythritol tetranitrate,” J. Phys. Chem. A 105, 6197–6202 (2001).
- (8) Y. Gupta, “Recent developments to understand molecular-changes in schocked energetic materials,” Journal De Physique IV 5, 345–356 (1995).
- (9) A. Mellor, D. Wiegand, and K. Isom, “Hot-spot histories in energetic materials,” Structure and Properties of Energetic Materials 296, 293–298 (1993).
- (10) J. Field, “Hot-spot ignition mechanisms for explosives,” Acc. Chem. Res. 25, 489–496 (1992).
- (11) J. Field, N. Bourne, S. Palmer, S. Walley, and J. Smallwood, “Hot-spot ignition mechanisms for explosives and propellants,” Philosophical Transactions of the Royal Society of London-Mathematical Physical and Engineering Sciences 339, 269–283 (1992).
- (12) J. Field, G. Swallowe, and S. Heavens, “Ignition mechanisms of explosives during mechanical deformation,” Proceedings of the Royal Society of London Series A 382, 231 (1982).
- (13) R. Winter and E. Faber, “The role of localized plastic flow in the impact initiation of explosives,” Proceedings of the Royal Society of London Series A 343, 399–413 (1975).
- (14) M. Chaudhri and J. Field, “The role of rapidly compressed gas pockets in the initiation of condensed explosives,” Proceedings of the Royal Society of London 340, 113–128 (1974).
- (15) S. N. Luo, B. J. Jensen, D. E. Hooks, K. J. Ramos, J. D. Yeager, K. Kwiatkowski, T. Shimada, D. A. Fredenburg, and K. Fezzaa, “Ultrafast, high resolution, phase contrast imaging of shock response with synchrotron radiation: opportunities and challenges,” in “APS Meeting Abstracts,” (2012).
- (16) B. J. Jensen, K. J. Ramos, A. J. Iverson, J. Bernier, C. A. Carlson, J. D. Yeager, K. Fezzaa, and D. E. Hooks, “Dynamic experiment using impulse at the advanced photon source,” Journal of Physics: Conference Series 500, 042001 (2014).
- (17) B. J. Jensen, S. N. Luo, D. E. Hooks, K. Fezzaa, K. J. Ramos, J. D. Yeager, K. Kwiatkowski, T. Shimada, and D. M. Dattelbaum, “Ultrafast, high resolution, phase contrast imaging of impact response with synchrotron radiation,” AIP Advances 2, 012170 (2012).
- (18) J. Yeager, S. Luo, B. Jensen, K. Fezzaa, D. Montgomery, and D. Hooks, “High-speed synchrotron x-ray phase contrast imaging for analysis of low-z composite microstructure,” Composites Part A: Applied Science and Manufacturing 43, 885 – 892 (2012).
- (19) S. N. Luo, B. J. Jensen, D. E. Hooks, K. Fezzaa, K. J. Ramos, J. D. Yeager, K. Kwiatkowski, and T. Shimada, “Gas gun shock experiments with single-pulse x-ray phase contrast imaging and diffraction at the advanced photon source,” Review of Scientific Instruments 83, 073903 (2012).
- (20) “http://www.dcs-aps.wsu.edu/,” .
- (21) “New research opportunities in dynamic compression science,” Tech. rep., Institute for Shock Physics, Washington State University (2012).
- (22) A. Z. M. Al-Juboori, “Rare earth (Sm3+ and Dy3+)-doped gadolinium oxide nanomaterials for luminescence thermometry,” Physica Scripta (2013).
- (23) A. Heyes, S. Seefeldt, and J. Feist, “Two-colour phosphor thermometry for surface temperature measurement,” Optics & Laser Technology 38, 257–265 (2006).
- (24) A. Khalid and K. Kontis, “Thermographic phosphors for high temperature measurements: Principles, current state of the art and recent applications,” Sensors 8, 5673–5744 (2008).
- (25) K. Kontis, “A review of some current research on pressure sensitive and thermographic phosphor techniques,” The Aeronautical Journal 3162, 495–508 (2007).
- (26) S.W., Allison, and G. Gillies, “Remote thermometry with thermographic phosphors: Instrumentation and applications,” Review Scientific Instruments 68, 2615–2650 (1997).
- (27) M. Cates, S. Allison, S. Jaiswal, and D. Beshears, “YAG:Dy and YAG:Tm fluorescence to 1700 ∘c,” in “The 49th International Instrumentation Symposium – The Instrumentation, Systems, and Automation Society,” (Orlando, FL, 2003).
- (28) G. Gross, A. Smith, and M. Post, “Surface thermometry by laser induced fluorescence,” Review Scientific Instruments 60, 12 (1989).
- (29) K. Kontis, Y. Syogenji, and N. Yoshikawa, “Surface thermometry by laser induced fluorescence of Dy3+ :YAG,” The Aeronautical Journal 106, 453–457 (2002).
- (30) K. Kontis, “Surface heat transfer measurements inside a supersonic combustor by laser induced fluorescence,” Journal of Thermophysics and Heat Transfer 17, 320–325 (2003).
- (31) R. Hasegawa, I. Sakata, H. Yanagihara, B. Johansson, A. Omrane, and M. Alden, “Two-dimensional gas phase temperature measurements using phosphor thermometry,” App. Phys. B 88, 291–296 (2007).
- (32) G.Sarner, A. Omrane, H. Seyfried, M. Richter, H. Schmidt, and M. Alden, “Laser diagnostics applied to a full-size fighter jet afterburner,” in “European Combustion Meeting,” (2005).
- (33) J. Feist, A. Heyes, and S. Seefeldt, “Thermographic phosphors for gas turbines: instrumentation development and measurement uncertainties,” in “11th International symposium on Application of Laser Techniques to Fluid Mechanics,” (Lisbon, Portugal, 2002).
- (34) J. P. Feist, A. L. Heyes, and J. R. Nicholls, “Phosphor thermometry in an electron beam physical vapour deposition produced thermal barrier coating doped with dysprosium,” in “Proceedings of the Institution of Mechanical Engineers,” , vol. 215 (2001), vol. 215, pp. 333–341.
- (35) J. P. Kumar, G. Ramgopal, Y. Vidya, K. Anantharaju, B. D. Prasad, S. Sharma, S. Prashantha, H. Nagaswarupa, D. Kavyashree, and H. Nagabhushana, “Green synthesis of Y2O3:Dy3+ nanophosphor with enhanced photocatalytic activity,” Spectrochimica Acta Part A: Molecular and Biomolecular Spectroscopy 149, 687 – 697 (2015).
- (36) S. K. Gupta, M. Mohapatra, V. Natarajan, and S. V. Godbole, “Photoluminescence investigations of the near white light emitting perovskite ceramic SrZrO3:Dy3+ prepared via gel-combustion route,” International Journal of Applied Ceramic Technology 10, 593–602 (2013).
- (37) M. Jayasimhadri, B. V. Ratnam, K. Jang, H. S. Lee, B. Chen, S.-S. Yi, J.-H. Jeong, and L. Rama Moorthy, “Combustion synthesis and luminescent properties of nano and submicrometer-size Gd2O3:Dy3+ phosphors for white leds,” International Journal of Applied Ceramic Technology 8, 709–717 (2011).
- (38) B. Ratnam, M. Jayasimhadri, K. Jang, H. Sueb Lee, S.-S. Yi, and J.-H. Jeong, “White light emission from NaCaPO4:Dy3+ phosphor for ultraviolet-based white light-emitting diodes,” Journal of the American Ceramic Society 93, 3857–3861 (2010).
- (39) J. Kaur, Y. Parganiha, V. Dubey, D. Singh, and D. Chandrakar, “Synthesis, characterization and luminescence behavior of ZrO2:Eu3+, Dy3+ with variable concentration of Eu and Dy doped phosphor,” Superlattices and Microstructures 73, 38 – 53 (2014).
- (40) Y. Akita, T. Harada, R. Sasai, K. Tomita, and K. Nishiyama, “Emission properties of Ln (Eu, Tb, Dy, Er)-doped {Y2O3} nanoparticles synthesized by surfactant-assembly and their applications in visible color-tuning,” Journal of Photochemistry and Photobiology A: Chemistry 299, 87 – 93 (2015).
- (41) B.R. Anderson, R. Gunawidjaja, P. Price, and H. Eilers, “Spectroscopic determination of thermal impulse in sub-second heating events using lanthanide-doped oxide precursors and phenomenological modeling,” Journal of Applied Physics, 120, 083102 (2016).
- (42) R. Gunawidjaja, B.R. Anderson, H. D. y Riega, and H. Eilers, “Sub-second laser heating of thermal impulse sensors,” AIP Conf. Proc. p. pending publication (2016).
- (43) R. K. Carnall W.T., “Electronic energy levels in the trivalent lanthanide aquo ions,” J. Chem Phys. 49, 4424–4442 (1968).
- (44) W. Carnall, “The absorption and fluorescence spectra of rare earth ions in solution,” in “Handbook on the physics and chemistry of rare earths,” , K. Gschneidner and L. Eyring, eds. (Elsevier BV, Amsterdam, 1979), chap. 24.
- (45) J.-C. G. Bünzli and S. V. Eliseeva, “Basics of lathanide photophysics,” in “Lanthanide Luminescence: Photophysical, Analytical and Biological Aspects,” , P. Hanninen and H. Harma, eds. (Springer-Verlag, 2010).
- (46) J. Bünzli, “Lanthanide luminescence for biomedical analyses and imaging,” Chem. Rev. 110, 2729–2755 (2010).
- (47) N. F. W. F. Sager and F. A. Serafin, “Substituent effects on intramolecular energy transfer. I. absorption and phosphorescence spectra of rare earth -diketone chelates,” J Phys. Chem 69, 1092 (1965).
- (48) D. Dexter, “A theory of sensitized luminescence in solids,” J. Chem. Phys. 21, 836 (1953).
- (49) H. Xin, M. Shi, X. C. Gao, Y. Y. Huang, Z. L. Gong, D. B. Nie, H. Cao, Z. Q. Bian, F. Y. Li, and C. H. Huang, “The effect of different neutral ligands on photoluminescence and electroluminescence properties of ternary terbium complexes,” The Journal of Physical Chemistry B 108, 10796–10800 (2004).
- (50) S. I. Klink, “Synthesis and photophysics of light-converting lanthanide complexes,” Ph.D. thesis, University of Twente (2000).
- (51) M. Latva, H. Takalo, V.-M. Mukkala, C. Matachescu, J. C. Rodriguez-Ubis, and J. Kankare, “Correlation between the lowest triplet state energy level of the ligand and lanthanide(III) luminescence quantum yield,” Journal of Luminescence 75, 149 – 169 (1997).
- (52) J. Feng, L. Zhou, S.-Y. Song, Z.-F. Li, W.-Q. Fan, L.-N. Sun, Y.-N. Yu, and H.-J. Zhang, “A study on the near-infrared luminescent properties of xerogel materials doped with dysprosium complexes,” Dalton Trans. pp. 6593–6598 (2009).
- (53) A. Adronov and J. M. Frechet, “Light-harvesting dendrimers,” Chem Comm pp. 1701–1710 (2000).
- (54) R. S. Dickens, J. A. K. Howard, C. L. Maupin, J. M. Moloney, D. Parker, R. D. Peacock, J. P. Riehl, and G. Siligardi, “Ground and excited state chiroptical properties of enantiopure macrocyclic tetranaphthyl lanthanide complexes: controlled modulation of the frequency and polarisation of emitted light,” New J. Chem. 22, 891–899 (1998).
- (55) J. Bünzli, “Luminescent probes,” in “Lanthanide Probes in Life Chemical and Earth Sciences: Theory and Practice,” , J. Bunzli and G. Choppin, eds. (Elsevier, 1989), pp. 219–293.
- (56) N. M. Shavaleev, S. V. Eliseeva, R. Scopelliti, and J.-C. G. Bünzli, “N-aryl chromophore ligands for bright europium luminescence,” Inorganic Chemistry 49, 3927–3936 (2010). PMID: 20302272.
- (57) S. V. Eliseeva and J.-C. G. Bünzli, “Lanthanide luminescence for functional materials and bio-sciences,” Chem. Soc. Rev. 39, 189–227 (2010).
- (58) L. N. Puntus, K. A. Lyssenko, I. S. Pekareva, and J.-C. G. Bünzli, “Intermolecular interactions as actors in energy-transfer processes in lanthanide complexes with 2,2’-bipyridine,” The Journal of Physical Chemistry B 113, 9265–9277 (2009). PMID: 19522489.
- (59) J.-C. G. Bünzli, “Review: Lanthanide coordination chemistry: from old concepts to coordination polymers,” Journal of Coordination Chemistry 67, 3706–3733 (2014).
- (60) J.-C. G. Bünzli, “Lanthanide light for biology and medical diagnosis,” Journal of Luminescence 170, Part 3, 866 – 878 (2016). Light, Energy and Life.
- (61) J.-C. G. Bünzli, “On the design of highly luminescent lanthanide complexes,” Coordination Chemistry Reviews 293–294, 19 – 47 (2015). 41st International Conference on Coordination Chemistry, Singapore, July 2014.
- (62) T. Forster, “Delocalized excitation and excitation transfer,” in “Modern Quantum Chemistry. Istanbul Lectures. Part III: Action of Light and Organic Crystals,” , vol. 3 (Academic Press, 1965), pp. 93–137.
- (63) T. Forster, “10th spiers memorial lecture. transfer mechanisms of electronic excitation,” Discussions of the Faraday Society 27, 7–17 (1959).
- (64) T. Forster, “Zwischenmolekulare energiewanderung und fluoreszenz,” Ann. Phys. 2, 55 (1948).
- (65) T. Forster, “Energiewanderung und fluoreszenz,” Naturwissenschaften 33, 166–175 (1946).
- (66) D. Dexter and J. H. Schulman, “Theory of concentration quenching in inorganic phosphors,” J . Chem. Phys. 22, 1063 (1954).
- (67) D. Dexter and W. Heller, “Capture and collision processes for excitons in alkali halides,” Phys. Rev. 84, 377 (1651).
- (68) W. R. Heller and A. Marcus, “A note on the propagation of excitation in an idealized crystal,” Phys. Rev. 84, 809 (1951).
- (69) S. Sato and M. Wada, “Relations between intramolecular energy transfer efficiencies and triplet state energies in rare earth -diketone chelates,” Bulletin of the Chemical Society of Japan 43, 1955–1962 (1970).
- (70) J. Tang and P. Zhang, Lanthanide Single Molecule Magnets (Springer, 2015).
- (71) G.-J. Chen, C.-Y. Gao, J.-L. Tian, J. Tang, W. Gu, X. Liu, S.-P. Yan, D.-Z. Liao, and P. Cheng, “Coordination-perturbed single-molecule magnet behaviour of mononuclear dysprosium complexes,” Dalton Trans. 40, 5579 (2011).
- (72) W. C. Choy and D. Tao, “Rare-earth complexes and its applications in organic light emitting diodes,” in “Solid State Chemistry Research Trends,” , R. W. Buckley, ed. (Nova Science Publishers Inc, 2007), chap. 2.
- (73) H. Brito, O. Malta, M. Felinto, and E. Teotonio, “Luminescence phenomena involving metal enolates,” in “The Chemistry of Metal Enolates,” , J. Zabicky, ed. (Wiley, 2009), The Chemistry of Functional Groups, chap. 3.
- (74) C. Y. Peng, H. J. Zhang, J. B. Yu, Q. G. Meng, L. S. Fu, H. R. Li, L. N. Sun, and X. M. Guo, “Synthesis, characterization, and luminescence properties of the ternary europium complex covalently bonded to mesoporous sba-15,” J Phys. Chem B 109, 15278 (2005).
- (75) H. Xin, Y. Ebina, R. Ma, K. Takada, and T. Sasaki, J Phys. Chem B 110, 9863 (2006).
- (76) V. R. Kharabe, A. H. Oza, and S. J. Dhoble, “Synthesis, PL characterizations and concentration quenching effect in Dy3+ and Eu3+ activated LiCaBO3 phosphor,” Luminescence 30, 432–438 (2015).
- (77) J. J. Joos, K. W. Meert, A. B. Parmentier, D. Poelman, and P. F. Smet, “Thermal quenching and luminescence lifetime of saturated green Sr1-xEux Ga2S4 phosphors,” Optical Materials 34, 1902–1907 (2012).
- (78) O. Meza, E. Villabona-Leal, L. Diaz-Torres, H. Desirena, J. Rodriguez-Lopez, and E. Perez, “Luminescence concentration quenching mechanism in Gd2O3:Eu3+,” J Phys. Chem A 118, 1390–1396 (2014).
- (79) G. Ju, Y. Hu, L. Chen, X. Wang, and Z. Mu, “Concentration quenching of persistent luminescence,” Physica B: Condensed Matter 415, 1 – 4 (2013).
- (80) J. R. Lakowicz, Principles of Fluorescence Spectroscopy (Springer, 2006).
- (81) J. Bierwagen, S. Yoon, N. Gartmann, B. Walfort, and H. Hagemann, “Thermal and concentration dependent energy transfer of Eu2+ in SrAl2O4,” Optical Materials Express 6 (2016).
- (82) J. Ueda, P. Dorenbos, A. J. Bos, A. Meijerink, and S. Tanabe, “Insight into the thermal quenching mechanism for Y3Al5O:Ce3+ through thermoluminescence excitation spectroscopy,” J. Phys. Chem C 119, 25003–25008 (2015).
- (83) R. Yu, D. S. Shin, K. Jang, Y. Guo, H. M. Noh, B. K. Moon, B. C. Choi, J. H. Jeong, and S. S. Yi, “Luminescence and thermal-quenching properties of Dy3+-doped Ba2CaWO6 phosphors,” Spectrochimica Acta A 125, 458–462 (2014).
- (84) J. Feist and A. Heyes, “The characterization of Y2O2S:Sm powder as a thermographic phosphor for high temperature applications,” Measure Science Technology 11, 942–947 (2000).
- (85) Y. Bi, C. Chen, Y.-F. Zhao, Y.-Q. Zhang, S.-D. Jiang, B.-W. Wang, J.-B. Han, J.-L. Sun, Z.-Q. Bian, Z.-M. Wang, and S. Gao, “Thermostability and photoluminescence of Dy( III ) single-molecule magnets under a magnetic field,” Chem. Sci. 7, 5020 (2016).
- (86) C. D. S. Brites, P. P. Lima, N. J. O. Silva, A. Millan, V. S. Amaral, F. Palacio, and L. D. Carlos, “Thermometry at the nanoscale,” Nanoscale 4, 4799 (2012).
- (87) B. R. Anderson, S.-T. Hung, and M. G. Kuzyk, “Wavelength dependence of reversible photodegradation of disperse orange 11 dye-doped pmma thin films.” J. Opt. Soc. Am. B 32, 1043–1049 (2015).