Dy3+-doped Yttrium Complex Molecular Crystals for Two-color Thermometry in Heterogeneous Materials
Abstract
We develop Dy3+-doped yttrium complexes for use as two-color thermometry (TCT) phosphor molecular crystals in heterogeneous materials. These complexes include: Dy:Y(acac)3(phen), Dy:Y(hfa)3(DPEPO), Dy:Y(4-BBA)3(TPPO), Dy:Y(acac)3, and Dy:Y(acac)3(DPEPO), where the Dy/Y ratio is 1:9. We characterize the materials’ photoluminescence at different temperatures to determine the TCT calibration parameters and the degree to which thermal quenching influences the emission. From this data we observe a link between the excited state lifetime at room temperature and the degree to which the material is susceptible to thermal quenching (i.e. materials having long room temperature lifetimes are more resistant to thermal quenching than materials with short room temperature lifetimes). Of the five complexes tested we find that Dy:Y(acac)3(DPEPO) has the best thermal performance, with the most likely source of improvement being DPEPO’s compact rigid structure. This rigidity helps with energy transfer to the Dy3+ ion, suppresses non-radiative loss modes, and reduces exciplex formation.
I Introduction
Over the past several decades much work has been dedicated to elucidating the mechanisms of mechanical shock induced ignition of plastic bonded explosives (PBXs)Chen14.01 ; Chen14.02 ; Pokharel14.01 ; An13.01 ; Wu11.01 ; Rae02.01 ; Gupta95.01 ; Mellor93.01 ; Field92.01 ; Field92.02 ; Field82.01 ; Winter75.01 ; Chaudhri74.01 . PBXs are heterogeneous materials consisting of energetic molecular crystals embedded in a polymer matrix, which sometimes also contain taggants/markers, friction-generating grit, antioxidants, and plasticizers. Through this research it has been determined that during shock compression, hot spots form which, under the right conditions can lead to the ignition of the PBX.
These hot spots form through several different mechanisms, including: micro-fractures, plastic deformation Pokharel14.01 ; Winter75.01 ; Field82.01 , pore collapse Chaudhri74.01 , binder/crystal interface friction, and crystal/crystal interface friction. However, while these mechanisms have been determined, it is currently unknown which mechanisms are most important given a specific material composition and specific shock loading conditions Field82.01 . In order to answer this question we are developing an imaging thermometry technique – based on lanthanide luminescence – for potential use in combination with microstructural imaging of heterogeneous materials during shock compression. By performing simultaneous structural and thermal imaging of heterogenous materials we hope to be able to determine how different loading conditions lead to hot spot formation.
While the long term goal is to combine both thermal and structural imaging in shock experiments, the first step is to develop heterogeneous samples suitable for thermal imaging. To achieve this we are developing lanthanide based molecular crystals and dyes which can be dispersed/doped into a polymer to provide a photoluminescent heterogeneous material. Thermometric imaging is then achieved through measuring the temperature-dependent photoluminesence properties of the lanthanides.
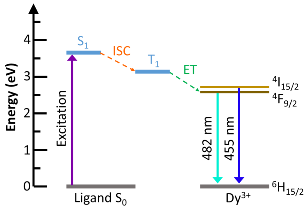
Thermometry using lanthanide photoluminescence is a broad field with a wide range of experimental techniques and host materials (for an overview of this field see Ref. Kontis07.01 ; Khalid08.01 ; Allison97.01 ). For our specific application we have chosen the technique of two-color ratio thermometry Juboori13.01 ; Heyes06.01 ; Kontis07.01 ; Kontis02.01 ; Heyes06.01 as it is simple to implement in imaging experiments and provides good temporal resolution. This technique involves measuring the temperature dependent intensity ratio of two emission peaks, from which the temperature can be determined. Specifically, we have chosen to use Dy3+-doped materials as Dy3+’s energy levels have two advantageous features for two-color thermometry (TCT). First, Dy3+ has two closely spaced energy levels ( and ), which are separated by an energy splitting of 0.115 eV (928 cm-1) and second, the splitting between the highest Stark level of the ground state and the excited state is eV (7850 cm-1)(which means relaxation will be predominately radiative) Bunzli10.01 .
When the Dy ion is excited by an appropriate wavelength of light it is excited into the energy level (population ) from which it can be thermally excited into the energy level (population ). The ratio of the two populations is given by the Boltzmann distribution as
| (1) |
This ratio of populations can be optically determined, as the intensity ratio of the and optical transitions are proportional to the population ratio
| (2) | ||||
| (3) |
where is a factor relating the populations to the measured intensity spectra. Therefore by determining both and in Equation 3 we can use a measured intensity ratio to determine the temperature of the Dy ions.
While Dy’s energy level spacing makes it a good lanthanide for TCT, its performance is limited by its intrinsically low molar absorbance Bunzli10.01 , which means that its fluorescence conversion efficiency is low. One method of overcoming this deficiency is to attach ligands (which have large absorption coefficients) to the Dy ions, which can then absorb incident light and transfer the energy to the Dy ion Sager65.01 ; Dexter53.01 ; Xin04.01 ; Latva97.01 ; Bunzli10.01 ; Bunzli89.01 ; Eliseeva10.01 , essentially using these ligands as “antennas” for the Dy ion. Figure 1 demonstrates a schematic of this energy transfer, with the process as follows: (1) the ligand absorbs the laser light and is excited into the state, (2) the ligand relaxes into the lowest triplet state () via inter-system crossing, (3) the energy is transferred to the lanthanide’s primary emissive state via: dipole-dipole interactions Forster65.01 ; Forster59.01 ; Dexter53.01 , dipole-quadrapole interactions Dexter53.01 , excitons Dexter51.01 ; Heller51.01 or electron exchange Dexter53.01 ; Adronov00.01 , and (4) the excited lanthanide ion relaxes emitting a photon.
Currently there is no universal law for determining which ligand-lanthanide combinations provide the best energy transfer to the lanthanide ion. However, Latva et al. observed – in a study of many different ligand-lanthanide combinations – that efficient energy transfer occurs when the energy difference between the ligand’s lowest triplet state and the lanthanide’s main fluorescent state is eV Latva97.01 . Here we consider six different ligands with their reported energy levels tabulated in Table 1 along with the energy difference between their lowest triplet state and Dy3+’s energy level. Note that the and energies of each ligand are found to vary in the literature Feng09.01 ; Sager65.01 ; Congiu13.01 ; Feng09.01 ; Xu06.01 ; Xin06.01 ; Peng05.01 ; Biju13.01 ; Zhang12.01 ; Xin04.01 with the values reported in Table 1 being average values of these reports.
| Ligand | Energy (eV) | Energy (eV) | (eV) | Ref. |
|---|---|---|---|---|
| acac | 3.60 | 3.13 | 0.55 | Feng09.01 ; Sager65.01 |
| hfa | 4.25 | 2.77 | 0.18 | Congiu13.01 |
| phen | 3.26 | 2.85 | 0.27 | Feng09.01 ; Xin06.01 ; Peng05.01 |
| DPEPO | 3.94 | 2.99 | 0.41 | Biju13.01 ; Xu06.01 ; Congiu13.01 |
| 4-BBA | 4.14 | 2.95 | 0.37 | Zhang12.01 |
| TPPO | 4.51 | 3.01 | 0.43 | Feng09.01 ; Xu06.01 ; Zhang12.01 ; Xin04.01 |
Looking at Table 1 we find that all ligands chosen, except hfa, satisfy Latva’s empirical rule with eV. The reason for including hfa in our study is that hfa is the H-F substituted version of acac. Previously it has been shown that in some cases H-F substitution in a Dy-complex can lead to improved luminescence performance due to H-F substitution eliminating high-energy vibrations from the ligand framework Glover07.01 . Therefore we are interested in determining if the H-F substitution in acac will lead to improved luminescent performance, despite hfa not satisfying Latva’s rule.
While ligands (with advantageous energy level spacings) can act as antennas for lanthanide ions, they also provide two additional benefits for our application. These benefits are: (1) ligands can be used to form Dy-doped organic molecular crystals, which act as solid inclusions in heterogeneous materials and (2) the ligands can be used to form a polymer soluble dye, which allows for the Ln-doped complex to be dispersed throughout a polymer. In the future, these two materials (both the molecular crystals and dye) will be combined in HTPB polymer to form heterogeneous materials for dynamic shock compression experiments. Having the TCT phosphors in both the molecular crystals and dispersed in the polymer should allow for spatially resolved thermometric imaging of both the crystals and polymer.
In this paper we consider five different TCT phosphor molecular crystals (based on Dy3+-doped yttrium complexes), including: Dy:Y(acac)3(phen) Anderson17.01 , Dy:Y(hfa)3(DPEPO), Dy:Y(4-BBA)3(TPPO), Dy:Y(acac)3, and Dy:Y(acac)3 (DPEPO), where the Dy/Y ratio is 1:9. We compare the performance of the four new Dy3+-doped yttrium complexes and Dy:Y(acac)3(phen) to determine the best phosphor for our eventual application: thermometry of heterogeneous samples during dynamic shock compression. Given this application there are five main performance parameters we consider: (1) room temperature luminescence lifetime, (2) functional maximum temperature (which we define as the temperature at which thermal quenching cuts the emission intensity to 1% of the room temperature level), (3) the intensity proportionality constant ( in Equation 3), (4) the temperature resolution , and (5) the maximum temperature sensitivity . The importance of each of these parameters is as follows:
-
1.
The room temperature lifetime is a good performance parameter for two reasons: first, the lifetime is proportional to the quantum efficiency of the phosphor Bunzli10.01 , with longer lifetimes having higher efficiencies. Secondly, the phosphor lifetime limits the time range over which TCT measurements can be performed during a shock experiment. Since shock experiments typically occur over microseconds, and we are using a laser with a repetition rate of 10 Hz, we will only be able to use a single excitation pulse to excite the phosphor. The phosphor then has to luminescence over the whole duration of the shock event in order to make multiple TCT measurements.
-
2.
The functional maximum temperature , is the temperature at which the intensity of the peak is quenched to 1% the room temperature value. At this intensity level the spectra are too noisy for accurate temperature calculations using our current spectroscopy system. Note that this definition of the functional maximum temperature depends on a specific spectroscopy system and can vary depending on the experimental setup used to measure the material’s photoluminescence.
-
3.
The intensity proportionality constant , is a measure of the relative intensity of the higher energy transition’s peak as compared to the lower energy transition’s peak. In practical terms this means that as increases the higher energy transition’s peak is brighter at room temperature. This directly affects the signal-to-noise ratio, with larger ’s providing improved signal-to-noise ratios.
-
4.
The temperature resolution – defined as Anderson17.01
(4) where is the integrated intensity ratio at temperature and is the experimental uncertainty in the ratio – is a direct measure of the precision of the TCT phosphor and optical hardware. It determines how well two closely spaced temperatures can be resolved using a given TCT phosphor and optical setup.
-
5.
The temperature sensitivity , is defined as Brites12.01
(5) and is given in units of % K-1. It determines the fractional change in the resolution as a function of temperature, with larger sensitivities implying larger ratio changes for a given change in temperature.
II Method
II.1 Materials
For our trial Dy3+-doped yttrium complex based molecular crystals we choose the following five complexes: Dy:Y(acac)3, Dy:Y(acac)3(phen), Dy:Y(acac)3(DPEPO), Dy:Y(hfa)3(DPEPO), and Dy:Y(4-BBA)3(TPPO). In this section we briefly describe the synthesis of each complex, with each one prepared with a Dy-doping of 10 mol%.
II.1.1 Dy:Y(acac)3
We begin synthesis of Dy:Y(acac)3 by first preparing a 10 mL aqueous solution of Dy(NO3)3.5H2O/Y(NO3)3.6H2O (0.625 M), which is then mixed with a solution of acetylacetone, acac (7.5 M), in 2.5 mL methanol. Next, a 2.5 mL aqueous solution of NaOH (1.5 M) is added to cause precipitation of the product, with the suspension being aged for 2-3 h. Afterwards the product is washed with deionized water and dried in vacuum oven at 80 ∘C for hours.
II.1.2 Dy:Y(acac)3(phen)
Dy:Y(acac)3(phen) is prepared as follows: first a solution of acetylacetone (0.06 M) and 1,10-phenanthroline (0.02 M) in a DMF/methanol mixture (1:1 vol/vol ratio) is prepared. Once prepared we add an aqueous solution of potassium tert-butoxide (KOtBu) (0.06 M) at an equal volume ratio. To this mixture we then add another equal volume aqueous solution of Dy(NO3)3.5H2O and Y(NO3)3.6H2O such that the total concentration is 0.02 M. The resulting solution is stirred for 4-6 hours during which white precipitates begin to form. The precipitates are then isolated using centrifugation (6000 rpm for 3 min) and vacuum dried at 80 ∘C for hours.
II.1.3 Dy:Y(acac)3(DPEPO)
We prepare Dy:Y(acac)3(DPEPO) by first preparing Dy(acac)3, as described above, which is then mixed with DPEPO at an equimolar ratio. The mixture is subsequently dissolved in a methanol/DMF mixture (0.06 M) and refluxed overnight. The supernatant is decanted to give the solid product, which is finally dried in a vacuum oven at 80 ∘C for hours.
II.1.4 Dy:Y(4-BBA)3(TPPO)
Dy:Y(4-BBA)3(TPPO) is prepared using the method of Zhang et al. Zhang12.01 in which a solution of Dy(NO3)3.5H2O /Y(NO3)3.6H2O (0.1 M) in 30 ml ethanol (0.1 M) is first prepared. To this solution we add 4-benzoylbenzoic acid (4-BBA)(1.8 M) and triphenylphosphine oxide (TPPO)(1.2 M) in 5 ml of DMF. To induce precipitation of the product we add a 30 ml aqueous solution of 0.8 M NaOH. The suspension is then boiled at 60-70 ∘C for 2-3 h and the resulting product is washed with deionized water and dried in a vacuum oven at 80 ∘C for hours.
II.1.5 Dy:Y(hfa)3(DPEPO)
Dy:Y(hfa)3(DPEPO) is prepared following the procedure of Chen et al. Chen11.01 . We first dissolve Dy(NO3)3.5H2O /Y(NO3)3.6H2O (0.02 M), DPEPO (0.02 M), and hexafluoroacetylacetone, (hfa) (0.06 M) in a dimethylformamide /methanol mixture (1:1 vol/vol ratio). We then add an equivolume aqueous solution of KOtBu (0.06 M), which causes the product to precipitate. The suspension is allowed to age for 3 h, after which the precipitates are isolated using centrifugation (6000 rpm for 5 min). With the precipitates isolated we dry them in a vacuum over at 80 ∘C for hours.
II.2 Optical Measurements
We perform temperature dependent emission spectroscopy of molecular crystals using a custom powder heater and fluorescence spectrometer Anderson17.01 . The spectrometer system consists of a frequency-tripled Nd:YAG laser (Continuum Powerlite, 355 nm, 8 ns, 10 Hz), various focusing and collection optics, and an Acton SpectraPro 2500i monochromator with attached PI-Max 3 ICCD camera. We also use a PMT attached to an Acton SpectraPro 2750i monochromator to perform lifetime measurements with the PMT output connected to a Tektronix DPO 4104 oscilloscope.
To heat the samples we use a custom built powder heater consisting of a solid cylinder of aluminum (2” D 1” H) with a 1 cm diameter indentation placed in its center where the powder is placed. By surrounding the powder on the sides and bottom we are able to more evenly heat the powder. To heat the aluminum cylinder we use a 120 W canister heater, which is controlled by an Omega CN32PT-220 PID controller with a K-type thermocouple providing temperature feedback.
III Results
III.1 Room Temperature Luminescence
We start our study of the spectral properties of the different Dy3+-doped yttrium complexes by considering the room temperature emission spectra and the lifetimes of the and energy levels. Figure 2 shows the normalized emission spectra of all five materials with each found to consist of broad emission peaks at nm (), nm (), nm () and nm (). While all five spectra in Figure 2 are similar, there are differences in the peak structure with the precise peak locations depending on which ligands are attached.
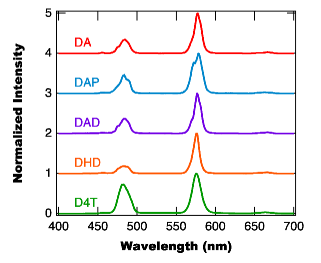
To better understand the differences in the spectra shown in Figure 2 we perform multi-Gaussian-peak fitting of each spectra and list the peak location and fractional peak area in Table 2, where the fractional peak area is defined as
| (6) |
where is the peak amplitude and is the Gaussian peak width.
| Transition | DA | DAP | DAD | DHD | D4T | |||||
|---|---|---|---|---|---|---|---|---|---|---|
| (nm) | Frac. Area | (nm) | Frac. Area | (nm) | Frac. Area | (nm) | Frac. Area | (nm) | Frac. Area | |
| 456.0 | 0.004 | 456.3 | 0.005 | 457.3 | 0.009 | 456.6 | 0.009 | 457.5 | 0.002 | |
| 471.1 | 0.010 | 481.6 | 0.210 | 470.0 | 0.008 | 477.4 | 0.084 | 481.4 | 0.339 | |
| 474.7 | 0.014 | 483.3 | 0.050 | 474.8 | 0.024 | 482.0 | 0.027 | 490.7 | 0.110 | |
| 481.4 | 0.134 | 489.7 | 0.046 | 481.5 | 0.156 | 487.5 | 0.105 | |||
| 487.8 | 0.133 | 487.9 | 0.133 | |||||||
| 569.1 | 0.022 | 573.0 | 0.390 | 569.4 | 0.096 | 575.8 | 0.221 | 576.6 | 0.305 | |
| 577.6 | 0.565 | 579.0 | 0.067 | 576.1 | 0.042 | 576.9 | 0.036 | 575.6 | 0.228 | |
| 583.5 | 0.063 | 582.2 | 0.216 | 578.2 | 0.518 | 574.7 | 0.488 | |||
| 566.0 | 0.034 | |||||||||
| 654.9 | 0.004 | 652.3 | 0.001 | 666.4 | 0.013 | 657.4 | 0.013 | 663.9 | 0.017 | |
| 666.8 | 0.016 | 661.2 | 0.010 | 666.4 | 0.018 | |||||
From Table 2 we find that each large peak in Figure 2 is composed of several component Gaussian peaks, with the component peak locations and fractional areas depending on the ligands attached to the Dy ions. For instance, by comparing the peak decompositions of Dy:Y(acac)3, Dy:Y(acac)3(phen), and Dy:Y(acac)3(DPEPO), we find that the absence or addition of another ligand to Dy:Y(acac)3 has a large influence on the peak structure. This observation is surprising as we initially anticipated that the majority of absorption and energy transfer will be due to the acac ligand. The reason for this hypothesis is that acac is nearly resonant with our pump wavelength (355 nm), while both phen and DPEPO have absorbance peaks farther from 355 nm. Given this hypothesis we would assume that the addition (or lack thereof) of another ligand (with off-resonant absorption) would have a minimal effect on the material’s peak structures. To better understand the nature of energy transfer of these materials requires a detailed study of the UV excitation spectra of these materials, which is beyond the scope of this current study.
While Table 2 considers the peak decomposition of all four observed Dy transitions, for the purpose of TCT we are primarily concerned with the and transitions. These transitions are more easily characterized by their peak locations (instead of using multipeak decomposition), which are tabulated in Table 3. Using these peak locations we can determine the energy splitting between the and energy levels, which is also listed in Table 3. Note that the energy differences in Table 3 are larger than the expected value of 0.115 eV Carnall68.01 ; Carnall79.01 ; Bunzli10.01 ; Bunzli10.02 . This difference is due to the emission spectra consisting of multiple overlapping peaks corresponding to transitions between Stark shifted energy sub levels. This splitting leads to the energy level difference depending on which Stark sub-levels are dominate in the emission spectra Bunzli10.01 ; Bi16.01 .
| Material | ||||||
|---|---|---|---|---|---|---|
| Lifetime (s) | Peak Location (nm) | Lifetime (s) | Peak Location (nm) | (10-3 eV) | cm-1 | |
| Dy:Y(acac)3 | 484.05 | 455.41 | 161.1 | 1299 | ||
| Dy:Y(acac)3(phen) | 483.40 | 455.17 | 159.1 | 1283 | ||
| Dy:Y(acac)3(DPEPO) | 484.21 | 455.33 | 162.4 | 1310 | ||
| Dy:Y(4-BBA)3(TPPO) | 481.94 | 457.03 | 140.2 | 1131 | ||
| Dy:Y(hfa)3(DPEPO) | 482.91 | 455.98 | 155.1 | 1251 | ||
III.2 Thermal Performance
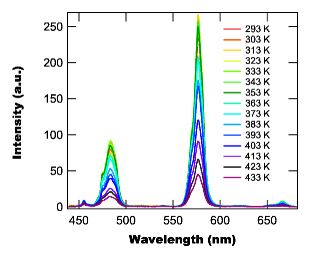
With the room temperature performance of the complexes determined, we next turn to consider how the complexes behave under elevated temperatures. Figure 3 shows example emission spectra for Dy:Y(acac)3(DPEPO) at different temperatures, with the emission found to decrease in intensity with increasing temperature. This decrease is a result of thermal quenching of the Dy ion’s emission and is seen for all five Dy-complexes.
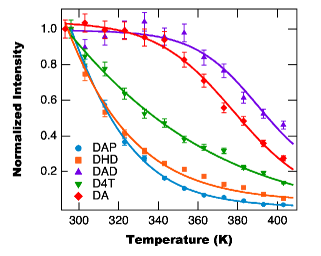
To determine how thermal quenching influences the emission of each complex we plot the emission intensity of the 482 nm peak as a function of temperature in Figure 4, with the emission intensity normalized such that the room temperature intensity is unity. From Figure 4 we find that the influence of thermal quenching on each material is drastically different, with Dy:Y(acac)3(phen) found to quickly quench while the emission from Dy:Y(acac)3(DPEPO) remains bright over the widest temperature range.
To make quantitative comparisons of the effect of thermal quenching on the materials’ photoluminescence intensity, we use the functional maximum temperature – defined as the temperature where the intensity is quenched to 1% – as our comparison parameter. We determine by first fitting the normalized intensities in Figure 4 to a stretched Arrhenius function:
| (7) |
where is an amplitude parameter, is the curves characteristic temperature and is a stretch exponent. Note that Equation 7 is phenomenological and should not be understood to be a fundamental relationship. Using the definition of (i.e. ) and rearranging Equation 7 we find that the functional maximum temperature is given by
| (8) |
Utilizing the fit parameters calculated from Figure 4 we compute the functional maximum temperatures, which are tabulated in Table 4. Note that the for Dy:Y(acac)3 and Dy:Y(acac)3(DPEPO) are extrapolated values as they lie above the temperature range of our current heating setup (which has a maximum temperature of K). Therefore we are unable to experimentally verify the accuracy of these extrapolated values.
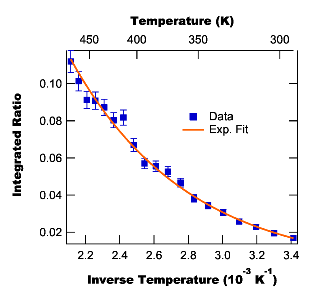
With the effect of thermal quenching on each complex’s emission quantified, we next determine the TCT calibration parameters for each complex. This is accomplished by calculating the ratio of the integrated peak intensities for the 455 nm (integration range 450-465) and 480 nm (integration range 465-504) peaks at each temperature. The uncertainty in the ratios is also computed using the uncertainty in the peak areas due to detector shot-noise and shot-to-shot laser variations. Figure 5 shows an example integrated ratio as a function of inverse temperature for the Dy:Y(acac)3 molecular crystals. For all five molecular crystals the integrated ratio is found to follow an exponential function as predicted by Equation 3, with Table 4 tabulating the fit parameters ( and ) for each Dy-complex. Establishing these parameters enables us to determine the molecular crystals’ temperature based on their emission spectra.
| Material | |||||
|---|---|---|---|---|---|
| (K) | (10-3 eV) | (cm-1) | (% K-1) | ||
| Dy:Y(acac)3 | 516 | 1.7 | |||
| Dy:Y(acac)3(phen) | 427 | 1.3 | |||
| Dy:Y(acac)3(DPEPO) | 546 | 1.6 | |||
| Dy:Y(4-BBA)3(TPPO) | 464 | 1.6 | |||
| Dy:Y(hfa)3(DPEPO) | 433 | 1.0 | |||
The final thermal performance parameter we consider is the maximum sensor sensitivity. To compute the maximum sensor sensitivity we substitute Equation 3 into Equation 5 and find that the sensitivity as a function of temperature is,
| (9) | ||||
| (10) |
which decreases with increasing temperature. Therefore, the maximum sensitivity is determined by substituting ( from Table 4) and the minimum temperature used (293 K) into Equation 10, with the results tabulated in Table 4. From Table 4 we find that the sensitivities range from 1-1.7 % K-1, which are on par for other TCT phosphors Brites12.01 .
IV Discussion
IV.1 Ranking the complexes performance
In the previous section we reported on the spectroscopic properties (at different temperatures) of five different Dy3+-doped yttrium ternary complexes with the goal of determining the best complex for use as a TCT phosphor. For the purpose of comparing the performance of the complexes we consider five different criteria: (1) luminescence lifetime, (2) resistance to thermal quenching, (3) the intensity proportionality constant ( in Equation 3), (4) the temperature resolution , and (5) the maximum sensor sensitivity .
For the first performance criteria we use Table 3 to rank the materials in order of shortest-to-longest lifetime as: Dy:Y(hfa)3(DPEPO) Dy:Y(acac)3(phen) Dy:Y(4-BBA)3(TPPO) Dy:Y(acac)3 Dy:Y(acac)3(DPEPO). Based on these results we make several important observations about the influence of the ligands on the lifetimes of the Dy excited states. First we observe that while the addition of the DPEPO ligand to the Dy:Y(acac)3 system improves the material’s fluorescence lifetimes, the addition of the phen ligand decreases the performance of the Dy:Y(acac)3 system. This observation is consistent with previous observations on the influence of the phen ligand on Dy(acac)3 Feng09.01 and on other lanthanide-doped complexes Xin03.01 ; Xin04.01 as well as the influence of DPEPO on other lanthanide-doped complexes Xu06.01 ; Biju13.01 ; Biju09.01 ; Congiu13.01 . Additionally, we find that when we substitute hfa for acac in Dy:Y(acac)3(DPEPO) the fluorescence lifetime drastically decreases, despite the H-F substitution of the acac ligand. This decrease means that the stabilization of high-energy vibrations by the H-F substitution Glover07.01 is less important to Dy:Y(hfa)3(DPEPO) performance than the backwards energy transfer from the Dy ion to the hfa ligand. Recall from Table 1 that hfa’s lowest triplet state is only 0.18 eV greater than Dy’s energy level.
To determine the second performance criteria – resistance to thermal quenching – we use the functional maximum temperatures reported in Table 4 to rank the materials (from lowest-to-highest functional maximum temperatures) as: Dy:Y(hfa)3(DPEPO) Dy:Y(acac)3(phen) Dy:Y(4-BBA)3(TPPO) Dy:Y(acac)3 Dy:Y(acac)3(DPEPO), where Dy:Y(hfa)3(DPEPO) and Dy:Y(acac)3(phen) have approximately the same thermal performance. Comparing this ranking of functional maximum temperatures to the ranking we have for the room temperature lifetimes, we find that the two quantities appear to be correlated, with longer lifetimes corresponding to higher functional maximum temperatures.
While a wider range of materials needs to be tested to confirm a relationship between the lifetime and the maximum functional temperature, this result suggests that we can roughly estimate a Dy-doped yttrium complex’s resistance to thermal quenching based on the room temperature lifetime. This relationship can be intuitively argued as follows: In general, the rate of energy loss , from the excited Dy energy levels is given by
| (11) |
where is the rate of radiative energy loss and is the total rate of non-radiative energy loss, which is the sum of all non-radiative channels. Equation 11 can be inverted to give the lifetime of the excited state to be,
| (12) | ||||
Assuming that the radiative lifetime is similar for all complexes, the only way to change the lifetime becomes the non-radiative energy loss channels. This implies that materials with lower lifetimes have an increased number of energy loss channels. Since the non-radiative energy loss rate is known to increase with temperature, it makes intuitive sense that complexes having more loss channels will be more susceptible to thermal quenching than those with few loss channels. This is because elevating the temperature will result in a greater fraction of energy being diverted to non-radiative channels than in the case of few loss channels.
The next performance criteria is the amplitude parameter in Equation 3. From Table 4 we can rank the materials as follows: Dy:Y(hfa)3(DPEPO) Dy:Y(acac)3(phen) Dy:Y(4-BBA)3(TPPO) Dy:Y(acac)3(DPEPO) Dy:Y(acac)3. From this ranking we find that both Dy:Y(acac)3 and Dy:Y(acac)3(DPEPO) are once again the best performing materials.
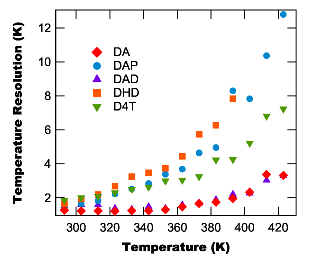
When determining the fourth performance criteria (temperature resolution) we find it to be temperature dependent and we therefore plot the calculated resolution as a function of temperature in Figure 6. From Figure 6 we find that all five sensors have similar temperature resolutions at room temperature (in the 1.5 K to 2 K range), but the resolution’s behavior changes drastically as the temperature increases. Looking at the high temperature region in Figure 6 we find that we can rank the sensor’s temperature resolution performance as: Dy:Y(hfa)3(DPEPO) Dy:Y(acac)3(phen) Dy:Y(4-BBA)3(TPPO) Dy:Y(acac)3(DPEPO) Dy:Y(acac)3, which is consistent with the ranking of the other metrics.
Finally, the last performance criteria for the sensors are their temperature sensitivity, which are tabulated in Table 4, with their values ranging between 1 % K-1 and 1.7 % K-1. Ranking the sensors from least-sensitive to most-sensitive we find: Dy:Y(hfa)3(DPEPO) Dy:Y(acac)3(phen) Dy:Y(4-BBA)3(TPPO) Dy:Y(acac)3(DPEPO) Dy:Y(acac)3, where once again Dy:Y(acac)3(DPEPO) and Dy:Y(acac)3 display the best performance (i.e. largest sensitivity) of the different sensors.
IV.2 Effect of ligand choice
Based on these rankings we find that the choice of ligands not only affects the room temperature spectral performance of these complexes Bunzli10.01 , but also their usefulness as TCT phosphors, with Dy:Y(acac)3 and Dy:Y(acac)3(DPEPO) found to consistently outperform the other phosphors tested in this study. While a full understanding of the effect of ligand choice on the performance parameters of different complexes requires a more systematic study with a larger number of ligands, we can still make some observations based on the complexes used in this study. Specifically, by comparing Dy:Y(acac)3, Dy:Y(acac)3(phen) and Dy:Y(acac)3(DPEPO) we can consider the influence of an auxiliary ligand (none, phen, or DPEPO) on the thermal performance.
Looking at the rankings above for Dy:Y(acac)3, Dy:Y(acac)3(phen) and Dy:Y(acac)3(DPEPO), we find that overall Dy:Y(acac)3(DPEPO) performs better than Dy:Y(acac)3, which performs better than Dy:Y(acac)3(phen). This implies that the DPEPO ligand improves the performance of the Dy complex, while the phen ligand decreases the performance. These results are consistent with previous studies involving these ligands where phen was observed to decrease the performance of ternary complexes Feng09.01 ; Xin03.01 ; Xin04.01 , while DPEPO improved the performance Xu06.01 ; Biju13.01 ; Biju09.01 ; Congiu13.01 . Phen’s negative effect is attributed to its relatively low triplet level Xin03.01 ; Feng09.01 , while DPEPO’s enhancing effect is attributed to its compact rigid structure Xu06.01 . This structure helps with energy transfer to the lanthanide ion, suppress non-radiative energy loss modes, and reduces the formation of exciplexes, which can decrease the luminescence efficiency of the complex.
Lastly, we find – when considering Dy:Y(hfa)3(DPEPO) – that the substitution of acac with hfa drastically reduces the performance of the material. Given this observation, we conclude that while the H-F substitution (acac to hfa) has been shown to improve luminescence performance in other complexes Glover07.01 , this improvement is mitigated in Dy:Y(hfa)3(DPEPO) by backwards energy transfer from the Dy ion to the ligand. This backwards energy transfer occurs as the energy difference between the hfa’s lowest triplet level and Dy’s energy level is eV (see Table 1).
V Conclusions
We measure the temperature dependent photoluminescence of five different Dy3+-doped yttrium complexes to determine the best material for use as a TCT phosphor. These complexes include: Dy:Y(acac)3(phen), Dy:Y(hfa)3(DPEPO), Dy:Y(4-BBA)3(TPPO), Dy:Y(acac)3, and Dy:Y(acac)3(DPEPO). All five materials are found to suffer from thermal quenching at elevated temperatures, with Dy:Y(acac)3(DPEPO) having the highest functional maximum temperature (546 K) and Dy:Y(acac)3(phen) having the lowest functional maximum temperature (427 K). In addition to measuring the materials’ functional maximum temperature, we also determine each material’s TCT calibration parameters, temperature resolution, and temperature sensitivity.
From these results we find that the performance of the complexes depends strongly on the choice of ligands, with Dy:Y(acac)3(DPEPO) having the best overall performance and Dy:Y(hfa)3(DPEPO) having the worst overall performance. Also, we find that there is a correlation between the room temperature lifetime and the maximum functional temperature of the complexes, with increased lifetimes producing higher maximum functional temperatures. This result provides a guide for choosing future Dy-complexes for TCT phosphors such that the influence of thermal quenching is minimized.
To better understand how different ligand properties influence the complex’s thermal performance we are currently performing a more systematic experimental study using a wider variety of ligands. This study, with systematic variations of the ligands, will help to elucidate what ligand properties produce the best material performance. It will also help elucidate the relationship between the functional maximum temperature and the room temperature lifetime. We are also planning on performing modeling of the complexes using Gaussian 09 Gaussian09 .
In addition to our results revealing new avenues of study for phosphor development, they also determine the best TCT phosphor molecular crystal (of the five tested) for use in future dynamic shock experiments, namely Dy:Y(acac)3(DPEPO). Having determined our best phosphor we are now planning a series of experiments to test the phosphor’s response under rapid heating and pressure, which are the two main components of dynamic shock compression. These experiments include: performing TCT measurements under rapid CO2 laser heating, photoluminescence measurements under static pressure, and – eventually – photoluminescence measurements under dynamic shock compression.
Acknowledgements
This work was supported by the Air Force Office of Scientific Research, Award # FA9550-15-1-0309 to Washington State University.
References
- (1) M. Chen, S. You, K. Suslick, and D. Dlott, “Hot spots in energetic materials generated by infared and ultrasound, detected by thermal imaging microscopy,” Rev. Sci. Instrum 85, 023705 (2014).
- (2) M. Chen, S. You, K. Suslick, and D. Dlott, “Hot spot generation in energetic materials created by long-wavelength infared radiation,” App. Phys. Lett. 104, 061907 (2014).
- (3) R. Pokharel, J. Lind, A. Kanjarla, R. Lebensohn, S. Li, P. Kenesei, R. Suter, and A. Rollett, “Polycrystal plasticity: comparison between grain-scale observations of deformation and simulations,” Annual Review of Condensed Matter Physics 5, 317–346 (2014).
- (4) Q. An, W. Goddard, S. Zybin, A. Jaramillo-Botero, and T. Zhou, “Highly shocked polymer bonded explosives at a nonplanar interface: hot-spot formation leading to detonation,” Journal of Physical Chemistry C 117, 26551–26561 (2013).
- (5) Y. Wu and F. Huang, “A microscopic model for predicting hot-spot ignition of granular energetic crystals in response to drop-weight impacts,” Mechanics of Materials 43, 835–852 (2011).
- (6) P. Rae, H. Goldrein, S. Palmer, J. Field, and A. Lewis, “Quasi-static studies of the deformation and failure of beta-hmx based polymer bonded explosives,” Proceedings of the Royal Society a-Mathematical Physical and Engineering Sciences 458, 743–762 (2002).
- (7) Y. Gupta, “Recent developments to understand molecular-changes in schocked energetic materials,” Journal De Physique IV 5, 345–356 (1995).
- (8) A. Mellor, D. Wiegand, and K. Isom, “Hot-spot histories in energetic materials,” Structure and Properties of Energetic Materials 296, 293–298 (1993).
- (9) J. Field, “Hot-spot ignition mechanisms for explosives,” Acc. Chem. Res. 25, 489–496 (1992).
- (10) J. Field, N. Bourne, S. Palmer, S. Walley, and J. Smallwood, “Hot-spot ignition mechanisms for explosives and propellants,” Philosophical Transactions of the Royal Society of London-Mathematical Physical and Engineering Sciences 339, 269–283 (1992).
- (11) J. Field, G. Swallowe, and S. Heavens, “Ignition mechanisms of explosives during mechanical deformation,” Proceedings of the Royal Society of London Series A 382, 231 (1982).
- (12) R. Winter and E. Faber, “The role of localized plastic flow in the impact initiation of explosives,” Proceedings of the Royal Society of London Series A 343, 399–413 (1975).
- (13) M. Chaudhri and J. Field, “The role of rapidly compressed gas pockets in the initiation of condensed explosives,” Proceedings of the Royal Society of London 340, 113–128 (1974).
- (14) K. Kontis, “A review of some current research on pressure sensitive and thermographic phosphor techniques,” The Aeronautical Journal 3162, 495–508 (2007).
- (15) A. Khalid and K. Kontis, “Thermographic phosphors for high temperature measurements: Principles, current state of the art and recent applications,” Sensors 8, 5673–5744 (2008).
- (16) S.W., Allison, and G. Gillies, “Remote thermometry with thermographic phosphors: Instrumentation and applications,” Review Scientific Instruments 68, 2615–2650 (1997).
- (17) A. Z. M. Al-Juboori, “Rare earth (Sm3+ and Dy3+)-doped gadolinium oxide nanomaterials for luminescence thermometry,” Physica Scripta T157, 014004 (2013).
- (18) A. Heyes, S. Seefeldt, and J. Feist, “Two-colour phosphor thermometry for surface temperature measurement,” Optics & Laser Technology 38, 257–265 (2006).
- (19) K. Kontis, Y. Syogenji, and N. Yoshikawa, “Surface thermometry by laser induced fluorescence of Dy3+ :YAG,” The Aeronautical Journal 106, 453–457 (2002).
- (20) J.-C. G. Bünzli and S. V. Eliseeva, “Basics of lanthanide photophysics,” in “Lanthanide Luminescence: Photophysical, Analytical and Biological Aspects,” , P. Hanninen and H. Harma, eds. (Springer-Verlag, 2010).
- (21) N. F. W. F. Sager and F. A. Serafin, “Substituent effects on intramolecular energy transfer. i. absorption and phosphorescence spectra of rare earth -diketone chelates,” J Phys. Chem 69, 1092 (1965).
- (22) D. Dexter, “A theory of sensitized luminescence in solids,” J. Chem. Phys. 21, 836 (1953).
- (23) H. Xin, M. Shi, X. C. Gao, Y. Y. Huang, Z. L. Gong, D. B. Nie, H. Cao, Z. Q. Bian, F. Y. Li, and C. H. Huang, “The effect of different neutral ligands on photoluminescence and electroluminescence properties of ternary terbium complexes,” The Journal of Physical Chemistry B 108, 10796–10800 (2004).
- (24) M. Latva, H. Takalo, V.-M. Mukkala, C. Matachescu, J. C. Rodríguez-Ubis, and J. Kankare, “Correlation between the lowest triplet state energy level of the ligand and lanthanide(iii) luminescence quantum yield,” Journal of Luminescence 75, 149 – 169 (1997).
- (25) J. Bünzli, “Luminescent probes,” in “Lanthanide Probes in Life Chemical and Earth Sciences: Theory and Practice,” , J. Bunzli and G. Choppin, eds. (Elsevier, 1989), pp. 219–293.
- (26) S. V. Eliseeva and J.-C. G. Bünzli, “Lanthanide luminescence for functional materials and bio-sciences,” Chem. Soc. Rev. 39, 189–227 (2010).
- (27) T. Forster, “Delocalized excitation and excitation transfer,” in “Modern Quantum Chemistry. Istanbul Lectures. Part III: Action of Light and Organic Crystals,” , vol. 3 (Academic Press, 1965), pp. 93–137.
- (28) T. Forster, “10th spiers memorial lecture. transfer mechanisms of electronic excitation,” Discussions of the Faraday Society 27, 7–17 (1959).
- (29) D. Dexter and W. Heller, “Capture and collision processes for excitons in alkali halides,” Phys. Rev. 84, 377 (1951).
- (30) W. R. Heller and A. Marcus, “A note on the propagation of excitation in an idealized crystal,” Phys. Rev. 84, 809 (1951).
- (31) A. Adronov and J. M. Frechet, “Light-harvesting dendrimers,” Chem Comm pp. 1701–1710 (2000).
- (32) J. Feng, L. Zhou, S.-Y. Song, Z.-F. Li, W.-Q. Fan, L.-N. Sun, Y.-N. Yu, and H.-J. Zhang, “A study on the near-infrared luminescent properties of xerogel materials doped with dysprosium complexes,” Dalton Trans. 33, 6593–6598 (2009).
- (33) M. Congiu, M. Alamiry, O. Moudam, S. Ciorba, P. R. Richardson, L. Maron, A. C. Jones, B. S. Richards, and N. Robertson, “Preparation and photophysical studies of [Ln(hfac)3DPEPO], Ln = Eu, Tb, Yb, Nd, Gd; interpretation of total photoluminescence quantum yield,” Dalton Trans. 42, 13537 (2013).
- (34) H. Xu, L.-H. Wang, X.-H. Zhu, K. Yin, G.-Y. Zhong, X.-Y. Hou, and W. Huang, “Application of chelate phosphine oxide ligand in EuIII complex with mezzo triplet energy level, highly efficient photoluminescent, and electroluminescent performances,” J. Phys. Chem. B 110, 3023–3029 (2006).
- (35) H. Xin, Y. Ebina, R. Ma, K. Takada, and T. Sasaki, J Phys. Chem B 110, 9863 (2006).
- (36) C. Y. Peng, H. J. Zhang, J. B. Yu, Q. G. Meng, L. S. Fu, H. R. Li, L. N. Sun, and X. M. Guo, “Synthesis, characterization, and luminescence properties of the ternary europium complex covalently bonded to mesoporous sba-15,” J Phys. Chem B 109, 15278 (2005).
- (37) S. Biju, N. Gopakumar, J.-C. G. Bünzli, R. Scopelliti, H. Kim, and M. Reddy, “Brilliant photoluminescence and triboluminescence from ternary complexes of DyIII andTbIII with 3-phenyl-4-propanoyl-5-isoxazolonate and a bidentate phosphine oxide coligand,” Inorganic Chemistry 52, 8750–8758 (2013).
- (38) A. Zhang, J. Zhang, Q. Pan, S. Wang, H. Jia, and B. Xu, “Synthesis, photoluminescence and intramolecular energy transfer model of a dysprosium complex,” J. Lumin. 132, 965–971 (2012).
- (39) P. B. Glover, A. P. Bassett, P. Nockemann, B. M. Kariuki, R. V. Deun, and Z. Pikramenou, “Fully fluorinated imidodiphosphinate shells for visible- and NIR-emitting lanthanides: Hitherto unexpected effects of sensitizer fluorination on lanthanide emission properties,” Chem. Eur. J. 13, 6308–6320 (2007).
- (40) B. R. Anderson, R. Gunawidjaja, and H. Eilers, “Two-color thermosensors based on [Y1-xDyx(acetylacetonate)3(1,10-phenanthroline)] molecular crystals,” App. Phys. B 123, 62 (2017).
- (41) C. D. S. Brites, P. P. Lima, N. J. O. Silva, A. Millan, V. S. Amaral, F. Palacio, and L. D. Carlos, “Thermometry at the nanoscale,” Nanoscale 4, 4799 (2012).
- (42) R. Chen, J. Lawless, and V. Pagonis, “A model for explaining the concentration quenching of thermoluminescence,” Radiation Measurements 46, 1380–1384 (2011).
- (43) W. T. Carnall, P. R. Fields, and K. Rajnak, “Electronic energy levels in the trivalent lanthanide aquo ions,” J. Chem Phys. 49, 4424–4442 (1968).
- (44) W. Carnall, “The absorption and fluorescence spectra of rare earth ions in solution,” in “Handbook on the physics and chemistry of rare earths,” , K. Gschneidner and L. Eyring, eds. (Elsevier BV, Amsterdam, 1979), chap. 24.
- (45) J. Bünzli, “Lanthanide luminescence for biomedical analyses and imaging,” Chem. Rev. 110, 2729–2755 (2010).
- (46) Y. Bi, C. Chen, Y.-F. Zhao, Y.-Q. Zhang, S.-D. Jiang, B.-W. Wang, J.-B. Han, J.-L. Sun, Z.-Q. Bian, Z.-M. Wang, and S. Gao, “Thermostability and photoluminescence of Dy( iii ) single-molecule magnets under a magnetic field,” Chem. Sci. 7, 5020 (2016).
- (47) H. Xin, M. Shi, F. Y. Li, M. Guan, D. Q. Gao, C. H. Huang, K. Ibrahim, and F. Q. Liu, “Photoluminescence and electroluminescence properties of three ternary lutetium complexes,” New J. Chem. 27, 1485 (2003).
- (48) S. Biju, M. L. P. Reddy, A. H. Cowley, and K. V. Vasudevan, “Molecular ladders of lanthanide-3-phenyl-4-benzoyl-5-isoxazolonate and bis(2-(diphenylphosphino)phenyl) ether oxide complexes: The role of the ancillary ligand in the sensitization of Eu3+ and Tb3+ luminescence,” Crystal Growth & Design 9, 3562–3569 (2009).
- (49) M. J. Frisch, G. W. Trucks, H. B. Schlegel, G. E. Scuseria, M. A. Robb, J. R. Cheeseman, G. Scalmani, V. Barone, B. Mennucci, G. A. Petersson, H. Nakatsuji, M. Caricato, X. Li, H. P. Hratchian, A. F. Izmaylov, J. Bloino, G. Zheng, J. L. Sonnenberg, M. Hada, M. Ehara, K. Toyota, R. Fukuda, J. Hasegawa, M. Ishida, T. Nakajima, Y. Honda, O. Kitao, H. Nakai, T. Vreven, J. A. Montgomery, Jr., J. E. Peralta, F. Ogliaro, M. Bearpark, J. J. Heyd, E. Brothers, K. N. Kudin, V. N. Staroverov, R. Kobayashi, J. Normand, K. Raghavachari, A. Rendell, J. C. Burant, S. S. Iyengar, J. Tomasi, M. Cossi, N. Rega, J. M. Millam, M. Klene, J. E. Knox, J. B. Cross, V. Bakken, C. Adamo, J. Jaramillo, R. Gomperts, R. E. Stratmann, O. Yazyev, A. J. Austin, R. Cammi, C. Pomelli, J. W. Ochterski, R. L. Martin, K. Morokuma, V. G. Zakrzewski, G. A. Voth, P. Salvador, J. J. Dannenberg, S. Dapprich, A. D. Daniels, Ö. Farkas, J. B. Foresman, J. V. Ortiz, J. Cioslowski, and D. J. Fox, “Gaussian 09 Revision E.01,” Gaussian Inc. Wallingford CT 2009.