Tuning paramagnetic spin-excitations of single adatoms
Abstract
We predict the existence of paramagnetic spin-excitations (PSE) in non-magnetic single adatoms. Our calculations demonstrate that PSE develop a well-defined structure in the meV region when the adatom’s Stoner criterion for magnetism is close to the critical point. We further reveal a subtle tunability and enhancement of PSE by external magnetic fields. Finally, we show how PSE can be detected as moving steps in the signal of inelastic scanning tunneling spectroscopy, opening a potential route for experimentally accessing electronic properties of non-magnetic adatoms, such as the Stoner parameter.
Single adatoms deposited on surfaces have become a prominent playground where theory and experiment can explore hand by hand a large variety of physical phenomena ranging from spin-excitations Hirjibehedin et al. (2007); Fernández-Rossier (2009); Lorente and Gauyacq (2009); Lounis et al. (2010); Zhou et al. (2010); Khajetoorians et al. (2011, 2013); Ternes (2015); Khajetoorians et al. (2016); Ibañez-Azpiroz et al. (2016) to magnetic exchange interactions Oberg et al. (2014); Yan et al. (2015); Stróżecka et al. (2011), quantum spin decoherence Bryant et al. (2015); Baumann et al. (2015a); Delgado and Fernández-Rossier (2017), topological superconductivity Nadj-Perge et al. (2014); Braunecker and Simon (2013); Vazifeh and Franz (2013) or the Kondo effect Ternes et al. (2009); von Bergmann et al. (2015), among many others. Virtually all these effects arise from the intricate interplay between the degrees of freedom of the adatom - charge, spin or orbital momentum - and the electron and phonon bath of the substrate, a subject of heavy and ongoing investigation.
Noteworthily, magnetism plays a central role in fueling the interest for single adatoms, given that they represent the ultimate limit in the context of bit miniaturization in data storage devices. As a consequence, great efforts are being devoted to the search and characterization of elements that become magnetic when deposited on a substrate. Successful examples include, e.g., Fe and Co on Pt(111) Gambardella et al. (2003); Khajetoorians et al. (2013), Fe on Cu(111) Khajetoorians et al. (2011) as well as on Cu2Ni/Cu(111) Bryant et al. (2013) and CuNi Hirjibehedin et al. (2007), Co on MgO(100) Rau et al. (2014), and more recently Ho on MgO/Ag(100) Donati et al. (2016), which all exhibit local magnetic moments greater than and reveal clear signatures of magnetism that manifest either in a large magnetic anisotropy energy, steps in the signal related to spin-excitations or even remanence of the magnetic signal.
In this Letter, we propose and argue that even nominally non-magnetic single adatoms can exhibit clear fingerprints of magnetism in the form of well-defined features in the spin-excitation spectrum, i.e., paramagnetic spin-excitations (PSE). Interestingly, these are the analogous of so-called paramagnons first proposed by Doniach in 1967 Doniach (1967) and first measured in bulk Pd nearly 50 years later by Doubble et. al. Doubble et al. (2010) (see also Ref. Staunton et al., 2000 for recent calculations). In the context of Fermi liquid theory, these excitations can be viewed as persistent spin-fluctuation modes that can be activated by temperature and thus produce a measurable impact on properties such as specific heat or electron effective-mass enhancement Doniach (1967); Lonzarich and Taillefer (1985). Upon reducing the dimensionality of the system, here we show that PSE can be strongly enhanced due to the modified interplay between the two fundamental electronic properties involved, namely the Stoner exchange interaction and the adatom’s density of states (DOS) at the Fermi level. Importantly, this opens up unforeseen potential applications of non-magnetic adatoms in nanotechnology, which encodes and manipulates information into excitation modes like PSE. In addition, our ab-initio analysis based on time-dependent density functional theory (TDDFT) reveals that PSE are highly sensitive to externally applied magnetic fields and, furthermore, can exhibit a singular enhancement when the field approaches a critical regime. Motivated by these findings, we assess the impact of PSE on the signal as measured in inelastic scanning tunneling spectroscopy (ISTS) experiments, identifying clear signatures of magnetic response that allow to distinguish these type of excitations from, e.g., phonons.
A central property for our discussion is the spin-excitation spectrum of non-magnetic adatoms. Within the TDDFT formalism, this information is encoded into the longitudinal component of the enhanced spin-susceptibility, , which is related to the response of the non-interacting Kohn-Sham (KS) system, : Aguayo et al. (2004)
| (1) |
Above, denotes the so-called Stoner parameter, which plays the role of the exchange-correlation kernel in the adiabatic local spin-density approximation Vosko et al. (1980). Noteworthily, the static limit of Eq. 1 recovers the standard Stoner theory that provides the well-known criterion for magnetism, i.e. , with the adatom’s DOS at the Fermi level and we used Aguayo et al. (2004). In essence, the product quantifies the competition between the exchange interaction, which enhances the tendency towards magnetism of electrons in localized orbitals, and substrate hybridization, which induces delocalization of the adatom’s electrons and therefore acts against magnetism, thus playing the role of the kinetic energy in the standard Stoner theory. It is interesting to note that even if an adatom does not fulfill the Stoner criterion, it can still develop dynamical PSE provided the details of the electronic structure make the denominator of Eq. 1 vanishingly small at a finite frequency.
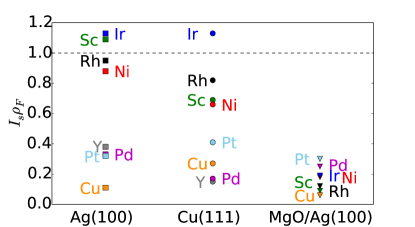
Let us begin our analysis by characterizing the set of 3d, 4d and 5d transition metal adatoms that could potentially exhibit PSE. For this purpose, in Fig. 1 we list several adatoms whose calculated Stoner products are below or slightly above 1; the calculations have been performed following the Korringa-Kohn-Rostoker Green function formalism Papanikolaou et al. (2002); Lounis et al. (2010, 2011) (see Supplemental Material for technical details, which includes Refs. Giannozzi et al., 2009; Janak, 1977; Lazarovits et al., 2002; Beckmann and Bergmann, 1997; Wildberger et al., 1995) and considering three different substrates, namely Ag(100), Cu(111) and MgO/Ag(100). As a general trend, our calculations show that the metallic substrates Ag(100) and Cu(111) host adatoms whose Stoner product is closer to the critical value 1 as compared to insulating MgO/Ag(100). This is mainly due to the small in the later, as tabulated in the Supplemental Material. Among the two metallic substrates, Ag(100) hosts adatoms whose Stoner product are closest to 1, with ranging between for Sc, Ir, Rh and Ni adatoms. Therefore, throughout the work we will focus on discussing the Ag(100) substrate in detail, as it illustrates best our findings.
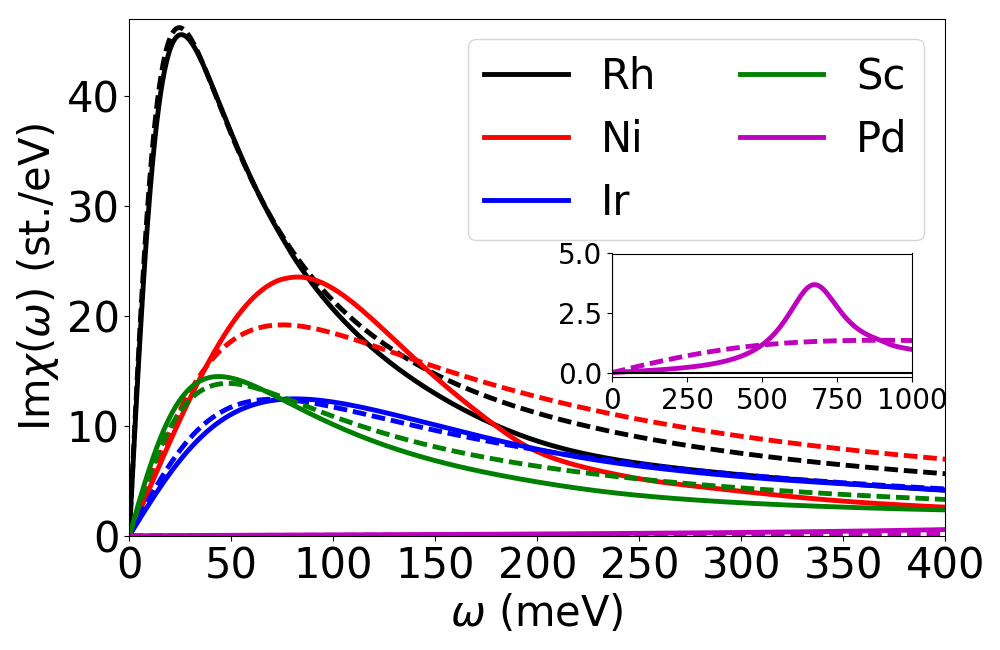
In Fig. 2 we illustrate the calculated spin-excitation spectra as given by from Eq. (1), where all calculations were done considering the non-magnetic ground state (see Supplemental Material for technical details). Interestingly, Fig. 2 reveals peak-like structures resonating at frequencies below 100 meV for Rh, Ni, Ir and Sc adatoms. This is exceptional, as most non-magnetic elements exhibit a featureless spectrum owing to a complete overdamping of the excitations. Rh represents the most favorable case, displaying a well-defined peak at meV and a width of meV, the associated lifetime being fs. It is noteworthy that both the lifetime and the height of the peak, the later being related to the intensity of the excitation, are only one order of magnitude smaller than those of usual transverse spin-excitations measured by ISTS in magnetic adatoms, such as Fe on Cu(111) (see, e.g., Refs. Khajetoorians et al., 2011; dos Santos Dias et al., 2015). On the other extreme, Pd in Fig. 2 shows a highly overdamped resonance at around 600 meV (see figure inset) whose intensity is an order of magnitude smaller than that of Rh. Therefore, our ab-initio calculations reveal the existence of PSE whose resonance frequency and width vary strongly depending on the adatom.
Next, we focus on characterizing the physical mechanism behind PSE that allows an interpretation of the ab-initio results displayed in Fig. 2. For this purpose, let us consider the frequency expansion of the paramagnetic KS spin response function up to linear order, i.e., . One can show (see Supplemental Material) that the linear expansion coefficient is well approximated by . Therefore, the spin-excitation spectrum within this approximation is given by a simple expression involving only the DOS at and the Stoner parameter:
| (2) |
By extracting and from our ab-initio calculations, we have computed and displayed the expression predicted by Eq. (2) for each of the adatoms considered in Fig. 2 (see dashed lines). A comparison to the full ab-initio calculations (solid lines) reveals a very good agreement for frequencies below 100 meV in the case of Rh, Ir and Sc, where both the peak and width are properly described within relative error. This error is considerably larger in the case of Ni, indicating the importance of higher order expansion terms in for this case. Finally, the peak for Pd is far beyond the limit of small frequencies and therefore the approximation of Eq. (2) breaks down.
Proving Eq. (2) to be an accurate approximation of the full spin-excitation density given by Eq. (1) is extremely convenient, as the former provides an analytical interpretation for the origin of PSE in terms of just and , two basic electronic properties of adatoms. Indeed, the resonance frequency, linewidth and amplitude of PSE predicted by Eq. (2) can be cast into simple expressions:
| (3) | ||||
Interestingly, a potential measurement of the above quantities would directly yield experimental estimates for and . In closer inspection, one recognizes the Stoner product as the key quantity in Eq. (3); as (i.e., ferromagnetic instability), the resonance frequency as well as the linewidth tend to zero while the intensity of PSE shows a singularity. This analysis offers therefore the interpretation we seeked for, namely that elements closer to the ferromagnetic instability show enhanced PSE, as it can be clearly checked from the comparison of Figs. 1 and 2. We emphasize that the mechanism just described is fundamentally different from the one taking place in magnetic adatoms, where the resonance frequency of transverse spin-excitations is settled by the spin-orbit interaction via the magnetic anisotropy energy dos Santos Dias et al. (2015).
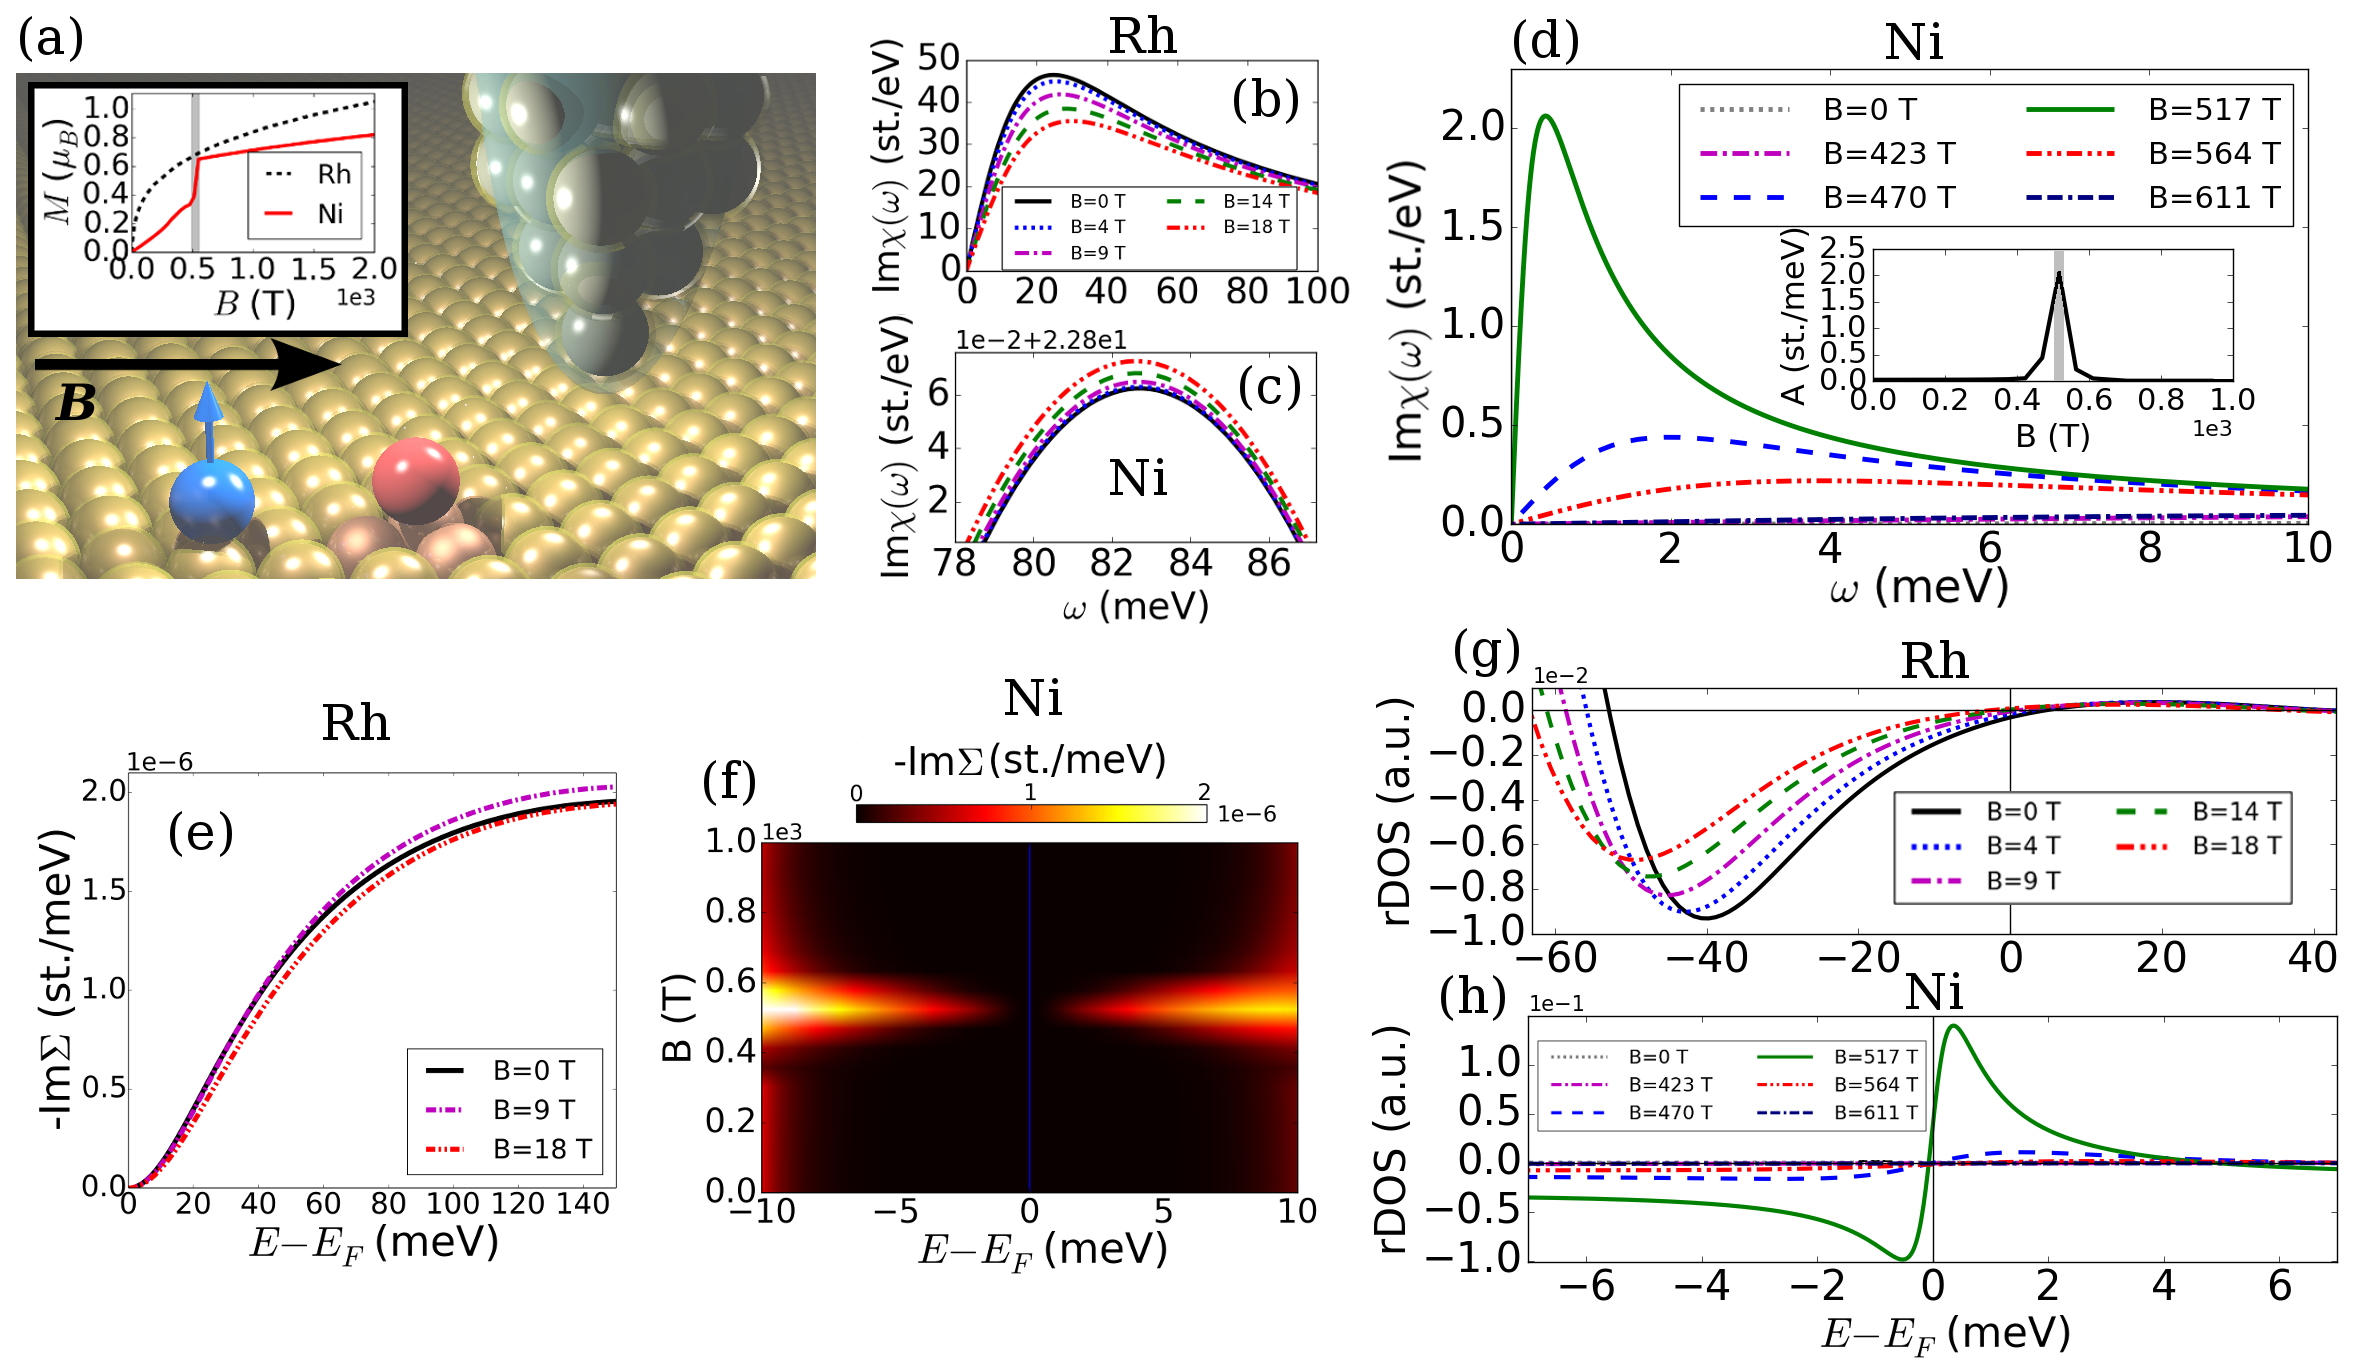
Having exposed the origin of PSE in single-adatoms, we focus next on assessing their potential impact on the signal as measured in ISTS experiments, the technique of choice for measuring magnetic excitations (see, e.g., Refs. Khajetoorians et al., 2011, 2013; Steinbrecher et al., 2016). The corresponding minimal setup is illustrated in Fig. 3(a), which displays a scanning tunneling microscope (STM) tip measuring the adatom’s excitations under an applied external magnetic field, denoted as . We first notice that PSE respond to magnetic fields by shifting their resonance frequency. This is quantitavely demonstrated in Figs. 3(b) and 3(c), where the calculated spin-excitation spectra are shown for Rh and Ni adatoms, respectively, under fields of 10 T that are achieveable in state-of-the-art laboratories (see, e.g., Refs. Khajetoorians et al., 2013; Rau et al., 2014; Donati et al., 2016). Noteworthily, while the PSE of Rh shifts towards larger frequencies as is increased (see Fig. 3(b)), the PSE of Ni exhibits the opposite behavior (see Fig. 3(c)). This difference arises from the fact that magnetic fields induce an effective modification of Stoner product, i.e., , where is a term that depends both on the magnetic field as well as on the adatom’s electronic structure (see Supplemental Material). In particular, the details of the later make for Ni while for Rh, leading to the aforementioned divergent responses in accordance with Eq. (3).
Remarkably, when strong enough magnetic fields are applied to Ni, the modified Stoner criterion can be tuned towards the critical point, as shown in Fig. 3(d). As a consequence, the PSE’s resonance frequency approaches the origin in a singular way while the amplitude of the excitation is enhanced by as much as two orders of magnitude for T. It is interesting to note that this critical behavior is also present on the -field dependence of the induced magnetic moment , as shown in the inset of Fig. 3(a). While Rh shows a continuous dependence, Ni reveals a discontinous transition at approximately the critical field value T, above which the system enters a magnetic regime where the internal exchange field effectively contributes to on top of the external Zeeman field, featuring the atomic version of a quantum phase transition. We note that, although such large fields are clearly out of reach for current experiments, this feature could be potentially observed, e.g., via the proximity effect, by placing a magnetic adatom in the neighborhood of the non-magnetic one (see Fig. 3(a)). Our calculations verify that the former can induce on the later a magnetic moment of the same order of magnitude as the one induced by the fields of Fig. 3(d) foo , thus mimicking the action of large magnetic fields.
Next we evaluate the impact of PSE on the signal of an ISTS measurement. For such purpose we consider the so-called Tersoff-Hamann approximation Tersoff and Hamann (1983); Wortmann et al. (2001), which relates the ISTS spectrum to the electronic DOS at the tip position renormalized by the adatom’s excitations. We access the latter quantity by means of a recently developed technique that combines many body perturbation theory with our TDDFT scheme; details can be found in Ref. Schweflinghaus et al., 2014. The central object within this formalism is the electron self-energy, , which contains the interactions between the tunneling electrons from the tip at bias voltage and the adatom’s PSE. It is particularly revealing to inspect its imaginary part Schweflinghaus et al. (2014),
| (4) |
with the energy-dependent DOS, and the Fermi energy. The calculated is shown in Fig. 3(e) for Rh under various magnetic fields of up to 18 T. Our results reveal a clear step for positive bias voltage that saturates at meV, i.e., after the PSE peak has been integrated (see Eq. (4)). Note also that the calculated self-energy slightly varies as a function of the magnetic field. When larger magnetic fields are applied, as illustrated in Fig. 3(f) for the case of Ni, the critical behavior of the PSE (see Fig. 3(d)) translates into a clear maximum at the value of the critical field, where increases by an order of magnitude.
The presence of PSE has a broad effect on the renormalization of the DOS at the vacuum, where ISTS tips measure the signal. In particular, the energy derivative of the renormalized DOS (rDOS) is a quantity that is linked to the curve measured by ISTS Schweflinghaus et al. (2014). The former quantity is displayed in Fig. 3(g) for Rh, where the magnetic field dependence is clearly visible. Noteworthily, our calculations demonstrate that the tunneling electrons from the tip are able to trigger the PSE, leading to a peak in the meV region that, furthermore, reacts to external magnetic fields by shifting its resonance frequency as well as substantially modifying its intensity. We also note the strong asymmetric distribution between positive and negative frequencies, a feature that emerges from the background electronic structure Schweflinghaus et al. (2014) and is commonly present in curves measured on magnetic adatoms (see, e.g., Refs. Heinrich et al. (2004); Khajetoorians et al. (2011); Holzberger et al. (2013); Khajetoorians et al. (2013); Baumann et al. (2015b)). On the other hand, when Ni is driven into the critical regime as in Fig. 3(h), our calculations reveal a huge change of the signal’s intensity as the PSE approaches the critical point. Our analysis therefore shows that magnetism offers a prime way of manipulating PSE, enabling to discern them from other excitations of similar energy but non-magnetic origin, such as phonons.
In conclusion, we have proposed and argued a means of detecting spin-excitations in non-magnetic single adatoms. We have shown that such excitations can develop well defined peaks in the meV region, their main characteristics being determined by two fundamental electronic properties, namely the Stoner parameter and the DOS at the Fermi level. Our analysis based on TDDFT has further revealed a pronounced dependence of PSE on externally applied magnetic fields, exhibiting the atomic analogue of a quantum phase transition as the field approaches the critical value. This remarkable feature is likely to have strong effects in processes where a substantial magnetic moment is induced in non-magnetic adatoms, e.g., when magnetic atoms are coupled to them via the proximity effect. Finally, we have simulated ab initio the impact of PSE on the curve measured in state-of-the-art ISTS experiments, revealing that PSE can be triggered by tunneling electrons and, furthermore, exhibit a clear response to magnetic fields. Thus, besides opening up potential applications for non-magnetic adatoms, our analysis offers a route for experimentally accessing their fundamental electronic properties, such as the Stoner parameter.
This work has been supported by the Helmholtz Gemeinschaft Deutscher-Young Investigators Group Program No. VH-NG-717 (Functional Nanoscale Structure and Probe Simulation Laboratory), the Impuls und Vernetzungsfonds der Helmholtz-Gemeinschaft Postdoc Programme, and funding from the European Research Council (ERC) under the European Union’s Horizon 2020 research and innovation programme (ERC-consolidator grant 681405 — DYNASORE)
Note added in Proof — In the recent work of Ref. Schendel et al., 2017, the conductance associated to a single Pd adatom deposited on Pd(111) has been experimentally measured and interpreted as being strongly affected by paramagnon scattering.
References
References
- Hirjibehedin et al. (2007) C. F. Hirjibehedin, C.-Y. Lin, A. F. Otte, M. Ternes, C. P. Lutz, B. A. Jones, and A. J. Heinrich, Science 317, 1199 (2007).
- Fernández-Rossier (2009) J. Fernández-Rossier, Phys. Rev. Lett. 102, 256802 (2009).
- Lorente and Gauyacq (2009) N. Lorente and J.-P. Gauyacq, Phys. Rev. Lett. 103, 176601 (2009).
- Lounis et al. (2010) S. Lounis, A. T. Costa, R. B. Muniz, and D. L. Mills, Physical Review Letters 105, 187205 (2010).
- Zhou et al. (2010) L. Zhou, J. Wiebe, S. Lounis, E. Vedmedenko, F. Meier, S. Blügel, P. H. Dederichs, and R. Wiesendanger, Nature Physics 6, 187 (2010).
- Khajetoorians et al. (2011) A. A. Khajetoorians, S. Lounis, B. Chilian, A. T. Costa, L. Zhou, D. L. Mills, J. Wiebe, and R. Wiesendanger, Phys. Rev. Lett. 106, 037205 (2011).
- Khajetoorians et al. (2013) A. A. Khajetoorians, T. Schlenk, B. Schweflinghaus, M. dos Santos Dias, M. Steinbrecher, M. Bouhassoune, S. Lounis, J. Wiebe, and R. Wiesendanger, Phys. Rev. Lett. 111, 157204 (2013).
- Ternes (2015) M. Ternes, New Journal of Physics 17, 063016 (2015).
- Khajetoorians et al. (2016) A. A. Khajetoorians, M. Steinbrecher, M. Ternes, M. Bouhassoune, M. d. S. Dias, S. Lounis, J. Wiebe, and R. Wiesendanger, Nature Communications 7, 10620 (2016).
- Ibañez-Azpiroz et al. (2016) J. Ibañez-Azpiroz, M. dos Santos Dias, S. Blügel, and S. Lounis, Nano Letters 16, 4305 (2016).
- Oberg et al. (2014) J. C. Oberg, M. R. Calvo, F. Delgado, M. Moro-Lagares, D. Serrate, D. Jacob, J. Fernández-Rossier, and C. F. Hirjibehedin, Nature Nanotechnology 9, 64 (2014).
- Yan et al. (2015) S. Yan, D.-J. Choi, B. Jacob A. J., S. Rolf-Pissarczyk, and S. Loth, Nat Nano 10, 40 (2015).
- Stróżecka et al. (2011) A. Stróżecka, A. Eiguren, and J. I. Pascual, Phys. Rev. Lett. 107, 186805 (2011).
- Bryant et al. (2015) B. Bryant, R. Toskovic, A. Ferrón, J. L. Lado, A. Spinelli, J. Fernández-Rossier, and A. F. Otte, Nano Letters 15, 6542 (2015), ISSN 1530-6984.
- Baumann et al. (2015a) S. Baumann, W. Paul, T. Choi, C. P. Lutz, A. Ardavan, and A. J. Heinrich, Science 350, 417 (2015a).
- Delgado and Fernández-Rossier (2017) F. Delgado and J. Fernández-Rossier, Progress in Surface Science 92, 40 (2017).
- Nadj-Perge et al. (2014) S. Nadj-Perge, I. K. Drozdov, J. Li, H. Chen, S. Jeon, J. Seo, A. H. MacDonald, B. A. Bernevig, and A. Yazdani, Science 346, 602 (2014).
- Braunecker and Simon (2013) B. Braunecker and P. Simon, Phys. Rev. Lett. 111, 147202 (2013).
- Vazifeh and Franz (2013) M. M. Vazifeh and M. Franz, Phys. Rev. Lett. 111, 206802 (2013).
- Ternes et al. (2009) M. Ternes, A. J. Heinrich, and W.-D. Schneider, Journal of Physics: Condensed Matter 21, 053001 (2009).
- von Bergmann et al. (2015) K. von Bergmann, M. Ternes, S. Loth, C. P. Lutz, and A. J. Heinrich, Phys. Rev. Lett. 114, 076601 (2015).
- Gambardella et al. (2003) P. Gambardella, S. Rusponi, M. Veronese, S. S. Dhesi, C. Grazioli, A. Dallmeyer, I. Cabria, R. Zeller, P. H. Dederichs, K. Kern, et al., Science 300, 1130 (2003).
- Bryant et al. (2013) B. Bryant, A. Spinelli, J. J. T. Wagenaar, M. Gerrits, and A. F. Otte, Phys. Rev. Lett. 111, 127203 (2013).
- Rau et al. (2014) I. G. Rau, S. Baumann, S. Rusponi, F. Donati, S. Stepanow, L. Gragnaniello, J. Dreiser, C. Piamonteze, F. Nolting, S. Gangopadhyay, et al., Science 344, 988 (2014).
- Donati et al. (2016) F. Donati, S. Rusponi, S. Stepanow, C. Wäckerlin, A. Singha, L. Persichetti, R. Baltic, K. Diller, F. Patthey, E. Fernandes, et al., Science 352, 318 (2016).
- Doniach (1967) S. Doniach, Proceedings of the Physical Society 91, 86 (1967).
- Doubble et al. (2010) R. Doubble, S. M. Hayden, P. Dai, H. A. Mook, J. R. Thompson, and C. D. Frost, Phys. Rev. Lett. 105, 027207 (2010).
- Staunton et al. (2000) J. B. Staunton, J. Poulter, B. Ginatempo, E. Bruno, and D. D. Johnson, Physical Review B 62, 1075 (2000).
- Lonzarich and Taillefer (1985) G. G. Lonzarich and L. Taillefer, Journal of Physics C: Solid State Physics 18, 4339 (1985).
- Aguayo et al. (2004) A. Aguayo, I. I. Mazin, and D. J. Singh, Physical Review Letters 92, 147201 (2004).
- Vosko et al. (1980) S. H. Vosko, L. Wilk, and M. Nusair, Canadian Journal of Physics 58, 1200 (1980).
- Papanikolaou et al. (2002) N. Papanikolaou, R. Zeller, and P. H. Dederichs, Journal of Physics: Condensed Matter 14, 2799 (2002).
- Lounis et al. (2011) S. Lounis, A. T. Costa, R. B. Muniz, and D. L. Mills, Physical Review B 83, 035109 (2011).
- Giannozzi et al. (2009) P. Giannozzi, S. Baroni, N. Bonini, M. Calandra, R. Car, C. Cavazzoni, Davide Ceresoli, G. L. Chiarotti, M. Cococcioni, I. Dabo, et al., Journal of Physics: Condensed Matter 21, 395502 (2009).
- Janak (1977) J. F. Janak, Physical Review B 16 (1977).
- Lazarovits et al. (2002) B. Lazarovits, L. Szunyogh, and P. Weinberger, Phys. Rev. B 65, 104441 (2002).
- Beckmann and Bergmann (1997) H. Beckmann and G. Bergmann, Physical Review B 55, 14350 (1997).
- Wildberger et al. (1995) K. Wildberger, P. Lang, R. Zeller, and P. H. Dederichs, Phys. Rev. B 52, 11502 (1995).
- dos Santos Dias et al. (2015) M. dos Santos Dias, B. Schweflinghaus, S. Blügel, and S. Lounis, Phys. Rev. B 91, 075405 (2015).
- (40) For externally applied T the magnetic moment of Ni is , while a Fe adatom placed as a second nearest neighbor induces a magnetic moment on Ni of .
- Steinbrecher et al. (2016) M. Steinbrecher, A. Sonntag, M. d. S. Dias, M. Bouhassoune, S. Lounis, J. Wiebe, R. Wiesendanger, and A. A. Khajetoorians, Nature Communications 7, 10454 (2016).
- Tersoff and Hamann (1983) J. Tersoff and D. R. Hamann, Phys. Rev. Lett. 50, 1998 (1983).
- Wortmann et al. (2001) D. Wortmann, S. Heinze, P. Kurz, G. Bihlmayer, and S. Blügel, Phys. Rev. Lett. 86, 4132 (2001).
- Schweflinghaus et al. (2014) B. Schweflinghaus, M. dos Santos Dias, A. T. Costa, and S. Lounis, Phys. Rev. B 89, 235439 (2014).
- Heinrich et al. (2004) A. J. Heinrich, J. A. Gupta, C. P. Lutz, and D. M. Eigler, Science 306, 466 (2004).
- Holzberger et al. (2013) S. Holzberger, T. Schuh, S. Blügel, S. Lounis, and W. Wulfhekel, Phys. Rev. Lett. 110, 157206 (2013).
- Baumann et al. (2015b) S. Baumann, F. Donati, S. Stepanow, S. Rusponi, W. Paul, S. Gangopadhyay, I. G. Rau, G. E. Pacchioni, L. Gragnaniello, M. Pivetta, et al., Phys. Rev. Lett. 115, 237202 (2015b).
- Schendel et al. (2017) V. Schendel, C. Barreteau, M. Brandbyge, B. Borca, I. Pentegov, U. Schlickum, M. Ternes, P. Wahl, and K. Kern, arXiv:1702.02407 [cond-mat] (2017), arXiv: 1702.02407, URL http://arxiv.org/abs/1702.02407.